

Abstract

Solvent effects on the UV–vis spectra of 3-hydroxyflavone and other structurally related molecules (3-hydroxychromen-4-one, 3-hydroxy-4-pyrone, and 4-pyrone) have been studied by combining time-dependent density functional theory (TDDFT) and the polarizable continuum method (PCM). Among the first five excited states of the four considered molecules, electronic states of n → π* and π → π* nature appear. In general, the stability of the n → π* states decreases as the π space becomes larger in such a way that only for 4-pyrone and 3-hydroxy-4-pyrone are they the first excited states. In addition, they become less stabilized in ethanol solution than the ground state, and this causes blueshift transitions in solution. The opposite trend is found for the π → π* excited states. They are less energetic with the π-system size and when passing from gas phase to solution. The solvent shift also depends strongly on the size of the π systems and on the formation of an intramolecular hydrogen bond; thus, it decreases when going from 4-pyrone to 3-hydroxyflavone. The performance of the three versions (cLR, cLR2, and IBSF) of the specific-state PCM method in predicting transition energies are compared.
Introduction
3-Hydroxyflavone (3-HF) is the base structure of a group of flavonoids called flavonols.1 These compounds display important photophysical and photochemical properties as most of them can undergo excited-state intramolecular proton transfer (ESIPT2−9) and, depending on the environment, they can produce one or two fluorescent signals; that is, they can exhibit dual fluorescence.10 The process is as follows: in the ground state, the most stable conformer, usually named N, displays an intramolecular hydrogen bond (IHB) between the 3-hydroxyl group and the carbonyl oxygen. After excitation of the molecule to the first excited state, N*, proton transfer can occur between the 3-hydroxyl group and the carbonyl oxygen, forming the tautomer form T*. From here, the molecule can return to the ground state, emitting radiation of lower frequency than the exciting radiation. Because of the different chemical nature of the absorption and emission structures, the Stokes shift is very large, and because of this, the use of flavonols has been proposed as frequency shifters.11 Depending on the temperature and environment, the molecule can also de-excite from the N* form. In fact, in protic solvents, this is the only observed signal. Thus, the emission spectrum of 3-HF can display either a single signal from the excited tautomer or the normal form or two widely separated signals from both isomers. An adequate selection of the external conditions (solvent and/or temperature) permits to fit the intensity and frequency of the two emission signals, achieving white light emission from a single molecule. From this perspective, these molecules have been also used in the design of OLEDs and WOLEDs and as fluorescence probes with many chemical applications.9,11−14 The interest that flavonoids and flavonols arouse in the scientific community is also well known due to their biological and pharmacological roles in the treatment of many human diseases. Evidence suggests that these compounds exhibit anticancer, cardioprotective, anti-inflammatory, and antioxidant activity.15−20
The interesting photochemical properties of flavonols can be tuned in several ways: (1) by modifying the skeleton structure of the molecule, (2) by introducing electron donor or acceptor groups, and (3) by changing the polarity of the solvent. In this work, the absorption spectra of 3-HF and a few related molecules such as 3-hydroxychromen-4-one (3-HC), 3-hydroxy-4-pyrone, and 4-pyrone are studied (Figure 1). Our main goal is to determine how the three abovementioned factors affect the nature and position of the spectral bands. Experiments have shown that the solvent effects on the absorption spectra vary greatly between the studied molecules. Thus, while they are almost negligible in 3-HF, in 4-pyrone, these effects are very large. These results are, at first sight, striking since the chromophore, the carbonyl group, is the same in the four molecules. Along this paper, we will attempt to elucidate the interplay existing between molecular structure and solvation. At the same time, we will make a comparison of different methods proposed to study the solvents’ effects. More specifically, two specific-state PCM methods will be compared: the corrected linear response method (cLR)21 and the Improta, Barone, Schalmani, and Frisch method (IBSF).22,23 We also include in our study a recent extension of the cLR method that includes an estimation of the solute–solvent dispersion component. This new method24 is known as cLR2, and it would help clarify the role of the different solute–solvent interaction energy components (electrostatic, polarization, and dispersion) in the photophysics of flavonols.
Figure 1.

Structures of (a) 4-pyrone, (b) 3-hydroxy-4-pyrone, (c) 3-hydroxychromen-4-one (3-HC), and (d) 3-hydroxyflavone (3-HF).
The UV–vis absorption spectra of the four studied molecules are characterized by the presence of several maxima. In the literature, 3-HF is the molecule that has received most attention and is considered the backbone for the flavonol family. The UV–vis spectrum of this molecule25 shows a broad band in non-polar solvents with peaks at 3.49, 3.65, and 4.08 eV. In alcohols, this band does not change significantly. A low intensity band associated with its anionic form appears at longer wavelengths. From a theoretical point of view, the UV–vis spectrum and the ESIPT of 3-HF26−28 and 3-HF-based chromophores29−41 have been studied both in gas phase and in solution. Most of these studies have used TDDFT, although MNDO/AM1,41,42 CIS,28 and CASPT2/CASSCF28 methods have also been applied. Solvent effects have generally been included using the polarizable continuum method (PCM). The use of a polarizable continuum model in the study of these systems can be criticized since this model neglects the microscopic structure of the solvent around the solute and does not consider the possible presence of intermolecular hydrogen bonds between the carbonyl and hydroxyl groups in the solute and the water molecules of the solvent. In a recent work43 where the transition energies provided by continuum models and QM/MM methods that use the mean field approximation (ASEP/MD) were compared, it was found that in 3-HF, the differences between the results provided by the two methods are smaller than 0.03 eV. Previous (unpublished) calculations for the 4-pyrone molecule obtain similar results. Since the computational cost of the ASEP/MD method is higher, in this article, we will only use PCM.
The rest of the paper is organized as follows. The Computational Methods and Details section describes the computational methods used in this work, paying special attention to the description of the solvation theories. The Results and Discussion section describes the changes introduced by the solvent in the geometry, charge distribution, and spectroscopy of the four molecules included in the study. The Conclusions section presents the main conclusions and aims to relate the changes in solvation with the structural changes.
Computational Methods and Details
The ground-state geometries both in gas phase and in an ethanol solution of the four studied molecules were optimized using the density functional theory (DFT)44−46 Transition energies to the excited states were obtained with the time-dependent density functional theory (TDDFT).47 Three functionals (B3LYP,48 PBE0,49 and CAM-B3LYP50) and two basis sets (6–31 + G* and 6–311 + G**, from now on B1 and B2, respectively) were used. Solvent effects were calculated using PCM,51,52 and quantum calculations were performed with the Gaussian09 program package.53
The study of the solvent influence on the electronic spectrum of the molecules in solution using PCM and TDDFT methods can be carried out according to two schemes known as linear response (LR54,55) and specific-state response (SS56,57). To understand the difference between these two alternatives, it is important to note that the solvent degrees of freedom respond with different speeds to sudden changes in the electron density of the solute. During a vertical transition, where the change in the electron density of the solute is very fast, only the electronic polarization of the solvent is able to respond to this change. This solvent response is known as the dynamic or non-inertial response. Conversely, the slower degrees of freedom (related to the movement of the molecular nuclei) do not have time to change and remain ″frozen″ (Franck–Condon principle), that is, they remain in equilibrium with the electron density of the initial electronic state (the ground state if we are treating an absorption process or the excited state if we study an emission). The slow response is known as the static or inertial component of the solvent.
Both methods, LR and SS, assume that the inertial response of the solvent is frozen, that is, the excitation energies of the solute are calculated in the presence of a solvent that is in equilibrium with the ground-state reaction field. The main difference between them is that, while in LR, the solvent responds in addition to the transition dipole moment (response classified as dispersion contribution), in the SS method, the non-inertial component attempts to equilibrate the actual solute charge distribution, that is, it responds to the dipole difference between the ground and excited states. Within the SS scheme, there are several possibilities depending on whether the solvent polarization and the new electron density of the solute reach mutual equilibrium or not. In this way, we have the cLR (corrected linear response)21 and the IBSF methods (Improta, Barone, Schalmani, and Frisch22,23). The main difference between them is that IBSF is self-consistent, while cLR considers only the first cycle of solvent polarization. Details on both methods can be found in the literature. Throughout this work, the results provided by both cLR and IBSF approaches are compared. We also include in our study the recently proposed cLR224 method that permits us to estimate the dispersion component contribution of the solute–solvent interaction energy to the solvent shift by combining data from the LR, SS, and “fully frozen” solvent models.
Results and Discussion
We will begin the study by analyzing in some detail the description of the thermodynamic and spectroscopic structural properties of 4-pyrone, and then we will move on to the study of increasingly complex molecules to determine the relation between structure and solvation. The most significant geometric parameters of the four studied molecules, both in gas phase and in ethanol solution for the different functionals and basis sets, are collected in Tables S1–S4 of the Supplementary Material.
4-Pyrone
The 4-pyrone structure can be seen in Figure 1a. This is the simplest of the molecules considered and given that it lacks the hydroxyl group, formation of the IHB is not possible as it is with the rest of the studied molecules. However, it conserves the carbonyl group, which is the chromophore responsible for the main spectroscopic characteristics of this kind of molecules. The most important solvent effects on the geometry are concentrated precisely in this group. The C=O bond length increases by 0.01–0.02 Å from the gas phase to the ethanol solution. This behavior is consistent with the polar nature of the alcoholic solution and with the carbonyl group features. This group can be represented as a combination of two resonant forms, one being neutral, where the carbonyl group displays a double bond, and the other being zwitterionic, where it has a single bond character. Polar solvents tend to favor the latter, and the bond length increases consequently. As we will see later, this trend is shared by the four studied systems.
Table 1 shows the calculated transition energies for the first five excited states of 4-pyrone. The first point to note is that in the phase, there is hardly any difference between the results found with the split-valence double-zeta (B1) and the triple-zeta basis set (B2). The transitions to the two first excited states, S1 and S2, have an n → π* nature and they are well separated from each other; according to their oscillator strength values these two transitions are forbidden. The third and fourth excited states have a π → π* character and they are almost degenerated. The energy difference between them is about 0.1 eV, and S4 is the one displaying the largest oscillator strength. Finally, S5 also has a π → π* nature. As for the behavior of the different functionals, B3LYP and PBE0 provide very similar transition energies, while CAM-B3LYP provides energies that are about 0.1–0.3 eV larger. Figure 2 displays the molecular orbitals involved in the transition to S1 and S4 in gas phase.
Table 1. Transition Energies and Oscillator Strength (in Parentheses) for the First Five Excited States of 4-Pyrone in Gas Phase and in Ethanol Solutiona.
| ΔE (eV) |
||||||
|---|---|---|---|---|---|---|
| transition | CAM-B3LYP/B1 | CAM-B3LYP/B2 | PBE0/B1 | PBE0/B2 | B3LYP/B1 | B3LYP/B2 |
| gas phase | ||||||
| S0 → S1 | 4.23 (.00) | 4.19 (.00) | 4.02 (.00) | 3.99 (.00) | 3.96 (.00) | 3.92 (.00) |
| S0 → S2 | 5.59 (.00) | 5.60 (.00) | 5.06 (.00) | 5.02 (.00) | 4.85 (.00) | 4.81 (.00) |
| S0 → S3 | 5.81 (.02) | 5.77 (.02) | 5.62 (.02) | 5.58 (.02) | 5.48 (.02) | 5.44 (.02) |
| S0 → S4 | 5.87 (.25) | 5.84 (.25) | 5.72 (.19) | 5.69 (.19) | 5.61 (.17) | 5.57 (.17) |
| S0 → S5 | 6.72 (.12) | 6.69 (.13) | 6.51 (.06) | 6.49 (.09) | 6.16 (.01) | 6.17 (.01) |
| PCM/cLR | ||||||
| S0 → S1 | 4.40 (.00) | 4.40 (.00) | 4.18 (.00) | 4.18 (.00) | 4.07 (.00) | 4.07 (.00) |
| S0 → S2 | 5.80 (.33) | 5.82 (.33) | 5.27 (.00) | 5.26 (.00) | 5.07 (.00) | 5.06 (.00) |
| S0 → S3 | 5.90 (.01) | 5.88 (.00) | 5.67 (.26) | 5.68 (.26) | 5.51 (.24) | 5.52 (.24) |
| S0 → S4 | 5.91 (.00) | 5.90 (.01) | 5.70 (.03) | 5.71 (.02) | 5.55 (.03) | 5.55 (.03) |
| S0 → S5 | 6.54 (.18) | 6.56 (.18) | 6.33 (.15) | 6.35 (.16) | 6.14 (.14) | 6.16 (.15) |
| PCM/cLR2 | ||||||
| S0 → S1 | 4.40 | 4.39 | 4.18 | 4.17 | 4.07 | 4.07 |
| S0 → S2 | 5.62 | 5.64 | 5.27 | 5.26 | 5.07 | 5.06 |
| S0 → S3 | 5.85 | 5.86 | 5.51 | 5.52 | 5.36 | 5.37 |
| S0 → S4 | 5.91 | 5.88 | 5.66 | 5.66 | 5.51 | 5.51 |
| S0 → S5 | 6.44 | 6.45 | 6.24 | 6.24 | 6.05 | 6.06 |
| PCM/IBSF | ||||||
| S0 → S1 | 4.66 (.00) | 4.62 (.00) | 4.43 (.00) | 4.39 (.00) | 4.37 (.00) | 4.33 (.00) |
| S0 → S2 | 5.78 (.25) | 5.75 (.25) | 5.59 (.00) | 5.55 (.00) | 5.41 (.00) | 5.36 (.00) |
| S0 → S3 | 6.02 (.01) | 5.98 (.01) | 5.68 (.19) | 5.64 (.19) | 5.57 (.18) | 5.53 (.18) |
| S0 → S4 | 6.21 (.00) | 6.16 (.00) | 5.68 (.19) | 5.65 (.18) | 5.59 (.13) | 5.57 (.12) |
| S0 → S5 | 6.40 (.15) | 6.37 (.15) | 6.20 (.13) | 6.16 (.13) | 6.06 (.12) | 6.03 (.13) |
Figure 2.

Molecular orbitals involved in the transition to S1 and S4 in the phase for 4-pyrone.
In ethanol solution, the nature and topology of the first five excited states calculated with B3LYP and PBE0 do not change independently of the solvation method (cLR, cLR2 or IBSF), that is, the first two excited states remain in an n → π* nature, while the last three are of a π → π* type. However, states S3 and S4 exchange their positions, and now, S3 is the state with the highest transition probability. This state has an oscillator strength of around 0.25. With CAM-B3LYP, there is a destabilization of the second n → π* state, which can become the third or fourth root depending on the basis set and solvation method.
Regarding the solvent shift in ethanol, the general trend is an increase in the transition energies of the n → π* states compared to the gas phase values. Thus, for example, for B3LYP/B2 and cLR, the maxima move from 3.92 and 4.81 eV to 4.07 and 5.06 eV for S1 and S2, respectively. This means a hypsochromic or blueshift of 3.4 and 5.7 kcal/mol. In contrast, the π → π* states register a slight bathochromic shift. Thus, the transition energy of the most probable transition (S4 in gas phase and S3 in solution) decreases from 5.57 to 5.52 eV and S5 decreases from 6.17 to 6.16 eV (solvent shift of −0.25 to −1.1 kcal/mol). IBSF provides the largest transition energies, mainly in n → π* transitions, where the solvent shifts are close to 10 kcal/mol. These results are consistent with the calculated dipole moment values (See Table S5 in the Supplementary Material). cLR2 results are similar to those found with cLR for n → π* transitions but are 0.1–0.2 eV lower in π → π* transitions. This behavior was expected as the dispersion component provides the response of the solvent to the transition dipole moment, and this is zero (forbidden transition) in the n → π* transitions. When different from zero, the dispersion contribution is always associated with a redshift. In sum, electrostatic solvent effects are important on n → π* but almost negligible for π → π* transitions; conversely, the dispersion component is important in π → π* but not in n → π* transitions. In addition, the ISBF method provides the largest solvent effects. With this method, PBE0 and B3LYP display similar behavior, although the CAM-B3LYP functional behaves differently; thus, the first two excited states are n → π* and π → π*, the latter being the bright state with an oscillator strength of 0.25. S3 and S5 states are of a π → π* nature, and S4 is n → π*. As for the solvent shift, the trend is similar to that found with PBE0 and B3LYP: n → π* states show a hypsochromic shift, while the π → π* ones experience a slight bathochromic shift.
Regarding the comparison with the experimental data, the transition energies calculated with PBE0 and B3LYP are in good agreement with the literature. Ishibe et al.58 find in methylcyclohexane a low-intensity band (assigned to a n → π* transition) with several peaks. The maxima are identified at 3.95, 4.08, and 4.22 eV. In more recent work, Seixas de Melo et al.59 located in cyclohexane a very weak band whose maximum is around 4.11 eV. At lower wavelengths, a very intense band is located around 5.1559 or 5.21 eV.58 Our in-gas phase calculations predict that the first of the n → π* states appears between 3.92 and 4.23 eV (depending on the functional), in very good agreement with the experiment. Regarding the most intense band, our calculations place the π → π* state with the highest oscillator strength (S4) at around 5.5–5.9 eV. B3LYP and PBE0 produce a slight overestimation in the position of this band, which increases to 0.7 eV with CAM-B3LYP. In view of the results found, we can conclude that B3LYP and PBE0 are the functionals that best suit the experimental data.
In polar solvents, the experimental spectrum shows a hypsochromic shift of the n → π* band toward lower wavelengths, producing a widening of the band and a greater difficulty in locating the maxima. Ishibe et al.58 place these maxima at around 4.29, 4.75, and 4.87 eV. In contrast, a bathochromic shift is found for the π → π* band, which is now located at 5.02 eV compared to 5.15 eV found in cyclohexane. These bands move in opposite directions, and the result is that they slightly overlap, with a shoulder appearing in the area of high wavelengths corresponding to the π → π* band. Our calculations reproduce this trend: n → π* states move to lower wavelengths (higher transition energies), while the bright-state π → π* shows a bathochromic shift. However, the position of the most intense band is overestimated by approximately 0.5 eV (5.52 eV at the B3LYP/B2 level of calculation vs 5.02 eV).
3-Hydroxy-4-Pyrone
The main structural characteristic of this molecule, which determines its photophysical and photochemical behavior, is the formation of an IHB (See Figure 1b). Solvent effects on the molecular structure are small. The carbonyl bond length increases by 0.01 Å when going from the gas phase to the ethanol solution. The O–H bond distance, however, remains practically constant at any level of calculation. The distance between the carboxylic oxygen and the hydrogen of the hydroxyl group slightly increases by 0.02–0.03 Å in presence of ethanol. These changes are compatible with a decrease of IHB strength in solution.
Table 2 shows the calculated transition energies of 3-hydroxy-4-pyrone. S1 continues to be a n → π* transition. However, the second n → π* state is destabilized (PBE0 and B3LYP) or it does not even appear (CAM-B3LYP) among the first five excited states. The transitions to S2 and S3 are of a π → π* nature at any level of calculation. As for the transition to S4 and S5, their character (n → π* or π → π*) depends on the level of calculation and environment. Thus, the transition to S4 is n → π* in gas phase and when the solvent is described with cLR and π → π* with cLR2 and ISBF. The formation of the IHB destabilized the n → π* transition that now appears at larger energies than in 4-pyrone. π → π* are, however, hardly affected.
Table 2. Transition Energies and Oscillator Strength (in Parentheses) for the First Five Excited States of 3-Hydroxy-4-pyrone in Gas Phase and in Ethanol Solutiona.
| ΔE (eV) |
||||||
|---|---|---|---|---|---|---|
| transition | CAM-B3LYP/B1 | CAM-B3LYP/B2 | PBE0/B1 | PBE0/B2 | B3LYP/B1 | B3LYP/B2 |
| gas phase | ||||||
| S0 → S1 | 4.63 (.00) | 4.63 (.00) | 4.45 (.00) | 4.45 (.00) | 4.31 (.00) | 4.31 (.00) |
| S0 → S2 | 5.11 (.16) | 5.13 (.16) | 4.88 (.12) | 4.90 (.12) | 4.74 (.11) | 4.75 (.11) |
| S0 → S3 | 5.69 (.01) | 5.69 (.01) | 5.55 (.02) | 5.55 (.02) | 5.40 (.02) | 5.40 (.02) |
| S0 → S4 | 6.34 (.01) | 6.38 (.28) | 5.91 (.00) | 5.89 (.00) | 5.66 (.00) | 5.64 (.00) |
| S0 → S5 | 6.37 (.29) | 6.39 (.01) | 6.17 (.24) | 6.18 (.24) | 5.98 (.22) | 5.99 (.21) |
| PCM/cLR | ||||||
| S0 → S1 | 4.73 (.00) | 4.73 (.00) | 4.54 (.00) | 4.53 (.00) | 4.40 (.00) | 4.40 (.00) |
| S0 → S2 | 5.11 (.21) | 5.12 (.21) | 4.90 (.17) | 4.91 (.17) | 4.76 (.16) | 4.77 (.16) |
| S0 → S3 | 5.72 (.00) | 5.72 (.00) | 5.58 (.01) | 5.58 (.01) | 5.44 (.00) | 5.44 (.01) |
| S0 → S4 | 6.26 (.00) | 6.31 (.00) | 6.04 (.00) | 6.04 (.00) | 5.84 (.00) | 5.76 (.00) |
| S0 → S5 | 6.30 (.36) | 6.33 (.36) | 6.10 (.33) | 6.08 (.33) | 5.85 (.31) | 5.92 (.30) |
| PCM/cLR2 | ||||||
| S0 → S1 | 4.72 | 4.69 | 4.51 | 4.48 | 4.45 | 4.41 |
| S0 → S2 | 4.97 | 4.94 | 4.81 | 4.79 | 4.71 | 4.68 |
| S0 → S3 | 5.67 | 5.63 | 5.57 | 5.53 | 5.45 | 5.42 |
| S0 → S4 | 6.14 | 6.13 | 5.95 | 5.89 | 5.77 | 5.63 |
| S0 → S5 | 6.23 | 6.27 | 6.04 | 6.02 | 5.88 | 5.93 |
| PCM/IBSF | ||||||
| S0 → S1 | 4.90 (.00) | 4.88 (.00) | 4.70 (.00) | 4.69 (.00) | 4.56 (.00) | 4.55 (.00) |
| S0 → S2 | 5.11 (.16) | 5.12 (.16) | 4.92 (.13) | 4.92 (.13) | 4.77 (.12) | 4.78 (.12) |
| S0 → S3 | 5.77 (.00) | 5.77 (.00) | 5.63 (.01) | 5.63 (.01) | 5.49 (.01) | 5.49 (.01) |
| S0 → S4 | 5.98 (.00) | 6.06 (.00) | 6.10 (.25) | 6.09 (.25) | 5.90 (.23) | 5.90 (.23) |
| S0 → S5 | 6.32 (.28) | 6.33 (.28) | 6.21 (.00) | 6.19 (.00) | 5.97 (.00) | 5.95 (.00) |
As before, n → π* states exhibit a hypsochromic or blueshift in ethanol solution. Thus, at B3LYP/B2 level states, S1 and S4 increase their transition energies to around 2.1 and 2.8 kcal/mol, respectively. Note that this value is about half of the value obtained in 4-pyrone. The electronic transitions for the states S2, S3, and S5 display lower solvent shifts. Thus, only changes of 0.4–0.9 kcal/mol are registered for S2 and S3. With ISBF, an even more significant shift toward higher energies is observed for the n → π* state, this fact implying that the second n → π* state now appears as S5 (S4 at the cLR level). The solvent shifts at the B3LYP/B2 level for the two n → π* transitions with ISBF are 5.76 and 7.15 kcal/mol. These values are also clearly lower than those obtained for 4-pyrone. The dipole moments of the different states are lower in 3-hydroxy-4-pyrone than in 4-pyrone, as is the variation of the dipole moment during the transition, which explains the smaller solvent shift values in this case (See Tables S5 and S6 in the Supporting Material). As for the dispersion component, it contributes at most 0.1 eV to the solvent shift.
Experimental data60,61 place the ultraviolet absorption band around 4.6 eV. Since the n → π* states present very low intensities, the experimental band should correspond to some of the π → π* states. In our case, the transition to S2 is in good agreement with the experiment. With B3LYP and PBE0, this band appears around 4.7–4.9 and 5.1 eV with CAM-B3LYP. See Figure 3 for a representation of the molecular orbitals involved in this transition.
Figure 3.

Molecular orbitals involved in the electronic transition to S2 in gas phase for 3-hydroxy-4-pyrone.
3-Hydroxychromen-4-one
The next molecule, 3-HC, has a more extended π system than 3-hydroxy-4-pyrone (see Figure 1c). The presence of a fused aromatic ring gives this molecule quite a rigid structure. Only the hydroxyl group exhibits rotational freedom even though it is limited by the formation of an IHB with the carboxylic oxygen. This is a sensitive area as in proton donor or acceptor solvents, the IHB can be replaced by an intermolecular HB. We will return on this point later when studying the 3-HF system. The analysis of the solvent influence on the geometry points out very small changes in the structure. Thus, an increase of only 0.01 Å in the C=O bond length and of 0.01–0.02 Å in the IHB length can be noted.
Table 3 shows the calculated transition energies in gas phase and in ethanol solution for the first five excited states of 3-HC. The first point to note is that in gas phase, the S1 and S2 excited states are practically degenerate mainly at the CAM-B3LYP level. With this functional, the first excited state corresponds to an n → π* transition. States S4 and S5 are also very close in energy with a difference of around 0.2 eV. As found in previous molecules, transition energies calculated with CAM-B3LYP are higher than PBE0 values and these, in turn, are higher than those obtained with B3LYP. In addition, there is only a single n → π* state among the first five excited states, appearing as S1 or S2 depending on the functional.
Table 3. Transition Energies and Oscillator Strength (in Parentheses) for the First Five Excited States of 3-Hydroxychromen-4-one, 3-HC, in Gas Phase and in Ethanol Solutiona.
| ΔE (eV) |
||||||
|---|---|---|---|---|---|---|
| transition | CAM-B3LYP/B1 | CAM-B3LYP/B2 | PBE0/B1 | PBE0/B2 | B3LYP/B1 | B3LYP/B2 |
| gas phase | ||||||
| S0 → S1 | 4.42 (.00) | 4.43 (.00) | 4.11 (.10) | 4.11 (.10) | 3.98 (.09) | 3.98 (.09) |
| S0 → S2 | 4.43 (.14) | 4.44 (.13) | 4.20 (.00) | 4.20 (.00) | 4.08 (.00) | 4.08 (.00) |
| S0 → S3 | 5.03 (.02) | 5.03 (.02) | 4.83 (.01) | 4.83 (.01) | 4.69 (.01) | 4.69 (.01) |
| S0 → S4 | 5.57 (.01) | 5.58 (.01) | 5.19 (.02) | 5.20 (.02) | 4.98 (.01) | 4.99 (.01) |
| S0 → S5 | 5.78 (.58) | 5.79 (.57) | 5.34 (.32) | 5.34 (.32) | 5.16 (.29) | 5.16 (.29) |
| PCM/cLR | ||||||
| S0 → S1 | 4.41 (.18) | 4.42 (.18) | 4.11 (.14) | 4.11 (.14) | 3.98 (.13) | 3.99 (.12) |
| S0 → S2 | 4.49 (.00) | 4.50 (.00) | 4.26 (.00) | 4.26 (.00) | 4.14 (.00) | 4.14 (.00) |
| S0 → S3 | 4.98 (.05) | 4.98 (.05) | 4.80 (.05) | 4.80 (.05) | 4.65 (.06) | 4.66 (.05) |
| S0 → S4 | 5.50 (.10) | 5.51 (.10) | 5.12 (.01) | 5.13 (.00) | 4.91 (.01) | 4.92 (.01) |
| S0 → S5 | 5.82 (.69) | 5.82 (.69) | 5.37 (.54) | 5.36 (.53) | 5.18 (.48) | 5.18 (.48) |
| PCM/cLR2 | ||||||
| S0 → S1 | 4.30 | 4.27 | 4.05 | 4.02 | 3.94 | 3.92 |
| S0 → S2 | 4.49 | 4.46 | 4.25 | 4.22 | 4.19 | 4.15 |
| S0 → S3 | 4.93 | 4.90 | 4.78 | 4.75 | 4.67 | 4.64 |
| S0 → S4 | 5.40 | 5.36 | 5.10 | 5.07 | 4.94 | 4.91 |
| S0 → S5 | 5.67 | 5.64 | 5.25 | 5.22 | 5.10 | 5.07 |
| PCM/IBSF | ||||||
| S0 → S1 | 4.40 (.14) | 4.41 (.14) | 4.11 (.11) | 4.11 (.10) | 3.98 (.10) | 3.99 (.09) |
| S0 → S2 | 4.61 (.00) | 4.61 (.00) | 4.38 (.00) | 4.37 (.00) | 4.27 (.00) | 4.26 (.00) |
| S0 → S3 | 4.93 (.04) | 4.94 (.04) | 4.77 (.03) | 4.77 (.03) | 4.61 (.03) | 4.62 (.03) |
| S0 → S4 | 5.44 (.06) | 5.45 (.06) | 5.07 (.01) | 5.08 (.01) | 4.86 (.01) | 4.88 (.01) |
| S0 → S5 | 5.87 (.59) | 5.86 (.58) | 5.38 (.32) | 5.37 (.32) | 5.20 (.29) | 5.19 (.29) |
The main effect of the increase in size of the π system (as we pass from 4-pyrone toward 3-HC) is the destabilization of the n → π* states with respect to π → π*. Our calculations predict the appearance of two bands of different intensities in the absorption spectrum, the band that appears at lower wavelengths being the most intense. See Figure 4 for a representation of the molecular orbitals involved in this transition. CAM-B3LYP places these bands at 4.43 and 5.78 eV, values somewhat higher than those calculated with B3LYP and PBE0: 4.0–4.1 and 5.2–5.3 eV, respectively.
Figure 4.

Molecular orbitals involved in the transition to the bright π → π* state (S5) in gas phase for 3-hydroxychromen-4-one.
Regarding the position of the absorption bands in solution, a very small variation is observed with respect to that calculated in gas phase. Thus, at the PBE0/B1 level, the n → π * state shows a slight hypsochromic shift, increasing the transition energy from 4.20 to 4.26 eV in ethanol. The solvent shift is about 1.4 kcal/mol, this value being a quarter of that calculated for 4-pyrone. The transition energy variations for π → π* states are even lower. This fact is in good agreement with the experimental data. Chevalier et al.62 have recorded the spectrum of 3-HC in methylcyclohexane, acetonitrile, and ethanol, and two bands of different intensities can be observed in all the three solvents: one of low intensity whose maximum appears at 3.96 eV and another more intense with a maximum at 5.34 eV. A slight shift of 5 nm toward lower energies in the lower intensity band was observed when the spectrum was recorded in ethanol (from 3.96 to 3.90 eV). Our results show very good agreement with the experimental data since S1 and S5 states present transition energies of 4.11 and 5.34 eV in gas phase and 4.11 and 5.37 in ethanol at the PBE0/B1 level. As has been previously noted, B3LYP and PBE0 provide somewhat lower values than CAM-B3LYP. Note, finally, that the gap between the two first excited states increases when passing from the gas phase to the ethanol solution. The IBSF method produces a more pronounced hypsochromic shift for states n → π* than cLR. While S3 and S4 experience a slight bathochromic shift, S5 is shifted toward higher energies. Again, according to our results, functionals B3LYP and PBE0 are most suitable for the description of the absorption spectrum of 3-HC in solution.
3-Hydroxyflavone
Figure 1d shows the structure of 3-HF. As for 3-HC, the presence of a fused aromatic ring gives 3-HF a very rigid structure. Even though the new phenyl group introduced in the structure could present, in principle, total rotational freedom, it is limited by its preference to adopt a flat arrangement in order to increase conjugation with the chromone moiety. Because of its rigid structure, the interaction of 3-HF with the solvent causes only minor variations in bond lengths. The greatest solvent effects on the geometry are observed in the C=C and C=O double bonds (which increased by about 0.01 Å) and in the atoms involved in the IHB (which increased by about 0.1–0.2 Å). Due to its polar character, ethanol produces a shielding of the charge displayed by the carbonyl and hydroxyl groups, which causes a weakening of the IHB. This fact is evidenced by the increase in the distance between the carboxylic oxygen and the hydroxylic hydrogen and in the slight decrease of the O---H–O bond angle.
In proton donor and acceptor solvents, a second structure has been proposed in which an intermolecular HB replaces the IHB. Our calculations show that this structure is less stable by about 3 kcal/mol than the structure displayed in Figure 1d. Consequently, this open structure is not expected to participate actively in the spectroscopy of these molecules.
Table 4 shows the energies for the first five transitions of 3-HF in gas phase and in ethanol. Starting with the in-gas phase results, there is hardly any difference between the results found with the two employed basis sets (B1 and B2). As we have already seen, this behavior is general for all the studied molecules. The first transition has a π → π* character, implies a HOMO–LUMO transition (See Figure 5a) and produces an increase in the dipole moment of the excited state of 0.4–0.9 D depending on the functional and basis set. See Table S8 in the supporting material for absolute dipole moment values. This transition displays the greatest oscillator strength. The second excited state, S2, implies an n → π* transition, it has an oscillator strength of 0.00, and so it is a forbidden transition. For S2 there is a significant decrease in the dipole moment, being Δμ ≈ −2.0 D. The third excited state, S3, is again a π → π* transition that involves an increase in the dipole moment of 1.0–1.4 D. The following excited state, S4, presents contributions from two transitions. The dipole moment of this state is notably higher than that for the ground state, being around 9–10 D for PBE0 and B3LYP and around 5.2–5.4 D for CAM-B3LYP. This increase is related to the charge transfer nature of this transition, where there is a shift in charge density from the phenyl ring toward the chromone moiety (see Figure 5b). Finally, S5 also shows contributions of two transitions, and is associated with a decrease in the dipole moment of 0.3–0.9 D depending on the functional.
Table 4. Transition Energies and Oscillator Strength (in Parentheses) for the First Five Excited States of 3-Hydroxyflavone, 3-HF, in Gas Phase and in Ethanol Solutiona.
| ΔE (eV) |
||||||
|---|---|---|---|---|---|---|
| transition | CAM-B3LYP/B1 | CAM-B3LYP/B2 | PBE0/B1 | PBE0/B2 | B3LYP/B1 | B3LYP/B2 |
| gas phase | ||||||
| S0 → S1 | 4.01 (.49) | 4.02 (.48) | 3.67 (.41) | 3.68 (.41) | 3.55 (.39) | 3.56 (.39) |
| S0 → S2 | 4.43 (.00) | 4.44 (.00) | 4.15 (.00) | 4.15 (.00) | 4.01 (.00) | 4.02 (.00) |
| S0 → S3 | 4.64 (.10) | 4.65 (.10) | 4.35 (.13) | 4.35 (.13) | 4.18 (.12) | 4.18 (.12) |
| S0 → S4 | 4.94 (.01) | 4.94 (.01) | 4.51 (.03) | 4.51 (.02) | 4.30 (.03) | 4.32 (.03) |
| S0 → S5 | 5.33 (.07) | 5.33 (.08) | 4.74 (.02) | 4.74 (.02) | 4.56 (.01) | 4.56 (.01) |
| PCM/cLR | ||||||
| S0 → S1 | 3.98 (.60) | 4.00 (.60) | 3.66 (.53) | 3.67 (.53) | 3.54 (.51) | 3.55 (.51) |
| S0 → S2 | 4.48 (.00) | 4.49 (.00) | 4.21 (.00) | 4.21 (.00) | 4.06 (.00) | 4.06 (.00) |
| S0 → S3 | 4.57 (.14) | 4.57 (.14) | 4.22 (.17) | 4.23 (.18) | 4.07 (.17) | 4.08 (.17) |
| S0 → S4 | 4.88 (.02) | 4.89 (.02) | 4.34 (.03) | 4.36 (.03) | 4.10 (.03) | 4.13 (.03) |
| S0 → S5 | 5.28 (.04) | 5.29 (.04) | 4.76 (.00) | 4.76 (.00) | 4.57 (.00) | 4.58 (.00) |
| PCM/cLR2 | ||||||
| S0 → S1 | 3.83 | 3.84 | 3.52 | 3.53 | 3.40 | 3.41 |
| S0 → S2 | 4.43 | 4.44 | 4.16 | 4.17 | 4.01 | 4.02 |
| S0 → S3 | 4.55 | 4.56 | 4.21 | 4.21 | 4.05 | 4.06 |
| S0 → S4 | 4.86 | 4.87 | 4.33 | 4.34 | 4.08 | 4.11 |
| S0 → S5 | 5.21 | 5.22 | 4.73 | 4.74 | 4.55 | 4.56 |
| PCM/IBSF | ||||||
| S0 → S1 | 3.96 (.50) | 3.97 (.50) | 3.65 (.43) | 3.66 (.43) | 3.53 (.41) | 3.54 (.41) |
| S0 → S2 | 4.48 (.12) | 4.49 (.12) | 4.14 (.17) | 4.15 (.17) | 3.76 (.00) | 3.80 (.00) |
| S0 → S3 | 4.59 (.00) | 4.59 (.00) | 4.29 (.00) | 4.29 (.00) | 3.96 (.17) | 3.97 (.17) |
| S0 → S4 | 4.78 (.02) | 4.80 (.02) | 4.17 (.00) | 4.16 (.00) | ||
| S0 → S5 | 5.17 (.61) | 5.19 (.05) | 4.77 (.00) | 4.77 (.00) | 4.56 (.00) | 4.57 (.00) |
Transition energy for the n → π* state in italics. Experimental values: 3.65 eV (intense)25 both in aprotic and non-polar solvent and in alcohols.
Figure 5.
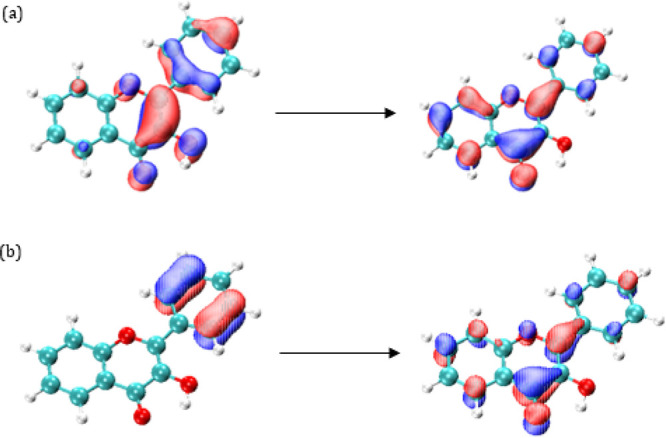
Molecular orbitals involved in the electronic transition to S1 (a) and S4 (charge transfer state) (b) in gas phase for 3-hydroxyflavone.
The order and topology of the orbitals involved in ethanol transitions display some changes with respect to those obtained in gas phase, mainly in the position of the n → π* state. Transition to S1 holds its π → π* character and remains the most probable transition for the three solvation methods. The solvent hardly modifies this transition, which appears again around 3.6–4.0 eV. The n → π* transition either remains as S2 (CAM-B3LYP with cLR and cLR2) or it is destabilized with respect to the π → π* transitions and becomes the S3 or S4 excited states. The third excited state, S3, implies an increase in the dipole moment of approximately 2 D and shows a certain charge transfer character. However, it is in the S4 state where the charge displacement becomes more evident, mainly with PBE0 and B3LYP functionals. With CAM-B3LYP, the state presents contributions from numerous transitions that make a clear establishment of its nature difficult. The transition involves the electron density transfer from the phenyl ring to the 3-hydroxychromen-2-one structure and an increase of the dipole moment value to 13–14 D (somewhat lower for the functional CAM-B3LYP). Finally, the S5 excited state involves a π → π* transition.
The solvent shift varies from 0.2 kcal/mol for the first excited state to 4.6 kcal/mol for the S4 charge transfer state. As expected, there is a redshift of the π → π* states and a blueshift of the n → π* state. This causes S2 and S3 states to become practically degenerate with PBE0 and B3LYP functionals.
The results found with the IBSF method are similar to those found with cLR and cLR2, although some differences appear mainly in the relative stability of the n → π* state. Thus, with CAM-B3LYP and PBE0, the n → π* state is destabilized until it becomes S3, and with B3LYP, it falls to S4. This change in relative stability is due to the great stabilization that the π → π* charge transfer state undergoes in solution. This excited state has a dipole moment of 14.4 D (B3LYP/B1), a value that is much larger than the 5.10 D calculated for the ground state. In a polar solvent like ethanol, the excited state is more stabilized than the ground state, and therefore, there is a very marked decrease in the transition energy. Consequently, the charge transfer state that in vacuum appeared as S4 now becomes S2. This makes the first three excited states for the B3LYP functional to be of a π → π* nature, whereas the fourth is n → π*. With the CAM-B3LYP functional, S4 presents contributions from numerous transitions and the charge transfer character is not so marked (its dipole moment value is around 9 D). Therefore, its stabilization is not as great as that for B3LYP. IBSF transition energies are slightly lower than those obtained with cLR, the differences in most cases being around 0.2–0.7 kcal/mol. Only for the transition to the charge transfer state, S4, with the CAM-B3LYP functional, does this value rise to 2.3 kcal/mol. As with the cLR method, a hypsochromic shift is observed for the n → π* state, whereas bathochromic shifts are found for the π → π* states. Finally, note that it has not been possible to establish the energy and nature of S4 by using the ISBF and PBE0 functionals due to a flip of states during the self-consistent polarization process.
The experimental UV–vis spectrum for 3-HF25 in aprotic and nonpolar solvents displays a very wide band with peaks at 3.49, 3.65, and 4.08 eV. The maximum appears at 3.65 eV. In alcohols, no significant changes are observed in this band, although a low intensity band appears at higher wavelengths above 400 nm (3.10 eV). However, this band has been associated with the appearance of the anionic form of 3-HF originated from the deprotonation of the 3-hydroxy group. This band has been calculated at 407 nm (3.05 eV) with the CAM-B3LYP/B2 and PCM/cLR levels of theory. Our results show good agreement with the experimental data. On one hand, there are no significant changes in the position of the transition energies in gas phase and in ethanol except for the position of the charge transfer state. On the other hand, the results predict two signals of different intensities according to the calculated oscillator strength values. Thus, cLR calculations with the B3LYP functional and B1 basis set predict a strong signal at 3.54 eV and a weaker signal at 4.07 eV. The energetic proximity of the first five excited states justifies the width of the experimental band. Regarding the performance of the different functionals, it can be established that PBE0 and B3LYP with any of the employed bases provide a good description of the spectrum, whereas the CAM-B3LYP functional tends to overestimate the transition energies.
Finally, the calculated absorption energy for the first excited state of 3HF are in perfect agreement with B3LYP/6-31G(d)//B3LYP/6-31G(d) result from Casadeus et al.28 These authors reported CIS, TDDFT, CASSCF, and CASPT2 results on the absorption of 3HF in gas phase and concluded that the TDDFT approach gives the best agreement with experimental data, especially with geometries optimized at the same level of theory. As expected, the CIS and CASSCF results give too-high excitation energies that are improved when dynamical correlation is introduced at the CASPT2 level. This CASPT2//CASSCF value remains overestimated with respect to TDDFT, probably due to the poor quality of the CASSCF geometry. The inclusion of the electronic correlation in obtaining accurate structures appears essential for the precise calculation of excitation energies.
Conclusions
Solvent effects on the nature and energy transition of the first five excited states of 3-HF and three related molecules, obtained by removing different groups of the original structure, have been studied. Among the first five excited states, there appear both n → π* and π → π* electronic states. It was verified that as the number of π orbitals in the system increases, there is a stabilization of the π → π* states with respect to n → π*. In this way, while the first two excited states of 4-pyrone are n → π*, in 3-hydroxy-4-pyrone, the second n → π* state is destabilized to S3. When the benzene ring fuses and 3-HC is built, the second n → π* state disappears among the first five excited states and the first of them appears as S2. The remaining four excited states are of a π → π* nature: S1 and S5 present significant oscillator strengths, and they are coincident with the two bands of the experimental absorption spectrum, the first less intense and S5 with a more pronounced intensity. Finally, the introduction of the phenyl group in position 2 causes the stabilization of π → π* states and shifts the n → π* up to S3. For this molecule, 3-HF, S1 is the state showing the greatest oscillator strength and corresponds to the most intense band of the experimental spectrum. The photophysical and photochemical properties of the 3-HF need this bright first excited state (n → π* states are known as dark states). Consequently, only those molecules where the first excited state is of a π → π* nature can be used as a simplified model to study the photochemical properties of 3-HF. According to our results, only 3-HC verifies this condition. In conclusion, neither 4-pyrone nor 3-hydroxy-4-pyrone can be used as models of 3-HF.
The effect of the solvent depends on the nature of the excited state. States of an n → π* type present lower dipole moment than the ground state; consequently, they undergo lower stabilization in solution, and the absorption band undergoes a hypsochromic shift moving toward higher transition energies. The opposite occurs with π → π*-type excited states that are slightly stabilized and therefore present a bathochromic shift. This behavior follows the trend registered in the experimental absorption spectra when moving from apolar and aprotic solvents (such as cyclohexane or methylcyclohexane) to alcohols such as ethanol. For the PCM/IBSF method, these shifts are more pronounced than for PCM/cLR as it provides a complete response of the solvent; this is particularly clear in smaller molecules and mainly in 4-pyrone. In any case, as most of the solvent polarization is collected at the first cycle and given the convergence problems of PCM/IBSF when excited states higher than the first are calculated, PCM/cLR can be considered as the more reliable strategy for our study. The PCM/cLR2 method includes part of the solute–solvent dispersion component; more specifically, it includes the response of the solvent to the transition dipole moment of each electronic transition and, consequently, it vanishes in n → π* states where the transition dipole is zero. It is worth noting that the solvent shift strongly decreases with the size of the π system and the formation of the IHB; thus, it is larger in 4-pyrone than in 3-HF. This fact is probably related to the larger charge delocalization allowed by the π-system.
Finally, in molecules displaying a hydroxyl group in position 3, an intramolecular hydrogen bond is formed between the oxygen of the carbonyl group and the hydrogen of the hydroxyl group. When passing from 3-hydroxy-4-pyrone to 3-HC, this hydrogen bridge weakens, as is deduced from the fact that it increases its length and decreases the corresponding bond angle. However, when passing to 3-HF, its strength increases. In solution, a competition is established between this IHB and the interaction of the two polar groups with the solvent. In this way, there is a weakening of the intramolecular bond, verified by an increase in the distance of C=O···H—O and by a decrease in the angle of O···H–O.
Acknowledgments
This work was supported by the GR18021 and IB18022 projects from the Consejería de Economía, Ciencia y Agenda Digital of the Gobierno de Extremadura. M.J.C.M. thanks the Gobierno de Extremadura for a PCI contract.
Supporting Information Available
The Supporting Information is available free of charge at https://pubs.acs.org/doi/10.1021/acsomega.3c01906.
(Table S1) Geometric parameters for 4-pyrone; (Table S2) geometric parameters for 3-hydroxy-4-pyrone; (Table S3) geometric parameters for 3-hydroxychromen-4-one; (Table S4) geometric parameters for 3-hydroxyflavone; (Table S5) dipole moment (D) for 4-pyrone in gas phase and in ethanol solution; (Table S6) dipole moment (D) for 3-hydroxy-4-pyrone in gas phase and in ethanol solution; (Table S7) dipole moment (D) for 3-hydroxychromen-4-one in gas phase and in ethanol solution; (Table S8) dipole moment (D) for 3-hydroxyflavone in gas phase and in ethanol solution (PDF)
The authors declare no competing financial interest.
Supplementary Material
References
- S., Quideau “Flavonoids. Chemistry, Biochemistry and Applications. Edited by Øyvind M. Andersen; Kenneth R. Markham.,” Angewandte Chemie International Edition, vol. 45, no. (41), , 2006, doi: 10.1002/anie.200685399. [DOI] [Google Scholar]
- McMorrow D.; Kasha M. Intramolecular excited-state proton transfer in 3-hydroxyflavone. Hydrogen-bonding solvent perturbations. J. Phys. Chem. 1984, 88, 2235–2243. 10.1021/j150655a012. [DOI] [Google Scholar]
- Strandjord A. J. G.; Barbara P. F. Proton-transfer kinetics of 3-hydroxyflavone: Solvent effects. J. Phys. Chem. 1985, 89, 2355–2361. 10.1021/j100257a041. [DOI] [Google Scholar]
- Brucker G. A.; Swinney T. C.; Kelley D. F. Proton-transfer and solvent polarization dynamics in 3-hydroxyflavone. J. Phys. Chem. 1991, 95, 3190–3195. 10.1021/j100161a043. [DOI] [Google Scholar]
- Bader A. N.; Ariese F.; Gooijer C. Proton transfer in 3-hydroxyflavone studied by high-resolution 10 K laser-excited Shpol’skii spectroscopy. J. Phys. Chem. A 2002, 106, 2844–2849. 10.1021/jp013840o. [DOI] [Google Scholar]
- Lazzaroni S.; Dondi D.; Mezzetti A.; Protti S. Role of solute-solvent hydrogen bonds on the ground state and the excited state proton transfer in 3-hydroxyflavone. A systematic spectrophotometric study. Photochem. Photobiol. Sci. 2018, 17, 923–933. 10.1039/c8pp00053k. [DOI] [PubMed] [Google Scholar]
- Zhou P.; Han K. Unraveling the Detailed Mechanism of Excited-State Proton Transfer. Acc. Chem. Res. 2018, 51, 1681–1690. 10.1021/acs.accounts.8b00172. [DOI] [PubMed] [Google Scholar]
- Hsieh C.-C.; Jiang C.-M.; Chou P.-T. Recent experimental advances on excited-state intramolecular proton coupled electron transfer reaction. Acc. Chem. Res. 2010, 43, 1364–1374. 10.1021/ar1000499. [DOI] [PubMed] [Google Scholar]
- Santos F. S.; Ramasamy E.; Ramamurthy V.; Rodembusch F. S. Excited state chemistry of flavone derivatives in a confined medium: ESIPT emission in aqueous media. Photochem. Photobiol. Sci. 2014, 13, 992–996. 10.1039/c4pp00096j. [DOI] [PubMed] [Google Scholar]
- Klymchenko A. S.; Pivovarenko V. G.; Ozturk T.; Demchenko A. P. Modulation of the solvent-dependent dual emission in 3-hydroxychromones by substituents. New J. Chem. 2003, 27, 1336–1343. 10.1039/b302965d. [DOI] [Google Scholar]
- Protti S.; Raulin K.; Cristini O.; Kinowski C.; Turrell S.; Mezzetti A. Wavelength shifting systems based on flavonols and their metal complexes encapsulated by post-doping in porous SiO2 xerogel matrices. J. Mol. Struct. 2011, 485–490. 10.1016/j.molstruc.2011.02.010. [DOI] [Google Scholar]
- Sedgwick A. C.; Wu L.; Han H.-H.; Bull S. D.; He X.-P.; James T. D.; Sessler J. L.; Tang B. Z.; Tian H.; Yoon J. Excited-state intramolecular proton-transfer (ESIPT) based fluorescence sensors and imaging agents. Chem. Soc. Rev. 2018, 47, 8842–8880. 10.1039/c8cs00185e. [DOI] [PubMed] [Google Scholar]
- Aparicio F. J.; Alcaire M.; González-Felipe A.; Barranco A.; Holgado M.; Casquel R.; Sanza F.; Griol A.; Bernier D.; Dortu F.; et al. Dye-based photonic sensing systems. Sens. Actuators, B 2016, 228, 649–657. 10.1016/j.snb.2016.01.092. [DOI] [Google Scholar]
- Karakuş E.; Üçüncü M.; Emrullahoğlu M. Electrophilic Cyanate As a Recognition Motif for Reactive Sulfur Species: Selective Fluorescence Detection of H2S. Anal. Chem. 2016, 88, 1039–1043. 10.1021/acs.analchem.5b04163. [DOI] [PubMed] [Google Scholar]
- Ahmed S. I.; Hayat M. Q.; Tahir M.; Mansoor Q.; Ismail M.; Keck K.; Bates R. B. Pharmacologically active flavonoids from the anticancer, antioxidant and antimicrobial extracts of Cassia angustifolia Vahl. BMC Complementary Altern. Med. 2016, 16, 460. 10.1186/s12906-016-1443-z. [DOI] [PMC free article] [PubMed] [Google Scholar]
- Carullo G.; Cappello A. R.; Frattaruolo L.; Badolato M.; Armentano B.; Aiello F. Quercetin and derivatives: Useful tools in inflammation and pain management. Future Med. Chem. 2017, 9, 79–93. 10.4155/fmc-2016-0186. [DOI] [PubMed] [Google Scholar]
- Park K. Y.; Jung G. O.; Lee K. T.; Choi J.; Choi M. Y.; Kim G. T.; Jung H. J.; Park H. J. Antimutagenic activity of flavonoids from the heartwood of Rhus verniciflua. J. Ethnopharmacol. 2004, 90, 73–79. 10.1016/j.jep.2003.09.043. [DOI] [PubMed] [Google Scholar]
- Sharma A.; Tuli H. S. Natural moieties as promising anti-cancer drugs. J. Biol. Chem. Sci. 2017, 2017, 301–303. [Google Scholar]
- Xiao J. Dietary flavonoid aglycones and their glycosides: Which show better biological significance?. Crit. Rev. Food Sci. Nutr. 2017, 57, 1874–1905. 10.1080/10408398.2015.1032400. [DOI] [PubMed] [Google Scholar]
- Gao J.; Chen G.; He H.; Liu C.; Xiong X.; Li J.; Wang J. Therapeutic effects of breviscapine in cardiovascular diseases: A review. Front. Pharmacol. 2017, 8, 289. 10.3389/fphar.2017.00289. [DOI] [PMC free article] [PubMed] [Google Scholar]
- Caricato M.; Mennucci B.; Tomasi J.; Ingrosso F.; Cammi R.; Corni S.; Scalmani G. Formation and relaxation of excited states in solution: A new time dependent polarizable continuum model based on time dependent density functional theory. J. Chem. Phys. 2006, 124, 124520. 10.1063/1.2183309. [DOI] [PubMed] [Google Scholar]
- Improta R.; Scalmani G.; Frisch M. J.; Barone V. Toward effective and reliable fluorescence energies in solution by a new state specific polarizable continuum model time dependent density functional theory approach. J. Chem. Phys. 2007, 127, 074504 10.1063/1.2757168. [DOI] [PubMed] [Google Scholar]
- Improta R.; Barone V.; Scalmani G.; Frisch M. J. A state-specific polarizable continuum model time dependent density functional theory method for excited state calculations in solution. J. Chem. Phys. 2006, 125, 054103 10.1063/1.2222364. [DOI] [PubMed] [Google Scholar]
- Guido C. A.; Chrayteh A.; Scalmani G.; Mennucci B.; Jacquemin D. Simple Protocol for Capturing Both Linear-Response and State-Specific Effects in Excited-State Calculations with Continuum Solvation Models. J. Chem. Theory Comput. 2021, 17, 5155–5164. 10.1021/acs.jctc.1c00490. [DOI] [PubMed] [Google Scholar]
- Mandal P. K.; Samanta A. Evidence of ground-state proton-transfer reaction of 3-hydroxyflavone in neutral alcoholic solvents. J. Phys. Chem. A 2003, 107, 6334–6339. 10.1021/jp027613d. [DOI] [Google Scholar]
- Sukpattanacharoen C.; Salaeh R.; Promarak V.; Escudero D.; Kungwan N. Heteroatom substitution effect on electronic structures, photophysical properties, and excited-state intramolecular proton transfer processes of 3-hydroxyflavone and its analogues: A TD-DFT study. J. Mol. Struct. 2019, 1195, 280–292. 10.1016/j.molstruc.2019.05.113. [DOI] [Google Scholar]
- Salaeh R.; Prommin C.; Chansen W.; Kerdpol K.; Daengngern R.; Kungwan N. The effect of protic solvents on the excited state proton transfer of 3-hydroxyflavone: A TD-DFT static and molecular dynamics study. J. Mol. Liq. 2018, 252, 428–438. 10.1016/j.molliq.2017.12.148. [DOI] [Google Scholar]
- Casadesús R.; Vendrell O.; Moreno M.; Lluch J. M.; Morokuma K. On the intramolecular proton transfer of 3-hydroxyflavone in the first singlet excited state: A theoretical study. Chem. Phys. 2006, 325, 243–250. 10.1016/j.chemphys.2005.12.028. [DOI] [Google Scholar]
- Li H.; Xin C.; Cai J.; Yuan B.; Wei Z.; Jin G. Hydrogen bond capability tunable different ‘relay-race’ mechanisms of the excited-state proton transfer process for 4′-methoxy-3-hydroxyflavone. Org. Electron. 2020, 81, 105678 10.1016/j.orgel.2020.105678. [DOI] [Google Scholar]
- Li C.; Hu B.; Liu Y. Unraveling the effect of two different polar solvents on the excited-state intramolecular proton transfer of 4′-methoxy-3-hydroxyflavone fluorescent dye. Spectrochim. Acta, Part A 2020, 225, 117487 10.1016/j.saa.2019.117487. [DOI] [PubMed] [Google Scholar]
- Ni M.; Su S.; Fang H. Excited state intramolecular proton transfer via different size of hydrogen bond ring: a theoretical insight. Theor. Chem. Acc. 2019, 138, 125. 10.1007/s00214-019-2512-4. [DOI] [Google Scholar]
- Suda K.; Sarinastiti A.; Arifin Y. K.; Yokogawa D. Understanding Structural Changes through Excited-State Intramolecular Proton Transfer in 4′- N, N-Diethylamino-3-hydroxyflavone (DEAHF) in Solution Based on Quantum Chemical Calculations. J. Phys. Chem. B 2019, 123, 9872–9881. 10.1021/acs.jpcb.9b07549. [DOI] [PubMed] [Google Scholar]
- Qi Y.; Lu M.; Wang Y.; Tang Z.; Gao Z.; Tian J.; Fei X.; Li Y.; Liu J. A theoretical study of the ESIPT mechanism of 3-hydroxyflavone derivatives: Solvation effect and the importance of TICT for its dual fluorescence properties. Org. Chem. Front. 2019, 6, 3136–3143. 10.1039/c9qo00634f. [DOI] [Google Scholar]
- Hao J.; Yang Y. Dynamic Excited-State Intramolecular Proton Transfer Mechanisms of Two Novel 3-Hydroxyflavone-Based Chromophores in Two Different Surroundings. J. Phys. Chem. A 2019, 123, 3937–3948. 10.1021/acs.jpca.9b00879. [DOI] [PubMed] [Google Scholar]
- Hessz D.; Bojtár M.; Mester D.; Szakàcs Z.; Bitter I.; Kállay M.; Kubinyi M. Hydrogen bonding effects on the fluorescence properties of 4′-diethylamino-3-hydroxyflavone in water and water-acetone mixtures. Spectrochim. Acta, Part A 2018, 203, 96–105. 10.1016/j.saa.2018.05.104. [DOI] [PubMed] [Google Scholar]
- Jia L.; Wang F.; Liu Y. Solvent effects on excited state intramolecular proton transfer mechanism in 4-(N,N-dimethylamino)-3-hydroxyflavone. Org. Electron. 2018, 57, 292–297. 10.1016/j.orgel.2018.03.030. [DOI] [Google Scholar]
- Han J.; Liu X.; Sun C.; Li Y.; Yin H.; Shi Y. Ingenious modification of molecular structure effectively regulates excited-state intramolecular proton and charge transfer: A theoretical study based on 3-hydroxyflavone. RSC Adv. 2018, 8, 29589–29597. 10.1039/c8ra05812a. [DOI] [PMC free article] [PubMed] [Google Scholar]
- Yang D.; Yang G.; Jia M.; Song X.; Zhang Q.; Zhang T.; Gao H. Theoretical research on excited-state intramolecular proton coupled charge transfer modulated by molecular structure. RSC Adv. 2018, 8, 29662–29669. 10.1039/c8ra05945d. [DOI] [PMC free article] [PubMed] [Google Scholar]
- Yang D.; Zheng R.; Wang Y.; Lv J. A Theoretical Investigation on Intramolecular Hydrogen Bond: The ESIPT Mechanism of dmahf Sensor. J. Cluster Sci. 2017, 28, 937–947. 10.1007/s10876-016-1090-z. [DOI] [Google Scholar]
- Zhang W.; Shi B.; Shi J. Time-dependent density functional investigation on electronic spectra of 4′-N-dimethylamino-3-hydroxyflavone. J. Mol. Struct.: THEOCHEM 2005, 731, 219–224. 10.1016/j.theochem.2005.05.032. [DOI] [Google Scholar]
- Estiú G.; Rama J.; Pereira A.; Cachau R. E.; Ventura O. N. A theoretical study of excited state proton transfer in 3-hydroxychromone and related molecules. J. Mol. Struct.: THEOCHEM 1999, 487, 221–230. 10.1016/S0166-1280(98)00602-2. [DOI] [Google Scholar]
- Peluso A.; Adamo C.; del Re G. A theoretical analysis of excited state proton transfer in 3-hydroxyflavone. Promoting effect of a low frequency bending mode. J. Math. Chem. 1992, 10, 249–274. 10.1007/BF01169177. [DOI] [Google Scholar]
- Frutos-Puerto S.; Colín M. J.; Corchado J. C.; Sánchez M. L.; Martín M. E.; Aguilar M. A. Photophysical and photochemical properties of 3-hydroxyflavone in ethanol solution: Implicit vs explicit solvent models. J. Mol. Liq. 2023, 381, 121783 10.1016/j.molliq.2023.121783. [DOI] [Google Scholar]
- Hohenberg P.; Khon W. Phys. Rev. B 1964, 136, B864. 10.1103/PhysRev.136.B864. [DOI] [Google Scholar]
- C., Fiolhais; Nogueira F.; Marques M. A. L.. A Primer in Density Functional Theory, 1st ed. Springer: Berlin, Heidelberg, 2003, 10.1007/3-540-37072-2. [DOI] [Google Scholar]
- Jensen F.Introduction to Computational Chemistry; John Wiley & Sons; 2013, 10.1007/s00214-013-1372-6. [DOI] [Google Scholar]
- Runge E.; Gross E. K. U. Density-functional theory for time-dependent systems. Phys. Rev. Lett. 1984, 52, 997–1000. 10.1103/PhysRevLett.52.997. [DOI] [Google Scholar]
- R., MartínElectronic Structure. Basic Theory and Practical Methods; Cambridge University Press, 2004. doi: 10.1017/CBO9780511805769. [DOI] [Google Scholar]
- Adamo C.; Barone V. Toward reliable density functional methods without adjustable parameters: The PBE0 model. J. Chem. Phys. 1999, 110, 6158. 10.1063/1.478522. [DOI] [Google Scholar]
- Yanai T.; Tew D. P.; Handy N. C. A new hybrid exchange-correlation functional using the Coulomb-attenuating method (CAM-B3LYP). Chem. Phys. Lett. 2004, 393, 51–57. 10.1016/j.cplett.2004.06.011. [DOI] [Google Scholar]
- Miertuš S.; Scrocco E.; Tomasi J. Electrostatic interaction of a solute with a continuum. A direct utilizaion of AB initio molecular potentials for the prevision of solvent effects. Chem. Phys. 1981, 55, 117–129. 10.1016/0301-0104(81)85090-2. [DOI] [Google Scholar]
- Miertus̃ S.; Tomasi J. Approximate evaluations of the electrostatic free energy and internal energy changes in solution processes. Chem. Phys. 1982, 65, 239–245. 10.1016/0301-0104(82)85072-6. [DOI] [Google Scholar]
- G. M. J., Frisch; Trucks W.; Schlegel H.; Scuseria G.; Robb M.; Cheeseman J.; Scalmani G.; Barone V.; Mennucci B.; Petersson G.. et al. Gaussian 09, Revision A. 1; Gaussian; Gaussian Inc.2009.
- Cammi R.; Mennucci B. Linear response theory for the polarizable continuum model. J. Chem. Phys. 1999, 110, 9877–9886. 10.1063/1.478861. [DOI] [Google Scholar]
- Cossi M.; Barone V. Time-dependent density functional theory for molecules in liquid solutions. J. Chem. Phys. 2001, 115, 4708–4717. 10.1063/1.1394921. [DOI] [Google Scholar]
- Guido C. A.; Scalmani G.; Mennucci B.; Jacquemin D. Excited state gradients for a state-specific continuum solvation approach: The vertical excitation model within a Lagrangian TDDFT formulation. J. Chem. Phys. 2017, 146, 204106. 10.1063/1.4983696. [DOI] [PubMed] [Google Scholar]
- Mewes J.-M.; Herbert J. M.; Dreuw A. On the accuracy of the general, state-specific polarizable-continuum model for the description of correlated ground- and excited states in solution. Phys. Chem. Chem. Phys. 2017, 19, 1644–1654. 10.1039/c6cp05986d. [DOI] [PubMed] [Google Scholar]
- Ishibe N.; Sugimoto H.; Gallivan J. B. Electronic absorption and emission spectra of 4-pyrones, 4-thiopyrones and 4-pyridones. J. Chem. Soc., Faraday Trans. 2 1975, 71, 1812–1822. 10.1039/F29757101812. [DOI] [Google Scholar]
- Seixas de Melo J.; Quinteiro G.; Pina J.; Breda S.; Fausto R. Spectroscopic characterization of α- and γ-pyrones and their substituted 4-hydroxy and 4-methoxy derivatives: An integrated infrared, photophysical and theoretical study. J. Mol. Struct. 2001, 565–566, 59–67. 10.1016/S0022-2860(00)00944-3. [DOI] [Google Scholar]
- Choux G.; Benoit R. L. Substituent Effects on 6-Substituted 3-Hydroxy-4-Pyrones. J. Org. Chem. 1967, 32, 3974–3977. 10.1021/jo01287a053. [DOI] [Google Scholar]
- Yamada K. Infrared and Ultraviolet Spectra of α- and γ-Pyrones. Bull. Chem. Soc. Jpn. 1962, 35, 1323–1329. 10.1246/bcsj.35.1323. [DOI] [Google Scholar]
- Chevalier K.; Grün A.; Stamm A.; Schmitt Y.; Gerhards M.; Diller R. ESIPT and photodissociation of 3-hydroxychromone in solution: Photoinduced processes studied by static and time-resolved UV/Vis, fluorescence, and IR spectroscopy. J. Phys. Chem. A 2013, 117, 11233–11245. 10.1021/jp407252y. [DOI] [PubMed] [Google Scholar]
Associated Data
This section collects any data citations, data availability statements, or supplementary materials included in this article.