

Abstract
Ageing is associated with re-modelling of the immune system to enable the maintenance of life-long immunity. In the CD8+ T cell compartment, ageing results in the expansion of highly-differentiated cells that exhibit characteristics of cellular senescence. Here we found that CD27−CD28−CD8+ T lost the signalling activity of the T cell antigen receptor (TCR) and expressed a protein complex containing the agonistic NK receptor NKG2D and the NK adaptor molecule DAP12, which promoted cytotoxicity against cells that expressed NKG2D ligands. Immunoprecipitation and imaging cytometry indicated that the NKG2D-DAP12 complex was associated with sestrin 2. The genetic inhibition of sestrin 2 resulted in decreased expression of NKG2D and DAP12 and restored TCR signaling in senescent-like CD27−CD28−CD8+ T cells. Therefore, during ageing, sestrins induces the reprogramming of non-proliferative senescent-like CD27−CD28−CD8+ T cells to acquire a broad-spectrum, innate-like killing activity.
Immunity declines during ageing and this is associated with an increased incidence of infections and malignancy1. It is therefore essential to understand mechanisms that contribute to altered immunity in older individuals in order to identify possible therapeutic targets. Because the thymus involutes from puberty onwards, its contribution to the maintenance of the T cell pool decreases considerably during ageing. Instead, antigen specific T cells are maintained in older individuals by repeated episodes of activation and proliferation triggered by specific or cross-reactive antigenic challenge or by homeostatic cytokines2. This extensive proliferative activity leads ultimately to extreme functional differentiation and the development of T cell senescence associated with telomere erosion, decreased signalling through the T cell antigen receptor (TCR), activation of the telomere-extending enzyme telomerase and growth arrest3–5. Because the replicative activity of T cells is impaired as senescence develops, mechanisms other that T cell proliferation may be required to maintain optimal immune protection during ageing.
Highly-differentiated CD8+ T cells that lose expression of the surface receptors CD28 and CD27 (CD27−CD28−) exhibit senescent-like characteristics that include low proliferative activity, short telomeres, low telomerase activity and expression of senescence-associated cell surface (CD57 and KLRG1) and intracellular (the MAP kinase p38, γH2AX) molecules4. CD27−CD28−CD8+ T cells also upregulate receptors associated with natural killer (NK) cells, such as inhibitory (KLRG1, NKG2A) and activatory proteins (NKG2C and NKG2D)6. Whether the acquisition of the senescence-like characteristics and the expression of NK receptors (NKR) are linked or are controlled independently remains unclear.
Sestrins are stress-sensing proteins, induced by conditions of low glucose or oxidative stress or cellular senescence, that inhibit TCR activation and CD4+ T cell proliferation in both mice and humans7. Here we showed that sestrins inhibited the expression of the TCR signaling molecules LAT, ZAP70 and LCK in mouse and human CD8+ T cells, and concomitantly induced the expression of both inhibitory and activatory NKRs. Furthermore, sestrins regulated the association of NKG2D with the scaffold protein DAP12, which converts it into an activating receptor that can trigger the secretion of cytokines and cytotoxicity towards target cells bearing NKG2D ligands, independently of the TCR. Collectively, these data indicated that senescent-like CD8+ T cells were not a defective end-stage population. Instead these cells, while non-proliferative, were instead re-programmed during differentiation to recognize and kill through both TCR8 as well as NKR recognition mechanisms, a process regulated by the sestrins. The repurposing of senescent-like CD8+ T cells to mediate innate-like functional activity may be crucial to mitigate against the increased burden of tumours and stromal senescent cells that accumulate in tissues during ageing9,10.
Results
Human CD8+ TEMRA cells upregulate NKRs but decrease TCR components
First, we isolated peripheral blood CD8+ T cell subsets from six healthy donors and compared the transcriptomes of CD27+CD45RA−CD8+ central memory T cells (TCM cells), CD27− CD45RA− CD8+ effector memory T cells (TEM cells) and CD27−CD45RA+CD8+ terminal effector memory T cells (TEMRA cells) relative to the CD27+CD45RA+CD8+ naïve T cells (TN cells) using Affymetrix U133 plus 2 microarrays (Fig. 1a and Extended Data Fig. 1a). Differentially expressed genes in these CD8+ T cell subsets were identified based on a minimum of a 2-fold change (p <0.05, false-discovery rate (FDR) for multiple comparisons <0.05% (Supplementary table 1). Hierarchical clustering of genes associated with effector cell function indicated a transcriptional signature that distinguished TEMRA cells from TN cells (Fig. 1b,c). Genes involved in co-stimulation (Cd28, Cd27), TCR signaling (Trac, Cd3e, Cd3g, Lck, Lat, Plcg1) and proliferation and cell cycle control (Ccne1, Ccnd3) were downregulated in TEMRA cells compared to TN cells (Fig. 1b,c). Compared to CD8+ TN cells, CD8+ TEMRA cells upregulated genes encoding the transcription factors Zeb2 (fold change: 10.75, p < 0.0001) and Zbtb16 (encoding PLZF, fold change: 6.48, p < 0.0001, Fig. 1b, Supplementary Table 2) which are known to regulate terminal differentiation of memory T cells11 and the development of innate-like features in T cells in mice12,13. Zbtb16 was also increased in TCM cells and TEM cells compared to TN cells (7.7- and 4.8-fold respectively; Supplementary table 2). TEMRA cells upregulated genes encoding NKRs (including Kir family members, Nkg2a/c and Klrg1), innate signalling adaptors (Tyrobp, encoding DAP12) and molecules involved in cytotoxicity (Gzma/b, Prf, Fasl, Itgav and Itgb1)14. TEMRA cells also upregulated chemokine receptors associated with the migration of NK cells into tissues (Cx3cr1, S1pr5, and Cmklr1)15, indicating that the differentiation of CD8+ T cells from TN cells into TEMRA cells was associated with a transcriptional program that promoted cytotoxic effector functions at the expense of proliferative potential and suggested that highly-differentiated CD8+ T cells may express effector functions independent of the TCR.
Fig. 1: Transcriptional signature of human CD8+ T cell subsets.
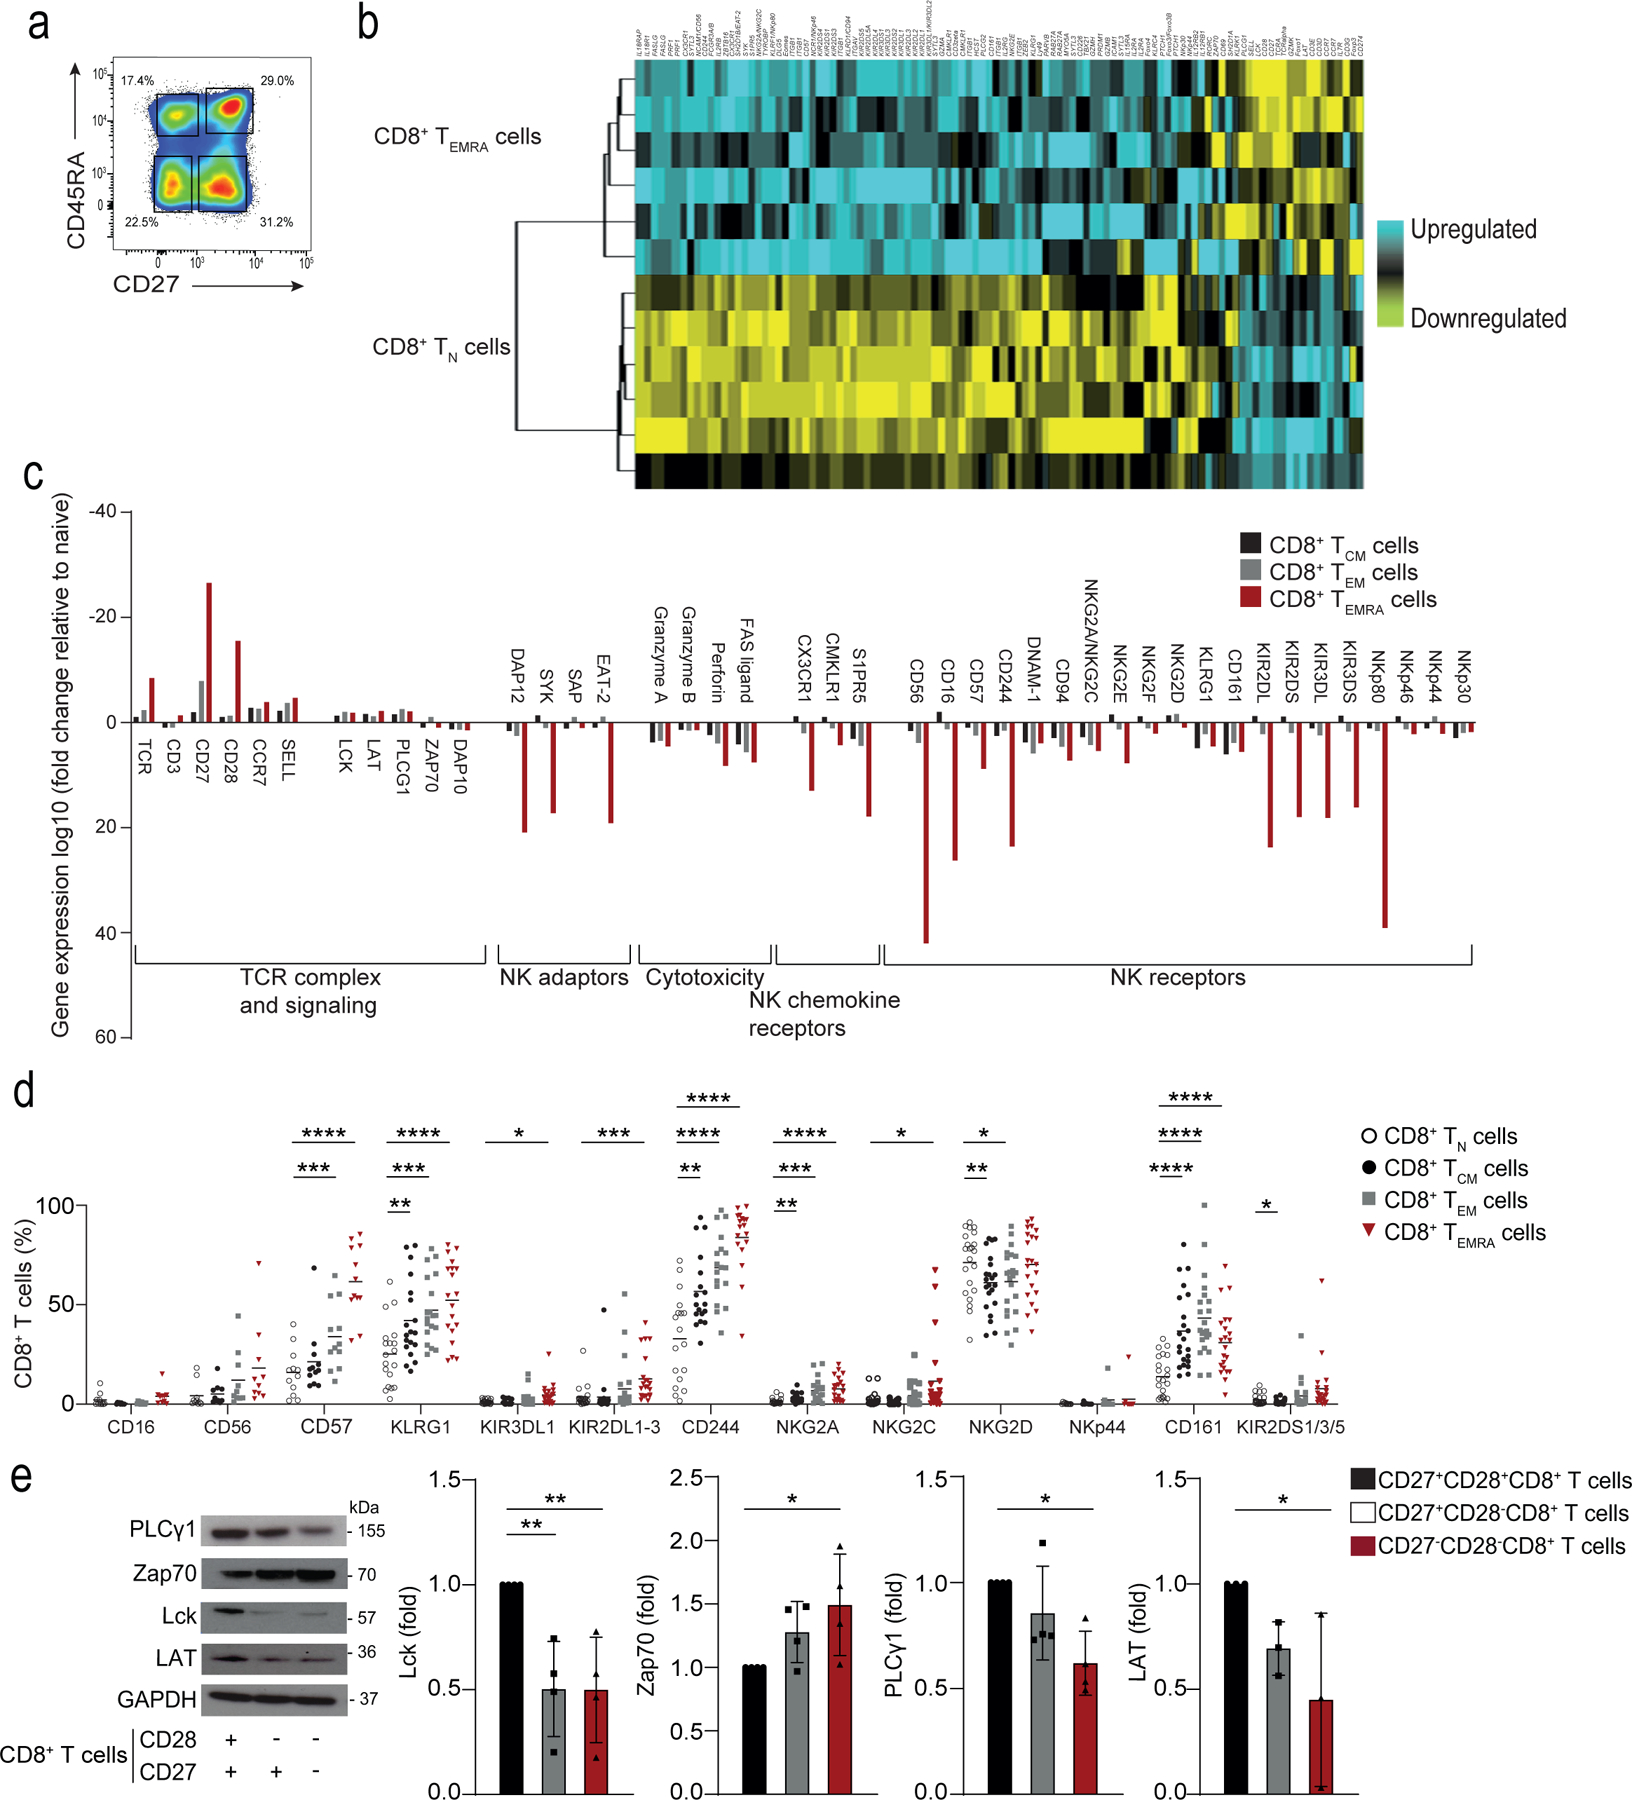
a) Representative image of CD8+ T cells gated on CD27+CD45RA+ TN cell, CD27+CD45RA− TCM cells, CD27−CD45RA−TEM cells, and CD27−CD45RA+TEMRA cells isolated from the PBMCs from 6 healthy donors. Numbers in gates represent percentages of cells in each subset from a representative donor. Similar results were obtained in other experiments. b) Heat map of gene expression of Affymetrix U133 plus 2 microarrays of sorted TN and TEMRA CD8+ T cell subsets, showing downregulated (in yellow) and upregulated genes (in blue). c) The relative fold-change (log10) of differentially expressed genes of interest in TCM, TEM and TEMRA CD8+ T cell subsets compared to TN CD8+ T cells. The list of genes of interest is shown in Supplementary table 2 and the complete list of differentially expressed genes from the whole-transcriptome analysis (≥2-fold change, p<0.05, FDR<0.05%) is available in Supplementary table 1. d) NKR expression TN, TCM, TEM, and TEMRA CD8+ T cells assessed by flow cytometry on PBMCs from 22 healthy donors (median age = 52, range 25–83). e) Representative immunoblots of proximal TCR components Lck, PLCγ1, LAT and Zap70 on CD27+CD28+, CD27+CD28− and CD27−CD28− CD8+ T cells freshly isolated from PBMCs using magnetic activated cell. Similar data were obtained in 4 independent experiments. Summary data (n = 4) of Lck, Zap70, PLCγ1 and LAT expression normalized to the loading control (GAPDH) and presented relative to the basal expression in CD27+28+CD8+ cells set to 1. d) Two-way ANOVA with Dunnett’s post-test correction and e) one-way ANOVA with Tukey’s correction (*p < 0.05, **p < 0.01, ***p < 0.001, ****p < 0.0001).
Flow cytometric analysis indicated that the expression of NKRs on non-NK cells was elevated on CD3+CD27−CD45RA+CD8+ TEMRA cells (Fig. 1d, Extended Data 1a) in PBMCs isolated from a separate cohort of healthy donors (n = 22; median age = 52; range = 25–83). The repertoire of NKRs expressed on CD8+ TEMRA cells was diverse and included both activating (NKG2D, NKG2C and KIR2DS) and inhibitory (NKG2A, KIR2DL/KIR3DL and CD244) receptors, as well as the maturation markers KLRG1 and CD57 (Fig. 1d, Extended Data 1b). Expression of CD28 and CD27 is sequentially lost on CD8+ T cells as they transition from CD27+CD28+ CD8+ TN cells to CD27+CD28− intermediate CD8+ T cells and to terminal, or senescent-like, CD27−CD28− CD8+ T cells16,17. To analyse the expression of the TCR signalling machinery in CD8+ TEMRA cells, we isolated CD8+ T cell subsets by their relative expression of CD27 and CD28, as the use of CD27 and CD28 as markers enabled the isolation of more cells for functional analyses. The CD27−CD28−CD8+ T cell subset contained the TEMRA subset and TEM subset (Extended Data 1c) and had increased expression of NKRs compared to CD27+CD28+CD8+ TN cells (Extended Data 2a). Senescent-like CD8+ T cells, either identified as CD27−CD28−18,19 or as CD27−CD45RA+20 increase in both number and proportion during ageing and exhibit markers of senescence4,5,7,20. Immunoblots showed a significant downregulation of LCK, LAT and PLC-γ1, but upregulation of ZAP70 in CD27−CD28−CD8+ T cells compared to CD8+ TN cells (Fig. 1e). CD27−CD28−CD4+ T cells also acquired cell-surface expression of NKRs (including KLRG1, NKG2C and NKG2D), but to a lower degree than CD27−CD28−CD8+ T cells (Extended Data 2b). Together, these findings indicated the increased expression of NKRs on CD8+ T cells with characteristics of terminal differentiation and senescence.
Individual TEMRA CD8+ T cells are senescent and express NKRs and cytotoxic molecules
To investigate whether NKRs, cytotoxicity-related molecules and senescence markers were expressed on individual CD8+ TEMRA cells, we used single cell RNA-sequencing (scRNA-seq) to investigate the transcriptomes of ~62,000 CD8+ T cells isolated from six healthy old donors (72–88 yrs). CD8+IL-7R+ and CD8+IL-7R− T cells were sorted from each donor resulting in 12 samples (Extended Data 3a). Sorts yielded an average of 6199 CD8+IL-7R+ cells (SD 1582) and 4192 CD8+IL-7R− cells (SD 1269) per donor, with an average of 1043 and 1011 genes per cell, respectively (Extended Data 3b,c). After discarding hybrid transcriptomes (multiplets) using Scrublet (Methods), raw data from the 12 samples (six CD8+IL-7R+ and six CD8+IL-7R− T cells) were combined. scRNA-seq profiles that passed the quality control (Extended Data 3d) were then corrected for technical batch effects (e.g. 10x run) using BBKNN. Unbiased clustering followed by a two-dimensional uniform manifold approximation and projection (UMAP) on the corrected data identified 13 distinct clusters (Fig. 2a). Cluster assignments were independent of batch (Extended Data 3e) and donor (Extended Data 3f) effects. The CD8+IL-7R+ and CD8+IL-7R+ groups associated with distinct sets of clusters (Fig. 2b). The number of cells within each cluster varied from 9,263 to 915 (Extended Data 3g) and their expression of Il7r mRNA was confirmed (Extended Data 4a). We assigned clusters to cell types based on differential analysis comparing expression values among cells from a given cluster to all other cells (Supplementary Table 3). All clusters expressed transcripts for Cd3e and Cd8, but not Cd4 (Fig. 2c). We could identify clusters of TN cells (expressing Cd27, Ccr7, Sell or Cd28) and effector T cells (expressing Klrg1, Prf1 or Gzmb) (Fig. 2c). Based on this expression profile, clusters C0, C4 and C8 were defined as CD8+ TN cells, and C1, C2 and C6 as CD8+ TEMRA cells (Fig. 3a). A second round of clustering performed on these six clusters confirmed the distinct transcriptomic profiles of the CD8+ TN and CD8+ TEMRA compartments (Fig. 3b, Extended Data 4b) and confirmed the enrichment of the CD8+TEMRA compartment within the CD8+IL-7R− cells (Extended Data 4c). CD8+ TN cells were characterized by the expression of Cd27, Cd28, Ccr7 and Sell, while CD8+ TEMRA cells showed an upregulation of Klrg1, Prf1 or Gzmb relative to the clusters of CD8+ TN cells (Extended Data 4d).
Fig. 2: Single cell RNA-seq (scRNA-seq) of TN and TEMRA CD8+ T cells.
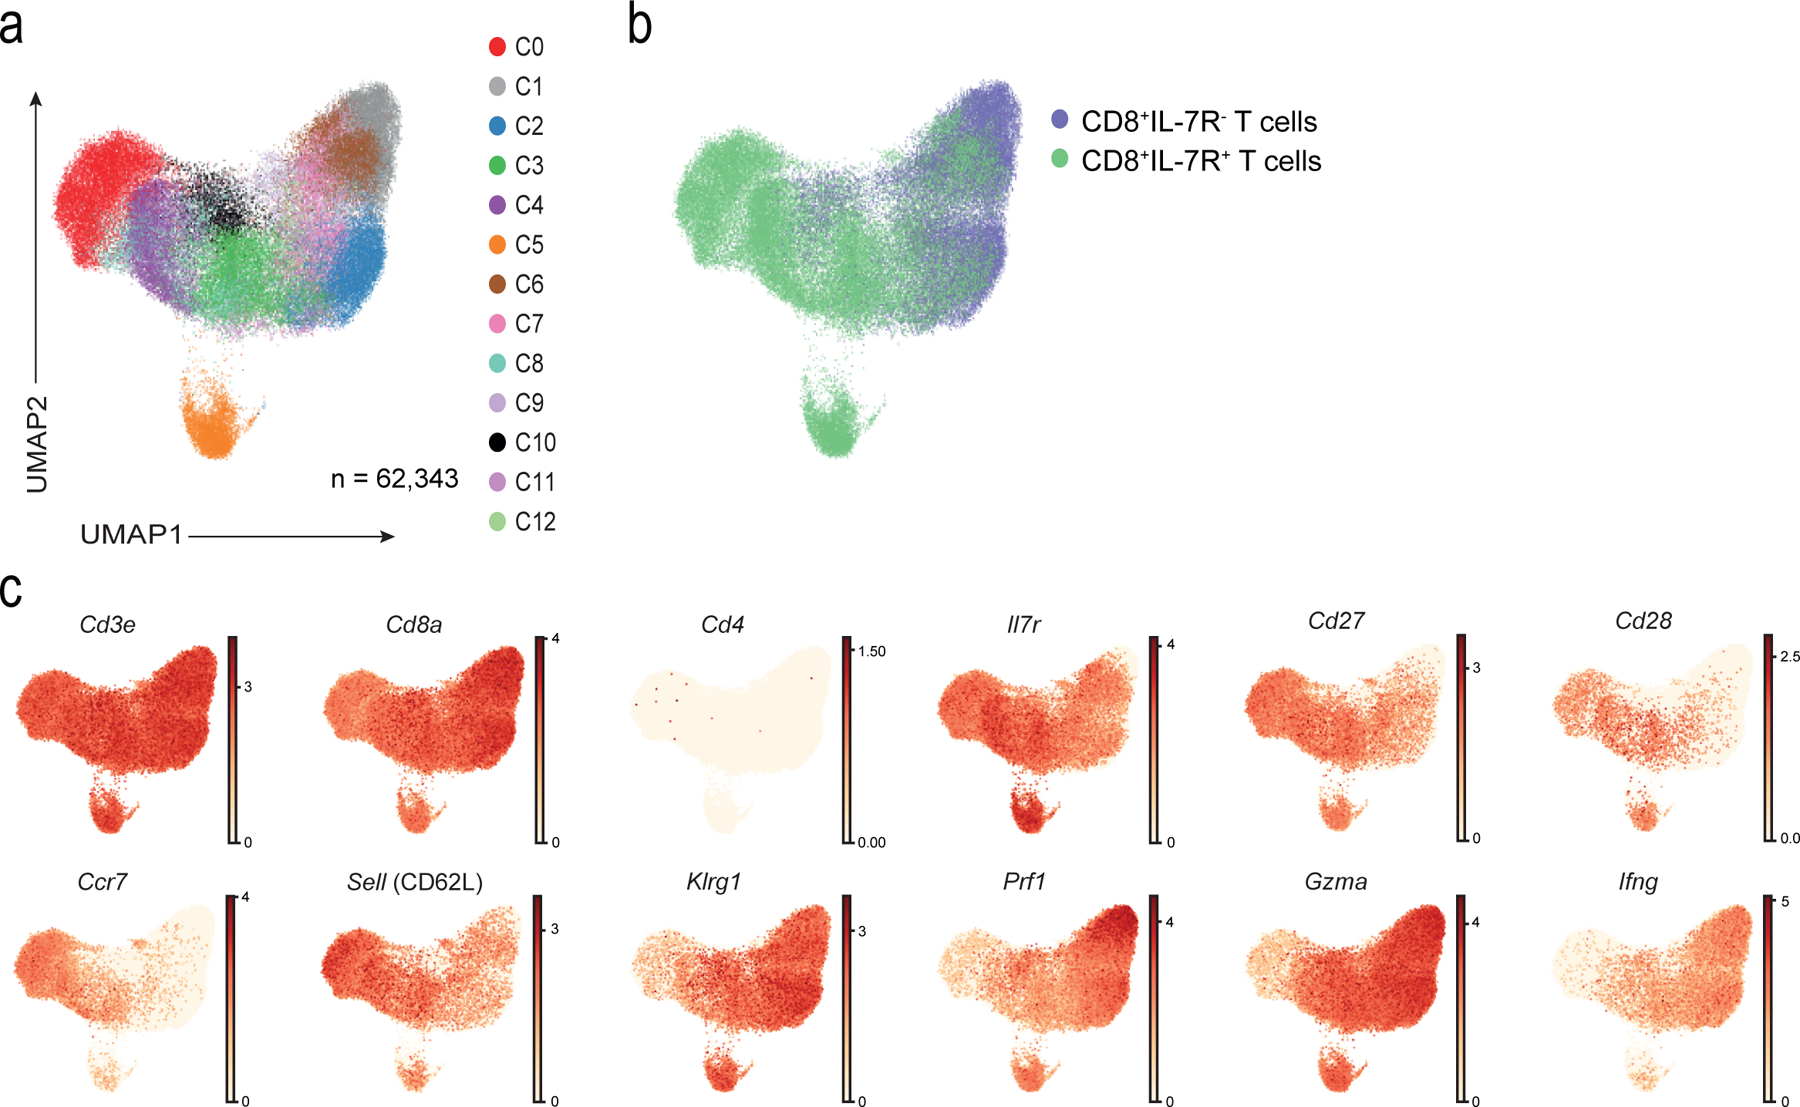
a) UMAP visualisation with clusters demarcated by colours identifying 13 CD8+ T cell clusters (C0 to C12) from RNA-seq analysis of single-cell sorted IL-7R+CD8+ (n = 37,192 single cells) and IL-7R−CD8+ (n = 25,151 single cells) T cells from six healthy older donors. b) UMAP plot from a) pseudo-coloured to show clustering of IL7-R+ (in green) and IL7-R− (in purple) CD8+ T cells as identified during sorting. c) UMAP plot from a) representing expression values of selected individual genes. Scales show low expression (yellow) to high expression (red). Other aliases or CD numbers of proteins encoded by the listed genes are shown in brackets.
Fig. 3: NK and senescence markers within TN and TEMRA.
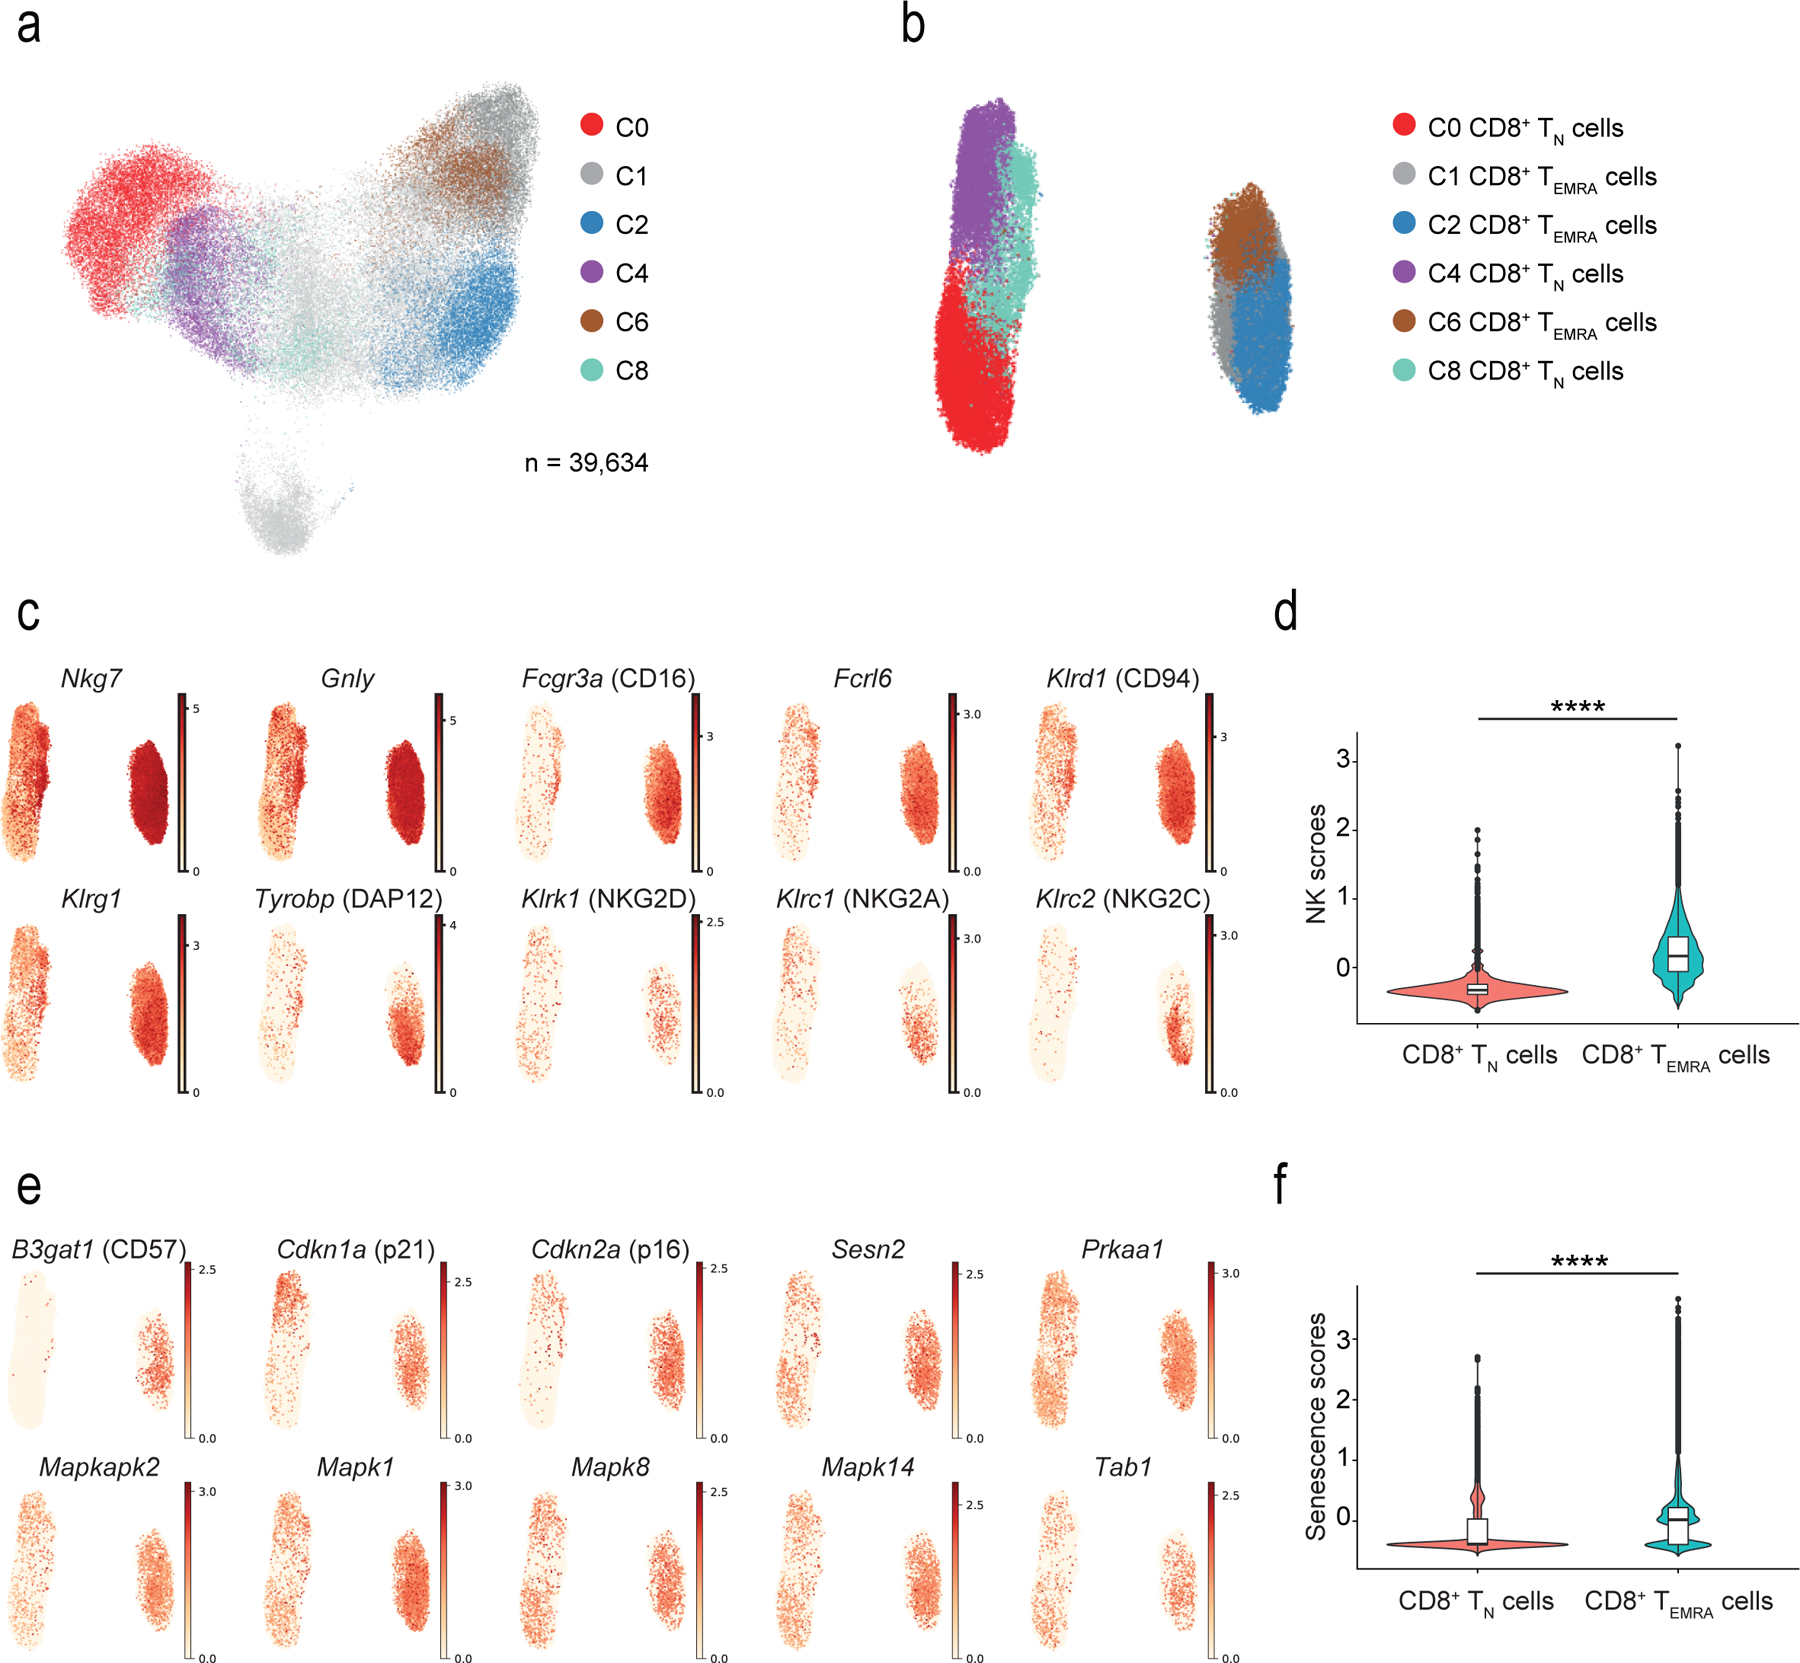
a) UMAP plot of single-cell sorted IL-7R+CD8+ and IL-7R−CD8+ T cells from six healthy older donors. Highlighted clusters were considered as TN (C0, C4 and C8) and TEMRA (C1, C2 and C6) compartments. b) UMAP plot showing re-clustering of selected TN (C0, C4, and C8) and TEMRA (C1, C2, and C6) CD8+ cells from a) (n = 39,634 cells). c) UMAP plots representing the expression values of NK-related genes in re-clustered TN and TEMRA CD8+ cells from b). Scales show low expression (yellow) to high expression (red). d) Violin plots of NK-related gene expression determined by scRNA-seq in TN and TEMRA CD8+ T cells clustered as in b) (means, range, and distribution of individual data; n = 39,364 single cells). e) UMAP plots showing expression of senescence-associated determined by scRNA-seq in TN and TEMRA CD8+ T cells re-clustered as in b). Scales show low expression (yellow) to high expression (red). Other aliases or CD numbers of some gene products are shown in brackets. f) Violin plots of senescence scores calculated based on the average normalized expression of each senescence-associated gene across TN and TEMRA CD8+ cells clustered as in b) (means, range, and distribution of individual data; n = 39,364 single cells). The gene lists used to define NK- and senescence-scores are given in Supplementary table 4).
The expression of 15 NK-associated genes, including Fcgr3a (encoding the Fcγ receptor CD16), the NK-related receptors Fcrl6, Klrc1 and −2, Klrg1 and Tyrobp (Fig. 3c) was used to define an “NK score”. This confirmed that CD8+ TEMRA cells become NK-like compared to CD8+ TN cells (Fig. 3d; Supplementary Table 4). Similarly, we used expression of senescence-related genes, such as B3gat1 (encoding the enzyme that creates the CD57 epitope), the cell cycle regulators Cdkn1a and Cdkn2a, and sMAC components such as Sesn2 and Mapk1 to create a “senescence score” to determine whether CD8+ TEMRA cell were senescent compared to CD8+ TN cells (Fig. 3e,f, Supplementary Table 4). Although expression of LCK, PLC-γ1 and LAT proteins was decreased in CD27−CD28−CD8+ T cells compared to TN CD8+ cells (Fig. 1e), the mRNA for these TCR signalling components was similar in CD8+ TEMRA and CD8+ TN cells analysed by scRNA-seq (not shown), suggesting their expression might be regulated by post-translational modification in CD27−CD28−CD8+ T cells. These observations suggested that CD8+ TEMRA cells had characteristics of cellular senescence and expressed a range of NKRs, NK adaptors and cytotoxic mediators.
NKG2D and DAP12 induce cytotoxicity in senescent CD8+ T cells
We next investigated whether CD27−CD28−CD8+ T cells had NK cell-like functions independently of TCR-MHC interactions. Based on the expression of the degranulation marker CD107a21, CD27−CD28−CD8+ T cells killed K562 cells, an MHC class I-deficient tumour cell line, with the same efficiency as NK cells (Fig. 4a). These data were confirmed using a calcein-release assay (Extended Data 5a,b). To address whether NKG2D mediated the cytotoxic activity of CD27−CD28−CD8+ T cells, we knocked down NKG2D in CD28−CD8+ T cells with a small interfering RNA (siRNA) specific for NKG2D (siNKG2D CD8+T cells) and assessed their ability to kill MHC class I-deficient C1R cells transfected with the NKG2D ligand MICA*008 (C1R-MICA cells) when co-cultured for 6 hours (Extended Data 5c,d). CD28−CD8+T cells transfected with scrambled siRNA (siCtrl) showed increased degranulation, measured by CD107a exposure, towards C1R-MICA compared to C1R cells, while the cytotoxicity of siNKG2D CD8+ T cells towards the C1R-MICA cells was inhibited compared to siCtrl (Fig. 4b), indicating that CD28−CD8+ T cells could kill target cells in a manner dependent on NKG2D.
Fig. 4: NKG2D-DAP12 complex mediates NK cytotoxicity in CD27−CD28−CD8+ T cells.
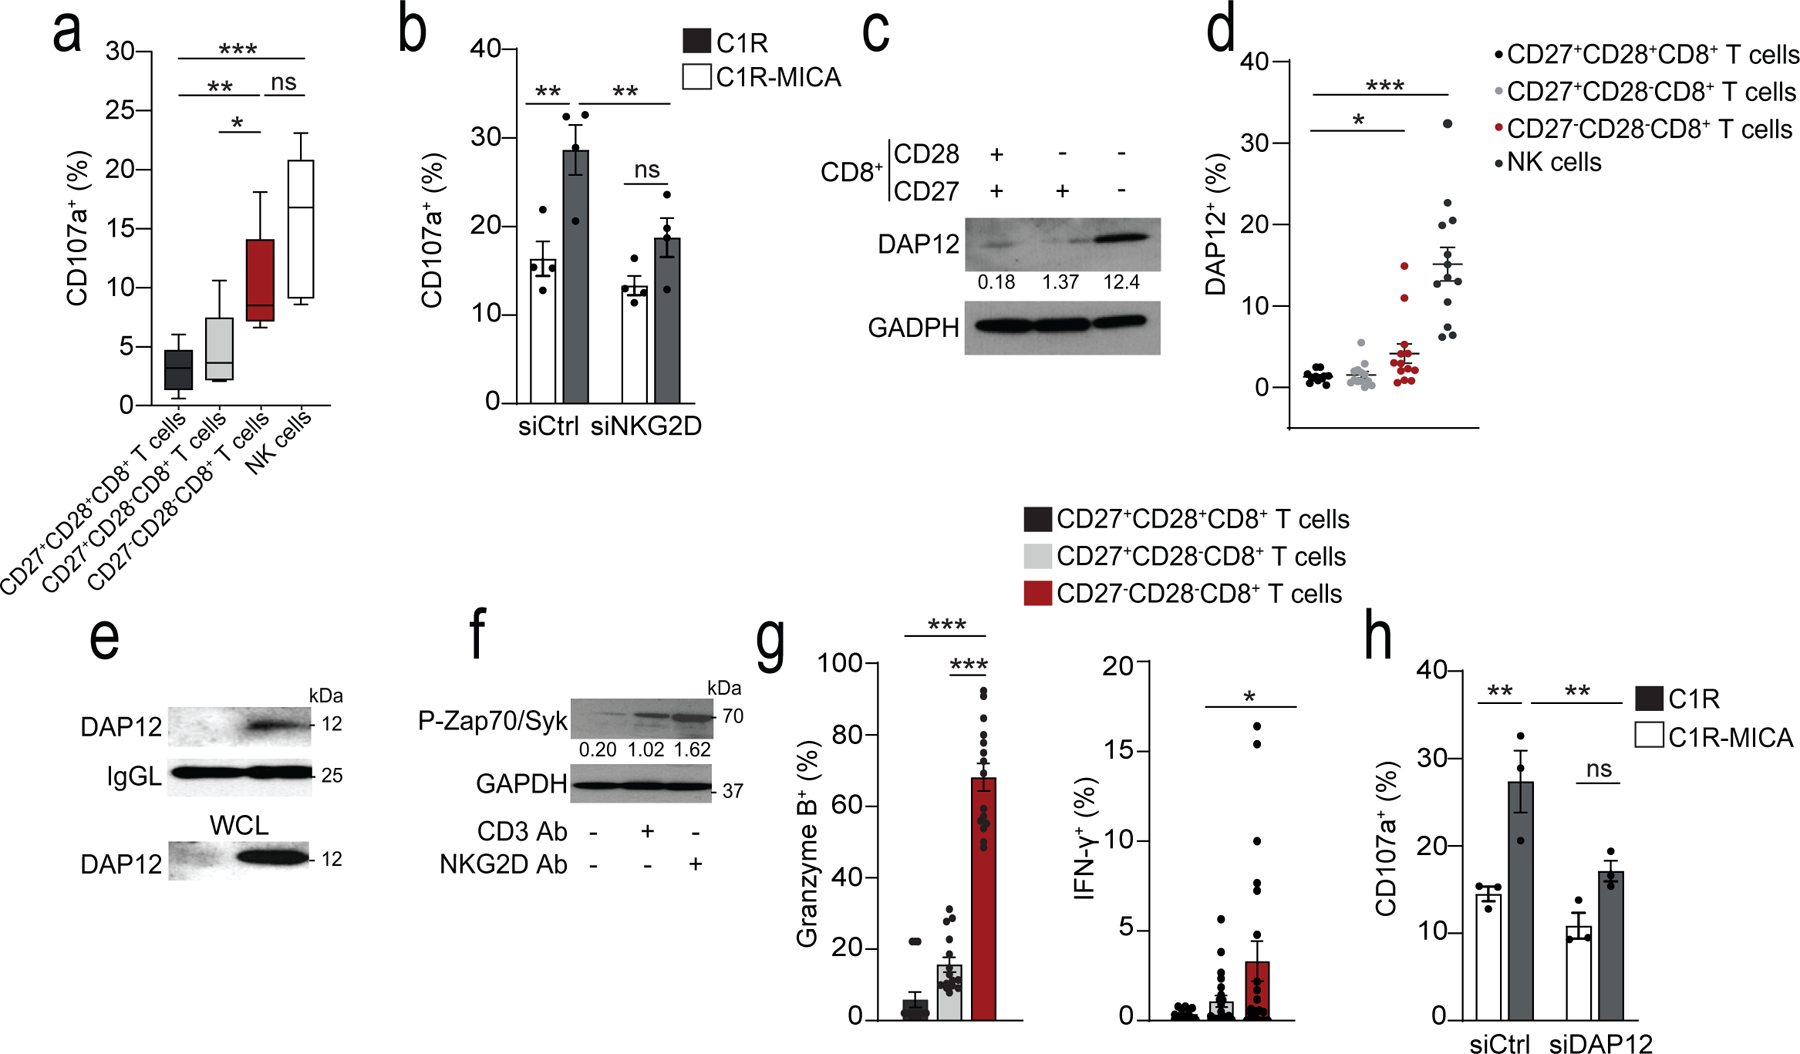
a) Box-and-whisker plot of cell-surface CD107a expression of CD27+CD28+CD8+, CD27+CD28−CD8+, CD27−CD28−CD8+, and CD3−CD56+ NK cells isolated from healthy donors co-cultured with K562 cells at E:T 2:1 (median and range, n = 5). b) CD107a expression on CD28−CD8+ T cells transfected with NKG2D siRNA (siNKG2D) or control siRNA (siCtrl) and cultured with C1R-MICA or C1R (E:T ratio 2:1) for 6 hours (mean and s.e.m., n = 4). c) Immunoblots (representative of five independent experiments with similar results) and d) flow cytometry (means and s.e.m., n = 12) showing DAP12 expression on CD27+CD28+CD8+, CD27+CD28−CD8+, CD27−CD28−CD8+, and CD3−CD56+ NK cells. g) Expression of DAP12 in lysed CD28+CD8+ T cells and CD28−CD8+ T cells co-immunoprecipitated with antibody against NKG2D. Loading control, light-chain IgG (IgGL). Whole-cell lysate immunoblot shown as a control. Representative of two independent experiments. f) Phosphorylation of Zap70(Tyr319) and Syk(Tyr352) in freshly isolated CD27−CD28−CD8+ T cells after treated with CD3 mAb (OKT3, 10 μg/mL, 15 minutes) and/or NKG2D Ab (1D11, 5 μg/mL, 15 minutes). Numbers indicate relative expression normalized to total Zap70. Representative of 2 experiments. g) Granzyme B expression (left) and IFN-γ secretion (right) in CD27+CD28+CD8+, CD27+CD28−CD8+, and CD27−CD28−CD8+ T cells after stimulation with NKG2D Ab (5 μg/mL, means and s.e.m., n = 15 donors). h) CD107a expression in human CD28−CD8+ T cells transfected with DAP12 siRNA (siDAP12) or control siRNA (siCtrl) cultured with C1R-MICA*008 or C1R cells for 6 hours (E:T ratio 2:1; means and s.e.m., n = 4). Statistical significance determined with Kruskal-Wallis test in a) Friedman test with Dunńs correction in d), two-way ANOVA with Bonferroni correction in b, j) and one-way ANOVA with Tukey’s in g) (*p <0.05, **p <0.01, ***p <0.001).
Expression of NKG2D on the cell surface requires its association with adaptor proteins that stabilise the immunoreceptor complex and provide it with signalling activity22. NKG2D associates with the adaptor molecules DAP10 and DAP12. DAP10 contains an YxxM-motif that activates PI3K23,24, while DAP12 has an ITAM-motif that can recruit and activate ZAP70-Syk triggering cytokine release and cytotoxicity25–27. In human CD8+ T cells, NKG2D is predominantly associated with DAP1023,27 (Extended Data 5e), which allows it to act as a co-stimulatory signal for the TCR. Immunoblot analysis (Fig. 4c) and intracellular flow cytometry (Fig. 4d) indicated increased expression of DAP12 in CD27−CD28−CD8+ T cells compared to CD8+ TN cells, corresponding to the transcriptomic data indicating that Tyrobp (which encodes DAP12) was strongly induced in CD8+ TEMRA cells compared to CD8+ TN cells. To investigate whether the killing activity of CD27−CD28−CD8+ T cells was mediated by DAP12 association with NKG2D, we immunoprecipitated NKG2D from CD28+CD8+ or CD28−CD8+ T cells isolated from peripheral blood of healthy donors. DAP12 associated with NKG2D only in the CD28−CD8+ T cells (Fig. 4e).
We next investigated whether ligation of NKG2D induced the phosphorylation of ZAP70-Syk in CD27−CD28−CD8+ T cells. CD3 ligation with a monoclonal antibody (mAb) against CD3 induced the phosphorylation of ZAP70-Syk, as expected, while using an NKG2D mAb alone induced more p-ZAP70 and p-Syk compared to a CD3 mAb alone (Fig. 4f), indicating that CD27−CD28−CD8+ T cells can be activated by both the TCR and NKG2D, but show an increased propensity to respond to the latter. NKG2D stimulation alone was sufficient to induce expression of granzyme B and secretion of the cytokine IFN-γ in CD27−CD28−CD8+ T cells (Fig. 4g). siRNA-mediated silencing of DAP12 in CD28−CD8+ T cells impaired the cytolytic degranulation of CD28−CD8+ T cells towards C1R-MICA cells compared to scrambled siRNA control-transfected CD28−CD8+ T cells (Fig. 4h). Thus, DAP12 expression was upregulated in CD28−CD8+ T cells and was necessary and sufficient to mediate NKG2D-dependent cytotoxicity.
Sestrins block TCR signalling but increase NKR in CD8+ T cells
CD27−CD28−CD8+ T cells have reduced proliferative activity after TCR stimulation4,5,7. We investigated whether reduced expression of the components of the CD3-TCR complex compromised the efficiency of proximal TCR signaling. Phospho-flow cytometry indicated impaired phosphorylation of CD3ζ after stimulation with CD3 antibodies in CD27−CD28−CD8+ compared to CD27+CD28+CD8+ T cells (Fig. 5a). Although the expression of total ZAP70 was increased in CD28−CD27−CD8+ T cells (Fig. 1e), its phosphorylation was impaired in these cells compared to CD28+CD27+CD8+ T cells following CD3 activation (Fig. 5b).
Fig. 5: Sestrins and Jnk MAPK dampen TCR signalling in CD27−CD28−CD8+ T cells.
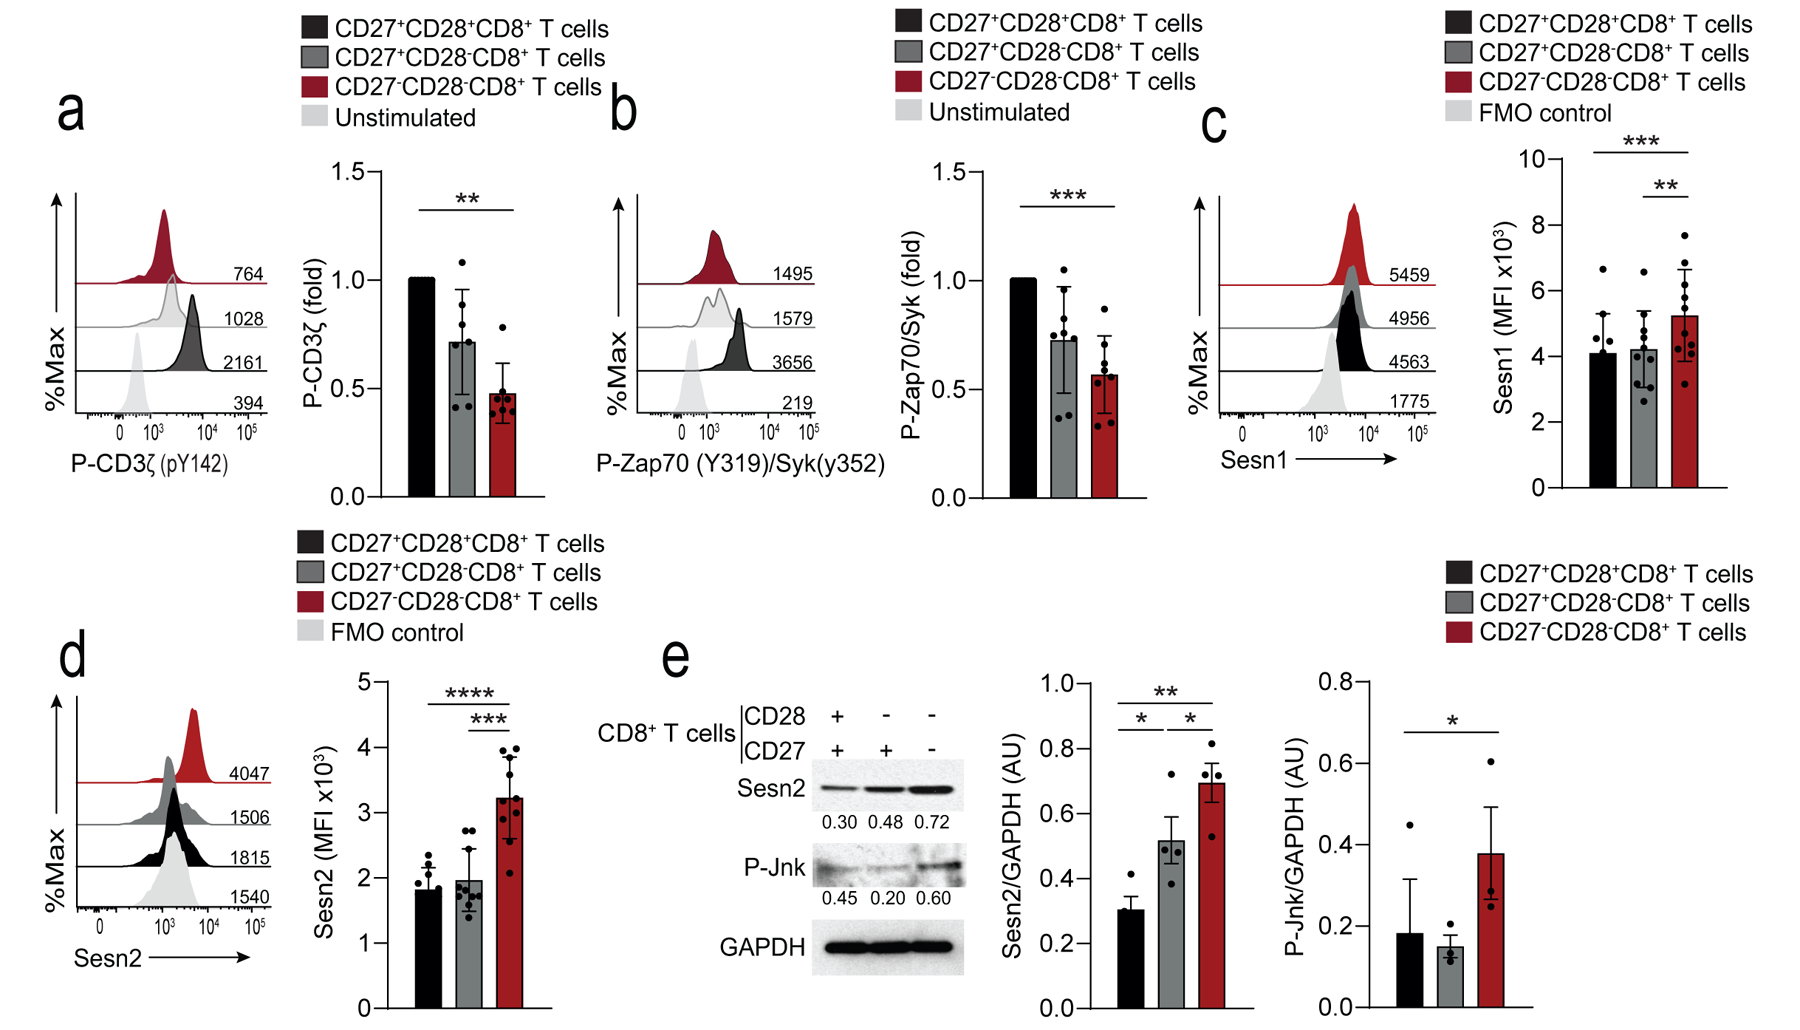
a) Representative histograms of P-CD3ζ in CD27+CD28+CD8+, CD27+CD28−CD8+, and CD27− CD28−CD8+ T cells stimulated with anti-CD3 (OKT3, 10 μg/mL, 15 minutes). Unstimulated CD27+CD28+CD8+ are shown as a control. Numbers on histograms represent the mean fluorescence intensity (MFI) for each subset. Summary data are given (means and s.d., n = 8 donors). b) Representative histograms of P-Zap70-Syk in CD27+CD28+CD8+, CD27+CD28− CD8+, and CD27−CD28−CD8+ T cells stimulated as in a). Unstimulated CD27+CD28+CD8+ are shown as a control. Numbers on histograms represent the mean fluorescence intensity (MFI) for each subset. Summary data are given (means and s.d., n = 8). Summary results presented as the MFI relative to that of DP CD8+ T cells, set to 1. c, d) Expression of Sesn1 c) and Sesn2 d) proteins determined by flow cytometry in CD27+CD28+CD8+, CD27+CD28−CD8+, and CD27−CD28−CD8+ T cells (means and s.d., n = 10 donors). e) Immunoblot of Sesn2 and p-Jnk (T183/Y185) in CD27+CD28+CD8+, CD27+CD28−CD8+, and CD27−CD28−CD8+ T cells, freshly isolated from peripheral blood of healthy donors. Representative of three independent experiments with similar results. Densitometry data from western blots for all donors is also shown (means and s.e.m., n = 3 donors for p-Jnk, n = 4 donors for Sesn2). Statistical significance determined with ANOVA with Friedman test and Dunn’s post-test correction in a-b), repeated measures one-way ANOVA with Tukey’s multiple comparisons test in c-e) (*p <0.05, **p <0.01, ***p <0.001, ****p <0.0001).
The stress-sensing proteins sestrins induce characteristics of senescence in CD4+ T cell by forming a complex with the kinase AMPK and the MAP kinases that is inhibitory for signalling through the TCR7. Flow cytometry (Fig. 5c,d) and immunoblotting (Fig. 5e) indicated that human peripheral blood CD27−CD28−CD8+ T cells from young subjects (<40 yrs) exhibited increased expression of sestrin 1 and sestrin 2 compared to CD27+CD28+CD8+ T cells. Sestrin 2 was upregulated in total CD8+ T cells from donors older than 65 years compared to those between 18–35 years (Extended Data 5f). In addition, CD27−CD28−CD8+ T cells had increased amounts of activated Jnk MAP kinase (p-Jnk) compared to CD27+CD28+CD8+ T cells (Fig. 5e). Immunoprecipitation experiments indicated that DAP12, sestrin 2 and Jnk were associated with NKG2D in CD27−CD28−CD8+ T cells (Fig. 6a), while imaging cytometry indicated that sestrin 2, DAP12 and p-Jnk co-localised in CD27−CD28−CD8+ T cells, but not in CD8+ TN cells (Fig. 6b,c). These observations suggested that sestrin 2 associated with NKG2D-DAP12-Jnk in CD27−CD28−CD8+ cells.
Fig. 6: Sestrins regulate DAP12 and NKG2D expression in CD8+ T cells.
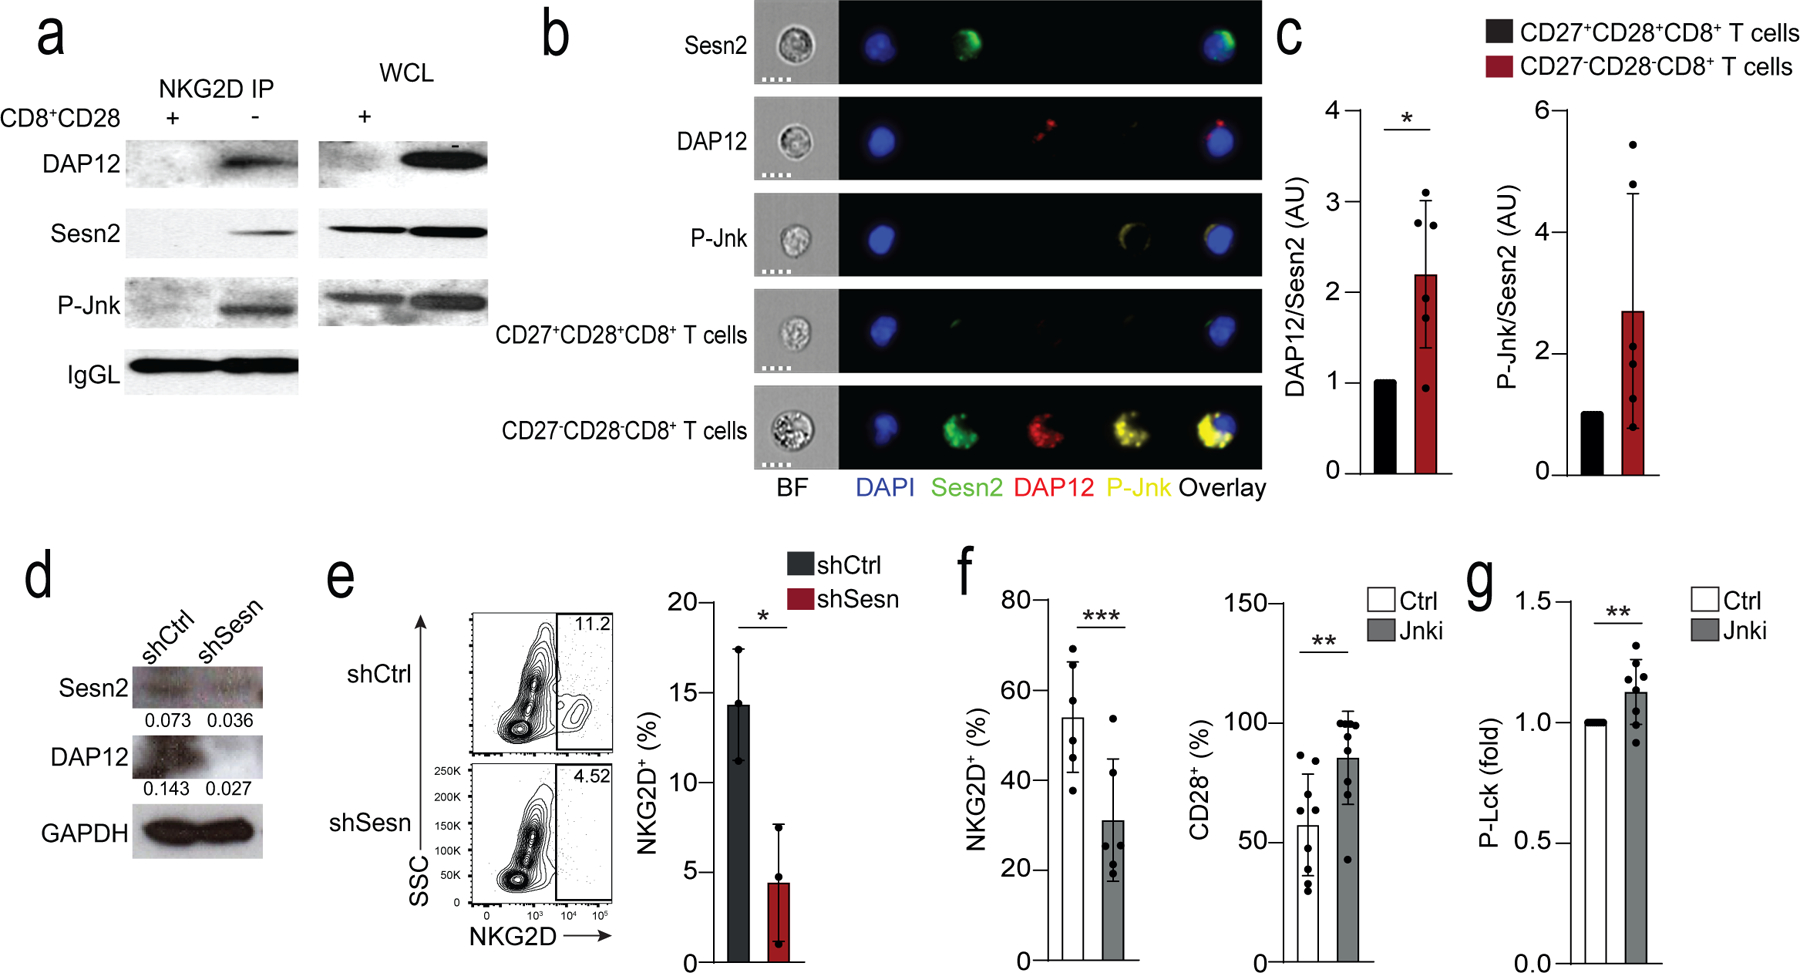
a) Expression of DAP12, sestrin 2 and p-Jnk (T183/Y185) in lysed CD28+CD8+ T cells and CD28−CD8+ T cells immunoprecipitated with NKG2D. Loading control: IgG light chain (IgGL). Results are representative of two independent experiments. b) Cellular localization of Sesn2 (AF488, green), DAP12 (PE, red) and P-Jnk (T183/Y185, AF647, yellow) in CD27+CD28+CD8+ and CD27−CD28−CD8+ T cells. “Sesn2”, “DAP12”, and “p-Jnk” denote single stain controls in CD27−CD28−CD8+. Nuclei are stained with DAPI (blue). Scale bars – 7 μm. c) Overlap of Sesn2 and DAP12 or P-Jnk in CD27+CD28+CD8+ and CD27−CD28−CD8+ T cells. Bright detail similarity scores exceeding 2 were considered to be overlapping. Data are normalized to the CD27+CD28+CD8+ T cell subset for each donor (means and s.d., n = 6). d-e) Isolated human CD8+CD28− T cells were transduced with control (shCtrl) or anti-sestrin (shSesn) vectors. d) Representative immunoblot for Sesn2 and DAP12 (representative of two experiments). e) Representative contour plots and summary data of NKG2D expression. Results are presented relative to cells transduced with shCtrl for each donor, set as 1 (means and s.d., n = 3 donors). f) Frequency of NKG2D and CD28 in isolated CD28−CD8+ T treated with siJnk (means and s.d., n = 6 donors). g) Lck phosphorylation in CD28−CD8+ T cells pre-treated with Jnk inhibitor (SP-600125, 10 μM) prior to anti-CD3 stimulation (OKT3, 10 μg/ml, 15 minutes; means and s.d., n = 8 donors). Two-tailed paired Student’s t tests in c,f-g) (*p <0.05, **p <0.01, ***p <0.001).
Next, we tested whether sestrins regulated the expression of NKG2D in human CD28−CD8+ T cells. Peripheral blood CD28−CD8+ T cells isolated from healthy donors (median age = 39; range = 25–70) were lentivirally transduced with shRNA against sestrin 1, 2 and 3 (shSesn) had significantly reduced expression of DAP12 (Fig. 6d) and NKG2D compared to CD28−CD8+ T cells transduced with control vectors (Fig. 6e), indicating sestrins modulated the expression of NKG2D in these cells. siRNA-mediated depletion of Jnk (Fig. 6f) or its inhibition with the small molecule inhibitor SP-600125 in CD28−CD8+ T cells (Fig. 6g) reduced the expression of NKG2D, increased the frequency of CD28+ cells and restored proximal TCR signalling following CD3 ligation compared to untreated CD28−CD8+ T cells (Fig. 6f,g). This indicated a reconstitution of T cell-related functions, implying sestrins may act through Jnk to induce expression of NKG2D expression in CD28−CD8+ T cells.
YFV induces the upregulation of NKR on CD8+ T cells
Next we tested if the upregulation of NKRs by CD8+ T cells occurred exclusively as a result of cellular senescence or if NKRs were expressed on less-differentiated subsets of CD8+ T cells in response to antigenic stimulation, and the expression was maintained as cells differentiated towards senescence. Using publicly available RNA-seq gene expression data generated in a cohort of 12 individuals vaccinated against yellow fever28, we compared CD8+ T effector (TE cells), defined as CD8+ YFV-tet+ cells that were present at day 14 post-vaccine, and CD8+ T memory (TM cells) defined as CD8+ YFV-tet+ cells that were present 4–13 years post-vaccine, to YFV-tet− CD8+ TN cells. Cytotoxic mediators such as Fasl, Prf1, Gzma and Gzmb were highly expressed in CD8+ TE cells and CD8+ TM cells compared to CD8+ TN T cells (Extended Data 6). Additionally, there was a significant upregulation of multiple NKRs, including many of the Kir, Fcgr3a, Cd57 and Klrc1 on CD8+ TE cells and CD8+ TM cells compared to CD8+ TN cells, as well as chemokine receptors (S1pr5, Cmklr1 and Cx3cr1) and NK adaptor proteins such as Tyrobp (Extended Data 6). The upregulation of these molecules occurred on YFV-tet+CD8+ TE cells during the effector phase of the response and was maintained in long-lived YFV-tet+ TM cells (Extended data 6). Based on published data, YFV‐tet+ TM cells lack markers of senescence like CD57, are CD27+CD28+ and are polyfunctional with regard to cytokine secretion29. Unlike the CD8+ TEMRA cells, YFV‐tet+CD8+ TM cells exhibit proliferative potential in vitro, suggesting that they are not terminally differentiated29. YFV-tet+CD8+ TE and TM cells showed slight downregulation of the TCR signalosome (Lat, Plcg1, Zap70) compared to CD8+ TN cells (Extended Data 6). Of note, sestrin 2 was upregulated in the YFV-tet+CD8+ TE and TM cells compared to CD8+ TN cells (Extended data 6). This analysis indicated that the expression of NKR on CD8+ T cells was not limited to senescent CD27−CD28−CD8 T cells but was also a feature of YFV-tet+CD8+ TE and TM cells after activation in vivo.
Sestrins regulate the function of CD8+ T cells in vivo
Sestrins regulate the decreased function of CD4+ T cells in aged mice and humans7. We next investigated if sestrins directly regulated the expression of NKRs in CD8+ T cells in young (~6 weeks) and old (~18 months) wild-type mice and old (~18 months) Sesn1−/− and Sesn2−/− mice. Mice were vaccinated subcutaneously against methylated BSA (mBSA) and re-challenged with mBSA in the footpad two weeks later to induce a delayed-type hypersensitivity (DTH) response as an index of successful immune induction. All mice mounted a DTH response to the re-challenge, but the DTH response in old wild-type, Sesn1−/− and Sesn2−/− mice resulted in increased footpad swelling compared to young wild-type mice (Fig. 7a). The response resolved more slowly in old wild-type compared to young wild-type mice, while old Sesn1−/− and Sesn2−/− mice resolved faster than old wild-type mice (Fig. 7a,b). Spleen weights were equivalent in all groups post-mBSA challenge (Extended Data 7a). There were no changes in the proportions of splenic NK cells, iNKT cells, CD4+ T cells and CD8+ T cells in all old and young mice following the DTH response (Extended Data 7b,c). However, CD44+CD62L−CD8+ T effector cells (TEFF cells) expanded, while CD44−CD62L+CD8+ TN cells decreased in old wild-type mice, but not in old Sesn1−/− and Sesn2−/− mice, compared to young wild-type mice (Extended Data 7d,e).
Fig. 7: Sestrins induce an age-dependent NK phenotype in CD8+ T cells in vivo.
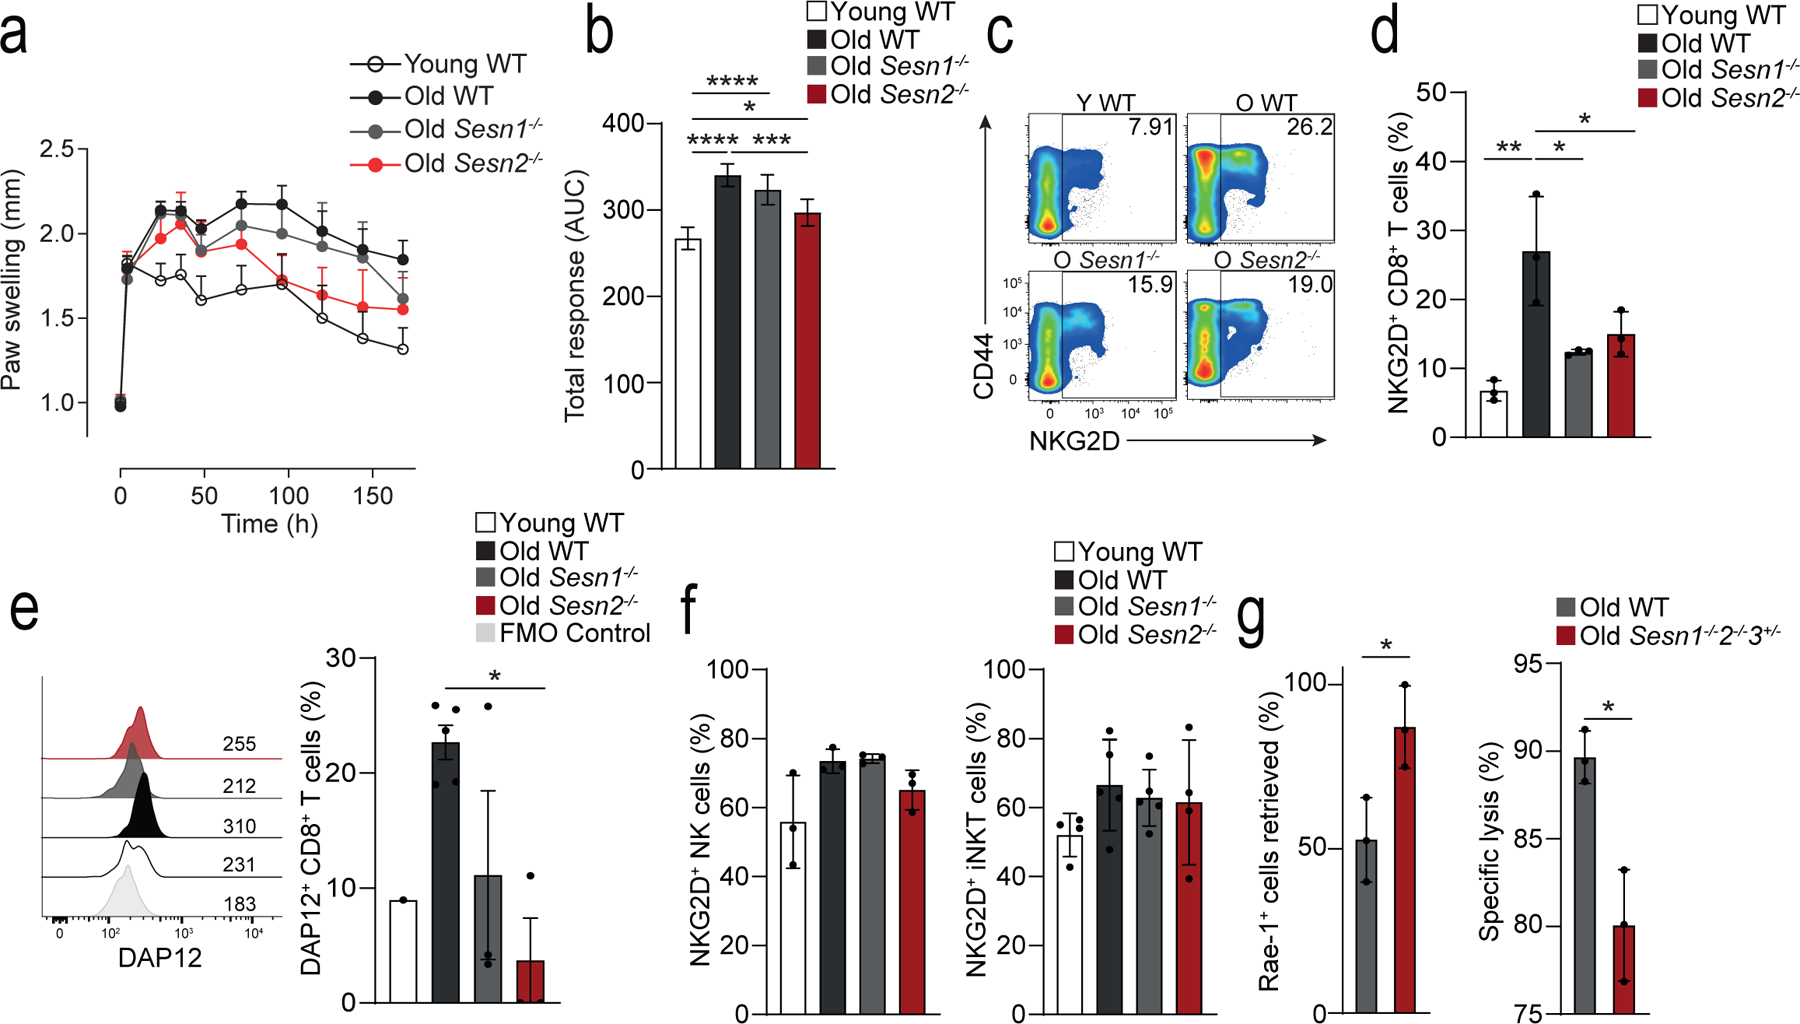
a) Measurement of paw size (normalized to the contralateral, PBS control paw) over time (0h, 4h, 24h, 36h, 2, 3, 4, 5, 6, 7 days) in young wild-type (young WT; n = 4), old WT (n = 10), old Sesn1−/− (n = 5) and old Sesn2−/− (n = 4) mice following intra-plantar treatment with mBSA. b) Area under the curve integration of the time course data shown in a) (means and s.d.) c) Representative pseudo-colour density plots showing CD44 vs NKG2D expression on TCRβ+CD3+CD8+ T cells isolated from spleens of young WT, old WT, old Sesn1−/−, and old Sesn2−/− mice. Frequencies of parent gates are shown in the top right-hand corner. d) Cumulative data of NKG2D expression in splenic TCRβ+CD3+CD8+ T cells from young WT, old WT, old Sesn1−/−, and old Sesn2−/− mice (n = 3 mice per group). e) Representative histogram of DAP12 expression from splenic TCRβ+CD3+CD8+ T cells from young WT, old WT, old Sesn1−/−, and old Sesn2−/− mice. FMO control is shown. Cumulative data shown (n = 3 per group, n = 1 young WT). f) NKG2D expression in splenic NK- and iNKT cells from the same mice as in c-d) (means and s.d., n = 3 mice per group). g) Retrieval of Rae-1+ 5TGM1 cells as a fraction of injected cells (left panel) and killing and specific lysis of injected Rae-1+ 5TGM1 cells (right panel) from the spleens of NK-depleted (24h, anti-NK1.1, i.p.) old WT and old Sesn1−/−Sesn2−/−Sesn3+/− mice 6 hours after i.v. challenge (means and s.d., n = 3 mice per group). Statistical significance determined with one-way ANOVA with Tukey’s multiple comparisons test in b,d-g); two-tailed unpaired Student’s t tests in h-i). (*p <0.05, **p <0.01, ***p <0.001, ****p <0.0001).
Expression of NKG2D and DAP12, as well as NKG2A, NKG2C, NKG2E and Ly49 was higher on the CD8+ T cells from the old wild-type mice compared to young wild-type mice, whereas their expression was lower in old Sesn1−/− and Sesn2−/− mice compared to old wild-type mice (Fig. 7c–e and Extended Data Fig. 7f), suggesting the expression of these receptors was modulated by sestrins. Importantly, the expression of NKG2D, as well as NKG2A, NKG2C, NKG2E on CD3−TCRβ−NK1.1+ NK cells or TCRβ+CD1d-tet+ iNKT cells was similar in young wild-type, old wild-type and old Sesn1−/− and Sesn2−/− mice (Fig. 7f), indicating that sestrins uniquely regulated the expression of NKRs in CD8+ T cells. To examine the effect of sestrin deficiency on the cytotoxic function of CD8+ T cells in vivo, 24-month old wild-type mice and 24-month old Sesn1−/−Sesn2−/−Sesn3+/− mice were depleted of NK cells by intra-peritoneal treatment with an NK1.1 Ab prior to intra-venous injection of equal numbers of 5tgm1 myeloma cells expressing Rae-1, the mouse equivalent of MICA/B, and Rae-1− splenocytes. Six hours post-transfer of target cells, more Rae-1+ 5TGM1 cells were detected in the spleens of Sesn1−/− Sesn2−/−Sesn3+/− mice compared to wild-type mice (Fig. 7g). This resulted from decreased specific lysis of Rae-1+ 5TGM1 target cells in Sesn1−/−Sesn2−/−Sesn3+/− mice compared to wild-type mice (Fig. 7g). These observations indicated that the sestrins regulated the expression of NKG2D and DAP12 and conferred NK cell-like cytotoxic activity to CD8+ T cells of old mice in vivo.
Discussion
Here we provide phenotypic, functional and mechanistic data to indicate that as CD8+ T cells differentiated towards senescence they lost the expression of co-stimulatory molecules such as CD28 and CD27 and downregulated TCR signalling molecules such as Lck and LAT, while upregulating the expression of NKRs such as NKG2D, NKG2A and CD16. Compared to CD28+CD27+CD8+ T cells, CD28−CD27−CD8+ T cells acquired a senescent phenotype. Expression of NKRs was associated with acquisition of the ability to kill tumour cells in vitro and in vivo through an NKR-dependent process. The downregulation of TCR-related signalling molecules concomitantly with the acquisition of NKR-related molecules was regulated by sestrins.
Altered TCR signalling pathways in iNKT and antigen-specific CD8+ T cells result in the development of unconventional functions that are not restricted to TCR-MHC interactions30,31. The suppression of TCR signalling, along with an acquired responsiveness to innate stimuli was proposed to be a characteristic that defines innate-like T cells32. Here, we found that the TCR to NKR functional switch in CD8+ T cells was dependent on the kinase Jnk, similar to previous findings in CD4+ T cells7. The mechanism by which sestrins modulate this transition remains unclear. Experiments in sestrin-deficient mice indicated that sestrins did not regulate the expression of NKRs in NK cells or iNKT cells, and it remains unclear if sestrins may regulate the function of other types of innate-like T cells e.g. γδ T cells.
The reprogramming of CD27−CD28−CD8+ T cells from TCR to NKR functional activity could be particularly relevant for CD8+ T cells specific for persistent pathogens, such as cytomegalovirus (CMV) and Epstein-Barr virus (EBV), which accumulate during ageing33–35. Our data suggest that in addition to their role in maintaining long-term specific immunity against these viruses, these cells may also recognize virus-infected cells or tumour cells through an NK cell-like, antigen-independent manner, thus enabling them to exhibit broad protective functions.
Our observations raise questions about the biological significance of such changes and the possible advantage of generating T cells with NK cell-like characteristics. The accumulation of CD8+ TEMRA cells was reported to be a predictor of successful ageing8. One reason for this may be that acquisition of NKRs by CD8+ TEMRA cells might allow them to broaden their capacity for immune surveillance by utilising different recognition systems, thereby partly compensating for decreased output of TN cells in older subjects and reduced TCR-mediated classical T cell function36. Given the increased burden of tumours and infections with age, the expansion of NK cell-like functions in CD8+ T cells could be an advantageous adaptation that would enable the recognition of transformed cells.
Senescent cells are pro-inflammatory and increase in number in many tissues during ageing37,38. The removal of these senescent tissue cells enhances organ function and retards age-related functional decline39,40. Because NK cells and CD8+ T cells can recognize and kill senescent cells via NKG2D mediated mechanisms9,10,41, NKR-expressing CD27−CD28−CD8+ T cells may participate in the surveillance and elimination of senescent tissue cells. Based on the observations here that sestrins regulate functional fate decisions in T cells, it will be important to identify if these molecules also have similar roles in other cell types.
It is important to know when the expression of sestrins and NKRs are induced on T cells after vaccination. Gene expression studies in YFV-specific CD8+ T cells from previously non-immunized young individuals (<40 years) vaccinated with the yellow fever virus vaccine showed that expression of NKRs and sestrins was upregulated in the effector phase of the response (2 weeks post-vaccination) and maintained in the CD8+ TM cells for years afterwards28,29. This indicates that sestrins are not only induced when CD27−CD28−CD8+ T cells become senescent. Naïve CD27+CD28+ T cells within the CD4 compartment of old individuals (>65 yrs) have been shown to express a significantly higher level of sestrins than naïve CD27+CD28+CD4+ T cells from young individuals7 suggesting that this molecule will have an impact on vaccine responses, that induce the expansion of naïve T cell precursors, during ageing. It is not clear if naïve YFV-specific CD8+ T cell precursors in old humans express higher levels of sestrins and if these cells can be activated optimally after vaccination. Nevertheless, it has been shown that in old mice, sestrin inhibition can enhance the number of influenza-specific CD4+ T cells after influenza vaccination in vivo7. This may be a strategy to also enhance the response to other vaccines during ageing. A caveat is that the long-term blockade of sestrins with either specific inhibitors or by transfection with inhibitory shRNA may be dangerous, as it could enhance the proliferation of senescent-like T cells that harbour DNA damage. However, the temporary blockade of sestrins may be a safe strategy to increase the number of antigen-specific T cells after vaccination to enhance immunity during ageing7.
Materials and Methods
Study design
The study protocol was approved by the Ethical Committee of the Royal Free and University College London Medical School (Research Ethics number: 11/0473). Written informed consent was obtained from all study participants. Donors did not have any co-morbidity, were not on any immunosuppressive drugs, and retained physical mobility and lifestyle independence. For analyses involving the CD8+ T cell, IL-7R+/IL-7R− single cell dataset studies were conducted following approval by the Institutional Review Board (IRB) of the University of Connecticut Health Center (IRB 14–194J-3). After receiving informed consent, blood samples were obtained from 6 healthy old (>65 year old) research volunteers residing in the Greater Hartford, CT, region using services of the University of Connecticut Center on Aging Recruitment and Community Outreach Research Core and following previously published screening criteria (PMID:28904110).
Cell isolation and transfection
Peripheral blood mononuclear cells (PBMC) were isolated by density gradient (Ficoll–Hypaque, Amersham Biosciences, UK) from heparinized blood of healthy donors (n = 22, 26–83 years). Untouched NK and CD8+ T cells were freshly isolated by magnetic activated cell sorting (MACS, Miltenyi Biotec, UK) using a negative selection procedure. For microarray analysis, high-purity CD8+ T cell subsets were sorted on the basis of CD27 and CD45RA expression42, using a FACSAria (BD Biosciences, UK) flow cytometer. For functional assays, CD8+ T cell subsets were freshly isolated according to CD27/CD28 expression by magnetic activated cell sorting (MACS, Miltenyi Biotec, UK), which identified analogous subsets but provided higher yields of viable cells (> 95% purity) as previously described5,7. Double negative cells were obtained by complete negative isolation. We found that <1% of cells within these isolated populations expressed iNKT markers. Mucosal associated invariant T cells (MAIT) cells express TCR Vα7.2 and these cells constitute ~5% of the peripheral CD8+ T cells pool in humans43. We found 4% (range 1–7.5%) of these cells in isolated CD28+ CD27+, 3% (range 1–6.4) in the isolated CD28−CD28+ and 2.9% (range 1–4.9%) in the isolated CD28−CD27−CD8+ T cells populations. The results obtained are therefore unlikely to be due to contaminating iNKT or MAIT cells in our CD8+ T cells populations.
Where indicated, freshly purified human CD8+ T cells were transfected with small interfering RNA (siRNA) for NKG2D (Santa Cruz Biotechnology, sc-42948) or DAP12 (sc-35172) by electroporation using the Amaxa Human NK Cell Nucleofector Kit and Nucleofector technology (Lonza), according to the manufacturer’s instructions. A scrambled control siRNA (sc-37007; Santa Cruz) was used throughout. Efficiency of siRNA transfection was confirmed by measuring the expression of the protein of interest using flow cytometry, 36–48 hours after transfection.
Microarray data acquisition
Cells purified by FACS were stimulated for 2 hours with 0.5 μg/ml plate-coated anti-CD3 (OKT3) and 5 ng/ml rhIL-2 before RNA isolation using the ARCTURUS PicoPure Isolation Kit (ThermoFisher). The concentration of small quantities of RNA was determined using Nanodrop. Linear amplification of 10 ng of total RNA was performed using the Ovation Biotin RNA amplification and labelling system (NuGEN). Fragmented, labelled cDNA was hybridized to Affymetrix U133 plus 2 arrays.
Single cell RNA sequencing
Sample processing:
all samples were processed within one hour from venipuncture.
Cell Sorting:
PBMCs were isolated from fresh whole blood using Ficoll-Paque Plus (GE) density gradient centrifugation. For cell sorting, we used fluorochrome-labeled antibodies specific for CD3 (UCHT1), CD27 (M-T271) (Biolegend), CD4 (RPA-T4), CD19 (HIB19), IgD (IA6–2), CD127 (HIL-7R-M21) (BD Biosciences), and CD8 (SCF121Thy2D3) (Beckman-Coulter). CD8+IL7R+ (CD8+CD127+) and CD8+IL7R− (CD8+CD127−) T cells were sorted from the CD19−CD3+CD4− fraction. Cell sorting was performed using FACSAria Fusion (BD).
Blood preparation for single cell RNA sequencing (scRNA-seq):
PBMCs were thawed quickly at 37°C and transferred to DMEM supplemented with 10% FBS. Cells were spun down at 400 g, for 10 min. Cells were washed once with 1 x PBS supplemented with 0.04% BSA and finally re-suspended in 1 x PBS with 0.04% BSA. Viability was determined using trypan blue staining and measured on a Countess FLII and samples with <80% viability were discarded. 12,000 cells were loaded for capture onto the Chromium System using the v2 single cell reagent kit (10X Genomics). Following capture and lysis, cDNA was synthesized and amplified (12 cycles) as per manufacturer’s protocol (10X Genomics). The amplified cDNA was used to construct an Illumina sequencing library and sequenced on a single lane of a HiSeq 4000.
Single cell Raw data processing and data combination:
Illumina basecall files (*.bcl) were converted to fastqs using cellranger v2.1.0, which uses bcl2fastq v2.17.1.14. FASTQ files were then aligned to hg19 genome and transcriptome using the cellranger v2.1.0 pipeline, which generates a gene - cell expression matrix. The samples were merged together using cellranger aggr from cellranger, which aggregates outputs from multiple runs, normalizing them to the same sequencing depth (normalize=mapped) and then re-computing the gene-barcode matrices and analysis on the combined data (See scripts here: https://github.com/dnehar/Temra-IL7R-Senescence).
Scrublet for multiplet prediction and removal:
Generally, we expected about 2 to 8% of the cells to be hybrid transcriptomes or multiplets, occurring when two or more cells are captured within the same microfluidic droplet and are tagged with the same barcode. Such artifactual multiplets can confound downstream analyses. We applied Scrublet44 python package to remove the putative multiplets. Scrublet assigns each measured transcriptome a ‘multiplet score’, which indicates the probability of being a hybrid transcriptome. Multiplet scores were determined for each individual (using the raw data), and 0.7% - 10.7% highest scoring cells were tagged as multiplets after visual inspection of doublet score distributions and excluded from the further analysis.
Single cell processing, clustering and cell type classification:
The aggregated matrices were fed into the Python-based ScanPy45 workflow (https://scanpy.readthedocs.io/en/stable/), which includes preprocessing, visualization, clustering and differential expression testing. The pipeline we used was inspired by The Seurat46 R package workflow.
Quality control and cell-filtering:
We applied the following filtering parameters: (i) all genes that were not detected in ≥ 3 cells were discarded, (ii) cells with less than 400 total unique transcripts were removed prior to downstream analysis, (iii) cells in which > 20% of the transcripts mapped to the mitochondrial genes were filtered out, as this can be a marker of poor-quality cells and (iv) cells displaying a unique gene counts > 2,500 genes were considered outliers and discarded.
Data normalization:
After discarding unwanted cells from the dataset, we normalized the data. Library-size normalization was performed based on gene expression for each barcode by scaling the total number of transcripts per cell to 10,000. We log-transformed the data and then regressed out using the total number of genes and the fraction of mitochondrial transcript content per cell. 1202 highly variable genes (HVG) were identified using filter_genes_dispersion scanpy function and used to perform the principal component analysis (PCA).
Linear dimensional reduction using PCA and graph-based clustering:
Dimensionality reduction was carried out in SCANPY via principal component analysis followed by Louvain clustering UMAP visualization using the top 40 significant components (PCs)47.
Finding marker genes/evaluation of cluster identity:
To annotate the cell type of each single cell transcriptome, we used both differential expression analysis between clusters and classification based on putative marker gene expression. We applied the ‘tl.rank_genes_groups’ scanpy function to perform differential analyses, comparing each cluster to the rest of the cell using Wilcoxon test (Supplementary Table 3). We only considerate clusters that showed a distinct trancriptomic programs.
Batch effect correction:
We performed a batch (10X genomics batch) correction using BBKNN (https://github.com/Teichlab/bbknn)48. More details about the parameters used can be found as a Jupyter notebook here: https://github.com/dnehar/Temra-IL7R-Senescence.
NK and Senescence scores:
Gene lists (Table S3) were used to score NK or senescence expression in naïve and Temras CD8 T cells. To do so, we calculated the mean expression for each cell, within each cluster using the h5ad object (adata), as follow:
adata.obs[‘NK_score] = adata.X[:,NK_markers].mean(1).
The scores were then plotted, as shown in Fig .3D.
Lentiviral transduction
Sestrin knockdown in human CD8+ T cells was achieved using a lentiviral transduction system as described previously9.
The pHIV1-SIREN-GFP system used for knockdown of gene expression possesses a U6-shRNA cassette to drive shRNA expression and a GFP reporter gene that is controlled by a PGK promoter5. The following siRNA sequences were used for gene knockdowns: CCTAAGGTTAAGTCGCCCTCG (shCTRL), CCAGGACCAATGGTAGACAAA (shSesn1), CCGAAGAATGTACAACCTCTT (shSesn2) and CAGTTCTCTAGTGTCAAAGTT (shSesn3). VSV-g pseudotyped lentiviral particles were produced, concentrated and titrated in HEK293 cells as described9.
Cells were cultured in RPMI-1640 medium supplemented with 10% heat-inactivated FCS, 100 U/ml penicillin, 100 mg/ml streptomycin, 50 μg/ml gentamicin, 2 mM L-glutamine (all from Invitrogen) and 0.5 ng/ml anti-mycoplasma (Bio-Rad) at 37 °C in a humidified 5% CO2 incubator. Purified human highly differentiated CD28−CD8+ T cells were activated in the presence of plate-bound anti-CD3 (purified OKT3, 0.5 μg/ml) plus rhIL-2 (R&D Systems, 10 ng/ml), and then transduced with pHIV1-Siren lentiviral particles (multiplicity of infection (MOI) = 10) 72 h after activation.
Flow cytometry and phospho-flow
Multi-parameter flow cytometry was used for phenotypic and functional analyses of PBMC. For analysis of surface markers, staining was performed at 4°C for 30 min in the presence of saturating concentrations of antibodies (listed in Supplementary table 5) and a live/dead fixable Near-Infrared stain (Thermo Scientific, L10119). For intracellular analysis of cytokine secretion, cytotoxic granule expression, and sestrin 1, sestrin 2, DAP12, and DAP10 expression, cells were fixed and permeabilized with the Fix & Perm® Kit (Invitrogen, Life Technologies, UK), before incubation with indicated antibodies or the respective isotype controls. For imaging cytometry, samples were acquired on an Amnis ImageStreamX Mk2 using INSPIRE software, magnification 60X. Data were analysed using IDEAS v6.2 software (Amnis). Co-localization of signals was determined on a single cell basis using bright detail similarity (BDS) score analysis. Co-localization was considered with BDS ≥ 2.0.
For Phospho-Flow cytometry, after staining for surface markers, CD8+ T cells were stimulated with anti-CD3 (purified OKT3, 10 μg/mL) for 30 minutes on ice, followed by crosslinking with goat anti–mouse IgG antibody during 30 minutes on ice. Cells were then transferred to an incubator at 37°C, and stimulation was terminated after 10 minutes, with immediate fixation with Cytofix Buffer (PBS containing 4% paraformaldehyde, BD Biosciences) followed by permeabilization with ice-cold Perm Buffer III (PBS containing 90% methanol, BD Biosciences) and staining with antibodies for phospho-proteins (listed in Supplementary table 5) for 30 minutes at room temperature. Samples were acquired on a LSR II flow cytometer (BD Biosciences) and analysed using FlowJo software (TreeStar).
Cytotoxic assays - CD107a degranulation assay
Freshly isolated NK and CD8+ T cell subsets were incubated at 37°C for 6 h with K562 or C1R-MICA/C1R cells, at a fixed effector to target (E:T) ratio of 2:1, in the presence of APC-conjugated CD107a antibody (BD Biosciences), as previously described68. Brefeldin A (1μg/ml; Sigma-Aldrich) and Monensin (1 μg/ml; Sigma-Aldrich) were added in the final 5h-incubation period. Effector cells incubated alone in the presence phorbol-12-myristate-13-acetate (PMA, 50 ng/ml, Sigma-Aldrich) with ionomycin, (250 ng/ml, Sigma-Aldrich) were used as positive control whereas medium alone served as unstimulated (US) control. After incubation, cells were stained for surface markers for 30 min on ice, followed by intracellular detection of cytokines (TNF-α and IFN-γ) and CD107a expression and analysed by flow cytometry.
Cell lines
K562 (human erythroleukemic) cell line was purchased from the European Collection of Cell cultures (ECCAC, UK) and cultured in 25 cm2 flasks (Nunc) in complete RPMI-1640. B-lymphoblastoid cell lines, C1R and C1R transfected with MICA*008 (C1RMICA) were kindly provided by Professor Antoine Toubert (INSERM UMR1160, Paris) and maintained in complete RPMI-1640 in the presence of the aminoglycoside antibiotic G-418 (Sigma, G8168) for selection of transfected cells49.
Immunoblotting
Human CD8+ T cell subsets purified using immunomagnetic separation (MACS) according to CD27/CD28 expression were stimulated with anti-CD3 (purified OKT3, 10 μg/mL) or anti-NKG2D (1D11, 10 μg/mL) before lysis. Cells were normalized by equal cell number, harvested and lysed in ice-cold Radio-Immunoprecipitation Assay (RIPA) buffer (Sigma-Aldrich, UK), supplemented with protease and phosphatase inhibitors (GE Healthcare, Amersham, UK), during 30 minutes on ice. Cell lysates were processed for immunoblot analysis as described6.
Immunoprecipitation
Human CD8+ T cells were separated into CD28+/CD28− fractions (to obtain sufficient number of cells for analysis) and stimulated with anti-NKG2D (1D11, 10 μg/mL) or isotype control, for 30 minutes at 4 °C. Lysates from 1×10⁷ cells were prepared with ice-cold HNGT buffer (50 mM HEPES, pH 7.5, 150 mM EDTA, 10 mM sodium pyrophosphate, 100 mM sodium orthovanadate, 100 mM sodium fluoride, 10 mg/ml aprotinin, 10 mg/ml leupeptin and 1 mM phenylmethylsulfonyl fluoride), for 30 minutes on ice. Cell lysates were incubated overnight at 4°C with anti-NKG2D antibody (clone 5C6, Santa Cruz) or control antibody, followed by precipitation with 10 μL of pre-washed protein A/G agarose beads (sc-2003, Santa Cruz) for 3 h at 4°C on a rotary shaker. After extensive washing in HGNT buffer, supernatants were recovered and processed for immunoblot analysis, as described above. Co-Immunoprecipitated proteins were detected after incubation with primary antibodies followed by incubation with mouse anti-rabbit IgG (conformation-specific antibody; L27A9; Cell Signaling) or mouse anti-rabbit IgG light chain (L57A3; Cell Signaling) and by a secondary anti-mouse IgG antibody (7076; Cell Signaling).
Mice
Sesn1−/− and Sesn2−/− mice were described previously7. The mouse ageing study was performed at the University of Michigan, where the animal procedures were approved by the Institutional Animal Care & Use Committee and overseen by the Unit for Laboratory Animal Medicine. All mice were rested for at least 10 days before being used for in vivo studies. Animals were housed under standard conditions, maintained in a 12 h/12 h light/dark cycle at 22 oC ± 1 oC and given food and tap water ad libitum in accordance with United Kingdom Home Office regulations (PPL-P69E3D849) and the NIH guideline.
Murine delayed type hypersensitivity model
Knockout and age-matched (18-month-old) C57BL66J WT control mice were imported from the University of Michigan. Young (~6 weeks) WT mice were purchased separately from Charles River. All mice were male. The methylated BSA (mBSA) delayed type hypersensitivity model was performed as described previously50. Mice were sensitized at the base of the tail with a 50 μl injection of mBSA in Freund’s complete adjuvant (20 mg/ml solution of mBSA in saline emulsified with an equal volume of Freund’s adjuvant containing 4 mg/ml Mycobacterium tuberculosis H37Ra, Sigma Aldrich). An immune response was evoked 14 days later by subplantar challenge with 50 μl of mBSA in saline (1 mg/ml). The contralateral paw received a saline-only injection and served as a control. The immune response is reported as the difference in paw swelling between left and right paws as determined using callipers (POCO2, Kroeplin). Mice were sacrificed 7 days post-challenge, according to Schedule 1, using an increasing concentration of CO2. Death was confirmed by cervical dislocation. Spleens and inguinal lymph nodes were obtained, weighed and dispersed through a 70 μm followed by a 35 μm sterile cell sieve (Becton Dickinson) to yield single cell suspensions. Cell numbers were enumerated by haemocytometer and up to 106 cells were used for polychromatic flow cytometry.
In vivo cytotoxicity
24-month-old knockout (Sesn1−/−Sesn2−/−Sesn3+/−) males were imported from the University of Michigan. Age-matched wild type female C57Bl/6J mice were purchased from Envigo. Natural killer cells were depleted by intraperitoneal injection of 100 μg anti-NK1.1 antibody (PK136, BioXCell) 24 hours before cell challenge. The high Rae-1 expressing myeloma cell line 5TGM was labeled with 5 μM CFSE, while splenocytes stained with 0.5 μM were used as Rae-1− controls. Both cell types were mixed at equal ratios and 2×10⁷ were co-injected i.v. Mice were left for 6 hours before being sacrificed. As a measure of Rae-1 directed killing, the ratio of CFSEhi compared to CFSElo was used to determine Rae-1+ cell retrieval and specific lysis.
Statistical analysis
Statistical analysis was performed using GraphPad Prism version 6.00. Tests were used to determine data distribution and depending on the normality of the data, comparisons were performed using the Student t test (for two groups, parametric) or the non-parametric Mann–Whitney U test (for two groups, unpaired) and the Wilcoxon signed rank test (for two groups, paired) with two-tailed P values unless otherwise stated. When comparing more than two groups, we used one-way ANOVA (parametric, > 2 groups, unpaired), repeated measures ANOVA (parametric, > 2 groups, paired), Kruskal–Wallis (non-parametric, > 2 groups, unpaired) or Friedman (non-parametric, > 2 groups, paired) tests with post-correction for multiple comparisons, as appropriate. The two-way ANOVA test was used to compare the effects of two independent variables between groups. Linear regression analysis was performed to generate lines of best fit and correlations between variables were analysed using Pearson´s or Spearman’s rank correlation coefficient (r). Differences were considered significant when p <0.05 (*), p <0.01 (**), p <0.001(***) and p <0.0001 (****). Data are presented as means ± standard error of the mean (SEM) unless otherwise stated.
Extended Data
Extended data 1: CD8+ T cell gating and NKR expression.
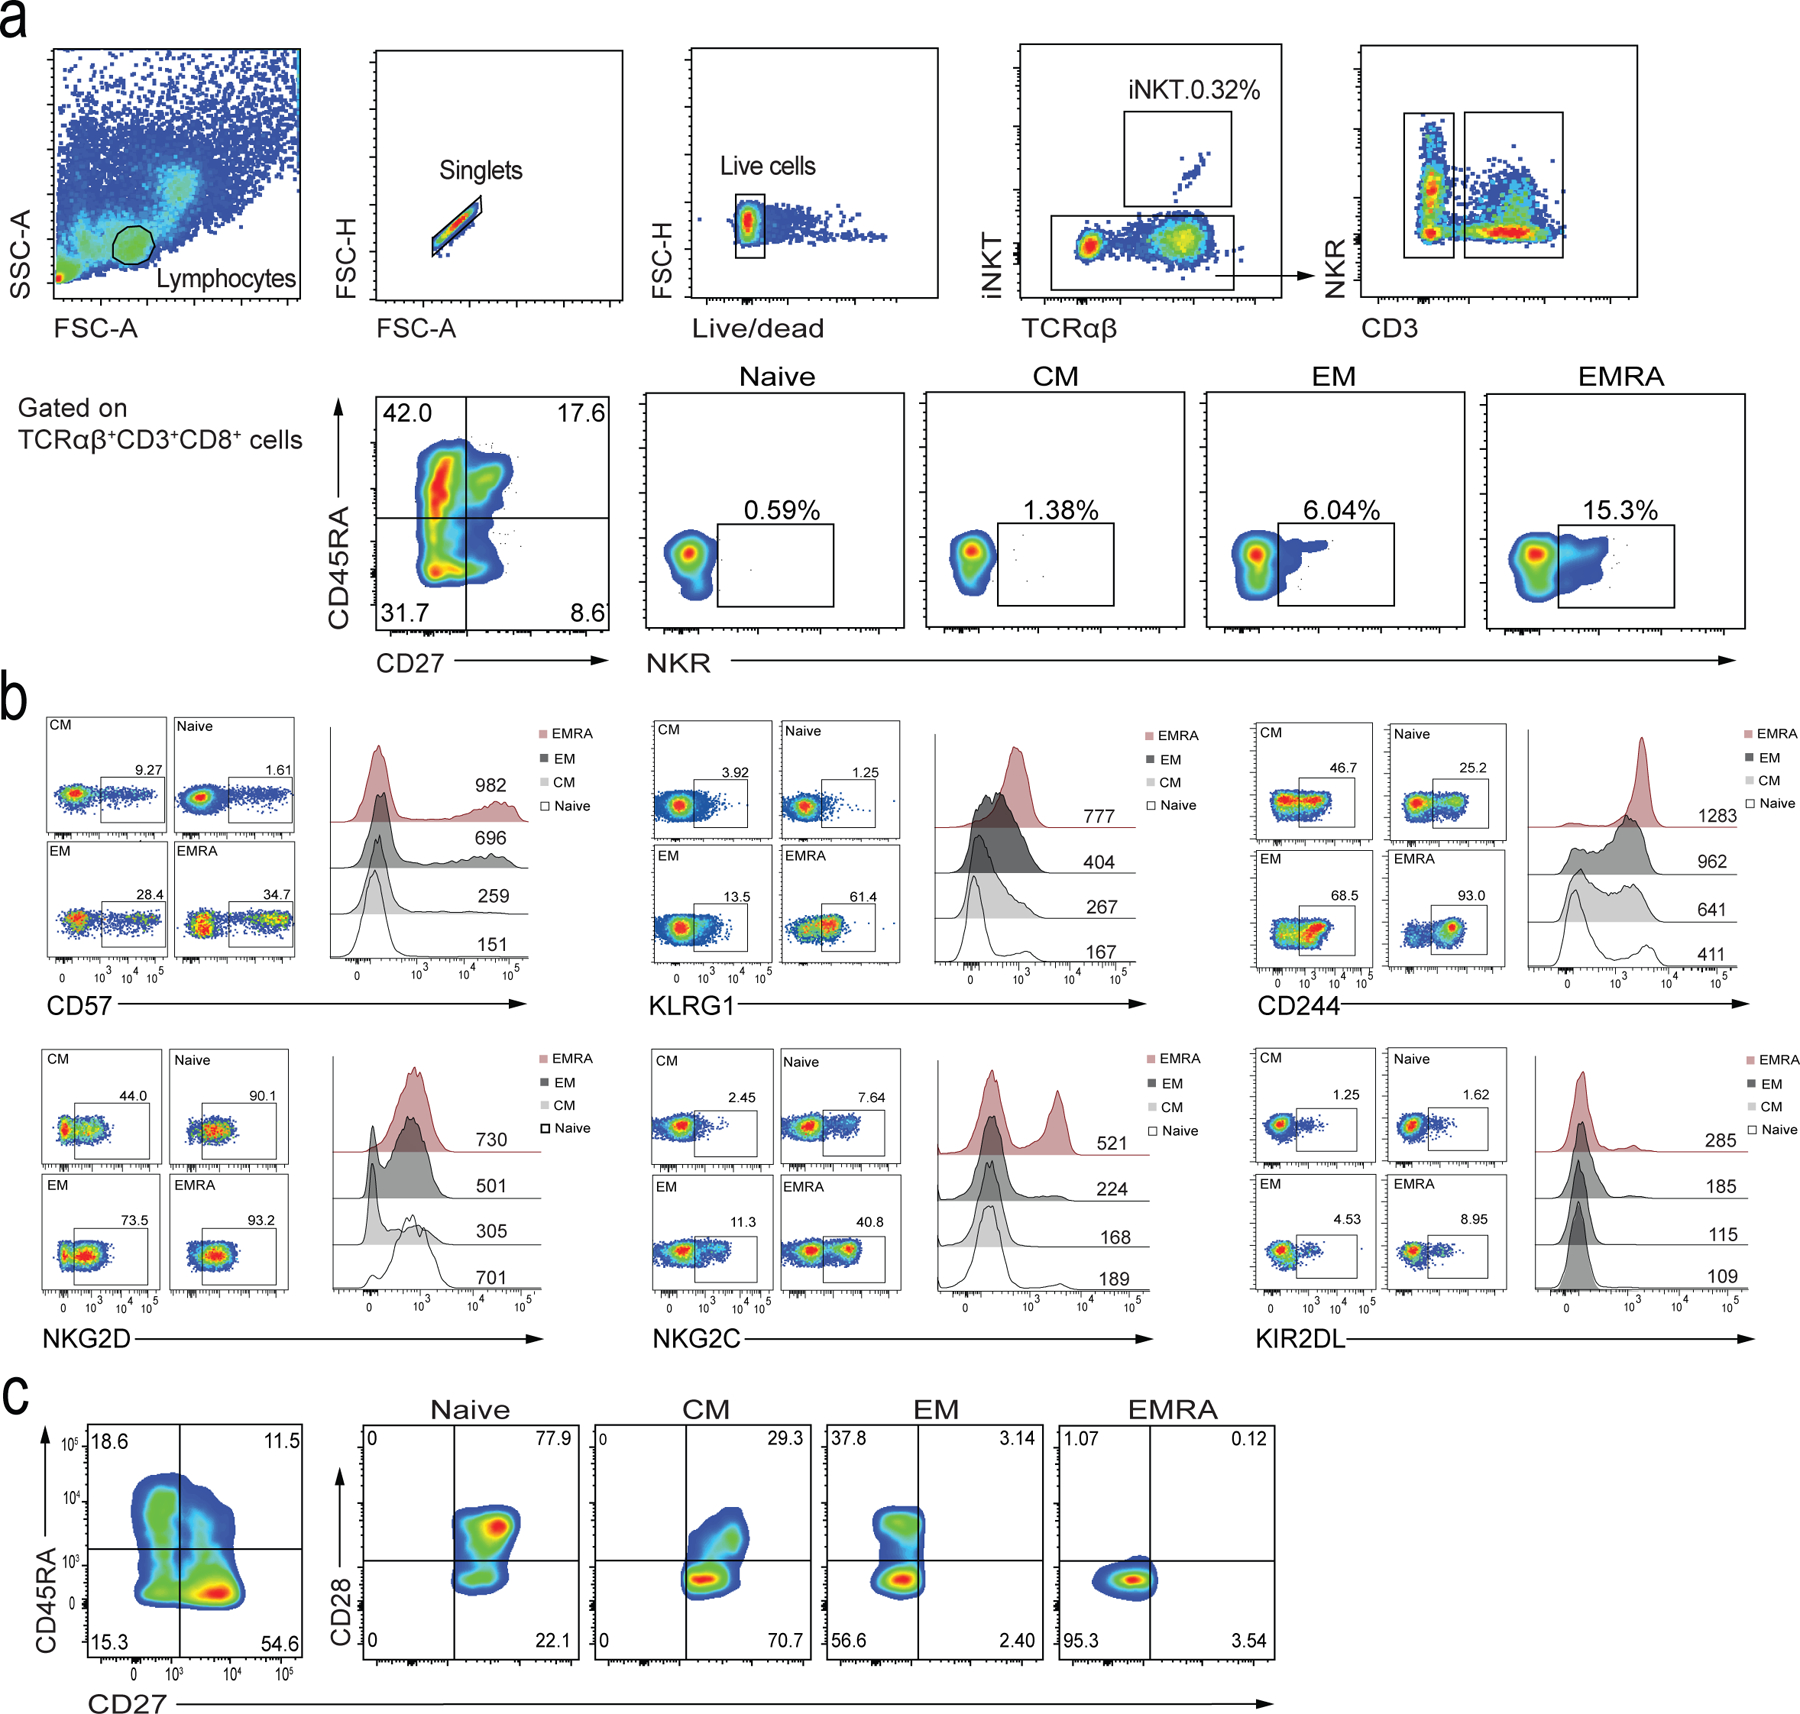
a) Representative flow cytometry plots showing T cell gating and NKR expression on peripheral blood lymphocytes, specifically focusing on CD8+ T cell subsets stratified by the expression of CD27/CD45RA in healthy donors. Defined subsets are CD27+CD45RA+ TN, CD27+CD45RA− TCM, CD27−CD45RA− TEM, and CD27−CD45RA+ TEMRA cells. b) Confirmation of expression of CD57, KLRG1, CD244, NKG2D, NKG2C, and KIR2DL on TN (naïve), TCM, TEM, and TEMRA CD8+ T cell subsets. Numbers in quadrants represent percentages of cells in each subset. Numbers above the histograms indicate the MFI. c) Flow cytometry gating of CD8+ T cells to confirm CD27 and CD28 expression in subpopulations based on CD27/CD45RA gating.
Extended data 2: NKR expression in CD8+ and CD4+ T cells defined by CD27/CD28.
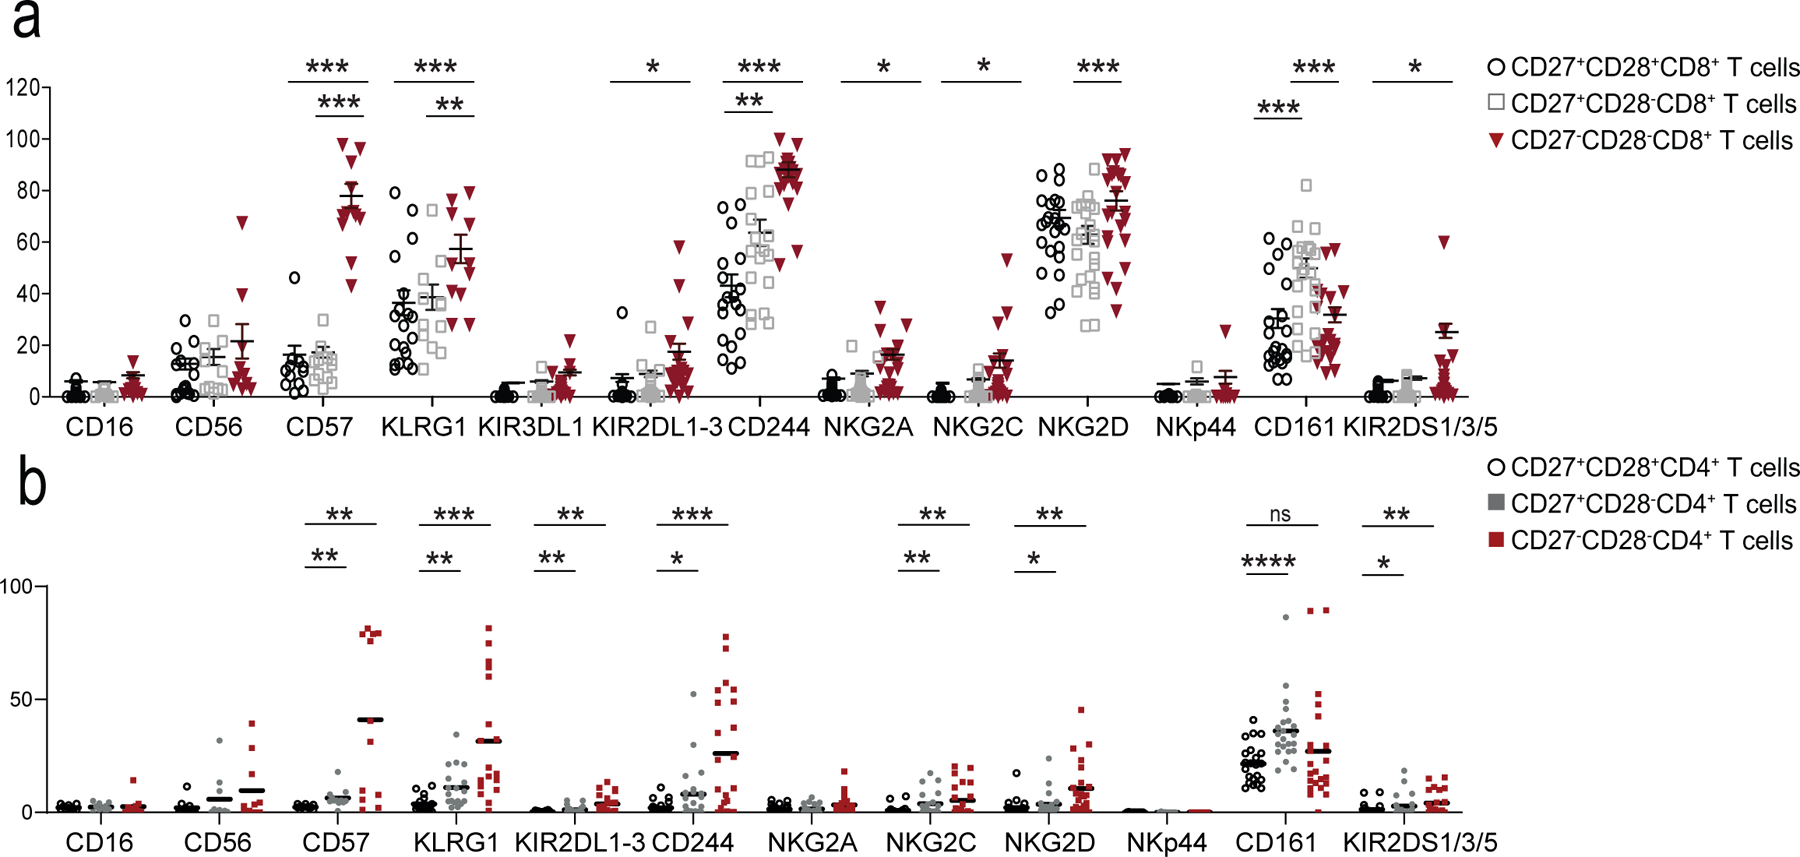
Expression of NK cell receptors (NKR) on a) CD8+ and b) CD4+ T cells assessed by flow cytometry on PBMCs from 22 healthy donors (median age = 52, range 25–83). Total CD8+ and CD4+ T cells were stratified into three subsets according to CD27/CD28 expression as shown in Extended Data 1a.
Extended data 3: scRNA-seq method and quality control.
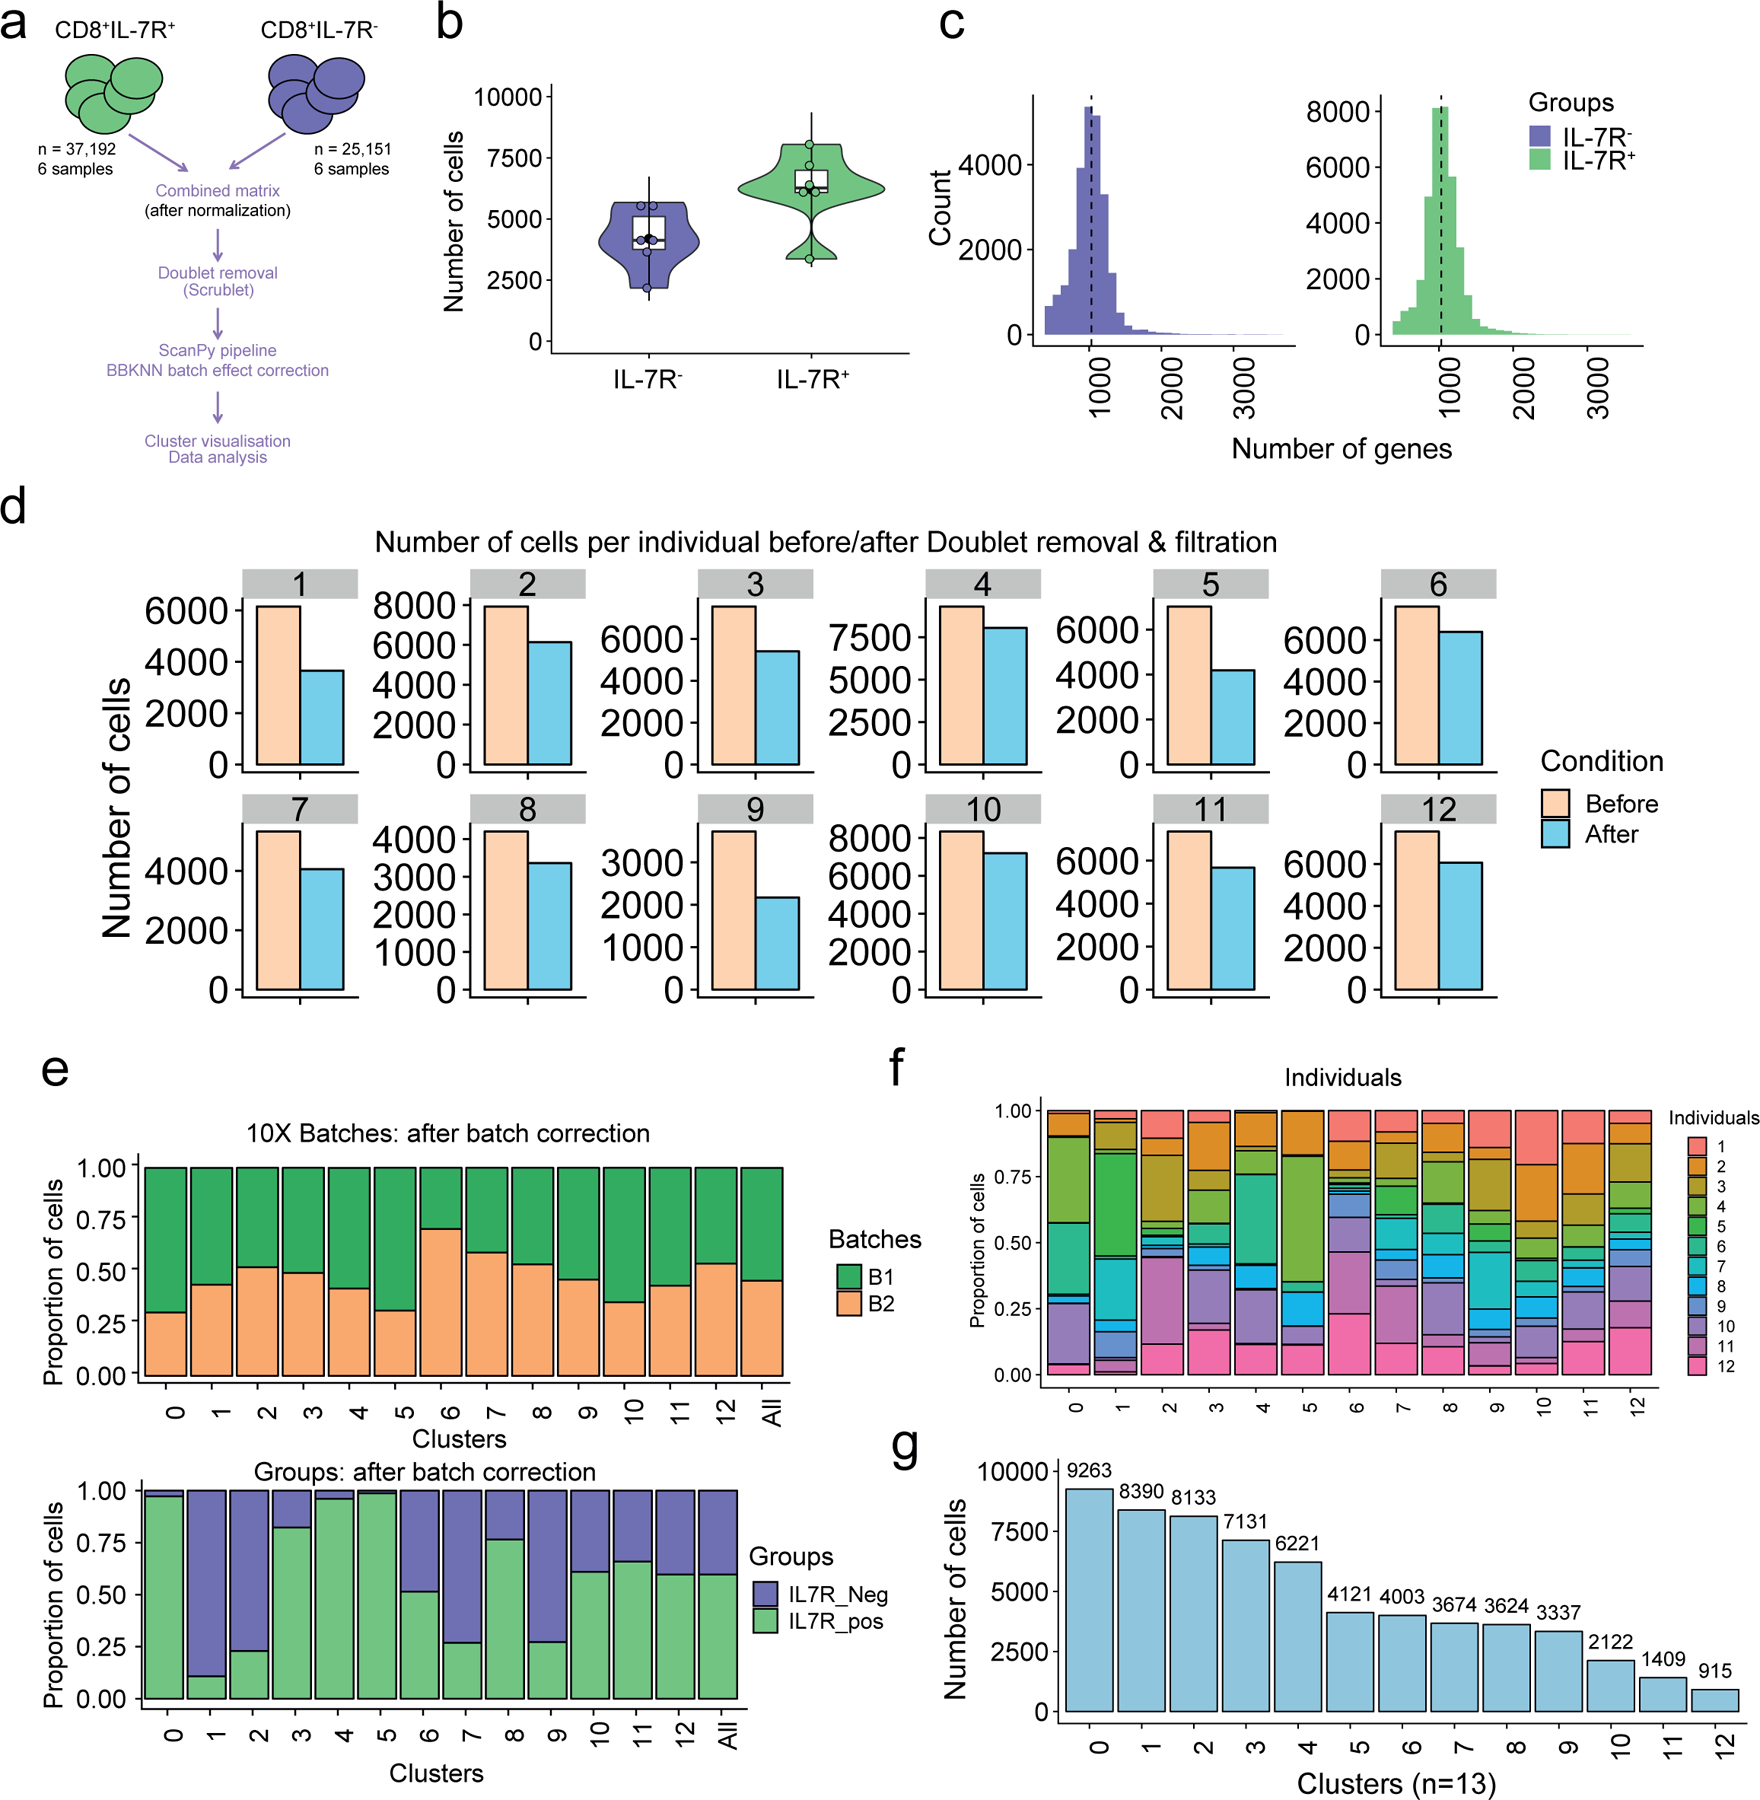
a) Overview of the scRNA-seq processing pipeline. Raw data (n=82,061 sorted CD8+ T cells) from six healthy older adult donors (six IL7R+ and six IL7R− CD8+ T cell samples) were first cleaned from the multiplets, using Scrublet36, then merged, resulting in a dataset containing 62,343 cells. After batch correction using BBKNN37, the Scanpy66 -based pipeline was ran (see Methods section). b) Number of cells per individual (n=12). IL7R+ (n=6, in green) and IL7R− (n=6; in purple). c) Number of genes per distribution across the IL7R+ (in green) and IL7R− (in purple) cells. d) Number of cells before (light orange) and after (light blue) filtration (i.e. doublet removal and other filtration steps that are described in Methods), within each individual. e) Bar plot highlighting the cell abundances across clusters (n=13) for 10X run batches (upper panel) and IL7R+ and IL7R− groups (lower panel) after BBKNN batch effect correction. f) Bar plot highlighting the individual (n=12) cell abundances across clusters (n = 13) after BBKNN batch effect correction. Each color represents an individual. g) Number of cells in each cluster.
Extended data 4: scRNA-seq comparison of re-clustered CD8+ T cells.
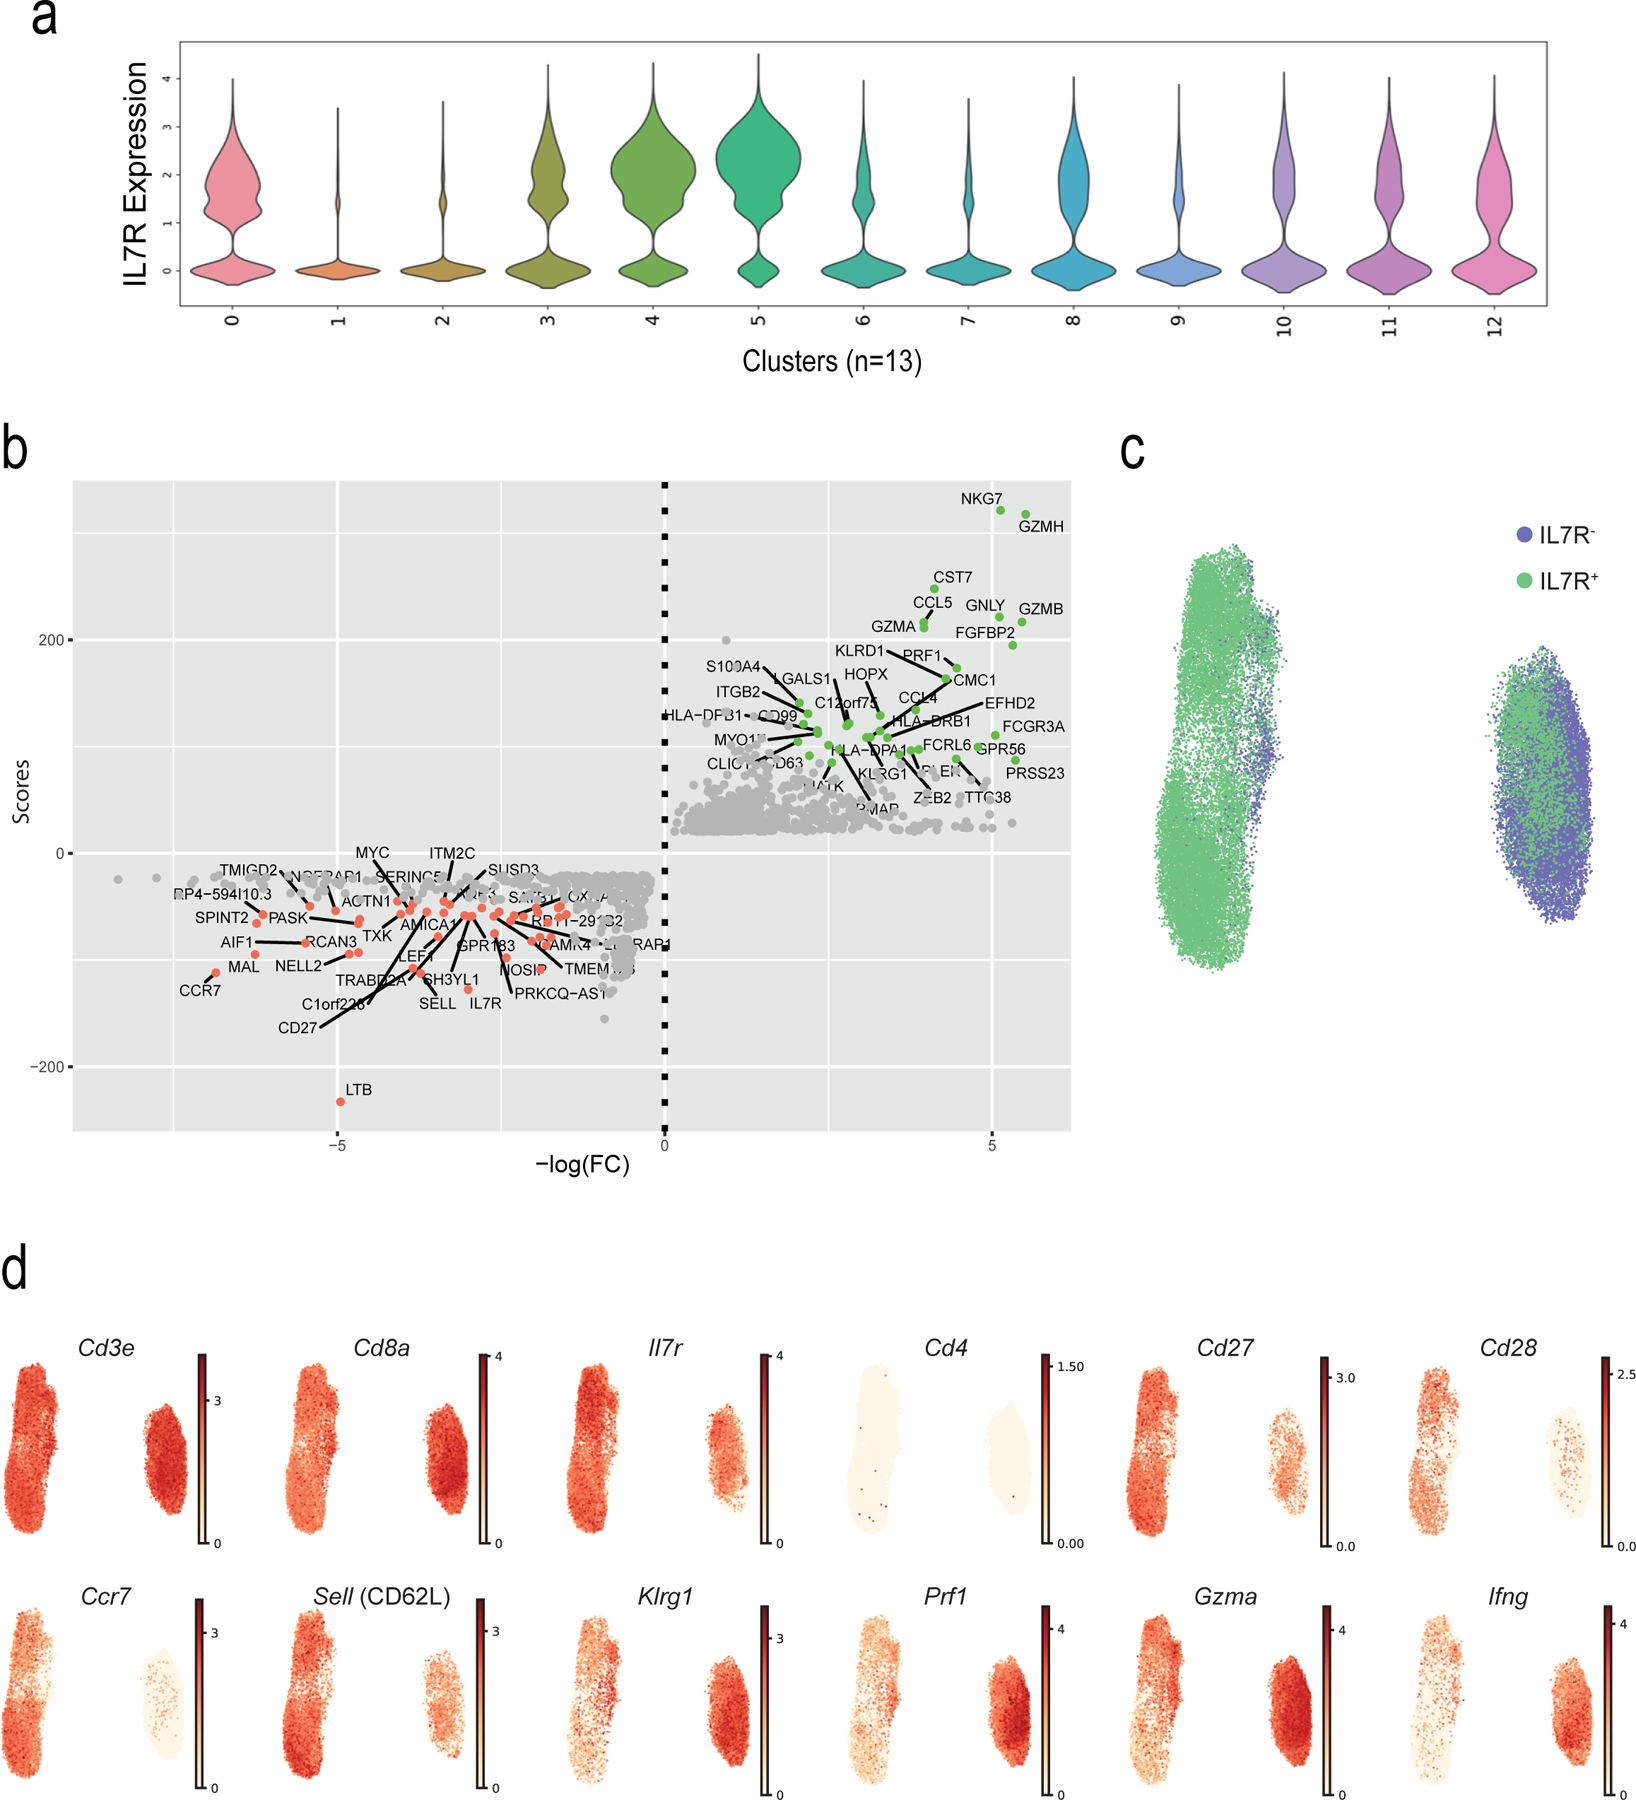
a) Violin plot showing the IL7R expression (as defined by scRNA-seq) across the 13 clusters. b) Dotplot showing the genes that are modulated in TN (top genes in red) and TEMRA (top genes in green) compartments. The scores (y-axis) were defined using the Scanpy function (sc.tl.rank_genes_groups), based on Wilcoxon statistical test. FC = Fold change. TN (C0, C4 and C8) and TEMRA (C1, C2 and C6) compartments were extracted, a second round of clustering on the selected clusters (n = 39,634) was performed (as in Fig. 3) and UMAP plots highlighting c) IL7R groups (IL7R+ in green, IL7R− in purple, as defined by flow sorting) and d) of representative genes are shown.
Extended data 5: Extended data on cytotoxicity and Sesn2 expression.
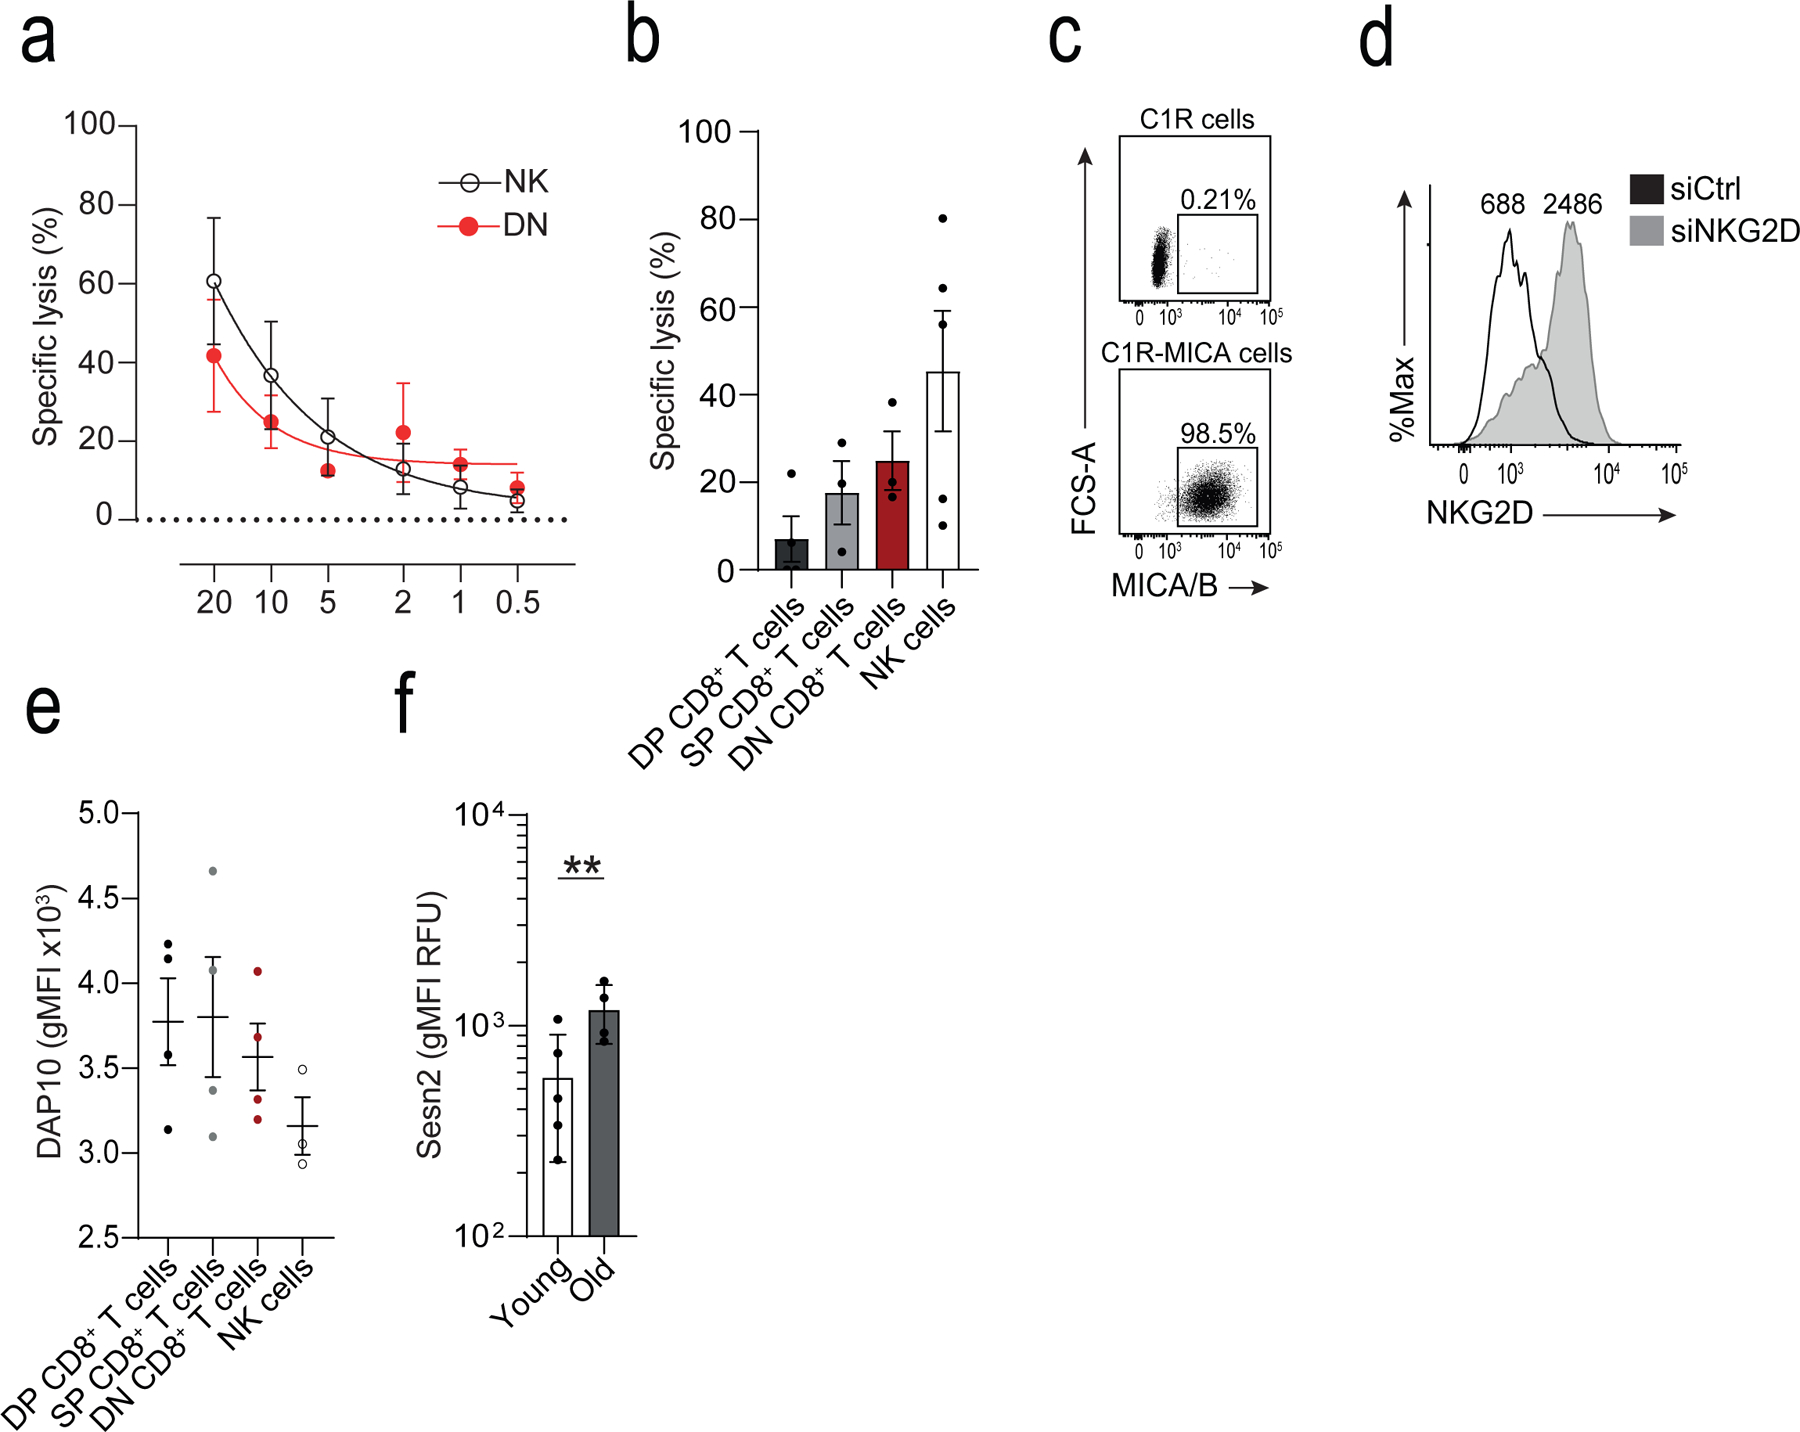
a) Titration curve of varying effector to target (E:T) ratios on cytotoxicity measured as specific lysis of K562 cells using a calcein-release of CD27−CD28−CD8+ (DN) T cells and NK cells isolated by FACS. Non-linear regression (5-parameter asymmetric) was performed (means and s.d., n = 3 donors). b) Calcein-release cytotoxicity assay of K562 cells by CD27+CD28+ (DP), CD27+CD28− (SP), DN CD8+ T cells, and NK cells at E:T 20:1. Cytotoxicity was assessed over a period of six hours (means and s.d., n = 3 donors). c) Representative dot plot of MICA/B expression in C1R and C1R-MICA*008 cells. d) Representative histogram of NKG2D expression on CD28−CD8+ T cells after transfection with NKG2D siRNA (siNKG2D, black) or scrambled siRNA (siCtrl, grey), determined 36 hours after transfection. Numbers indicate MFI. e) Expression of DAP10 on human NK cells, and DP, SP, and DN CD8+ T cell subsets. Mean fluorescence intensity is shown (means and s.d., n = 4 for T cell, n = 3 NK cells). f) Sestrin 2 on CD8+ T cells from young (<35 years, n = 5) and old (>65 years, n = 4) donors. MFIs are shown (geometric means and geometric s.d. factor). Two-tailed, unpaired Welch’s t test, ** p < 0.01.
Extended data 6: YFV-tet+CD8+ T cells exhibit an NK phenotype.
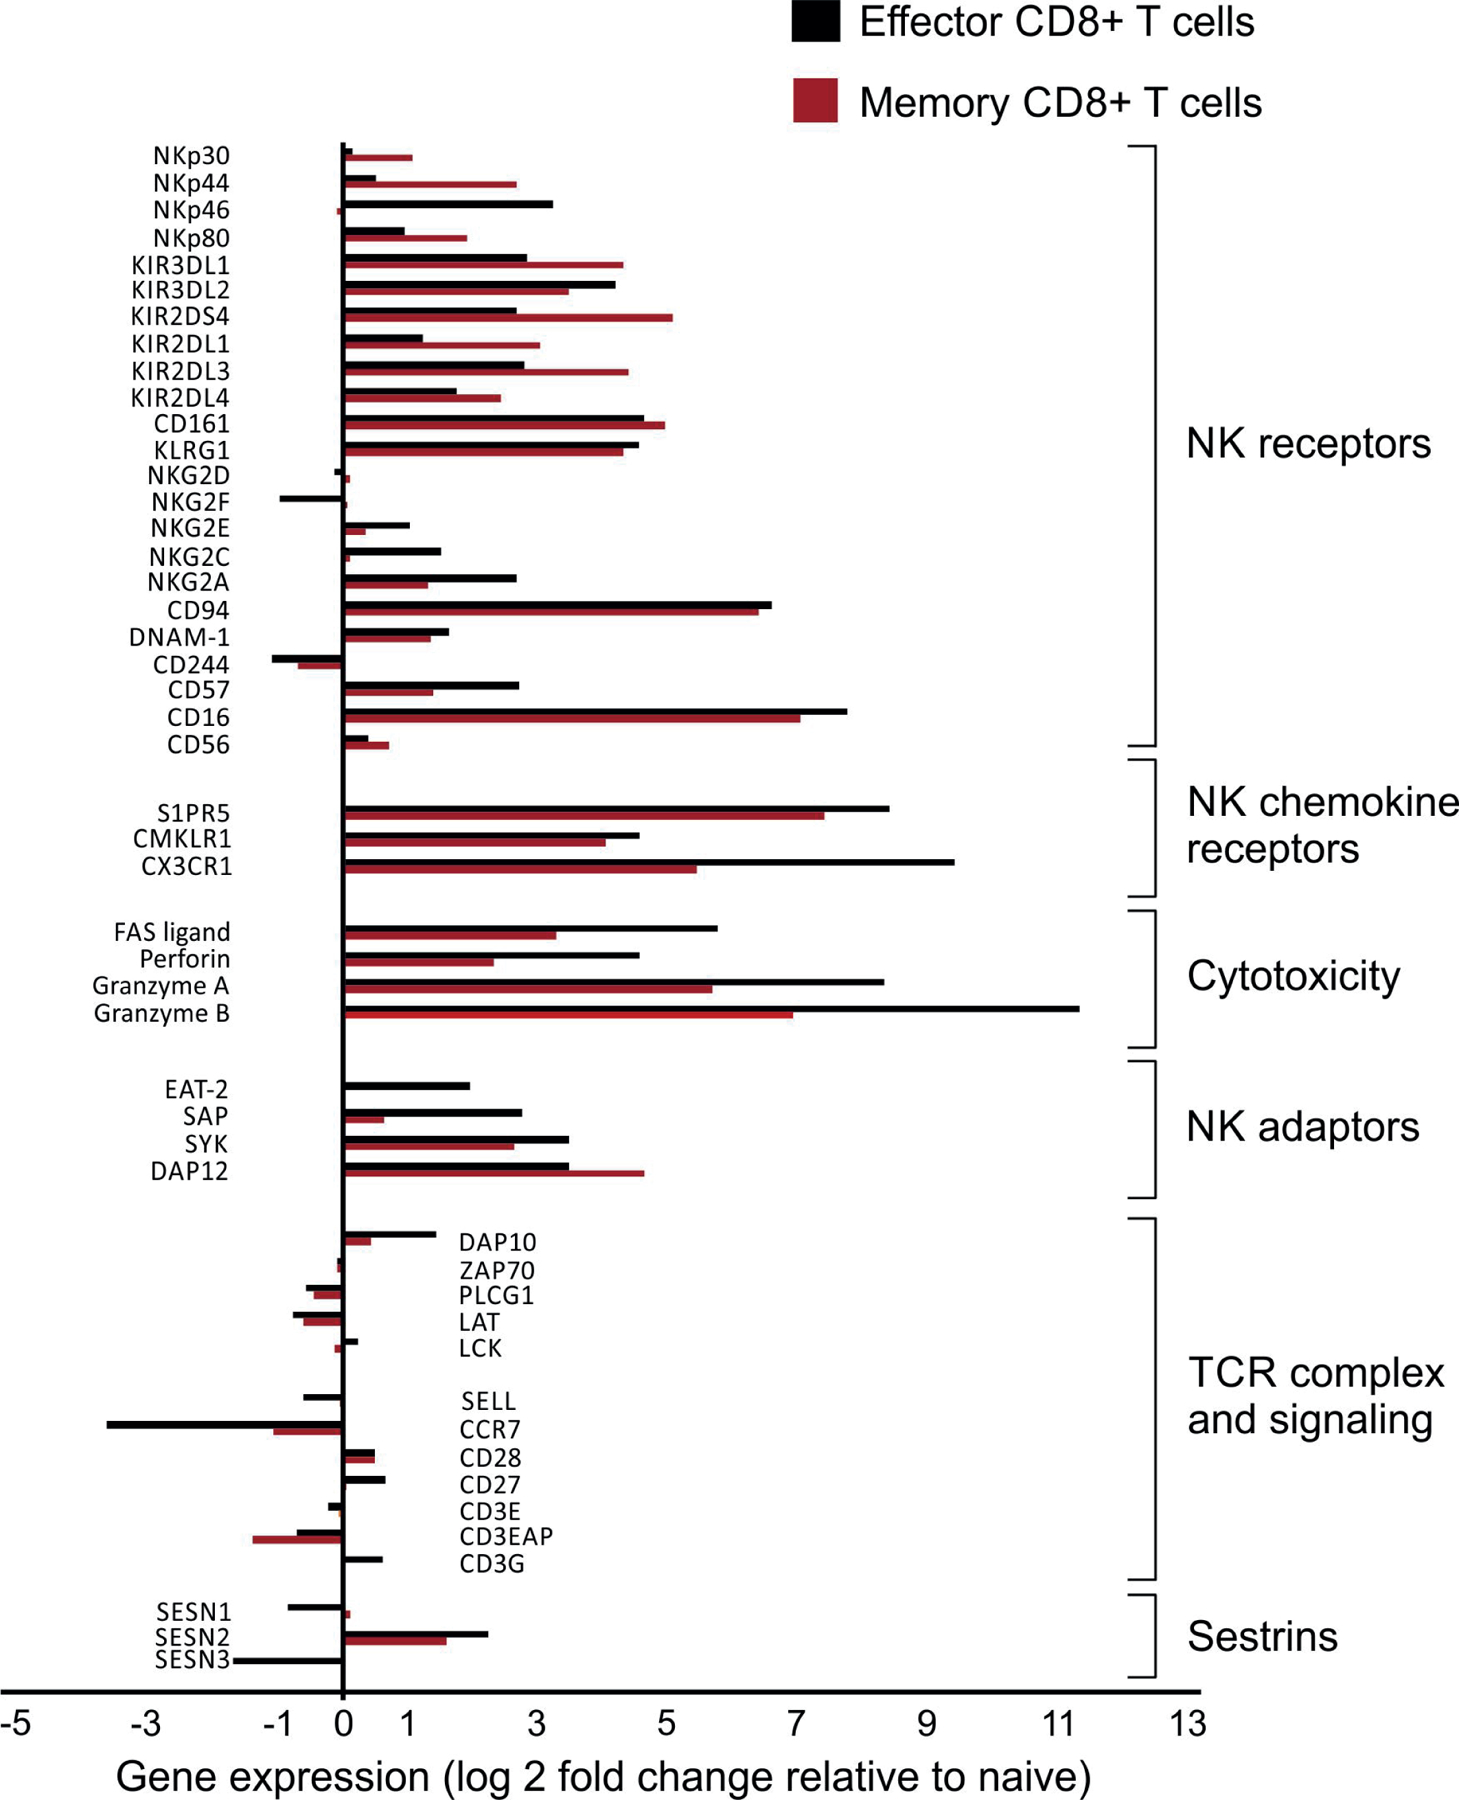
Data mined from Akondy et al. (GSE100745)28 showing the relative fold-change (log2) of differentially expressed genes of interest in YFV-tetramer+ effector (14 days post-vaccination, black bars, n = 3) or memory (4–12 years post-vaccination, red bars, n = 5) compared to naïve (n = 6) CD8+ T cells.
Extended data 7: Extended data on the murine delayed-type hypersensitivity model.
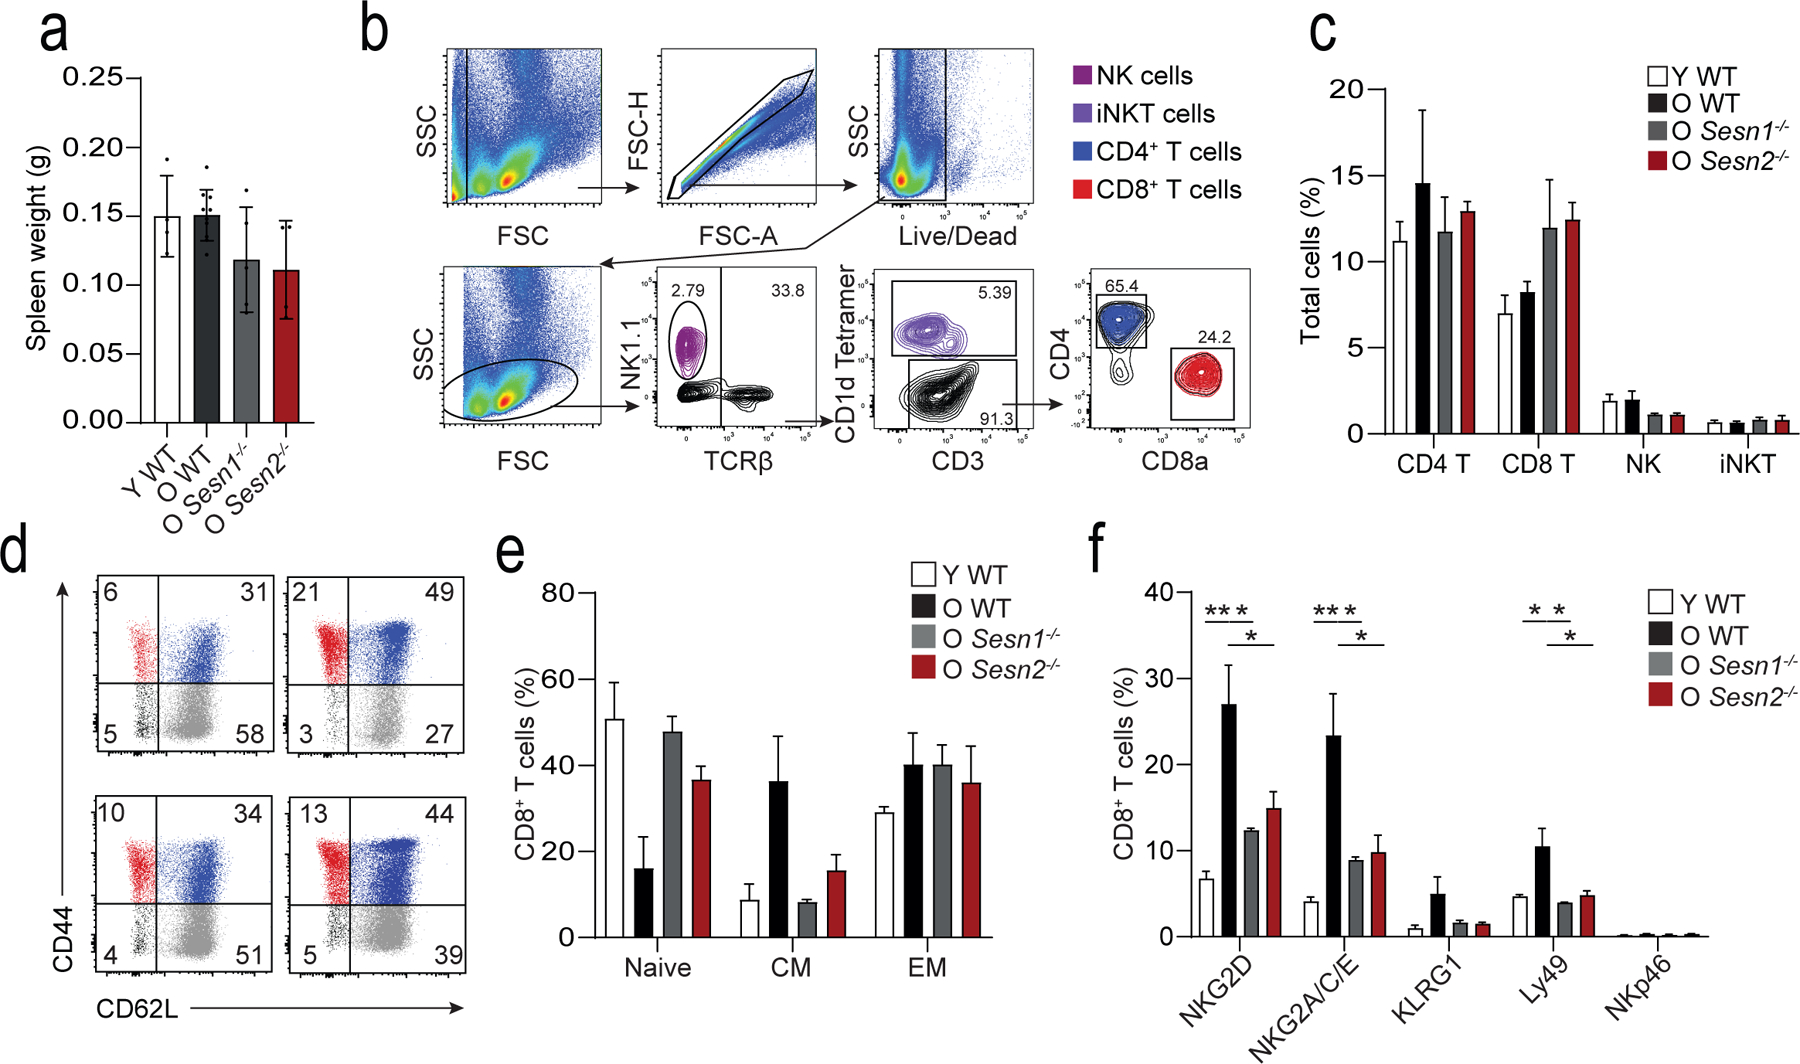
a) Spleen weight following mBSA-driven DTH response in young wild-type (Y WT, n = 4 mice), old wild-type (O WT, n = 8 mice), old Sesn1−/− (O Sesn1−/−, n = 5 mice), and old Sesn2−/− (O Sesn2−/−, n = 4 mice). Bars represent means and s.d.. b) Representative gating strategy to identify NK1.1+ NK cells (violet), TCRβ+CD1d tetramer reactive iNKT cells (purple), TCRβ+CD3+ CD4+ (blue) and CD8+ (red) T cells in mice. Similar results were obtained in all mice (n = 3 per group). c) Quantification of these cell types in the spleen (means and s.e.m., n = 3 mice per group). d) Dot plots showing relative frequencies of CD44−CD62L+ naïve (grey), CD44+CD62L+ central (blue), and CD44+CD62L− effector (red) CD8+ T cells. e) Quantification of these cell types as a proportion of total splenic CD8+ T cells (means and s.e.m., n = 3 per group). f) Enumeration of NKG2D, NKG2A/C/E, KLRG1, Ly49, and NKp46 expression on CD8+ T cells from Y WT, O WT, O Sesn1−/−, and O Sesn2−/− mice (means and s.e.m., n = 3 per group). One-way ANOVA with Tukey’s multiple comparisons test. * p < 0.05, ** p < 0.01, *** p < 0.001, **** p < 0.0001.
Supplementary Material
Acknowledgements
We thank A. Toubert from INSERM U.1160 and laboratoire dÍmmunologie et d´Histocompatibilité, Hôpital Saint-Louis, Université Paris Diderot, Sorbonne Paris Cité for the kind gift of the C1R-MICA cell line. B.I.P. was supported by the Portuguese Foundation for Science and Technology and Gulbenkian Institute for Science sponsoring the Advanced Medical Program for Physicians (PFMA). This work was supported by the Medical Research Council (grant MR/P00184X/1 to A.N.A), the Ministry of Education of Brazil (Grant BEX9414/14–2 to L.P.C.), the Wellcome Trust (Grant AZR00630 to A.Lanna), UCL Business to S.M.H and A.N.A (for the microarray work), the National Institutes of Health (R01DK102850 and R01DK111465 to J.H.L.), the NIH/NIAID (R01 AG052608 and R01 AI142086) to JB and the Biotechnology and Biological Science Research Council (Grant BB/L005336/1 to N.E.R.). R.P.H.D was supported, in part, by the NIHR UCLH Biomedical Research Centre, S.M.H. is funded by the Springboard award from the Academy of Medical Science and the Wellcome Trust. A.L. is a Sir Henry Wellcome Trust Fellow sponsored by Prof. Michael L. Dustin (University of Oxford). S.M.J. is a Wellcome Trust Senior Fellow in Clinical Science and is supported by the Rosetrees Trust, the Welton Trust, the Garfield Weston Trust and UCLH Charitable Foundation. S.M.J. and V.H.T. have been funded by the Roy Castle Lung Cancer Foundation. DU is supported by National Institute of General Medical Sciences (NIGMS) under award number GM124922. GAK is supported by the Travelers Chair in Geriatrics and Gerontology, as well as National Institute on Aging (AG061456; AG048023; AG063528; AG060746; AG021600; AG052608; AG051647).
Footnotes
Competing interests: The authors have declared that no conflict of interest exists.
The single cell RNA-seq data are available on EGA (Accession number EGAS00001004255).
Data and materials availability
The data that support the findings of this study are available from the corresponding author upon request. The complete microarray dataset is available online from the NCBI Gene Expression Omnibus public repository (GEO accession number GSE98640).
References
- 1.Akbar AN, Beverley PC & Salmon M Will telomere erosion lead to a loss of T-cell memory? Nature Reviews Immunology 4, nri1440 (2004). [DOI] [PubMed] [Google Scholar]
- 2.Gray D A role for antigen in the maintenance of immunological memory. Nat Rev Immunol 2, nri706 (2002). [DOI] [PubMed] [Google Scholar]
- 3.Mitri D et al. Reversible Senescence in Human CD4+CD45RA+CD27− Memory T Cells. The Journal of Immunology 187, 2093–2100 (2011). [DOI] [PubMed] [Google Scholar]
- 4.Henson SM et al. p38 signaling inhibits mTORC1-independent autophagy in senescent human CD8+ T cells. Journal of Clinical Investigation 124, 4004–4016 (2014). [DOI] [PMC free article] [PubMed] [Google Scholar]
- 5.Lanna A, Henson SM, Escors D & Akbar AN The kinase p38 activated by the metabolic regulator AMPK and scaffold TAB1 drives the senescence of human T cells. Nature immunology 15, 965–72 (2014). [DOI] [PMC free article] [PubMed] [Google Scholar]
- 6.Tarazona R et al. Increased expression of NK cell markers on T lymphocytes in aging and chronic activation of the immune system reflects the accumulation of effector/senescent T cells. Mechanisms of Ageing and Development 121, 77–88 (2001). [DOI] [PubMed] [Google Scholar]
- 7.Lanna A et al. A sestrin-dependent Erk-Jnk-p38 MAPK activation complex inhibits immunity during aging. Nature immunology 18, 354–363 (2017). [DOI] [PMC free article] [PubMed] [Google Scholar]
- 8.Dunne PJ et al. Quiescence and functional reprogramming of Epstein-Barr virus (EBV)–specific CD8+ T cells during persistent infection. Blood 106, 558–565 (2005). [DOI] [PubMed] [Google Scholar]
- 9.Pereira BI et al. Senescent cells evade immune clearance via HLA-E-mediated NK and CD8+ T cell inhibition. Nat Commun 10, 2387 (2019). [DOI] [PMC free article] [PubMed] [Google Scholar]
- 10.Krizhanovsky V, Yon M, Dickins R, Hearn S, Simon J, Miething C, Yee H, Zender L, Lowe S (2008). Senescence of Activated Stellate Cells Limits Liver Fibrosis Cell 134(4), 657–67. [DOI] [PMC free article] [PubMed] [Google Scholar]
- 11.Dominguez CX et al. The transcription factors ZEB2 and T-bet cooperate to program cytotoxic T cell terminal differentiation in response to LCMV viral infection. J Exp Medicine 212, 2041–2056 (2015). [DOI] [PMC free article] [PubMed] [Google Scholar]
- 12.Kovalovsky D et al. PLZF Induces the Spontaneous Acquisition of Memory/Effector Functions in T Cells Independently of NKT Cell-Related Signals. J Immunol 184, 6746–6755 (2010). [DOI] [PubMed] [Google Scholar]
- 13.Raberger J, Schebesta A, Sakaguchi S, Boucheron N, Blomberg K, Berglöf A, Kolbe T, Smith C, Rülicke T, Ellmeier W (2008). The transcriptional regulator PLZF induces the development of CD44 high memory phenotype T cells Proceedings of the National Academy of Sciences 105(46), 17919–17924. [DOI] [PMC free article] [PubMed] [Google Scholar]
- 14.Liu D et al. Integrin-Dependent Organization and Bidirectional Vesicular Traffic at Cytotoxic Immune Synapses. Immunity 31, 99–109 (2009). [DOI] [PMC free article] [PubMed] [Google Scholar]
- 15.Bernardini G, Sciumè G & Santoni A Differential chemotactic receptor requirements for NK cell subset trafficking into bone marrow. Front Immunol 4, 12 (2013). [DOI] [PMC free article] [PubMed] [Google Scholar]
- 16.van Lier RA, ten Berge IJ & Gamadia LE Human CD8(+) T-cell differentiation in response to viruses. Nature reviews. Immunology 3, 931–9 (2003). [DOI] [PubMed] [Google Scholar]
- 17.Rufer N et al. Ex vivo characterization of human CD8+ T subsets with distinct replicative history and partial effector functions. Blood 102, 1779–1787 (2003). [DOI] [PubMed] [Google Scholar]
- 18.Henson SM et al. KLRG1 signaling induces defective Akt (ser473) phosphorylation and proliferative dysfunction of highly differentiated CD8+ T cells. Blood 113, 6619–6628 (2009). [DOI] [PubMed] [Google Scholar]
- 19.Plunkett FJ et al. The Loss of Telomerase Activity in Highly Differentiated CD8+CD28−CD27− T Cells Is Associated with Decreased Akt (Ser473) Phosphorylation. The Journal of Immunology 178, 7710–7719 (2007). [DOI] [PubMed] [Google Scholar]
- 20.Henson SM, Riddell NE & Akbar AN Properties of end-stage human T cells defined by CD45RA re-expression. Current Opinion in Immunology 24, 476–481 (2012). [DOI] [PubMed] [Google Scholar]
- 21.Aktas E, Kucuksezer U, Bilgic S, Erten G & Deniz G Relationship between CD107a expression and cytotoxic activity. Cell Immunol 254, 149–154 (2009). [DOI] [PubMed] [Google Scholar]
- 22.Lanier LL NKG2D Receptor and Its Ligands in Host Defense. Cancer Immunol Res 3, 575–582 (2015). [DOI] [PMC free article] [PubMed] [Google Scholar]
- 23.Wu J et al. An Activating Immunoreceptor Complex Formed by NKG2D and DAP10. Science 285, 730–732 (1999). [DOI] [PubMed] [Google Scholar]
- 24.Upshaw JL et al. NKG2D-mediated signaling requires a DAP10-bound Grb2-Vav1 intermediate and phosphatidylinositol-3-kinase in human natural killer cells. Nat Immunol 7, 524–532 (2006). [DOI] [PubMed] [Google Scholar]
- 25.Diefenbach A et al. Selective associations with signaling proteins determine stimulatory versus costimulatory activity of NKG2D. Nat Immunol 3, ni858 (2002). [DOI] [PubMed] [Google Scholar]
- 26.Gilfillan S, Ho EL, Cella M, Yokoyama WM & Colonna M NKG2D recruits two distinct adapters to trigger NK cell activation and costimulation. Nat Immunol 3, ni857 (2002). [DOI] [PubMed] [Google Scholar]
- 27.Wu J, Cherwinski H, Spies T, Phillips JH & Lanier LL Dap10 and Dap12 Form Distinct, but Functionally Cooperative, Receptor Complexes in Natural Killer Cells. J Exp Medicine 192, 1059–1068 (2000). [DOI] [PMC free article] [PubMed] [Google Scholar]
- 28.Akondy RS et al. Origin and differentiation of human memory CD8 T cells after vaccination. Nature 552, 362 (2017). [DOI] [PMC free article] [PubMed] [Google Scholar]
- 29.Akondy RS et al. The Yellow Fever Virus Vaccine Induces a Broad and Polyfunctional Human Memory CD8+ T Cell Response. The Journal of Immunology 183, 7919–7930 (2009). [DOI] [PMC free article] [PubMed] [Google Scholar]
- 30.Wang X et al. Human invariant natural killer T cells acquire transient innate responsiveness via histone H4 acetylation induced by weak TCR stimulation. J Exp Medicine 209, 987–1000 (2012). [DOI] [PMC free article] [PubMed] [Google Scholar]
- 31.Mingueneau M et al. Loss of the LAT Adaptor Converts Antigen-Responsive T Cells into Pathogenic Effectors that Function Independently of the T Cell Receptor. Immunity 31, 197–208 (2009). [DOI] [PubMed] [Google Scholar]
- 32.Wencker M et al. Innate-like T cells straddle innate and adaptive immunity by altering antigen-receptor responsiveness. Nature Immunology 15, ni.2773 (2013). [DOI] [PMC free article] [PubMed] [Google Scholar]
- 33.Pawelec G Immunosenenescence: Role of cytomegalovirus. Exp Gerontol 54, 1–5 (2014). [DOI] [PubMed] [Google Scholar]
- 34.Khan N et al. Herpesvirus-Specific CD8 T Cell Immunity in Old Age: Cytomegalovirus Impairs the Response to a Coresident EBV Infection. The Journal of Immunology 173, 7481–7489 (2004). [DOI] [PubMed] [Google Scholar]
- 35.Jackson SE et al. CMV immune evasion and manipulation of the immune system with aging. GeroScience 39, 273–291 (2017). [DOI] [PMC free article] [PubMed] [Google Scholar]
- 36.Vallejo AN et al. Expansions of NK-like αβT cells with chronologic aging: Novel lymphocyte effectors that compensate for functional deficits of conventional NK cells and T cells. Ageing Research Reviews 10, 354–361 (2011). [DOI] [PMC free article] [PubMed] [Google Scholar]
- 37.Coppé J-PP et al. Senescence-associated secretory phenotypes reveal cell-nonautonomous functions of oncogenic RAS and the p53 tumor suppressor. PLoS biology 6, 2853–68 (2008). [DOI] [PMC free article] [PubMed] [Google Scholar]
- 38.Campisi J & di Fagagna F Cellular senescence: when bad things happen to good cells. Nature Reviews Molecular Cell Biology 8, 729–740 (2007). [DOI] [PubMed] [Google Scholar]
- 39.Baker DJ et al. Naturally occurring p16Ink4a-positive cells shorten healthy lifespan. Nature 530, 184–189 (2016). [DOI] [PMC free article] [PubMed] [Google Scholar]
- 40.Baker DJ et al. Clearance of p16Ink4a-positive senescent cells delays ageing-associated disorders. Nature 479, 232–6 (2011). [DOI] [PMC free article] [PubMed] [Google Scholar]
- 41.Sagiv A et al. NKG2D ligands mediate immunosurveillance of senescent cells. Aging 8, 328–44 (2016). [DOI] [PMC free article] [PubMed] [Google Scholar]
Methods references
- 42.Callender LA et al. Human CD8+ EMRA T cells display a senescence‐associated secretory phenotype regulated by p38 MAPK. Aging Cell 17, (2018). [DOI] [PMC free article] [PubMed] [Google Scholar]
- 43.Gérart S, Sibéril S, Martin E, Lenoir C, Aguilar C, Picard C, Lantz O, Fischer A, Latour S (2013). Human iNKT and MAIT cells exhibit a PLZF-dependent proapoptotic propensity that is counterbalanced by XIAP Blood 121(4), 614–623. [DOI] [PMC free article] [PubMed] [Google Scholar]
- 44.Wolock SL, Lopez R & Klein AM Scrublet: computational identification of cell doublets in single-cell transcriptomic data. bioRxiv(2018). doi: 10.1101/357368 [DOI] [PMC free article] [PubMed]
- 45.Wolf FA, Angerer P & Theis FJ SCANPY: large-scale single-cell gene expression data analysis. Genome Biol 19, 15 (2018). [DOI] [PMC free article] [PubMed] [Google Scholar]
- 46.Satija R, Farrell JA, Gennert D, Schier AF & Regev A Spatial reconstruction of single-cell gene expression data. Nat. Biotechnol 33, 495–502 (2015). [DOI] [PMC free article] [PubMed] [Google Scholar]
- 47.McInnes L, Healy J & Melville J UMAP: Uniform Manifold Approximation and Projection for Dimension Reduction. arXiv:1802.03426[cs, stat] (2018).
- 48.Park J-E, Polanski K, Meyer K & Teichmann SA Fast Batch Alignment of SingleCell Transcriptomes Unifies Multiple Mouse Cell Atlases into an Integrated Landscape. bioRxiv(2018). doi: 10.1101/397042 [DOI]
- 49.Allez M et al. CD4+NKG2D+ T Cells in Crohn’s Disease Mediate Inflammatory and Cytotoxic Responses Through MICA Interactions. Gastroenterology 132, 2346–2358 (2007). [DOI] [PubMed] [Google Scholar]
- 50.Trivedi SG et al. Essential role for hematopoietic prostaglandin D2 synthase in the control of delayed type hypersensitivity. P Natl Acad Sci Usa 103, 5179–5184 (2006). [DOI] [PMC free article] [PubMed] [Google Scholar]
Associated Data
This section collects any data citations, data availability statements, or supplementary materials included in this article.
Supplementary Materials
Data Availability Statement
The data that support the findings of this study are available from the corresponding author upon request. The complete microarray dataset is available online from the NCBI Gene Expression Omnibus public repository (GEO accession number GSE98640).