SUMMARY
The neocortex consists of a vast number of diverse neurons that form distinct layers and intricate circuits at single-cell resolution to support complex brain functions1. Diverse cell-surface molecules are thought to be the key to define neuronal identity and mediate inter-neuronal interaction for structural and functional organization2–6. However, the precise mechanisms controlling the fine neuronal organization of the neocortex remain largely unclear. Here, by integrating in-depth single-cell RNA-sequencing analysis, progenitor lineage labelling and mosaic functional analysis, we report that the diverse yet patterned expression of clustered protocadherins (cPCDHs)-the largest subgroup of the Cadherin superfamily of cell adhesion molecules7-regulates the precise spatial arrangement and synaptic connectivity of excitatory neurons in the mouse neocortex. The expression of cPcdh genes in individual neocortical excitatory neurons is diverse yet exhibits distinct composition patterns linked to their developmental origin and spatial positioning. A reduction in functional cPCDH expression causes a lateral clustering of clonally related excitatory neurons originating from the same neural progenitor and a significant increase in synaptic connectivity. By contrast, overexpression of a single cPCDH isoform leads to a lateral dispersion of clonally related excitatory neurons and a considerable decrease in synaptic connectivity. These results suggest that patterned cPCDH expression biases fine spatial and functional organization of individual neocortical excitatory neurons in the mammalian brain.
The neocortex is composed of a large number of diverse neurons that develop specific synapses to assemble into intricate functional circuits for various behaviour control1. The two prominent organizational features of the neocortex are horizontal layers and columnar circuits, both of which are linked to the early developmental processes of neurogenesis and neuronal migration. Virtually all neocortical excitatory neurons are produced by radial glial progenitors (RGPs), the predominant neural progenitor cells transiently residing in the ventricular zone of the developing neocortex8–10. During early neocortical development, RGPs conform to a temporal program of proliferation and differentiation to produce diverse neurons and glial cells to constitute the neocortex10–16. In the developing mouse neocortex, RGPs largely undergo symmetric proliferative division to amplify the progenitor cell pool prior to embryonic day (E) 12. They then switch to asymmetric neurogenic division to produce waves of neurons occupying the neocortex in a birth-date-dependent inside-out manner. Interestingly, clonally related excitatory neurons originating from the same neurogenic RGPs migrate along their mother radial glial fibre, forming an ontogenetic radial cluster spanning the deep and superficial layers10,11,14. Moreover, these clonally related excitatory neurons preferentially develop synapses with each other over nearby non-clonally related neurons, and share similar physiological properties17–21. The spatial and functional organization of clonally related excitatory neurons in the neocortex is thus biased at single-cell resolution. However, little is known about the molecular control of this remarkable organization.
cPCDHs are the largest subgroup of the Cadherin superfamily of cell adhesion molecules that are predominantly expressed in the nervous system7. Mammalian cPcdh genes are tandemly located in three adjacent gene clusters (namely, Pcdha, Pcdhb and Pcdhg) on a single chromosome, with 14, 22, and 22 independently expressed isoforms, respectively, in mice3,7,22. cPCDHs have drawn much attention owning to some notable features. First, cPcdh genes have the ability to generate a high level of cell surface diversity by a mechanism of stochastic yet balanced promoter choice23–25 and combinatorial expression26–28, enabling individual neurons a unique cell surface identity with sufficient diversities6. Second, diverse expression of PCDHα, PCDHβ, and PCDHγ protein monomers in individual cells assembles into cis homo- or heterodimers that engage in strictly homophilic interactions at the cell surface29–32. These characteristics enable individual neurites to recognize their self or non-self, which leads to self-avoidance to ensure that neurons effectively cover their receptive or projective fields while retaining the ability to overlap with those of neighbour neurons27,33–36. The neocortex is one of the most complex brain structures with a large number of neurons that are specifically organized at the structural and functional levels. Whether and how cPCDHs regulate the recognition and fine organization of neocortical neurons is a fundamental question towards understanding the neocortex.
Combinatorial expression of cPcdh genes
To investigate the expression pattern of cPcdh genes in neocortical excitatory neurons, in particular with regard to their developmental origin and fine organization, it is necessary to establish an assay to couple neuronal generation and cPcdh expression in vivo at single-cell resolution. Mosaic analysis with double markers (MADM) is a powerful approach for assessing native stem or progenitor cell division pattern and progeny output in a spatiotemporally controlled manner12,37–39 (Extended Data Fig. 1a). To label dorsal RGPs in the developing mouse neocortex in a temporal-specific manner, we introduced Emx1-CreERT2 transgene40 into the MADM system (Fig. 1a). We focused on G2-X green/red fluorescent clones, in which the reconstituted enhanced green fluorescent protein (eGFP) and tandem dimer Tomato (tdTomato) are segregated and inherited by the two original daughter cells of individual dividing RGPs, thereby allowing a direct assessment of their division pattern and output potential.
Fig. 1. Patterned expression of cPcdh isoforms linked to lineage relationship and developmental origin.
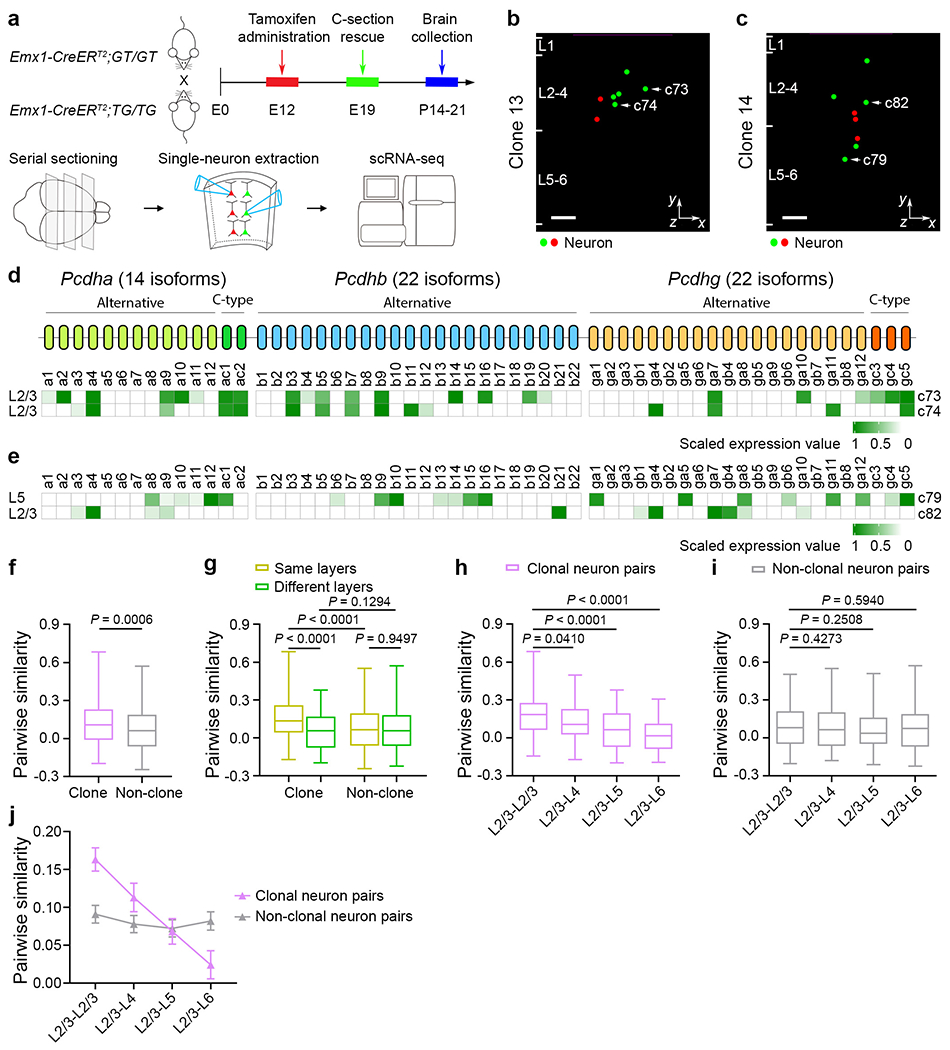
a, Diagram of cPcdh expression analysis in individual clones labelled by MADM. C-section, caesarean section. b,c, Representative 3D reconstruction images of the clones in d (clone 13; b) and e (clone 14; c). n = 32 clones from around 40 brain slices from 8 brains. The coloured dots represent the cell bodies of fluorescent labelled neurons. The x and y axes indicate parallel and perpendicular to the pia. For b and c, scale bars, 100 μm. d,e, Heat map of cPcdh transcripts in neurons of clone 13 (d; same layer) or clone 14 (e; different layers). f, Quantification of the pairwise similarity of cPcdh isoforms for neurons in individual clones (n = 346) or in non-clone controls (n = 1,400). g, Quantification of the pairwise similarity of cPcdh isoforms for neurons in the same or different layers of clones (n = 219 (same layers) and n = 127 (different layers)) or non-clone controls (n = 1,000 (same layers) and n = 400 (different layers)). h-j, Quantification of the pairwise similarity of cPcdh isoforms for neurons across layers in clones (h; n = 97 (L2/3–L2/3), n = 64 (L2/3–L4), n = 81 (L2/3–L5) and n = 46 (L2/3–L6)) or non-clone controls (i; n = 200 (L2/3–L2/3), n = 200 (L2/3–L4), n = 200 (L2/3–L5) and n = 200 (L2/3–L6)). For j, P < 0.0001 (clonal neuron pairs) and P = 0.7120 (non-clonal neuron pairs). The box plots in f-i show the median (centre line), interquartile range (box), and minimum and maximum values (whiskers). For j, data are mean ± s.e.m. Data are representative of at least three independent experiments. Statistical analysis was performed using two-tailed unpaired Student’s t-tests (f-i) and one-way analysis of variance without adjusting P values (j).
Dorsal RGPs switch from the amplification phase of symmetric division to the neurogenic phase of asymmetric division around E1212,39. To precisely assess the kin relationship of individual excitatory neurons at the clonal level, we induced Cre activity through a single dose of tamoxifen administered to timed pregnant females at ~E12 and analysed at postnatal day14-21 (P14-21). As expected, two major types of green/red fluorescent G2-X clonal clusters in the neocortex were observed12,15,39 (Extended Data Fig. 1b,c). One type was the symmetric proliferative clone containing a cohort of green or red fluorescent neuronal progeny spanning both deep (5-6) and superficial (2-4) layers, originated from a MADM-labelled symmetrically dividing RGP (Extended Data Fig. 1b). In these clones, the same colour-labelled excitatory neurons originated from the same neurogenic RGP are considered as sister neurons, whereas the different colour-labelled excitatory neurons originating from two different neurogenic RGPs are considered as cousin neurons. The other clone type was the asymmetric neurogenic clone containing a minority population in one colour typically situated in deep layers and a majority population in the other colour spanning both deep and superficial layers (Extended Data Fig. 1c). In these clones, the majority population arises from a self-renewing RGP, whereas the minority population arises from a neuron or an intermediate progenitor that typically divide once in the subventricular zone to produce two neurons. These clonally related excitatory neurons, regardless of the colour, are considered as sister neurons.
To assess cPcdh expression pattern, we documented and extracted the cell bodies of labelled neurons in individual clones from live brain slices using glass micropipettes and performed Smart-seq2 based in-depth single-cell mRNA sequencing (scRNA-seq) (Fig. 1a–c and Extended Data Fig. 1d,e). Compared with empty controls with no cell extraction (Extended Data Fig. 1f,g), the majority of extracted neurons contained a sufficient amount of mRNA (Extended Data Fig. 1h), which allowed for the generation of a good quality of library for sequencing (Extended Data Fig. 1i). Upon sequencing, we removed the neurons with a high content of mitochondrial genes and a low number of regular genes for further analysis (Extended Data Fig. 2a–c). We analysed a total of 188 neurons from 32 clones, with about 9,494 genes detected per neuron (Extended Data Fig. 2d). Notably, we detected around 9 cPcdh isoforms per neuron (Extended Data Fig. 2e,f). The numbers of detected genes and cPcdh isoforms did not obviously increase as the total mapped reads increased (Extended Data Fig. 2d,e), indicating that the sequencing depth is sufficient for a reliable detection of cPcdh transcripts in individual neurons.
Individual neurons expressed diverse combinations of isoforms from the Pcdha, Pcdhb, and Pcdhg gene clusters (Fig. 1d,e and Extended Data Fig. 3), similarly to cerebellar Purkinje cells or olfactory sensory neurons26–28,41. However, in contrast to Purkinje cells26,41 or olfactory sensory neurons27, neocortical neurons expressed high levels of Pcdhac2 and Pcdhgc5 (Extended Data Fig. 3). Similar cPcdh expression patterns were also observed in a recently published in-depth scRNA-seq dataset of randomly collected neocortical excitatory neurons42 (Extended Data Figs. 2g–i and 4). The expression of cPcdh isoforms did not show any obvious differences in different neocortical areas (Extended Data Fig. 2j–n). Together, these results suggest that diverse combinations of cPcdh isoforms are expressed in individual neocortical excitatory neurons, which may contribute to the fine organization of the neocortex.
Developmental-origin-related cPcdh expression
We next examined the link between cPcdh expression pattern and neuronal lineage relationship by analysing pair-wise similarity of cPcdh isoform expression in clonally related neurons (Methods and Fig. 1b–e). To assess the lineage relationship or kinship influence on cPcdh expression, we combined all sampled clonally related excitatory neurons and used randomly assigned neuronal pairs from different clones as the simulated non-clonal control. Interestingly, the pairwise similarity of cPcdh isoform expression was significantly higher in clonally related neurons compared with the non-clonal control (Fig. 1f and Extended Data Fig. 2o), suggesting that lineage relationship affects cPcdh expression.
To further investigate this, we compared the pairwise similarity between neurons in the same layer (for example, neurons c73 and c74; Fig. 1b,d and Extended Data Fig. 1d) or different layers (for example, c79 and c82; Fig. 1c,e and Extended Data Fig. 1e). Interestingly, while non-clonal control neurons showed no obvious difference, clonally related neurons in the same layer displayed a significantly higher similarity than those in different layers (Fig. 1g and Extended Data Fig. 2p). Moreover, the pairwise similarity between clonally related neurons progressively decreased as the layer difference became enlarged, whereas the pairwise similarity between non-clonally related neurons did not show any significant relationship (Fig. 1h–j). The layer identities of individual clonally related neurons were largely confirmed by their gene expression profiles (Extended Data Fig. 5). Moreover, no obvious relationship was observed in the previously published random neuronal dataset42 (Extended Data Fig. 2q,r). Given that clonally related excitatory neurons in different layers are generated progressively by individual RGPs undergoing consecutive rounds of asymmetric division, these results suggest that the diverse cPcdh expression in neocortical excitatory neurons is linked to their progenitor origin and developmental history. As development proceeds, clonally related excitatory neurons generated by the same neurogenic RGPs gradually diversify cPcdh expression and, at the same time, occupy different layers.
Spatial-positioning-related cPcdh expression
We next examined the pattern of cPcdh expression in clonally related neurons in the same layer that exhibit two critical spatial features (Fig. 2). One is their relative spatial configuration. While some are more vertically distributed (for example, c142 and c147), others are more horizontally located (such as c49 and c53) (Fig. 2a–d). To quantitatively assess this, we measured the relative angle between the cell bodies of neuronal pairs relative to the pia (Fig. 2b,d), as well as their pair-wise similarity of cPcdh expression (Fig. 2e). Interestingly, we found that the pairwise similarity of cPcdh isoform expression in clonally related neurons showed a negative correlation with the angle (Fig. 2i–l). These results suggest that more horizontally distributed clonally related neurons with smaller angles display more similar cPcdh expression, whereas more vertically distributed clonally related neurons with larger angles exhibit less similar cPcdh expression. These findings suggest that cPcdh expression is linked to neuronal spatial configuration being vertical or horizontal, as well as the developmental kinship being sister or cousin.
Fig. 2. Coupling between cPcdh expression and spatial configuration of the clone.
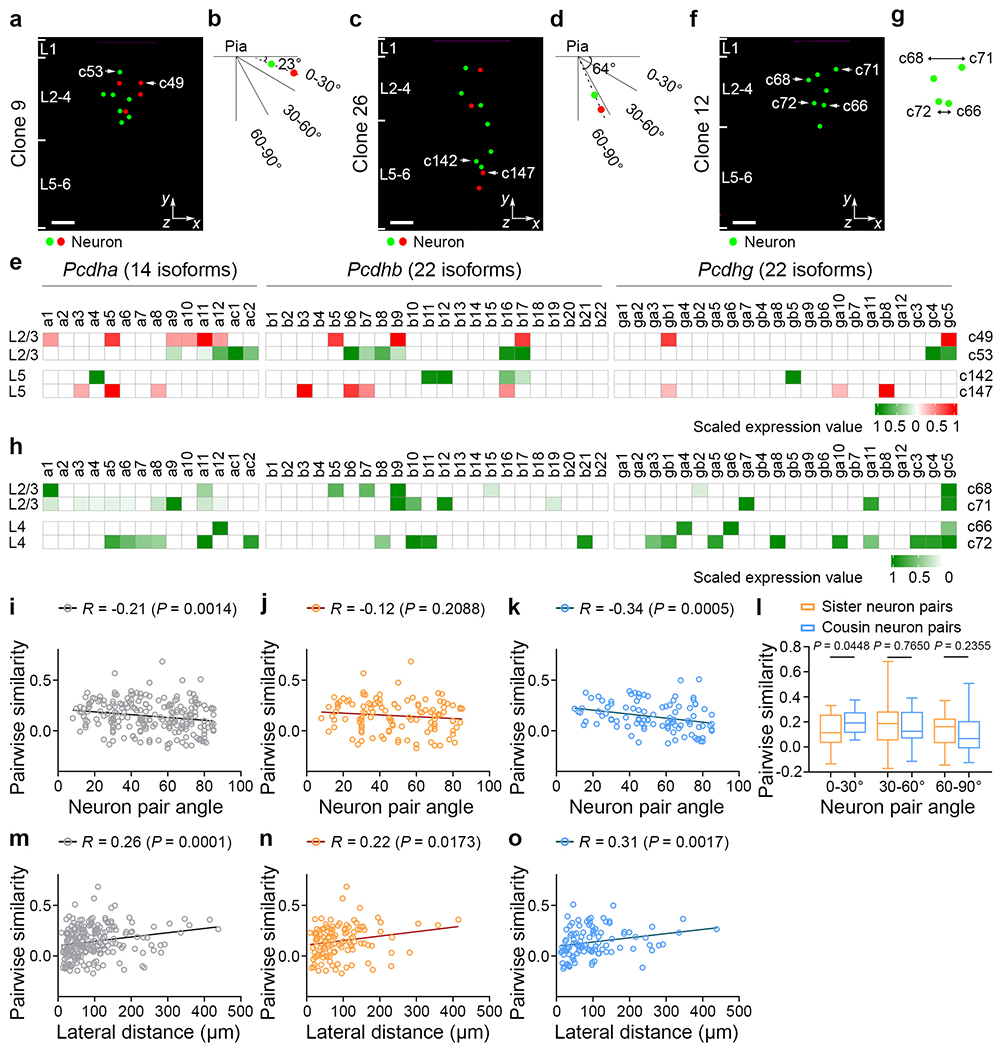
a-d, Representative 3D reconstruction images (a,c) and diagrams (b,d) of neurons in the same layers with different spatial configuration for clones 9 (a,b) and 26 (c,d). For a and c, scale bars, 100 μm. e, Heat map of cPcdh transcripts in neurons of the same layers with a horizontal (top; a and b) or vertical (bottom; c and d) spatial configuration. The colours reflect fluorescent labelling. f,g, Representative 3D reconstruction image (f) and diagram (g) of neurons in the same layers with different lateral dispersion. For f, scale bar, 100 μm. h, Heat map of cPcdh transcripts for neurons in the same layers with different lateral dispersion. i-k, Spearman correlation analyses between the pairwise similarity of cPcdh transcripts and the angular orientation in the same layers (L2-4 and L5-6) (n = 219 (clone), n = 118 (sister) and n = 101 (cousin)) for total clone neuron pairs (i), sister neuron pairs (j) and cousin neuron pairs (k). For i-k and m-o, each symbol indicates a pair. The solid lines represent the linear regression. l, Quantification of the pairwise similarity of sister and cousin neuronal pairs in different spatial configurations (0-30°: n = 29 (sister) and n = 21 (cousin); 30-60°: n = 47 (sister) and n = 32 (cousin); and 60-90°: n = 42 (sister) and n = 48 (cousin)). m-o, Spearman correlation analyses between the pairwise similarity in cPcdh transcripts and the lateral distance of clonally related excitatory neurons (n = 219 (clone), n = 118 (sister) and n = 101 (cousin)) for total clone neuron pairs (m), sister neuron pairs (n) and cousin neuron pairs (o). Data are representative of at least three independent experiments. Statistical analysis was performed using two-tailed Spearman correlation analysis (i-k and m-o) and two-tailed unpaired Student’s t-tests (l). The box plots are as described in Fig. 1.
The other critical spatial feature is their relative lateral distance. Whereas some neurons showed a large lateral dispersion (such as c68 and c71), others were more closely located (for example, c66 and c72) (Fig. 2f,g). We analysed the pairwise cPcdh expression similarity of clonally related neurons in the superficial or deep layers with regard to their lateral distance between the somas. Notably, it showed a positive correlation with the lateral distance (Fig. 2m–o). The greater the lateral distance, the higher the cPcdh expression similarity. These results suggest that cPcdh expression in clonally related excitatory neurons is linked to their lateral localization.
Together, these results provide evidence that the expression of diverse cPcdhs in individual neocortical excitatory neuron is not only linked to their kinship, but also coupled with their spatial organization. These findings raise the intriguing possibility that cPcdh expression regulates the recognition and spatial organization of neocortical excitatory neurons.
PCDHγ removal leads to clonal clustering
To directly test whether the intricate expression pattern of cPCDH expression in neocortical excitatory neurons regulates their organization, we took advantage of the Pcdhγfcon3/fcon3 mouse allele43,44, which eliminates the functional expression of all PCDHγ isoforms. We integrated it with the Emx1-CreERT2;MADM system and examined the spatial organization of individual neocortical excitatory neuron clones (Fig. 3a). As described above, we observed both symmetric proliferative clones and asymmetric neurogenic clones (Fig. 3b,c and Extended Data Fig. 6a,b). Notably, compared with the wild type (WT) control clone, the mutant clone lacking functional PCDHγ isoforms (that is, Pcdhg conditional knockout (cKO)) appeared to be more compact in the lateral or horizontal direction (Fig. 3b,c and Extended Data Fig. 6a,b). To quantitatively assess this, we measured the pairwise and maximal lateral and radial distances of individual clones. Compared with the WT control clone, the Pcdhg-cKO clone showed significantly smaller pairwise and maximal lateral distances (Fig. 3d,f and Extended Data Fig. 6c–j), whereas the pairwise and maximal radial or vertical distances did not show any significant change (Fig. 3e,g and Extended Data Fig. 6c–j). There was no significant difference in the number of neurons per clone between the WT and Pcdhg-cKO clones (Extended Data Fig. 7a), in the overall excitatory neuron density between the WT and Emx1-Cre;Pcdhγfcon3/fcon3 neocortices (Extended Data Fig. 7b–d) or in the dendritic morphology of the WT and Pcdhg-cKO neocortical excitatory neurons (Extended Data Fig. 7e–i). Selective removal of functional PCDHγs in nascent excitatory neurons also led to a decrease in the pair-wise and maximal lateral distances of the clone (Extended Data Fig. 7j–q). The decrease in the pairwise and maximal lateral distances in the Pcdhg-cKO clone was observed during embryonic and neonatal development (Extended Data Fig. 8). Together, these results suggest that the removal of functional PCDHγ isoforms leads to a lateral clustering or compaction of clonally related excitatory neurons in the neocortex without affecting the overall neuronal density, lamination or dendrite morphology.
Fig. 3. PCDHγ removal causes a lateral clustering of clonally related excitatory neurons.
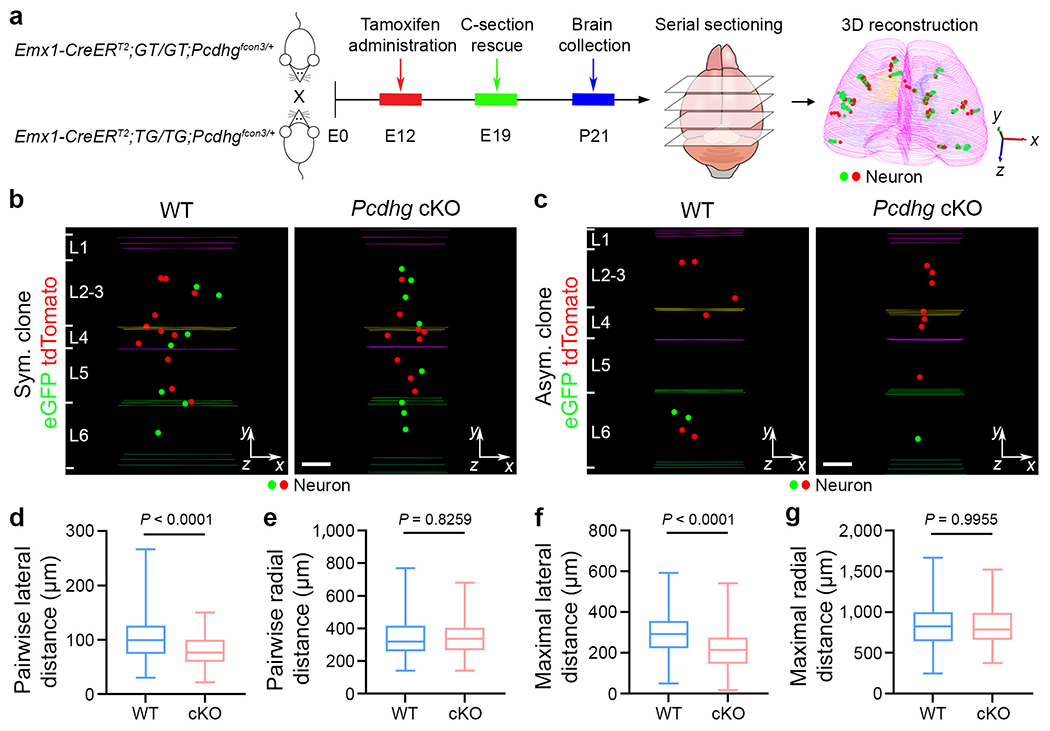
a, Diagram of the experimental procedure of MADM-based clonal analysis in the WT and Pcdhg-cKO neocortices. b,c, Representative 3D reconstruction images of P21 WT (left) and Pcdhg-cKO (right) symmetric (Sym.) (b) and asymmetric (Asym.) (c) clones labelled by MADM. The coloured lines indicate layer boundaries. For b and c, scale bars, 100 μm. d-g, Quantification of the pairwise (d,e) and maximal (f,g) lateral (d,f) and radial (e,g) distances between neurons in individual WT and Pcdhg-cKO clones. n = 158 clones, including 68 symmetric and 90 asymmetric clones, collected from around 480 brain sections from 8 brains (WT); and n = 164 clones, including 74 symmetric and 90 asymmetric clones, collected from around 475 brain sections from 8 brains (Pcdhg-cKO). Data are representative of four independent experiments. Statistical analysis was performed using two-tailed unpaired Student’s t-tests (d-g). The box plots are as described in Fig. 1.
Pcdhgc3 overexpression causes clonal dispersion
To further examine the function of cPCDH expression diversity on neocortical neuronal organization, we took advantage of the Pcdhgc3 conditional expression allele34, which allows the expression of the single PCDHγC3 isoform in a Cre-recombinase-dependent manner at a high level. We integrated the Pcdhgc3 conditional expression allele with the Emx1-CreERT2;MADM system and assessed the spatial organization of individual excitatory neuron clones (Fig. 4a). In contrast to functional PCDHγ isoform removal, overexpression of the single PCDHγC3 isoform led to an increase in lateral dispersion of clonally related neurons (Fig. 4b,c and Extended Data Fig. 9a,b). Both the pairwise and maximal lateral distances of the Pcdhgc3-overexpressing clone were significantly larger than those of the WT clone (Fig. 4d,f and Extended Data Fig. 9c–j), whereas the pairwise and maximal radial distances were largely similar (Fig. 4e,g and Extended Data Fig. 9c–j). There were no obvious differences in the number of excitatory neurons or the dendritic morphology between the WT and Pcdhgc3-overexpressing clones (Extended Data Fig. 10a–f). Selective overexpression of Pcdhgc3 in nascent excitatory neurons also led to an increase in the pairwise and maximal lateral distances of the clone (Extended Data Fig. 10g–m). The increase in the pairwise and maximal lateral distances in the Pcdhgc3-overexpressing clones was observed during embryonic and neonatal development (Extended Data Fig. 11). These results show that overexpression of a single cPCDH isoform causes a lateral dispersion of clonally related excitatory neurons in the neocortex.
Fig. 4. Pcdhgc3 overexpression leads to a lateral dispersion of clonally related excitatory neurons.
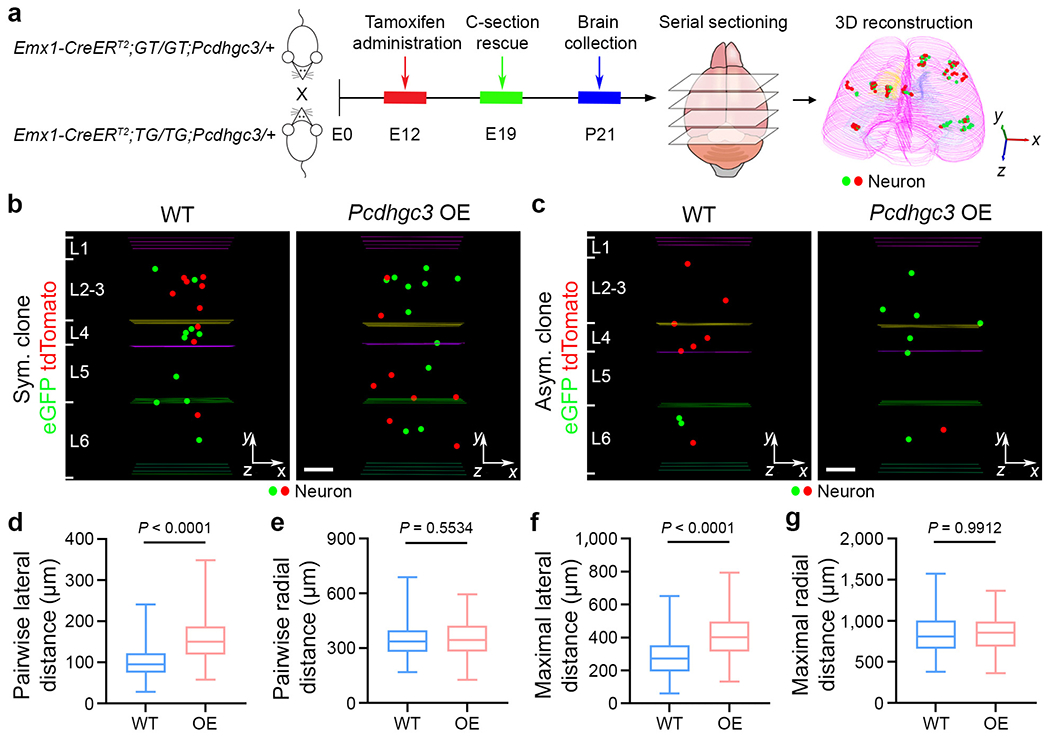
a, Diagram of the experimental procedure of MADM-based clonal analysis in the WT and Pcdhgc3-overexpressing (OE) neocortices. b,c, Representative 3D reconstruction images of P21 WT and Pcdhgc3-overexpressing symmetric (b) and asymmetric (c) clones labelled by MADM. For b and c, scale bars, 100 μm. d-g, Quantification of the pairwise (d,e) and maximal (f,g) lateral (d,f) and radial (e,g) distances between neurons in individual WT and Pcdhgc3-overexpressing clones. n = 178 clones, including 79 symmetric and 99 asymmetric clones, collected from around 434 brain sections from 7 brains (WT); and n = 154 clones, including 86 symmetric and 68 asymmetric clones, collected from around 425 brain sections from 7 brains (Pcdhgc3 overexpression). Data are representative of four independent experiments. Statistical analysis was performed using two-tailed unpaired Student’s t-tests (d-g). The box plots are as described in Fig. 1.
PCDHγ removal enhances clonal connectivity
It has previously been shown that sister excitatory neurons originating from the same neurogenic RGPs preferentially develop chemical synapses17. We therefore examined the synaptic connectivity of neocortical excitatory neuron clones in the WT and Pcdhg-cKO brains labelled by MADM at around E12 by performing quadruple whole-cell patch clamp recording in live brain slices at P14-35 (Fig. 5a,c), when excitatory chemical synapses are largely formed17. Nearby unlabelled excitatory neurons were also recorded as non-clonally related controls. Once all recordings were established, trains of brief and extended suprathreshold depolarizing currents were injected sequentially into one of the four neurons to trigger action potentials, and the current changes were monitored in all the other three neurons to probe chemical synaptic connectivity (Fig. 5b,d). In the WT clone example shown here (Fig. 5b,e (left)), action potentials generated in eGFP-expressing excitatory neuron 3 reliably elicited postsynaptic responses in its clonally related eGFP-expressing sister excitatory neuron 2, indicating the existence of a chemical synaptic connection between them. Together, these results suggest that clonally related sister excitatory neurons 2 and 3 are selectively synaptically connected.
Fig. 5. PCDHγ removal enhances the preferential synaptic connectivity between clonally related excitatory neurons.
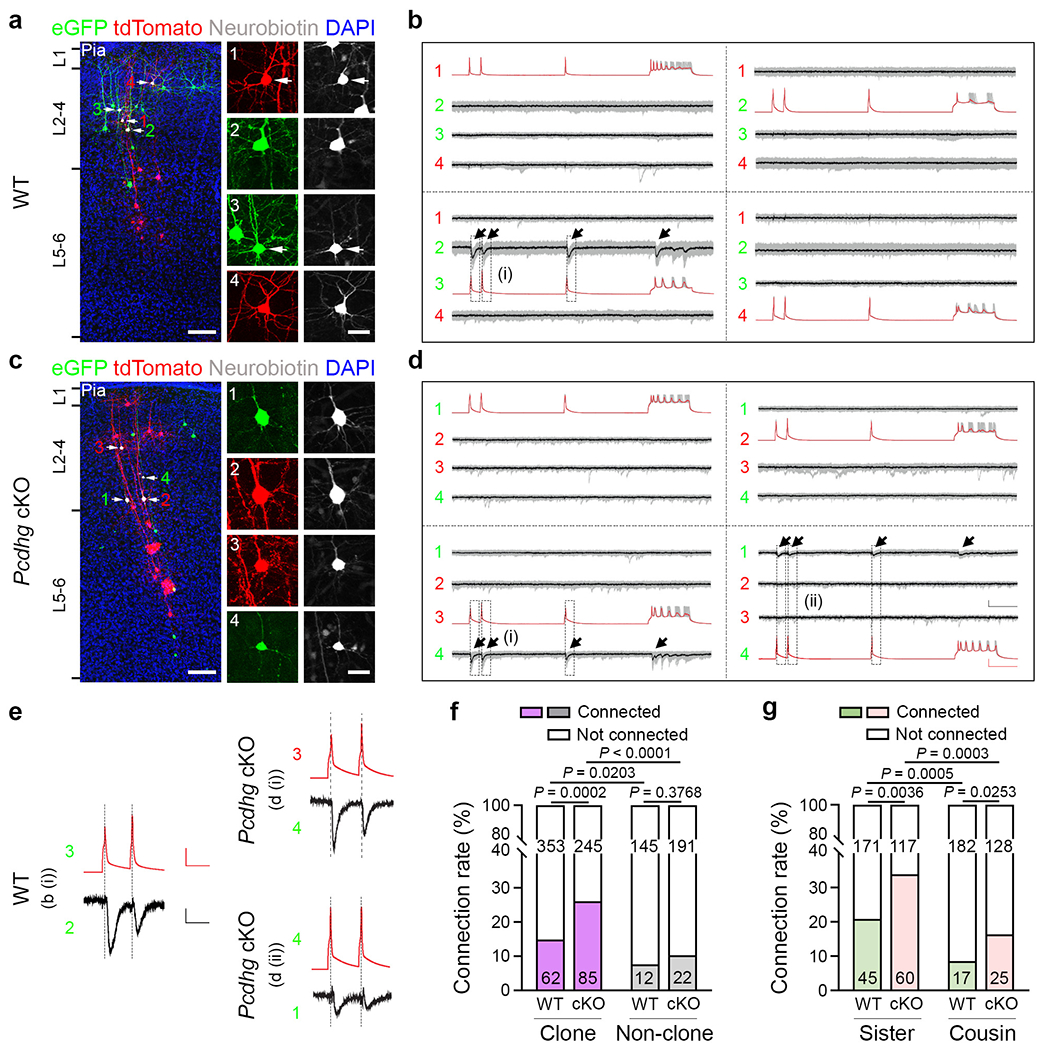
a,c, Representative confocal images of four eGFP-expressing (green) or tdTomato-expressing (red) clonally related WT (a) and Pcdhg-cKO (c) excitatory neurons (1-4, arrows) that were processed for quadruple whole-cell patch-clamp recording. For a and c, scale bars, 100 μm (left) and 20 μm (right). b,d, Example traces of the four clonally related excitatory neurons recorded in a (b) and c (d). Individual traces are shown in grey and the average traces (n = 25-30 (b) and n = 14-30 (d)) are shown in red (presynaptic) or black (postsynaptic). The arrows indicate the reliable postsynaptic responses. Scale bars, 50 mV (red, vertical), 10 pA (black, vertical) and 100 ms (red and black, horizontal). e, High-magnification traces of WT (left, b (i)) and Pcdhg-cKO (right, d (i) and d (ii)) clonally related excitatory neurons shown in b and d. Scale bars, 50 mV (red, vertical), 5 pA (black, vertical) and 50 ms (red and black, horizontal). f, Summary of the rate of synaptic connections between clonally related WT and Pcdhg-cKO excitatory neurons and nearby non-clonally related excitatory neurons in a similar spatial configuration. WT: n = 415 (clone) and n = 157 (non-clone), around 99 brain slices from 31 brains; Pcdhg-cKO: n = 330 (clone) and n = 213 (non-clone), around 92 brain slices from 29 brains. g, Summary of the rate of synaptic connections between WT and Pcdhg-cKO sister (n = 216 (WT) and n = 177 (Pcdhg-cKO)) and cousin (n = 199 (WT) and n = 153 (Pcdhg-cKO)) excitatory neurons. For f and g, the n values indicate neuron pairs. Data are representative of at least 20–30 independent experiments. Statistical analysis was performed using two-tailed χ2 tests (f and g).
We analysed a total of 415 quadruple recordings of clonally related WT excitatory neuron pairs labelled at E12, including both sister and cousin neuron pairs. Of these, about 14.9% (62 out of 415) were synaptically connected (Fig. 5f (left)). In comparison, only around 7.6% (12 out of 157) of non-clonally related neurons in a similar spatial configuration, as reflected in the inter-soma distance (Extended Data Fig. 12a), were synaptically connected (Fig. 5f). Moreover, we found that, while sister neuron pairs (~20.8%, 45 out of 216) showed a higher synaptic connectivity rate than non-clonally related neuronal pairs, cousin neuron pairs (~8.5%, 17 out of 199) exhibited a similar synaptic connectivity rate to non-clonally related neuronal pairs (Fig. 5f,g). These results suggest that clonally related excitatory neurons in the neocortex preferentially develop chemical synapses, as previously shown17. Moreover, this preferential connectivity is restricted to sister excitatory neurons originating from asymmetrically dividing, neurogenic RGPs, but not to cousin excitatory neurons originating from symmetric dividing, proliferative RGPs. In alignment with this, due to the mixture of sister and cousin neuron clones labelled at E12, the overall synaptic connectivity rate of clonally related neurons examined here is lower than those labelled at E13 or later with sister neurons only in the previous study17. This is further reflected in a recent study with a much lower synaptic connectivity rate for clonally related neurons labelling at an even earlier time point (that is, E10.5) containing more cousin neurons45.
By contrast, in the Pcdhg-cKO clone example (Fig. 5d,e (right)), action potentials generated in tdTomato-expressing excitatory neuron 3 reliably elicited postsynaptic responses in eGFP-expressing excitatory neuron 4, and action potentials generated in eGFP-expressing neuron 4 reliably elicited postsynaptic responses in eGFP-expressing excitatory neuron 1. These results suggest that sister excitatory neurons 4 and 1 as well as cousin excitatory neurons 3 and 4 develop unidirectional chemical synapses with each other. We analysed a total of 330 quadruple recordings of clonally related Pcdhg-cKO neuronal pairs, of which around 25.8% (85 out of 330) were synaptically connected (Fig. 5f). Only around 10.3% (22 out of 213) of non-clonally related neuronal pairs in a similar spatial configuration were synaptically connected (Fig. 5f and Extended Data Fig. 12a,b). Notably, the synaptic connectivity rate between clonally related Pcdhg-cKO neuronal pairs was significantly higher than non-clonally related neuronal pairs, as well as clonally related WT neuronal pairs. There were no obvious differences in biophysical properties between the WT and Pcdhg-cKO neurons (Extended Data Fig. 12c–f). These results suggest that the removal of all functional PCDHγ isoforms strongly enhances synaptic connectivity between clonally related neocortical excitatory neurons.
This enhancement is evident for both sister and cousin neuron pairs (Fig. 5g and Extended Data Fig. 12g). Given that cPcdh isoforms exhibit spatial configuration-dependent expression patterns (Fig. 2), we next examined the synaptic connectivity rate of clonally related WT and Pcdhg-cKO neuronal pairs with regard to their spatial configuration (Extended Data Fig. 12h,i and Supplementary Table 1). The synaptic connectivity was generally increased in the clonally related Pcdhg-cKO neuronal pairs, in particular, between horizontally distributed cousin neurons with more similar cPcdh expression pattern. Together, these results suggest that cPCDH expression regulates the synaptic connectivity of neocortical excitatory neurons.
Pcdhgc3 overexpression suppresses clonal connectivity
To further examine the functional role of diverse cPCDH expression in regulating synaptic connectivity in the neocortex, we next examined the effect of Pcdhgc3 single-isoform overexpression. We induced neocortical excitatory neuron clones in the Emx1-CreERT2;MADM;Pcdhgc3 mice at E12 and performed quadruple whole-cell patch clamp recordings at P14-35 in live brain slices (Fig. 6a–e). As shown above and previously17, the clonally related WT neuronal pairs (~15.1%, 48 out of 318) showed a significantly higher synaptic connectivity than the non-clonally related neuronal pairs in a similar spatial configuration (~7.8%, 10 out of 128) (Fig. 6f and Extended Data Fig. 13a,b). By contrast, only about 6.8% (22 out of 324) of clonally related Pcdhgc3-overexpressing neuronal pairs were synaptically connected, comparable to around 6.5% (10 out of 153) of non-clonally related neuronal pairs in a similar spatial configuration (Fig. 6f and Extended Data Fig. 13a,b). Pcdhgc3 overexpression did not change the biophysical properties of neurons (Extended Data Fig. 13c–f). Notably, this loss in synaptic connectivity was prominent in sister, but not in cousin, excitatory neurons in a similar spatial configuration (Fig. 6g, Extended Data Fig. 13g–i and Supplementary Table 1). Together, these results suggest that overexpression of a single isoform of PCDHγC3 suppresses the preferential synaptic connectivity between clonally related excitatory neurons in the neocortex, opposite to the removal of all functional PCDHγ isoforms. These findings further support the notion that diverse cPCDH expression influences the fine circuit organization of neocortical excitatory neurons.
Fig. 6. Pcdhgc3 overexpression disrupts preferential synaptic connectivity between clonally related excitatory neurons.
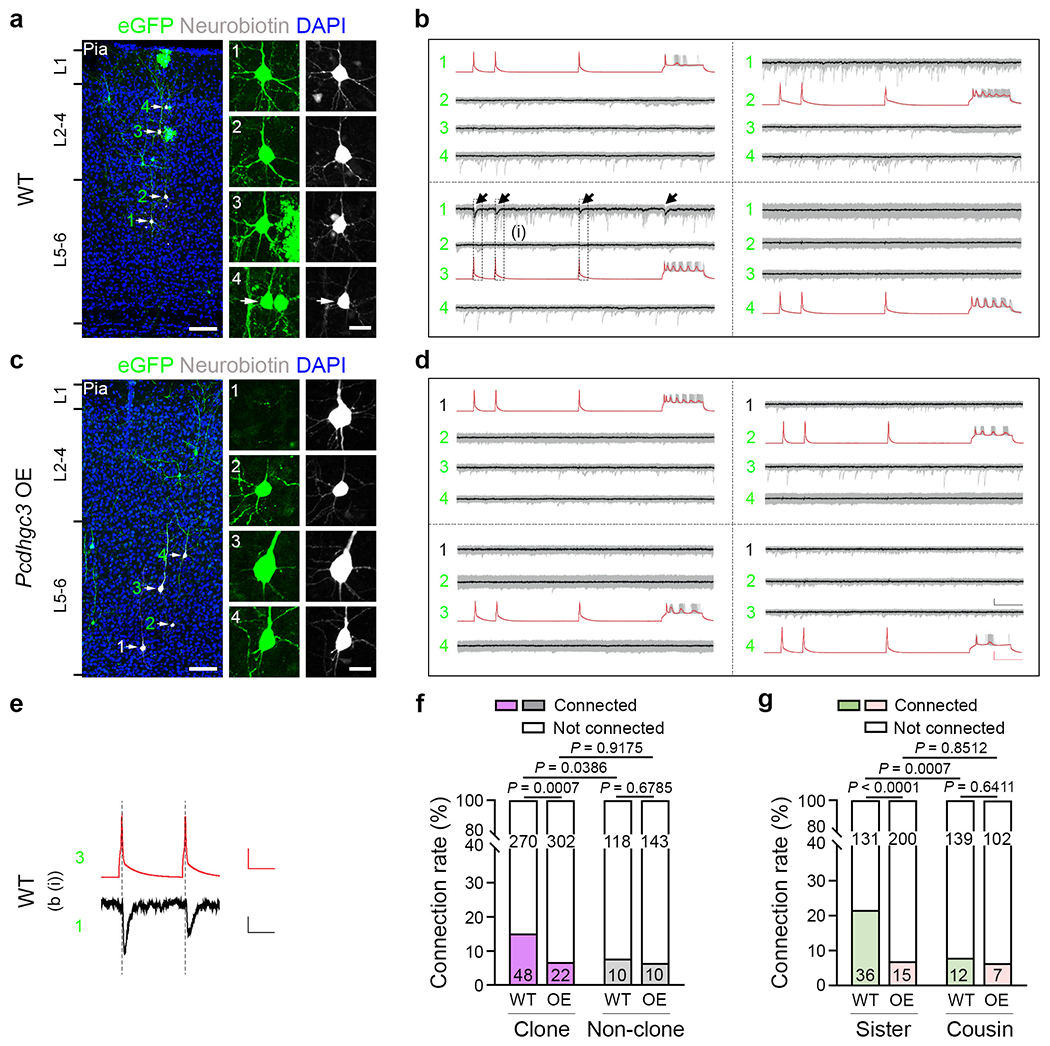
a,c, Representative confocal images of eGFP-expressing clonally related WT (a, 1-4) and Pcdhgc3-overexpressing (c, 2-4) excitatory neurons (arrows) or nearby unlabelled control excitatory neurons (c, 1) analysed using whole-cell patch-clamp recording. High-magnification images of the cell bodies of the recorded neurons filled with neurobiotin (white) are shown on the right. For a and c, scale bars, 100 μm (left) and 20 μm (right). b,d, Example traces of four excitatory neurons recorded in a (b) and c (d). Individual traces are shown in grey and the average of traces (n = 20-30 (b) and n = 29-30 (d)) are shown in red (presynaptic) or black (postsynaptic). Scale bars, 50 mV (red, vertical), 10 pA (black, vertical) and 100 ms (red and black, horizontal). e, High-magnification traces of the presynaptic action potentials and the postsynaptic responses in the WT clonally related excitatory neurons shown in b (i). Scale bars, 50 mV (red, vertical), 5 pA (black, vertical) and 50 ms (red and black, horizontal). f, Summary of the rate of synaptic connections between the clonally related WT and Pcdhgc3-overexpressing excitatory neurons and nearby non-clonally related excitatory neurons. WT: n = 318 (clone) and n = 128 (non-clone), around 75 brain slices from 24 brains; Pcdhgc3 overexpression: n = 324 (clone) and n = 153 (non-clone), around 85 brain slices from 29 brains. g, Summary of the rate of synaptic connections between the WT and Pcdhgc3-overexpressing sister (n = 167 (WT) and n = 215 (Pcdhgc3 overexpression)) or cousin (n = 151 (WT) and n = 109 (Pcdhgc3 overexpression)) excitatory neurons. For f and g, the n values indicate neuron pairs. Data are representative of at least 20-30 independent experiments. Statistical analysis was performed using two-tailed χ2 tests (f and g).
Discussion
How a large number of neurons in the neocortex are organized at single-cell resolution is a fundamental question1. Here we show that the diverse and combinatory expression of cPCDHs in neocortical excitatory neurons linked to the developmental origin affects their fine structural and functional organization. Similar to Down syndrome cell adhesion molecule (Dscam) in insects46–48, cPCDHs encoded by the Pcdha, Pcdhb, and Pcdhg gene clusters have been shown to express in a stochastic and combinatorial manner, which provides a large repertoire of surface molecular identity for intracellular or intercellular recognition and interactions2,3,7. Notably, our data reveal a previously unknown feature of cPcdh expression; that is, the lineage relationship and developmental origin influence cPcdh expression. Clonally related neocortical excitatory neurons exhibit a significantly higher similarity in cPcdh expression than non-clonally related ones. Moreover, clonally related neocortical excitatory neurons in the same layer exhibit a significantly higher similarity in cPcdh expression than those in different layers. These findings indicate that the expression of cPcdh isoforms in neocortical excitatory neurons is neither random nor determinative, but exhibits patterns linked to their progenitor origin and developmental history. Given that neocortical neurons are produced by asymmetrically dividing RGPs in a progressive manner, these results raise an intriguing possibility that the selection of cPcdh isoforms is coupled to RGP division. As neurogenic RGPs go through consecutive rounds of asymmetric division, the expression of cPcdh isoforms in neuronal progenies becomes gradually diversified. For example, for each round of asymmetric division, the chosen cPcdh promoters determined by CTCF/Cohesin-mediated chromatin looping could gradually reset after DNA replication3,23. At the same time, clonally related neuronal progenies (e.g., sister neurons) progressively migrate radially to occupy the neocortex in a birth date-dependent inside-out manner. As a result, the more apart in RGP division and neuronal layer occupation, the less similar in cPcdh isoform expression. On the other hand, cousin neurons generated by two related neurogenic RGPs at a similar time and thus located in the same layer may possess more similar cPcdh isoform expression. Notably, lineage-dependent Dscam1 isoform expression and repulsion have been observed in the Drosophila brain for establishing columnar units49, pointing to the remarkable functional convergence of these two large families of cell surface recognition molecules.
The expression of cPcdh isoforms is also linked to the spatial configuration of clonally related neocortical excitatory neurons. The greater in the lateral dispersion of soma location in a layer, the more similar in the cPcdh expression pattern. This is in line with the repulsive effect of homophilic interaction of cPCDHs29–32. Indeed, the removal of all 22 functional PCDHγ isoforms that reduces the expression and surface interaction of cPCDHs leads to a lateral clustering of clonally related excitatory neurons. On the other hand, overexpression of a single cPCDH isoform, PCDHγC3, overriding the diversity of cPCDHs and thereby enhances homophilic cell-surface interaction and repulsion, resulting in a greater lateral dispersion of clonally related excitatory neurons. These observations are in parallel with the function of cPCDHs in regulating dendrite or axon self-avoidance in starburst amacrine cells, Purkinje cells, olfactory sensory neurons, or serotonergic neurons27,33–36. PCDHγ removal has previously been shown to reduce dendrite arborization of neocortical neurons50. We did not observe any obvious changes in dendrite morphology of neocortical neurons in individual clones lacking PCDHγ or overexpressing PCDHγC3, raising the possibility of a non-cell autonomous function of cPCDH in regulating dendrite formation or maintenance. Although the majority of previous studies emphasize the recognition and self-avoidance between neurites of the same cell, our data suggest that cPCDH expression mediates inter-cellular recognition and interactions of clonally related excitatory neurons and influences their spatial arrangement in the neocortex. Moreover, we found that cPCDH expression also regulates the preferential synaptic connectivity between clonally related excitatory neurons. These findings indicate that cPCDH expression affects spatial arrangement of clonally related neocortical excitatory neurons during embryonic and neonatal development, which likely influences their preferential synaptic connectivity development21.
It has been shown that cPCDHs form promiscuous cis-dimeric biantennary interaction units, which mediate highly specific repulsive trans-interactions29–32. Our data suggest that diverse yet patterned cPCDH expression biases the spatial localization of the cell bodies of neocortical excitatory neurons as well as their synaptic connectivity, which can only be discerned at the clonal mosaic level, but not at the total population level. While we observe significant differences in cPcdh expression similarity in neocortical excitatory neurons depending on their developmental origin and spatial configuration, it will be interesting to understand how this cPcdh expression similarity affects inter-cellular recognition and interactions of clonally related excitatory neurons with regard to kinship, cell body positioning and synaptic connectivity. Nonetheless, our study suggests a molecular regulation framework of the structural and functional organization of neocortical excitatory neurons at the single-cell level.
Methods
Mice
MADM-11GT (JAX, 013749) and MADM-11TG mice (JAX, 013751) were produced as previously described51. Emx1-CreERT2 40, Pcdhγfcon3 43,44 and Pcdhγc3 34 mice were kindly provided by N. Tekki-Kessaris, J.L. Lefebvre and J.A. Weiner, respectively. For MADM labelling, Emx1-CreERT2;MADM-11GT/GT mice were crossed with Emx1-CreERT2;MADM-11TG/TG mice, Emx1-CreERT2;MADM-11GT/GT;Pcdhgfcon3/+ mice were crossed with Emx1-CreERT2;MADM-11TG/TG;Pcdhgfcon3/+ mice, and Emx1-CreERT2;MADM-11GT/GT;Pcdhgc3/+ mice were crossed with Emx1-CreERT2;MADM-11TG/TG;Pcdhgc3/+ mice. For retrovirus labelling, Pcdhgfcon3/fcon3 mice were crossed with Pcdhgfcon3/+ mice, and Pcdhgc3/gc3 mice were crossed with Pcdhgc3/gc3 mice. Emx1-Cre mice (JAX, 005628) were crossed with Pcdhgfcon3/fcon3 to generate cortical-specific Pcdhg-cKO. CD-1 mice purchased from animal facility of Tsinghua University were used for electroporation. The vaginal plug date was designated as E0, and the birth date was defined as P0. Mice were housed in individual cages (3 to 5 animals per cage) in a pathogen-free animal facility under a 12-h light/12-h dark cycle and temperature range of 20-26°C with the 40-70% humidity. Both male and female mice were used in the study. Further information (species, strain, sex, and age) of the mice used in individual experiments is provided in Supplementary Table 2. All mouse experiments were performed in accordance with the protocols approved by the Institutional Animal Care and Use Committee of Tsinghua University and Memorial Sloan Kettering Cancer Centre.
In utero intraventricular retrovirus injection and electroporation
The retroviral plasmids of doublecortin (Dcx)-promoter-driven eGFP and cre-T2A-tdTomato were constructed by replacing the human ubiquitin C promoter in pUX retroviral vector39 with a 2 kb Dcx genomic fragment upstream of the translation start site in the mouse Dcx gene, which allows specific gene expression in nascent neurons52. HEK 293T cells were cultured in Dulbecco’s modified Eagle’s medium (DMEM, Thermo, 11995065) supplemented with 10% fetal bovine serum (FBS, GE Healthcare, SH30071.03HI), non-essential amino acids (Thermo, 11140050), and penicillin/streptomycin (Thermo, 10378016) in a 37°C, 5% CO2 incubator. The cells were plated and cultured overnight before plasmid transfection. Retroviruses were produced by co-transfection of the retroviral plasmid, and the envelope and packaging plasmids into HEK293T cells using Lipofectamine 3000 (Thermo, L3000150) followed by ultracentrifugation for viral particle collection. The titre of retrovirus used for clonal labelling was 4-5×10⁶ infectious unit per mL, estimated by infecting HEK293T cells with serially diluted retrovirus. Retrovirus (1-2 μL) with 1% fast green (2.5 mg/mL, Sigma, F7252) was injected into the embryonic lateral ventricle through a bevelled, calibrated glass micropipette (Drummond Scientific, 5-000-1001-x10). For in utero electroporation, 1-1.5 μL of plasmid (1 μg/μL) mixed with 1% fast green were injected into the embryonic lateral ventricle. Electroporation was carried out using an electroporator (BTX ECM830) (5 pulses; ~40 Volts, 50 msec duration, 950 msec interval). After injection or electroporation, the uterus was placed back in the abdominal cavity and the wound was surgically sutured. At the completion of the surgery, the animal was placed in a recovery incubator under close monitoring until full recovery.
Tamoxifen administration, immunohistochemistry, and 3D reconstruction of clones
For MADM clone labelling, pregnant mice were injected intraperitoneally with tamoxifen (Sigma, T5648) or 4-hydroxytamoxifen (Sigma, H6278) dissolved in corn oil at ~E12 at a dose of 25-50 mg/kg of body weight. Live embryos were recovered at ~E19 through caesarean section, fostered, and raised. Brains were collected at different time points for further analysis. The mice were perfused with phosphate buffered saline (PBS, pH 7.4), followed by 4% paraformaldehyde (PFA) in PBS. Brains were removed and fixed in 4% PFA at 4°C. Serial coronal sections of individual brains were prepared using a vibratome (Leica) and subjected to immunohistochemistry.
Brain sections were blocked in 10% horse serum containing 0.5% Triton X-100 for 1 hour at room temperature (RT). Primary antibody incubation was subsequently performed overnight at 4°C, followed by secondary antibody incubation at RT for 2 hours. The primary antibodies used included chicken anti-GFP (Aves lab, GFP-1020, RRID: AB_10000240, Lot: GFP879484, 1:1000), rabbit anti-RFP (Rockland, 600-401-379, RRID: AB_2209751, Lot: 39707 1:1000), rabbit anti-CUX1 (Santa Cruz, sc-13024, RRID: AB_2261231, Lot: H2815, 1:100), rabbit anti-Doublecortin (Cell Signaling Technology, 4604, RRID: AB_561007, Lot: 3, 1:500), rat anti-CTIP2 (Abcam, ab18465, RRID: AB_2064130, Lot: GR203038-2, 1:500). The following secondary antibodies were used: goat anti-chicken IgY (H+L) 488 (Thermo, A11039, RRID: AB_2534096, Lot: 2079383, 1:1000), donkey anti-rabbit IgG (H+L) Cy3 (Jackson ImmunoResearch, 711-165-152, RRID: AB_2307443, Lot: 157936, 1:1000), or donkey anti-rat IgG (H + L) 488 (Thermo, A21208, RRID: AB_2535794, Lot: 1979698, 1:1000). Nuclei were counterstained with 4’,6-diamidino-2-phenylindole (DAPI; Sigma, D9542, 1:1000). Images were acquired using a confocal microscope (FV3000, Olympus). Z-series images were taken at 1.5-2.5 μm steps and analysed using FluoView (4.2, Olympus), Volocity (6.3, Perkin Elmer), Image J (1.52p, NIH), and Photoshop (2020, Adobe).
For 3D reconstruction, brains were collected at different time points and subjected to serial sectioning and 3D reconstruction to recover individual clones in the neocortex. Each section was analysed sequentially from the rostral to the caudal end using Neurolucida (2011, MBF Bioscience). Individual labelled neurons were distinguished based on their morphology and represented as coloured dots for their cell bodies. Layer boundaries based on nuclear staining were traced and aligned. Cortical areas were identified using the Allen Brain Atlas. The neuronal position and distribution were analysed using Neurolucida (2011, MBF Bioscience), MATLAB (R2019a, MathWorks), and R-Studio (3.6.1, RStudio). The neuronal morphology was further quantified with Sholl analysis and Branch angle53 analysis using Neurolucida and Stereo Investigator (2011, MBF Bioscience). The planar and local angles characterize the direction that branches take after a node. The planar angle measures the change in the direction from one branch to the next branch. The local angle measures the change in direction using the line segments closest to the node.
scRNA-seq
Live cell extraction and scRNA-seq experiments were performed as previously described54,55. In brief, glass pipettes (Sutter, BF150-110-10) were autoclaved before pulling, and all work surfaces including micromanipulators were thoroughly cleaned with RNase Zap (Thermo, AM9780) and maintained as a possible RNase-free environment during sample collection. The entire nucleus and most of the soma cytoplasm of the labelled single neuron of individual clones were collected from live brain slices prepared and maintained in artificial cerebrospinal fluid (ACSF) containing 126 mM NaCl, 3 mM KCl, 1.2 mM NaH2PO4, 1.3 mM MgSO4, 2.5 mM CaCl2, 26 mM NaHCO3, and 10 mM Dextrose, bubbled with 95% O2 and 5% CO2, via aspiration into the glass pipette. If any undesired contents were observed to enter the pipette, the pipette and its content were discarded. Otherwise, the contents of the pipette were ejected using positive pressure into an RNase-free PCR tube containing 4 μL of RNase-free lysis buffer consisting of: 0.094% Triton X-100 (Sigma, 93443), 0.625 mM (each) dNTPs (NEB, N0447), 0.5 mM DTT (Sigma, 43816), 2.5 μM Oligo-dT30VN (5′-AAGCAGTGGTATCAACGCAGAGTACT30VN-3′), and 1 U/μL RNase inhibitor (Takara, 2313). Sample tubes were kept on ice for further processing. Negative controls with no cell extraction were collected in the same manner. ERCC RNA Spike-In Mix (Thermo, 4456740) was added during reverse transcription. After 18-21 cycles of amplification, purified cDNA was used to construct sequencing libraries using the commercial kit according to the manufacturer’s instructions (TD502, Vazyme). Quality control was performed on both the amplified cDNA and the final library using a Bioanalyzer (Agilent). The concentration of the samples was quantified by Qubit3 (Thermo). High-quality cells (207/260) were kept based on the bioanalyzer profiles before being processed with the library generation. The single-cell libraries were pooled and sequenced using the Illumina HiSeqX10 or NovaSeq6000 platform.
Sequencing data analysis
First, three wrongly-annotated genes Gm37013, Gm38666, and Gm38667 in the mouse cPcdhs locus were removed from mm10 NCBI RefSeq genes. Second, mm10 genome together with ERCC library was indexed by STAR (2.7.9a). Trim_galore with the parameters “-q25 --paired --phred33 -j8 --length 50 -e0.1 --stringency 3” was used to filter lower quality reads. The non-filtered reads were then mapped by STAR with the default setting. Both uni-mapping and multi-mapping reads were used to quantify gene expression levels. For simplicity, a read mapping to N loci simultaneously was considered as N uni-mapping reads, but with a low weight of 1/N. Even uni-mapping reads may still stretch several exons, as appeared in two cases. For the complexity of cPcdh genes, if a read maps to the constant exons, the weight of the read is equally divided among the expressed members of these Pcdh gene clusters in a single cell. Second, if a read maps to several variable exons simultaneously due to their high sequence similarity, the weight of the read is equally divided among these cPcdh variable exons. Finally, reads counted as described above were normalized to reads per kilobase of transcript per million total reads (RPKM value). Quality control was performed via the function ‘quickPerCellQC’ with default parameters supplied in R packages SCATER to remove outliers based on the median absolute deviation of detected genes number per cell, the percentage of mitochondrial gene reads, and the percentage of ERCC reads. The neurons expressing more than two members of the cPcdh family were included for subsequent analyses. The cPcdh transcripts were not detected in 1% (2/188) of the cells. The cPcdh expression level is calculated by Log10 (105×RPKM+1) and normalized to the maximum in each cell. 105×RPKM serves to distinguish isoforms with low expression levels from undetected isoforms in the heatmaps. Heatmaps were displayed with ComplexHeatmap package (2.6.2)56.
Pairwise cPcdh similarity analysis
To quantify the similarity of the expression pattern of cPcdh isoforms between two cells, Spearman correlation coefficient was used to evaluate the pair-wise similarity. First, the expression levels of cPcdhs were normalized as mentioned above for each cell. Second, Spearman correlation coefficient was performed for each pair of cells based on the normalized expression data. The expression level of each cPcdh for two pair-wise cells was ordered from the largest to the least. Let x1s1, x1s2, …, x1sn denote the ranks of the cPcdh expression levels of cell x1 and let x2s1, x2s2, …, x2sn denote the ranks of the cPcdh expression levels of cell x2.
There are 58 members in the mouse cPcdh family, so n equals to 58.
To generate the non-clonal dataset, the cell order was randomly permutated while the clone size, cPcdh pattern, and layer identification were kept unchanged. Cells were then assigned to ‘clones’ in the new order to calculate the similarities between new pairs. Random permutations were performed for 1,000 trails, and a permutation test was processed by calculating P value as the ratio of permutations that have a mean value over the actual clone data (Extended Data Fig. 2o).
Neuronal identity mapping to the reference dataset
To assess the neuronal identity of each of the recovered and analysed clonally related neocortical excitatory neurons, the neurons in our dataset (n = 188) were mapped to the reference excitatory neuron subtypes identified in the previously published Allen Institute dataset57 (n = 9,100) using the FindTransferAnchors function58 in Seurat package with the parameters (normalization.method = “LogNormalize”, dims = 1:50, k.anchor = 5, k.filter = 200). The excitatory neuron subtype labels from the reference dataset to our dataset were transferred using the MapQuery function58 in Seurat package with the default parameters.
Electrophysiology
Embryos received tamoxifen or 4-hydroxytamoxifen administration during pregnancy were recovered at ~E19 through caesarean section, and were raised by foster mothers. Mice (P14-35) were anesthetized and intracardially perfused with an ice-cold cutting solution containing 120 mM Choline Chloride, 2.6 mM KCl, 26 mM NaHCO3, 1.25 mM NaH2PO4, 0.5 mM CaCl2, 7 mM MgCl2, 1.3 mM Ascorbic Acid, and 15 mM Dextrose, pre-bubbled with 95% O2 and 5% CO2 for 30 minutes. Brains were removed, and acute cortical slices (~300 μm in thickness) were prepared in ice-cold cutting solution bubbled with 95% O2 and 5% CO2 using a vibratome (Leica) at 4 °C. Slices were allowed to recover in an interface chamber with ACSF containing 126 mM NaCl, 3 mM KCl, 1.2 mM NaH2PO4, 1.3 mM MgSO4, 2.5 mM CaCl2, 26 mM NaHCO3, and 10 mM Dextrose, bubbled with 95% O2 and 5% CO2 at 34 °C for at least 1 hour and were then kept at RT before being transferred to a recording chamber containing ACSF at 32 °C. An infrared-differential interference contrast (IR-DIC) microscope (Olympus) equipped with epi-fluorescence illumination, a charge-coupled device camera, and two water immersion lenses (10× and 60×) were used to visualize and target the recording electrodes to EGFP- or tdTomato-expressing clonally related excitatory neurons and their nearby non-fluorescently labelled excitatory neurons. The live images were taken by camera with Ocular Image Acquisition Software (2.0, Teledyne Photometrics). Glass recording electrodes (~10 MΩ in resistance) were filled with an intracellular solution consisting of 126 mM K-Gluconate, 2 mM KCl, 2 mM MgCl2, 0.2 mM EGTA, 10 mM HEPES, 4 mM Na2ATP, 0.4 mM Na2GTP, 10 mM K-Phosphocreatine, and 0.5% Neurobiotin (Vector Labs, SP-1120) (pH 7.25 and osmolarity 305 mOsm/Kg). Recordings were collected and analysed using an Axon Multiclamp 700B amplifier and pCLAMP 10.7 software (Molecular Devices).
Excitatory neurons were selected based on their morphological characteristics, including a pyramid-shaped cell body with a major apical dendrite. Once all recordings were established, the excitatory neuron identity of recorded cells was further confirmed by their electrophysiological properties. In quadruple whole-cell recordings, synaptic connectivity was assessed by two brief (5 msec) high suprathreshold (600-1,000 pA) depolarization current injections separated by 50 or 100 msec (that is, 20 or 10 Hz) and one brief (5 msec) high suprathreshold (600-1,000 pA) depolarization current injection in 400 msec, followed by one long (200 msec) low suprathreshold (200-600 pA) depolarization current injection, into one of the neurons sequentially, and the responses of all neurons were monitored. For chemical synaptic connectivity detection, the neuron that received current injection was maintained under current clamp mode and the other neurons were maintained under voltage clamp mode at −70 mV. The criterion was that the average postsynaptic current was larger than 0.5 pA within 1-5 msec after the peak of the presynaptic action potential. For membrane property analysis, consecutive step currents (from −50 pA, 10 pA in step and 500 msec in duration) were injected into neurons.
For whole-cell patch-clamp recording experiments, slices were fixed in 4% PFA in PBS (pH, 7.4) after the recordings were completed, and the morphology of recorded neurons loaded with Neurobiotin was visualized with Alexa Fluor 647-conjugated streptavidin (Thermo, S21374, RRID: AB_2336066, Lot: 1979698, 1:1000) using a confocal laser scanning microscope (FV3000, Olympus). Z-series images were taken at 1.5-2.5 μm steps and analysed using FluoView (4.2, Olympus) and Photoshop (2020, Adobe).
Statistics and reproducibility
For individual experiments showing representative data, the experiments were repeated independently at least three times with similar results. scRNA-seq sequencing analysis was performed once but cell collections from 8 different brains. The numbers of mice, brains, brain slices, clones, or neurons in individual experiments were provided in Supplementary Table 3. Significance was determined using two-tailed unpaired or paired Student’s t-test, two-tailed χ2 test, one-way ANOVA test, one-tailed permutation test, and two-tailed Spearman or Pearson correlation analysis using GraphPad Prism 9 software. Bar graphs indicate mean ± s.e.m. Box plots indicate median (centre line), interquartile range (box) and minimum and maximum values (whiskers). Differences were considered statistically significant at P < 0.05.
Extended Data
Extended Data Fig. 1. MADM-labelling of individual excitatory neuron clones in the neocortex and quality check of cell aspiration and extraction.
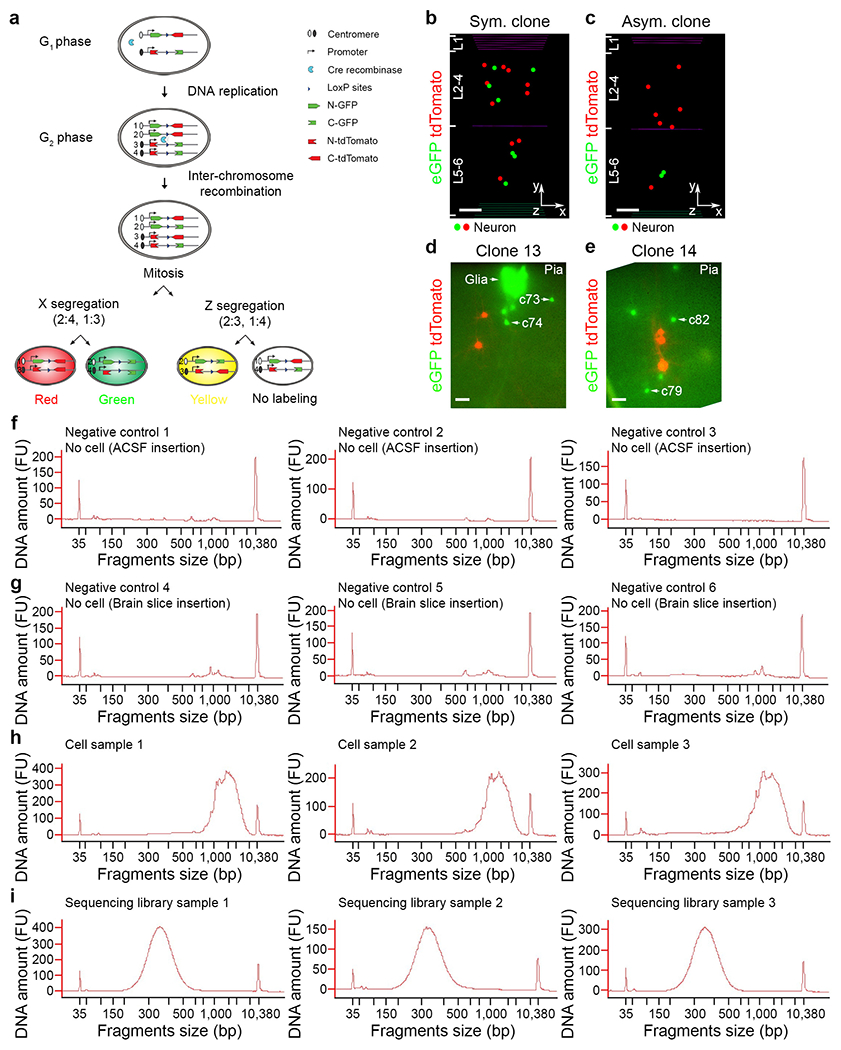
a, Schematic diagram of MADM labelling strategy. b, c, Representative 3D reconstruction images of symmetric (b) or asymmetric (c) excitatory neuron clones induced at E12 and analysed at P21. Different coloured dots represent the cell bodies of labelled neurons. The x-/y-/z-axes indicate the spatial orientation of the clone with the x-axis parallel to the brain pial surface and the y-axis perpendicular to the pial surface. Coloured lines indicate the layer boundaries. Scale bars, 100 μm. d, e, Representative fluorescence images of individual clones in live brain slices subjected to glass pipette aspiration and extraction shown in Fig. 1b and c. Scale bars, 50 μm. f-h, Quantifications of amplified cDNAs from negative controls (f, g) or individual extracted neurons (h) in the same experiment setting. i, Quantification of the cDNA library of individual extracted neurons. Data are representative of at least three independent experiments.
Extended Data Fig. 2. Quality check of the scRNA-seq analysis.
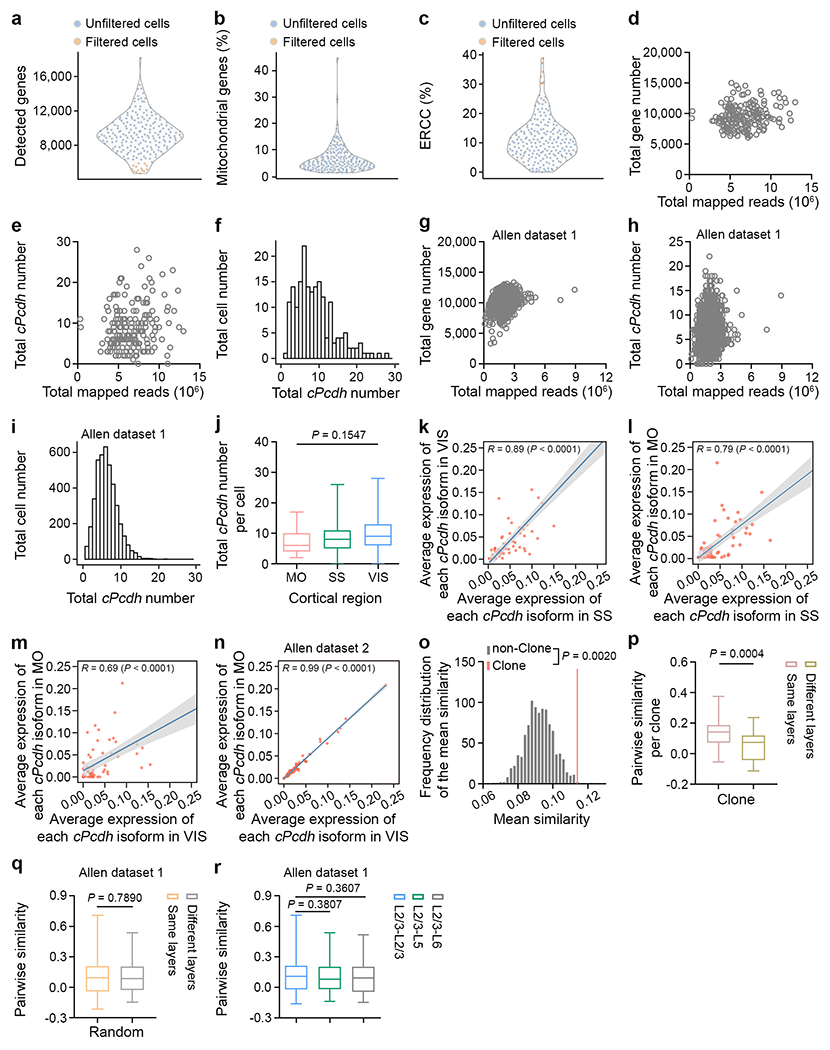
a-c, Quality control of individual extracted neurons after sequencing. Neurons with a low total detected gene number (n = 14), or a high mitochondrial gene (n = 2), or ERCC (n = 7) percentage (orange) were excluded from further analysis. Each symbol represents a neuron. d, e, Quantification of the number of the total detected genes (d) and cPcdh isoforms (e) in our clone dataset (n = 188). Each symbol represents a neuron. f, Histogram of the number of the detected cPcdh isoforms per neuron in our clone dataset (n = 188). g, h, Quantification of the number of the total detected gene (g) and cPcdh isoforms (h) in the previously published randomly collected neocortical excitatory neuron scRNA-seq dataset from the Allen Institute42 (n = 4,152). Each symbol represents a neuron. i, Histogram of the number of the detected cPcdh isoforms in the previously published randomly collected neocortical excitatory neuron scRNA-seq dataset from the Allen Institute42 (n = 4,152). j, Quantification of the number of the total detected cPcdh isoforms in clonally related excitatory neurons from different neocortical regions (motor cortex/MO, n = 32; somatosensory cortex/SS, n = 116; visual cortex/VIS, n = 40). k, Pearson correlation analysis between the average expression level of each cPcdh isoform in clonally related excitatory neurons of SS (n = 116) and VIS (n = 40). Each dot represents a cPcdh isoform. The grey bar indicates the 95% confidence interval. A similar display is used in subsequent panels (l-n). l, Pearson correlation analysis between the average expression level of each cPcdh isoform in clonally related excitatory neurons of SS (n = 116) and MO (n = 32). m, Pearson correlation analysis between the average expression level of each cPcdh isoform in clonally related excitatory neurons of MO (n = 32) and VIS (n = 40). n, Pearson correlation analysis between the average expression level of each cPcdh isoform in randomly collected excitatory neurons of MO (n = 3,893) and VIS (n = 7,347) in the previously published scRNA-seq datasets from the Allen Institute54. o, Frequency distribution of the mean similarities of cPcdh isoform expression pattern in the non-clonal dataset (n = 1,000 trails, grey bars), and the mean similarity of the clonal dataset (red line) from 32 clones. The non-clonal dataset was generated by a random permutation of the clonal dataset and statistics were performed using the permutation test (see Methods). p, Quantification of the pair-wise similarity of cPcdh isoform expression for clonally related neocortical excitatory neurons in the same or different layers per clone (same layers, n = 31; different layers, n = 20). q, Quantification of the pair-wise similarity of cPcdh isoform expression for neurons in the same or different layers of the randomly collected 150 neocortical excitatory neurons from the previously published Allen Institute dataset42 (same layers, n = 600; different layers, n = 400). r, Quantification of the pair-wise similarity of cPcdh isoform expression for randomly collected excitatory neurons across different layers from the previously published Allen Institute dataset42 (L2/3-L2/3, n = 200; L2/3-L5, n = 200; L2/3-L6, n = 200). The n numbers indicate neurons (a-n), clones (p), and neuron pairs (q, r). Data are representative of at least three independent experiments. One-way ANOVA test without adjusted P value (j); Two-tailed Pearson correlation analysis (k-n); One-tailed permutation test (o); Two-tailed unpaired Student’s t-test (p-r). Box plots as in Fig. 1.
Extended Data Fig. 3. Combinatorial expression of cPcdh isoforms in individual neocortical excitatory neurons in the clone dataset.
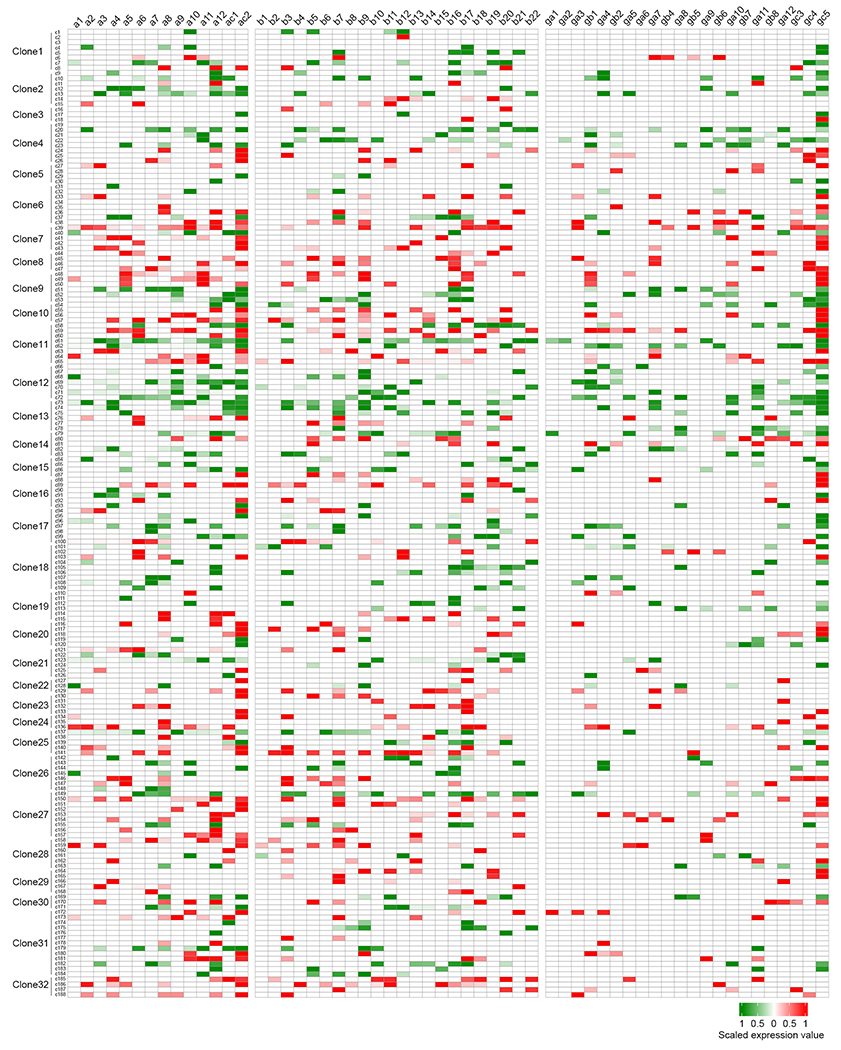
Heatmap of cPcdh transcripts in 188 individual neocortical excitatory neurons from 32 clones. The existence of individual cPcdh isoforms is indicated by the red or green coloured boxes, the colour reflects fluorescence labelling, and the expression level is indicated by the colour gradient. Note that the majority of neurons express multiple cPcdh isoforms from three Pcdh clusters (a, b, and g) and the C-type Pcdh isoforms (ac2 and gc5).
Extended Data Fig. 4. Combinatorial expression of cPcdh isoforms in individual excitatory neurons of the motor cortex in the previously published Allen Institute dataset.
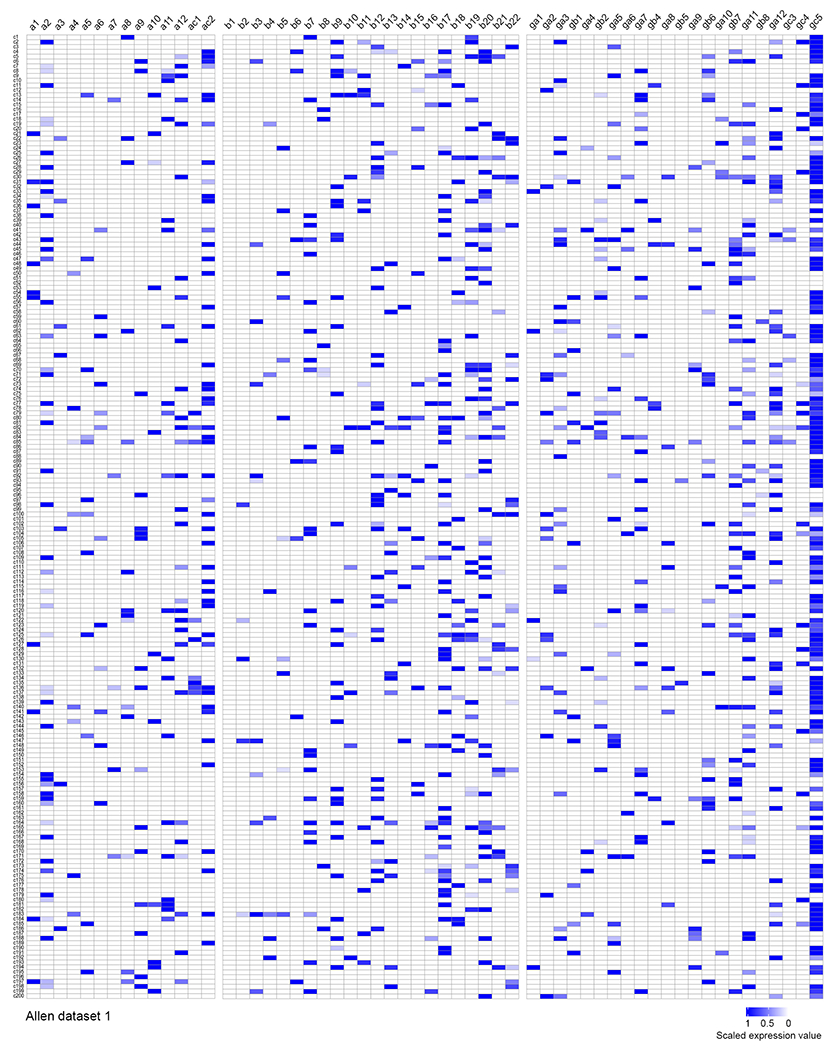
Heatmap of cPcdh transcripts in 200 individual excitatory neurons in the motor cortex randomly selected from the published Allen Institute dataset42. The existence of individual cPcdh isoforms is indicated by the blue coloured boxes and the expression level is indicated by the colour gradient. Note that the majority of neurons express multiple cPcdh isoforms from three Pcdh clusters (a, b, and g) and the C-type Pcdh isoforms (ac2 and gc5), similar to the neurons in the clone dataset.
Extended Data Fig. 5. Confirmation of layer identities for individual neocortical excitatory neurons in the clone dataset.
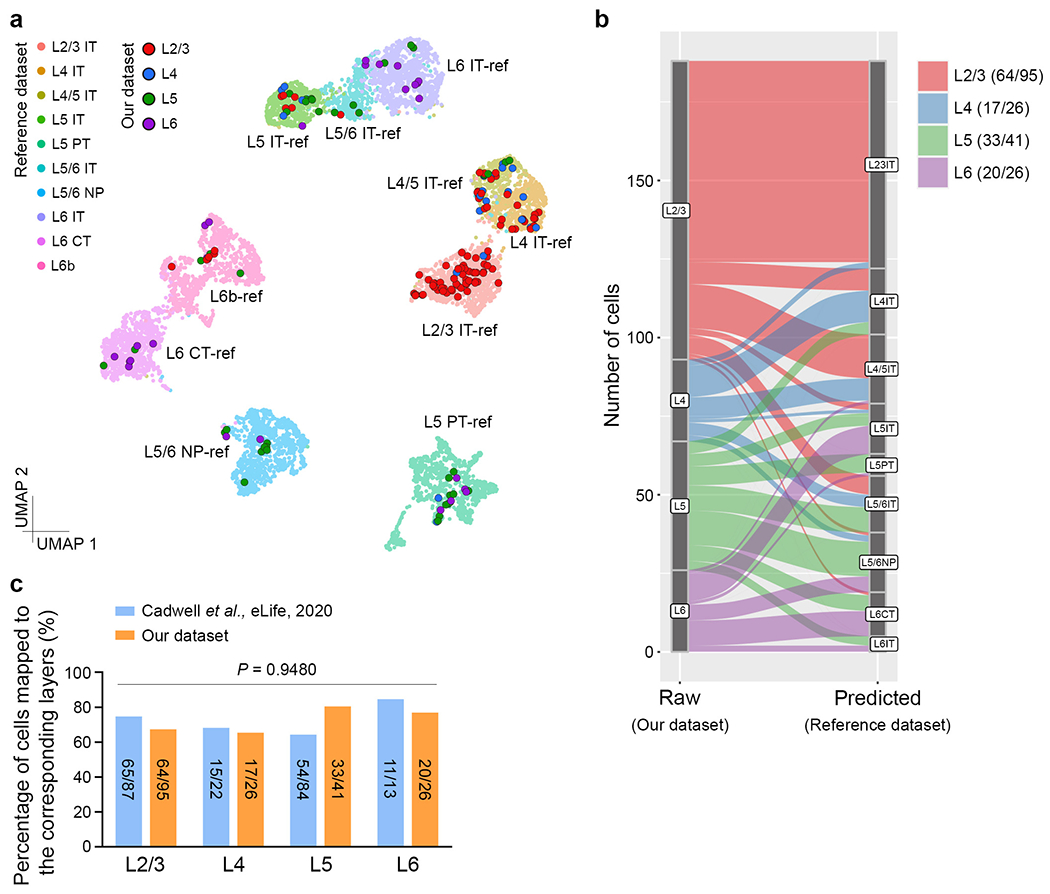
a, Uniform manifold approximation and projection (UMAP) plot for alignment of individual neurons in our clone dataset (L2/3, n = 95; L4, n = 26; L5, n = 41; L6, n = 26) to the previously published neocortical excitatory neuron scRNA-seq dataset from the Allen Institute57 (n = 9,100). Large dots with black outlines represent individual clonally related excitatory neuron in our dataset and small dots with no outline represent individual excitatory neurons in the reference Allen Institute dataset. Different colours reflect different subtypes of neocortical excitatory neurons. The n numbers indicate neurons. b, Sankey plot for the result of transferring subtype labels from the reference dataset (predicted) to our clone dataset (raw) based on scRNA-seq. Different colours reflect different subtypes of neocortical excitatory neurons. The mapped cell numbers are shown in the graph inset. c, No significant difference in the percentage of cells mapped to the corresponding reference neuron subtypes/layers between our dataset and a previously published dataset using a similar method45. The mapped cell numbers are shown in the bar graph. Two-tailed paired Student’s t-test was used for statistical analysis.
Extended Data Fig. 6. PCDHγ removal causes a lateral clustering of sister and cousin excitatory neurons in the neocortex.
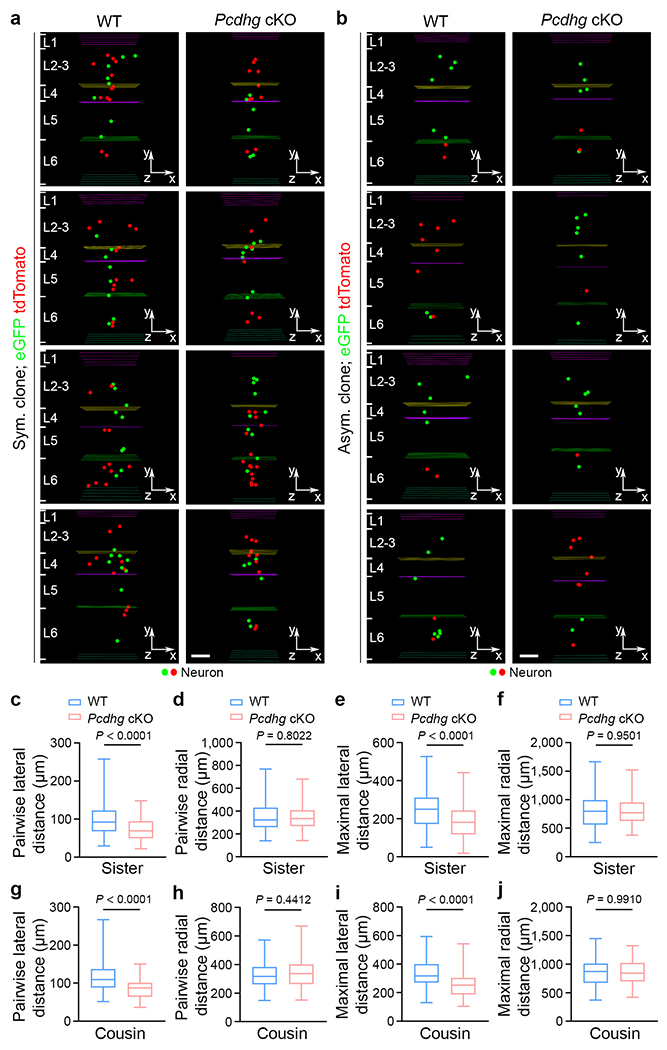
a, b, Representative 3D reconstruction images of P21 WT (left) and Pcdhg cKO (right) symmetric (a) and asymmetric (b) excitatory neuron clones labelled by MADM. Coloured lines indicate the layer boundaries and coloured dots represent the cell bodies of labelled neurons. The x-/y-/z-axes indicate the spatial orientation of the clone with the x-axis parallel to the brain pial surface and the y-axis perpendicular to the pial surface. Scale bars: 100 μm. c-f, Quantification of the pairwise (c, d) and maximal (e, f) lateral and radial distances between sister neurons in individual WT and Pcdhg cKO clones (WT, n = 90 clones; Pcdhg cKO, n = 90 clones). g-j, Quantification of the pairwise (g, h) and maximal (i, j) lateral and radial distances between cousin neurons in individual WT and Pcdhg cKO clones (WT, n = 68 clones; Pcdhg cKO, n = 74 clones). Data are representative of four independent experiments. Two-tailed unpaired Student’s t-test was used for statistical analysis. Box plots as in Fig. 1.
Extended Data Fig. 7. PCDHγ removal does not affect the overall layer formation, the excitatory neuron density, or the dendritic morphology.
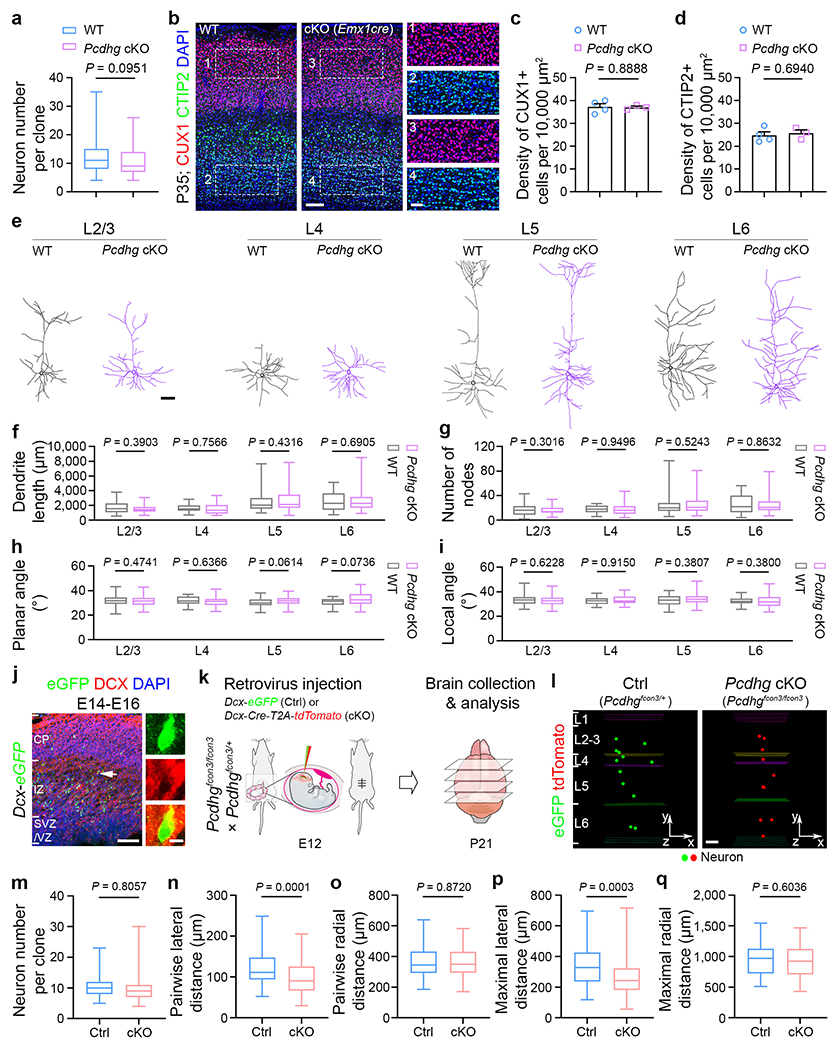
a, Quantification of the number of neurons in individual WT and Pcdhg cKO clones (WT, n = 158 clones; Pcdhg cKO, n = 164 clones). b, Representative confocal images of P35 WT (left) and Pcdhg cKO (Emx1-Cre;Pcdhgfcon3/fcon3) (right) neocortices stained for CUX1 (red), a superficial layer excitatory neuron marker, and CTIP2 (green), a deep layer excitatory neuron marker, and counter-stained with DAPI (blue). Note no change in either layer formation or neuronal density in the Pcdhg cKO neocortex compared with the WT control. Scale bars: 100 μm (left) and 20 μm (right). c, d, Quantification of the numbers of CUX1+ (c) and CTIP2+ (d) cells in the 10,000 μm2 rectangle area (WT, n = 4 brains; Pcdhg cKO, n = 3 brains). e, Representative reconstructed dendritic morphologies of WT and Pcdhg cKO excitatory neurons in different layers. Scale bar, 50 μm. f-i, Quantification of the neurite length (f), branch number (g), planar angle (h), or local angle (i) of WT and Pcdhg cKO neurons in different layers (L2/3: WT, n = 71; Pcdhg cKO, n = 55; L4: WT, n = 16; Pcdhg cKO, n = 24; L5: WT, n = 33; Pcdhg cKO, n = 46; L6: WT, n = 23; Pcdhg cKO, n = 40). The n numbers indicate neurons. j, Confocal images of representative E16 Doublecortin (Dcx) promoter driven eGFP expressing (green) cortices electroporated at E14 and stained for DCX (red) and DAPI (blue). The arrow points to the example cell. Note that eGFP-expressing cells are mostly located in the intermediate zone and positive for DCX. Scale bars: 100 μm (left) and 5 μm (right). k, Schematic diagram of in utero intraventricular injection of low-titre retroviruses containing Dcx promoter driven eGFP (green, Ctrl) and Cre/tdTomato (red, Pcdhg cKO) into the Pcdhgfcon3 mice at E12. l, Representative 3D reconstruction images of the control and Pcdhg cKO clones. Note that the Pcdhg cKO clone is more laterally clustered than the control clone. Scale bar, 100 μm. m, Quantification of the number of neurons in individual control and Pcdhg cKO clones (Ctrl, n = 67 clones from ~305 brain slices/5 brains; Pcdhg cKO, n = 78 clones from ~315 brain slices/5 brains). n-q, Quantification of the pairwise (n, o) and maximal (p, q) lateral and radial distances between neurons in individual control and Pcdhg cKO clones (Ctrl, n = 67 clones; Pcdhg cKO, n = 78 clones). Data are representative of four (a), three (b-d, j-q), or ten (e-i) independent experiments. Two-tailed unpaired Student’s t-test was used for statistical test. Data are presented as mean ± s.e.m (c, d). Box plots as in Fig. 1.
Extended Data Fig. 8. PCDHγ removal causes a lateral clustering of excitatory neuron clones during embryonic and neonatal neocortical development.
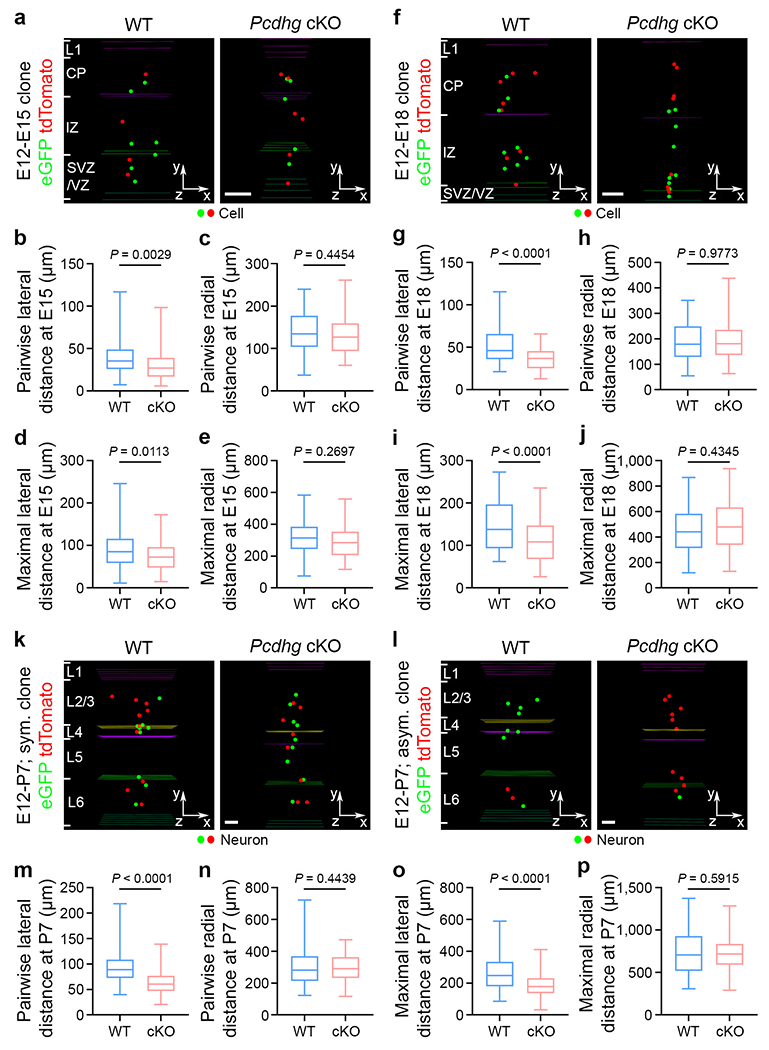
a, Representative 3D reconstruction images of E15 WT (left) and Pcdhg cKO (right) clones labelled by MADM at E12. Coloured lines indicate the layer boundaries and coloured dots represent the cell bodies of labelled cells. The x-/y-/z-axes indicate the spatial orientation of the clone with the x-axis parallel to the brain pial surface and the y-axis perpendicular to the pial surface. Similar symbols and displays are used in subsequent panels. Scale bar, 100 μm. b-e, Quantification of the pairwise (b, c) and maximal (d, e) lateral and radial distances between cells in individual E15 WT and Pcdhg cKO clones (WT, n = 54 clones from ~160 brain slices/4 brains; Pcdhg cKO, n = 62 clones from ~150 brain slices/4 brains). f, Representative 3D reconstruction images of E18 WT (left) and Pcdhg cKO (right) clones labelled by MADM at E12. Scale bar, 100 μm. g-j, Quantification of the pairwise (g, h) and maximal (i, j) lateral and radial distances between cells in individual E18 WT and Pcdhg cKO clones (WT, n = 60 clones from ~140 brain slices/4 brains; Pcdhg cKO, n = 76 clones from ~135 brain slices/4 brains). k, l, Representative 3D reconstruction images of P7 WT (left) and Pcdhg cKO (right) symmetric (k) and asymmetric (l) clones labelled by MADM at E12. Coloured lines indicate the layer boundaries and coloured dots represent the cell bodies of labelled neurons. Note that the Pcdhg cKO clones are more laterally clustered than the WT clones. Scale bars, 100 μm. m-p, Quantification of the pairwise (m, n) and maximal (o, p) lateral and radial distances between neurons in individual P7 WT and Pcdhg cKO clones (WT, n = 66 clones from ~204 brain slices/4 brains; Pcdhg cKO, n = 71 clones from ~215 brain slices/4 brains). Data are representative of three independent experiments. Two-tailed unpaired Student’s t-test was used for statistical test. Box plots as in Fig. 1.
Extended Data Fig. 9. Pcdhgc3 overexpression leads to a lateral dispersion of sister and cousin excitatory neurons.
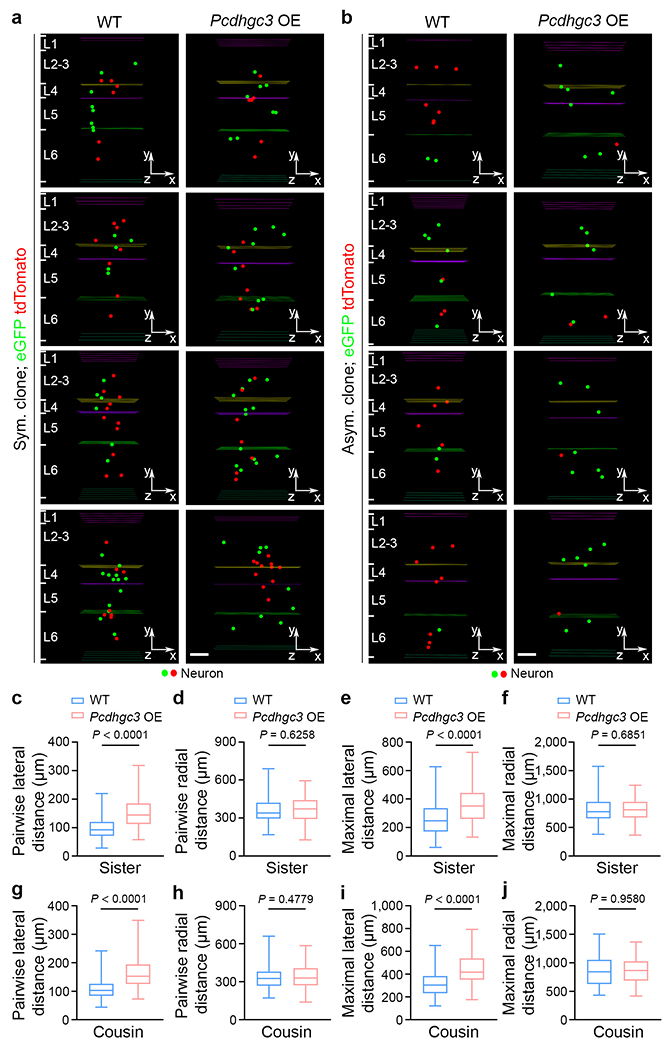
a, b, Representative 3D reconstruction images of P21 WT (left) and Pcdhgc3 OE (right) symmetric (a) and asymmetric (b) excitatory neuron clones labelled by MADM. Coloured lines indicate the layer boundaries and coloured dots represent the cell bodies of labelled neurons. The x-/y-/z-axes indicate the spatial orientation of the clone with the x-axis parallel to the brain pial surface and the y-axis perpendicular to the pial surface. Scale bars: 100 μm. c-f, Quantification of the pairwise (c, d) and maximal (e, f) lateral and radial distances between sister neurons in individual WT and Pcdhgc3 overexpressing clones (WT, n = 99 clones; Pcdhgc3 OE, n = 68 clones). g-j, Quantification of the pairwise (g, h) and maximal (i, j) lateral and radial distances between cousin neurons in individual WT and Pcdhgc3 OE clones (WT, n = 79 clones; Pcdhgc3 OE, n = 86 clones). Data are representative of four independent experiments. Two-tailed unpaired Student’s t-test was used for statistical test. Box plots as in Fig. 1.
Extended Data Fig. 10. Pcdhgc3 overexpression does not affect the number of clonally-related excitatory neurons or the dendritic morphology.
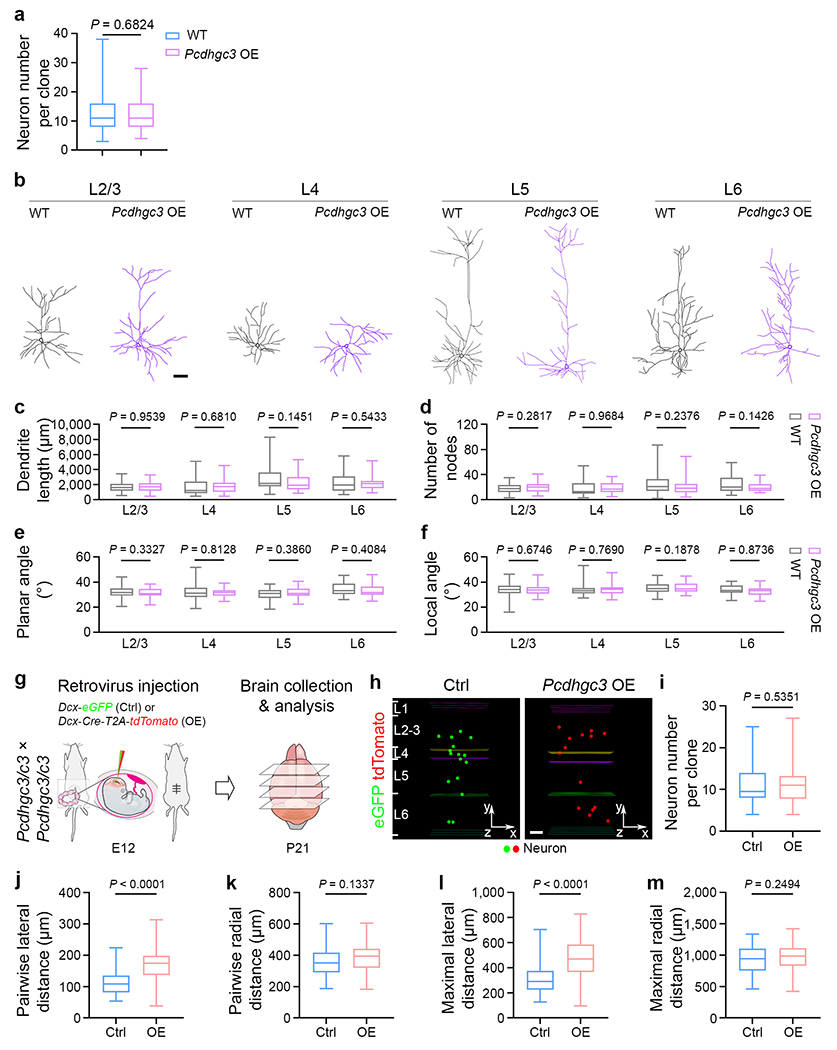
a, Quantification of the number of neurons in individual WT and Pcdhgc3 OE clones in the neocortex (WT, n = 178 clones; Pcdhgc3 OE, n = 154 clones). b, Representative reconstructed dendritic morphologies of WT and Pcdhgc3 OE excitatory neurons in different layers. Scale bar, 50 μm. c–f, Quantification of the neurite length (c), branch number (d), planar angle (e), or local angle (f) of WT and Pcdhgc3 OE neurons in different layers (L2/3: WT, n = 58; Pcdhgc3 OE, n = 55; L4: WT, n = 17; Pcdhgc3 OE, n = 29; L5: WT, n = 34; Pcdhgc3 OE, n = 30; L6: WT, n = 23; Pcdhgc3 OE, n = 31). The n numbers indicate neurons. g, Schematic diagram of in utero intraventricular injection of low-titre retroviruses with Doublecortin (Dcx) promoter driven eGFP (green, Ctrl) and Cre/tdTomato (red, Pcdhgc3 OE) into the Pcdhgc3/c3 mice at E12. h, Representative 3D reconstruction images of the control and Pcdhgc3 OE clones. Note that the Pcdhgc3 OE clones are more laterally dispersed than the control clones. Scale bar, 100 μm. i, Quantification of the number of neurons in individual control and Pcdhgc3 OE clones (Ctrl, n = 62 clones from ~255 brain slices/4 brains; Pcdhgc3 OE, n = 66 clones from ~260 brain slices/4 brains). j-m, Quantification of the pairwise (j, k) and maximal (l, m) lateral and radial distances between neurons in individual control and Pcdhgc3 OE clones (Ctrl, n = 62 clones; Pcdhgc3 OE, n = 66 clones). Data are representative of four (a), ten (b-f), or three (g-m) independent experiments. Two-tailed unpaired Student’s t-test was used for statistical test. Box plots as in Fig. 1.
Extended Data Fig. 11. Pcdhgc3 overexpression leads to a lateral dispersion during early neocortical development.
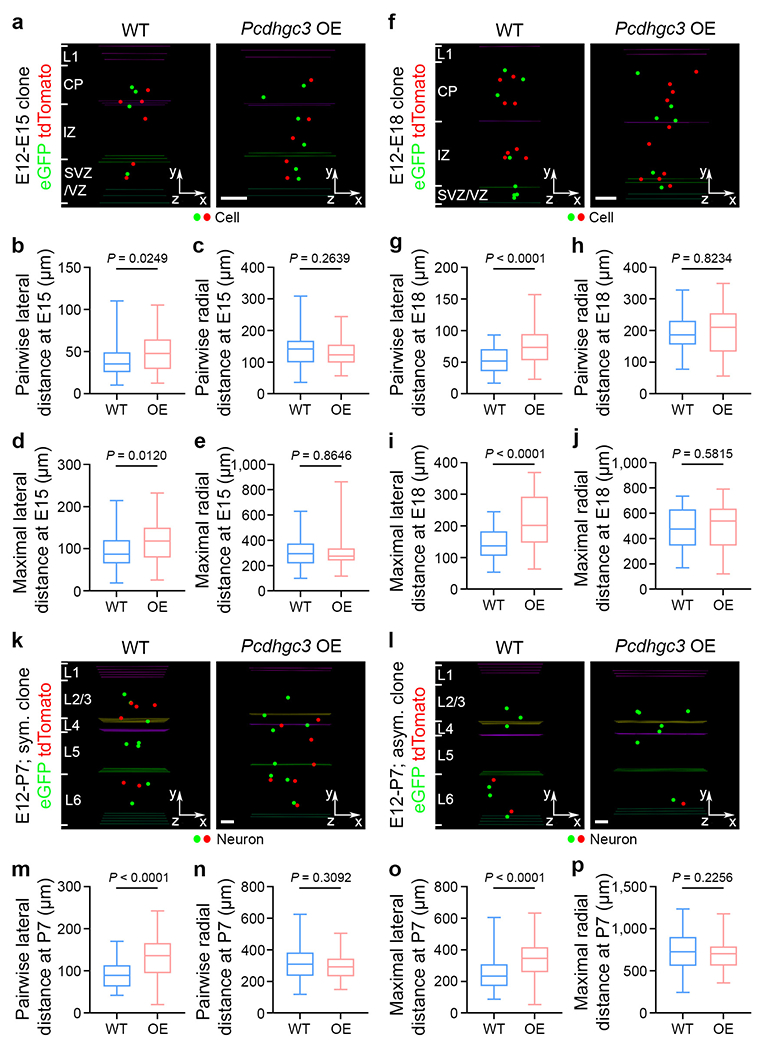
a, Representative 3D reconstruction images of E15 WT (left) and Pcdhgc3 OE (right) clones labelled by MADM at E12. Coloured lines indicate the layer boundaries and coloured dots represent the cell bodies of labelled cells. The x-/y-/z-axes indicate the spatial orientation of the clone with the x-axis parallel to the brain pial surface and the y-axis perpendicular to the pial surface. Similar symbols and displays are used in subsequent panels. Scale bar, 100 μm. b-e, Quantification of the pairwise (b, c) and maximal (d, e) lateral and radial distances between cells in individual E15 WT and Pcdhgc3 OE clones (WT, n = 60 clones from ~180 brain slices/5 brains; Pcdhgc3 OE, n = 67 clones from ~160 brain slices/4 brains). f, Representative 3D reconstruction images of E18 WT (left) and Pcdhgc3 OE (right) clones labelled by MADM at E12. Scale bar, 100 μm. g-j, Quantification of the pairwise (g, h) and maximal (i, j) lateral and radial distances between cells in individual E18 WT and Pcdhgc3 OE clones (WT, n = 53 clones from ~106 brain slices/3 brains; Pcdhgc3 OE, n = 39 clones from ~100 brain slices/3 brains). k, l, Representative 3D reconstruction images of P7 WT (left) and Pcdhgc3 OE (right) symmetric (k) and asymmetric (l) clones labelled by MADM at E12. Coloured lines indicate the layer boundaries and coloured dots represent the cell bodies of labelled neurons. Note that the Pcdhgc3 OE clones are more laterally dispersed than the WT clones. Scale bars, 100 μm. m-p, Quantification of the pairwise (m, n) and maximal (o, p) lateral and radial distances between neurons in individual P7 WT and Pcdhgc3 OE clones (WT, n = 62 clones from ~160 brain slices/3 brains; Pcdhgc3 OE, n = 61 clones from ~156 brain slices/3 brains). Data are representative of three independent experiments. Two-tailed unpaired Student’s t-test was used for statistical test. Box plots as in Fig. 1.
Extended Data Fig. 12. PCDHγ removal does not affect the basic membrane properties of neocortical excitatory neurons.
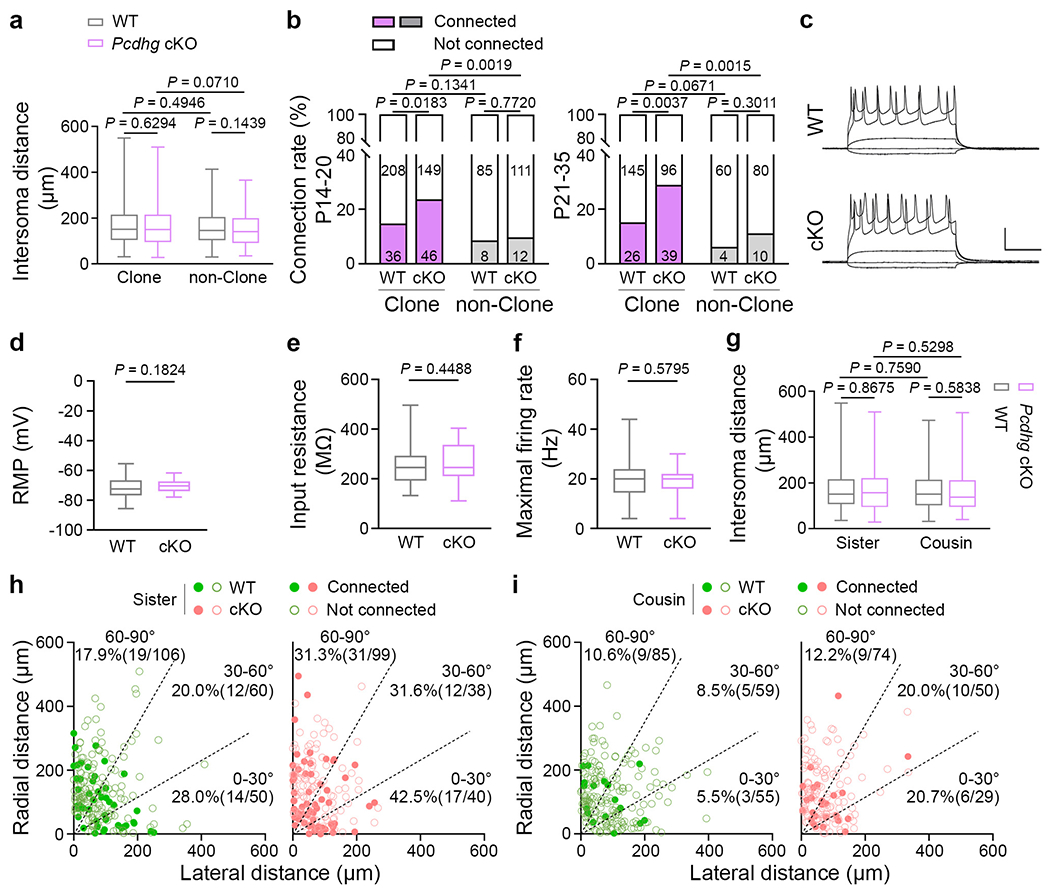
a, Quantification of the inter-soma distance between clonally related WT and Pcdhg cKO excitatory neurons and nearby non-clonally related excitatory neurons (clonally related: WT, n = 415; Pcdhg cKO, n = 330; non-clonally related: WT, n = 157; Pcdhg cKO, n = 141). b, Summary of the rate of chemical synaptic connections between the clonally related WT and Pcdhg cKO excitatory neurons and nearby non-clonally related excitatory neurons at P14-20 (WT clone & non-clone, n = 337 from ~53 brain slices/15 brains; Pcdhg cKO clone & non-clone, n = 318 from ~52 brain slices/17 brains) and P21-35 (WT clone & non-clone, n = 235 from ~46 brain slices/16 brains; Pcdhg cKO clone & non-clone, n = 225 from ~40 brain slices/12 brains). The specific numbers of recorded pairs are shown in the bar graphs. c, Representative sample traces of the responses of excitatory neurons to somatic current injections in the WT (left) and Pcdhg cKO (right) neocortices. Scale bars: 50 mV and 200 msec. d-f, Summary of the resting membrane potential (RMP) (d, WT, n = 45; Pcdhg cKO, n = 48), input resistance (e, WT, n = 44; Pcdhg cKO, n = 48), and maximal firing rate (f, WT, n = 44; Pcdhg cKO, n = 47) of WT and Pcdhg cKO excitatory neurons. g, Quantification of the inter-soma distance between WT and Pcdhg cKO sister (left) or cousin (right) excitatory neurons (sister: WT, n = 216; Pcdhg cKO, n = 177; cousin: WT, n = 199; Pcdhg cKO, n = 153). h, i, Summary of the rate of synaptic connections between WT and Pcdhg cKO sister or cousin neuronal pairs with regard to the angular orientation of their cell bodies relative to the pia. Each symbol represents a neuronal pair. The numbers of recorded pairs and the rates of synaptic connections are shown in the graphs. The n numbers indicate neuron pairs (a, b, g-i) or neurons (d-f). Data are representative of at least 20–30 independent experiments. Two-tailed unpaired Student’s t-test (a, d-g); Two-tailed χ2 test (b, h, i). Box plots as in Fig. 1.
Extended Data Fig. 13. Pcdhgc3 overexpression does not affect the basic membrane properties of neocortical excitatory neurons.
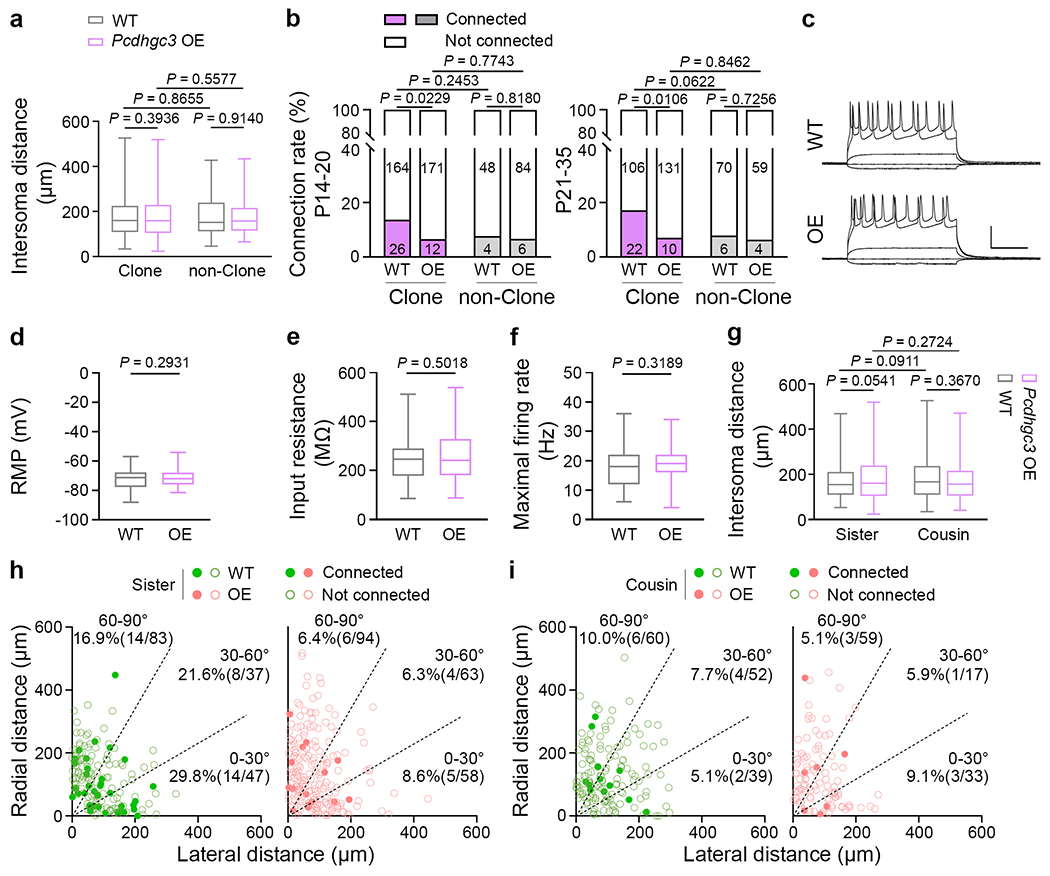
a, Quantification of the inter-soma distance between clonally related WT and Pcdhgc3 OE excitatory neurons and nearby non-clonally related excitatory neurons (clonally related: WT, n = 318; Pcdhgc3 OE, n = 324; non-clonally related: WT, n = 128; Pcdhgc3 OE, n = 123). b, Summary of the frequency of chemical synaptic connections between the clonally related WT and Pcdhgc3 OE excitatory neurons and nearby non-clonal excitatory neurons in P14-20 (WT clone & non-clone, n = 242 from ~44 brain slices/13 brains; Pcdhgc3 OE clone & non-clone, n = 273 from ~53 brain slices/18 brains) and P21–35 (WT clone & non-clone, n = 204 from ~31 brain slices/11 brains; Pcdhgc3 OE clone & non-clone, n = 204 from ~32 brain slices/11 brains). The specific numbers of recorded pairs are shown in the bar graphs. c, Representative sample traces of the responses of excitatory neurons to somatic current injections in the WT (left) and Pcdhgc3 OE (right) neocortices. Scale bars: 50 mV and 200 msec. d-f, Summary of the resting membrane potential (RMP) (d, WT, n = 45; Pcdhgc3 OE, n = 54), input resistance (e, WT, n = 44; Pcdhgc3 OE, n = 62), and maximal firing rate (f, WT, n = 42; Pcdhgc3 OE, n = 62) of WT and Pcdhgc3 OE excitatory neurons. g, Quantification of the inter-soma distance between WT and Pcdhgc3 OE sister (left) or cousin (right) excitatory neurons (sister: WT, n = 167; Pcdhgc3 OE, n = 215; cousin: WT, n = 151; Pcdhgc3 OE, n = 109). h, i, Summary of the rate of synaptic connections between WT and Pcdhgc3 OE sister or cousin neuronal pairs with regard to the angular orientation of their cell bodies relative to the pia. Each symbol represents a neuronal pair. The numbers of recorded pairs and the rates of synaptic connections are shown in the graphs. The n numbers indicate neuron pairs (a, b, g-i) or neurons (d-f). Data are representative of at least 20–30 independent experiments. Two-tailed unpaired Student’s t-test (a, d-g); Two-tailed χ2 test (b, h, i). Box plots as in Fig. 1.
Supplementary Material
Acknowledgements
We thank members of the Shi laboratory and H. Jiang for valuable discussion and input, and J.L. Lefebvre and J.A. Weiner for the Pcdhgfcon3 and Pcdhgc3 mouse lines. This work was supported by grants from the Ministry of Science and Technology of China (2021ZD0202300), the National Natural Science Foundation of China (32021002 to S.-H.S. and 31630039 to Q.W.), Beijing Outstanding Young Scientist Program (BJJWZYJH01201910003012), Beijing Municipal Science & Technology Commission (Z20111000530000 and Z211100003321001), the Chinese Institute for Brain Research (Beijing), and the Simons Foundation (SFARI GC232866) (to S.-H.S), and the Postdoctoral Program of the Tsinghua Centre for Life Sciences (to S.L.).
Footnotes
Competing interests
The authors declare no competing interests.
Code availability
No code or model was generated in this study.
Data availability
The scRNA-seq matrix of cPcdh isoform expression is provided in Supplementary Table 4.
References
- 1.Luo L Architectures of neuronal circuits. Science 373, eabg7285 (2021). [DOI] [PMC free article] [PubMed] [Google Scholar]
- 2.Sanes JR & Zipursky SL Synaptic Specificity, Recognition Molecules, and Assembly of Neural Circuits. Cell 181, 536–556 (2020). [DOI] [PubMed] [Google Scholar]
- 3.Mountoufaris G, Canzio D, Nwakeze CL, Chen WV & Maniatis T Writing, Reading, and Translating the Clustered Protocadherin Cell Surface Recognition Code for Neural Circuit Assembly. Annu Rev Cell Dev Biol 34, 471–493 (2018). [DOI] [PubMed] [Google Scholar]
- 4.Yogev S & Shen K Cellular and molecular mechanisms of synaptic specificity. Annu Rev Cell Dev Biol 30, 417–437 (2014). [DOI] [PubMed] [Google Scholar]
- 5.Sudhof TC The cell biology of synapse formation. J Cell Biol 220 (2021). [DOI] [PMC free article] [PubMed] [Google Scholar]
- 6.Yagi T Molecular codes for neuronal individuality and cell assembly in the brain. Front Mol Neurosci 5, 45 (2012). [DOI] [PMC free article] [PubMed] [Google Scholar]
- 7.Wu Q & Maniatis T A striking organization of a large family of human neural cadherin-like cell adhesion genes. Cell 97, 779–790 (1999). [DOI] [PubMed] [Google Scholar]
- 8.Kriegstein A & Alvarez-Buylla A The glial nature of embryonic and adult neural stem cells. Annu Rev Neurosci 32, 149–184 (2009). [DOI] [PMC free article] [PubMed] [Google Scholar]
- 9.Malatesta P, Hartfuss E & Gotz M Isolation of radial glial cells by fluorescent-activated cell sorting reveals a neuronal lineage. Development 127, 5253–5263 (2000). [DOI] [PubMed] [Google Scholar]
- 10.Noctor SC, Flint AC, Weissman TA, Dammerman RS & Kriegstein AR Neurons derived from radial glial cells establish radial units in neocortex. Nature 409, 714–720 (2001). [DOI] [PubMed] [Google Scholar]
- 11.Noctor SC, Martinez-Cerdeno V, Ivic L & Kriegstein AR Cortical neurons arise in symmetric and asymmetric division zones and migrate through specific phases. Nature Neuroscience 7, 136–144 (2004). [DOI] [PubMed] [Google Scholar]
- 12.Gao P et al. Deterministic Progenitor Behavior and Unitary Production of Neurons in the Neocortex. Cell 159, 775–788 (2014). [DOI] [PMC free article] [PubMed] [Google Scholar]
- 13.Luskin MB, Pearlman AL & Sanes JR Cell lineage in the cerebral cortex of the mouse studied in vivo and in vitro with a recombinant retrovirus. Neuron 1, 635–647 (1988). [DOI] [PubMed] [Google Scholar]
- 14.Rakic P Specification of cerebral cortical areas. Science 241, 170–176 (1988). [DOI] [PubMed] [Google Scholar]
- 15.Shen Z et al. Distinct progenitor behavior underlying neocortical gliogenesis related to tumorigenesis. Cell Rep 34, 108853 (2021). [DOI] [PubMed] [Google Scholar]
- 16.Walsh C & Cepko CL Clonally related cortical cells show several migration patterns. Science 241, 1342–1345 (1988). [DOI] [PubMed] [Google Scholar]
- 17.Yu YC, Bultje RS, Wang XQ & Shi SH Specific synapses develop preferentially among sister excitatory neurons in the neocortex. Nature 458, 501–U503 (2009). [DOI] [PMC free article] [PubMed] [Google Scholar]
- 18.Yu YC et al. Preferential electrical coupling regulates neocortical lineage-dependent microcircuit assembly. Nature 486, 113–U139 (2012). [DOI] [PMC free article] [PubMed] [Google Scholar]
- 19.Li Y et al. Clonally related visual cortical neurons show similar stimulus feature selectivity. Nature 486, 118–121 (2012). [DOI] [PMC free article] [PubMed] [Google Scholar]
- 20.Ohtsuki G et al. Similarity of visual selectivity among clonally related neurons in visual cortex. Neuron 75, 65–72 (2012). [DOI] [PubMed] [Google Scholar]
- 21.He SJ, Li ZZ, Ge SY, Yu YC & Shi SH Inside-Out Radial Migration Facilitates Lineage-Dependent Neocortical Microcircuit Assembly. Neuron 86, 1159–1166 (2015). [DOI] [PMC free article] [PubMed] [Google Scholar]
- 22.Wu Q et al. Comparative DNA sequence analysis of mouse and human protocadherin gene clusters. Genome Res 11, 389–404 (2001). [DOI] [PMC free article] [PubMed] [Google Scholar]
- 23.Canzio D et al. Antisense lncRNA Transcription Mediates DNA Demethylation to Drive Stochastic Protocadherin alpha Promoter Choice. Cell 177, 639-+ (2019). [DOI] [PMC free article] [PubMed] [Google Scholar]
- 24.Tasic B et al. Promoter choice determines splice site selection in protocadherin alpha and gamma pre-mRNA splicing. Mol Cell 10, 21–33 (2002). [DOI] [PubMed] [Google Scholar]
- 25.Jia Z et al. Tandem CTCF sites function as insulators to balance spatial chromatin contacts and topological enhancer-promoter selection. Genome Biol 21, 75 (2020). [DOI] [PMC free article] [PubMed] [Google Scholar]
- 26.Esumi S et al. Monoallelic yet combinatorial expression of variable exons of the protocadherin-alpha gene cluster in single neurons. Nat Genet 37, 171–176 (2005). [DOI] [PubMed] [Google Scholar]
- 27.Mountoufaris G et al. Multicluster Pcdh diversity is required for mouse olfactory neural circuit assembly. Science 356, 411–413 (2017). [DOI] [PMC free article] [PubMed] [Google Scholar]
- 28.Toyoda S et al. Developmental Epigenetic Modification Regulates Stochastic Expression of Clustered Protocadherin Genes, Generating Single Neuron Diversity. Neuron 82, 94–108 (2014). [DOI] [PubMed] [Google Scholar]
- 29.Thu CA et al. Single-Cell Identity Generated by Combinatorial Homophilic Interactions between alpha, beta, and gamma Protocadherins. Cell 158, 1045–1059 (2014). [DOI] [PMC free article] [PubMed] [Google Scholar]
- 30.Rubinstein R et al. Molecular Logic of Neuronal Self-Recognition through Protocadherin Domain Interactions. Cell 163, 629–642 (2015). [DOI] [PMC free article] [PubMed] [Google Scholar]
- 31.Brasch J et al. Visualization of clustered protocadherin neuronal self-recognition complexes. Nature 569, 280–283 (2019). [DOI] [PMC free article] [PubMed] [Google Scholar]
- 32.Schreiner D & Weiner JA Combinatorial homophilic interaction between gamma-protocadherin multimers greatly expands the molecular diversity of cell adhesion. P Natl Acad Sci USA 107, 14893–14898 (2010). [DOI] [PMC free article] [PubMed] [Google Scholar]
- 33.Kostadinov D & Sanes JR Protocadherin-dependent dendritic self-avoidance regulates neural connectivity and circuit function. Elife 4 (2015). [DOI] [PMC free article] [PubMed] [Google Scholar]
- 34.Lefebvre JL, Kostadinov D, Chen WSV, Maniatis T & Sanes JR Protocadherins mediate dendritic self-avoidance in the mammalian nervous system. Nature 488, 517-+ (2012). [DOI] [PMC free article] [PubMed] [Google Scholar]
- 35.Ing-Esteves S et al. Combinatorial Effects of Alpha- and Gamma-Protocadherins on Neuronal Survival and Dendritic Self-Avoidance. J Neurosci 38, 2713–2729 (2018). [DOI] [PMC free article] [PubMed] [Google Scholar]
- 36.Chen WSV et al. Pcdh alpha c2 is required for axonal tiling and assembly of serotonergic circuitries in mice. Science 356, 406–410 (2017). [DOI] [PMC free article] [PubMed] [Google Scholar]
- 37.Zong H, Espinosa S, Su HH, Muzumdar MD & Luo LQ Mosaic analysis with double markers in mice. Cell 121, 479–492 (2005). [DOI] [PubMed] [Google Scholar]
- 38.Bonaguidi MA et al. In Vivo Clonal Analysis Reveals Self-Renewing and Multipotent Adult Neural Stem Cell Characteristics. Cell 145, 1142–1155 (2011). [DOI] [PMC free article] [PubMed] [Google Scholar]
- 39.Lv X et al. TBR2 coordinates neurogenesis expansion and precise microcircuit organization via Protocadherin 19 in the mammalian cortex. Nat Commun 10, 3946 (2019). [DOI] [PMC free article] [PubMed] [Google Scholar]
- 40.Kessaris N et al. Competing waves of oligodendrocytes in the forebrain and postnatal elimination of an embryonic lineage. Nat Neurosci 9, 173–179 (2006). [DOI] [PMC free article] [PubMed] [Google Scholar]
- 41.Kaneko R et al. Allelic gene regulation of Pcdh-alpha and Pcdh-gamma clusters involving both monoallelic and biallelic expression in single Purkinje cells. J Biol Chem 281, 30551–30560 (2006). [DOI] [PubMed] [Google Scholar]
- 42.Yao ZZ et al. A transcriptomic and epigenomic cell atlas of the mouse primary motor cortex. Nature 598, 103-+ (2021). [DOI] [PMC free article] [PubMed] [Google Scholar]
- 43.Prasad T, Wang XZ, Gray PA & Weiner JA A differential developmental pattern of spinal interneuron apoptosis during synaptogenesis: insights from genetic analyses of the protocadherin-gamma gene cluster. Development 135, 4153–4164 (2008). [DOI] [PMC free article] [PubMed] [Google Scholar]
- 44.Lefebvre JL, Zhang YF, Meister M, Wang XZ & Sanes JR gamma-Protocadherins regulate neuronal survival but are dispensable for circuit formation in retina. Development 135, 4141–4151 (2008). [DOI] [PMC free article] [PubMed] [Google Scholar]
- 45.Cadwell CR et al. Cell type composition and circuit organization of clonally related excitatory neurons in the juvenile mouse neocortex. Elife 9 (2020). [DOI] [PMC free article] [PubMed] [Google Scholar]
- 46.Schmucker D et al. Drosophila Dscam is an axon guidance receptor exhibiting extraordinary molecular diversity. Cell 101, 671–684 (2000). [DOI] [PubMed] [Google Scholar]
- 47.Hattori D et al. Dscam diversity is essential for neuronal wiring and self-recognition. Nature 449, 223–227 (2007). [DOI] [PMC free article] [PubMed] [Google Scholar]
- 48.Hattori D, Millard SS, Wojtowicz WM & Zipursky SL Dscam-mediated cell recognition regulates neural circuit formation. Annu Rev Cell Dev Biol 24, 597–620 (2008). [DOI] [PMC free article] [PubMed] [Google Scholar]
- 49.Liu C et al. Dscam1 establishes the columnar units through lineage-dependent repulsion between sister neurons in the fly brain. Nat Commun 11, 4067 (2020). [DOI] [PMC free article] [PubMed] [Google Scholar]
- 50.Garrett AM, Schreiner D, Lobas MA & Weiner JA gamma-Protocadherins Control Cortical Dendrite Arborization by Regulating the Activity of a FAK/PKC/MARCKS Signaling Pathway. Neuron 74, 269–276 (2012). [DOI] [PMC free article] [PubMed] [Google Scholar]
Additional references cited in the Methods section
- 51.Hippenmeyer S et al. Genetic mosaic dissection of Lis1 and Ndel1 in neuronal migration. Neuron 68, 695–709 (2010). [DOI] [PMC free article] [PubMed] [Google Scholar]
- 52.Wang X, Qiu R, Tsark W & Lu Q Rapid promoter analysis in developing mouse brain and genetic labeling of young neurons by doublecortin-DsRed-express. J Neurosci Res 85, 3567–3573 (2007). [DOI] [PubMed] [Google Scholar]
- 53.Dursun I et al. Effects of Early Postnatal Exposure to Ethanol on Retinal Ganglion Cell Morphology and Numbers of Neurons in the Dorsolateral Geniculate in Mice. Alcohol Clin Exp Res 35, 2063–2074 (2011). [DOI] [PMC free article] [PubMed] [Google Scholar]
- 54.Tasic B et al. Shared and distinct transcriptomic cell types across neocortical areas. Nature 563, 72-+ (2018). [DOI] [PMC free article] [PubMed] [Google Scholar]
- 55.Cadwell CR et al. Multimodal profiling of single-cell morphology, electrophysiology, and gene expression using Patch-seq. Nat Protoc 12, 2531–2553 (2017). [DOI] [PMC free article] [PubMed] [Google Scholar]
- 56.Gu ZG, Eils R & Schlesner M Complex heatmaps reveal patterns and correlations in multidimensional genomic data. Bioinformatics 32, 2847–2849 (2016). [DOI] [PubMed] [Google Scholar]
- 57.Yao ZZ et al. A taxonomy of transcriptomic cell types across the isocortex and hippocampal formation. Cell 184, 3222-+ (2021). [DOI] [PMC free article] [PubMed] [Google Scholar]
- 58.Stuart T et al. Comprehensive Integration of Single-Cell Data. Cell 177, 1888-+ (2019). [DOI] [PMC free article] [PubMed] [Google Scholar]
Associated Data
This section collects any data citations, data availability statements, or supplementary materials included in this article.
Supplementary Materials
Data Availability Statement
The scRNA-seq matrix of cPcdh isoform expression is provided in Supplementary Table 4.


