

Abstract
Despite its fundamental importance in genome analysis, it is only recently that systematic approaches have been developed to assess copy number at specific genetic loci, or to examine genomic DNA for submicroscopic deletions of unknown location. In this report we show that short probes can be recovered and amplified quantitatively following hybridisation to genomic DNA. This simple observation forms the basis of a new approach to determining locus copy number in complex genomes. The power and specificity of multiplex amplifiable probe hybridisation is demonstrated by the simultaneous assessment of copy number at a set of 40 human loci, including detection of deletions causing Duchenne muscular dystrophy and Prader–Willi/Angelman syndromes. Assembly of other probe sets will allow novel, technically simple approaches to a wide variety of genetic analyses, including the potential for extension to high resolution genome-wide screens for deletions and amplifications.
INTRODUCTION
Abnormalities of locus copy number in genomic DNA can underlie a wide range of phenotypes, including many human genetic disorders. The largest of these changes can be detected cytogenetically, for example in monosomies and trisomies involving entire chromosomes, and segmental abnormalities such as 5p deletion in cri-du-chat syndrome. Deletions or duplications of genomic DNA too small to be detected by conventional cytogenetics (‘submicroscopic’ rearrangements) may be involved in the pathogenesis of cancer (1–4) and mental retardation (5,6). At the level of individual genes, specific inherited diseases can result from deletions or duplications involving entire genes or individual exons (7–10).
The detection of changes in copy number in a complex genome is, however, not straightforward (11). In principle, quantitative adaptations of PCR can be used to determine copy number (12,13), but suffer from the general disadvantage that analysing numerous loci simultaneously poses a formidable technical challenge. Cytogenetic methods, and in particular comparative genomic hybridisation (14,15), have the advantage that the whole genome is analysed in a single test, but in its technically simplest form it has relatively low resolution.
In this report we show that short amplifiable probes can be recovered quantitatively after hybridisation to genomic DNA. This observation forms the basis for a highly parallel assay for locus copy number in human DNA, and we illustrate its power and specificity in the detection of specific deletions in clinical DNA samples.
MATERIALS AND METHODS
Probe preparation
Probes were prepared by cloning PCR products or blunt-ended restriction fragments from genomic clones (16–20) into the EcoRV site of pZero2 (Invitrogen), and probe DNA amplified directly from bacterial cells (21) using flanking vector primers PZA (AGTAACGGCCGCCAGTGTGCTG) and PZB (CGAGCGGC-CGCCAGTGTGATG). Products amplified using 33P-end-labelled PZA were separated on denaturing 6% polyacrylamide/50% urea gels and probe mixes assembled such that the mobilities of all constituent probes were distinct.
Filter preparation and hybridisation conditions
Genomic DNA for immobilisation (0.5–1 µg) was prepared in an initial volume of <5 µl, denatured by addition of 1 µl 1 M NaOH, spotted onto an individual nylon filter (MSI MAGNA, dimensions ~2 × 4 mm), and irreversibly bound to the filter by UV irradiation. Filters were prehybridised together in 1 ml of prehybridisation solution (0.5 M sodium phosphate pH 7.2, 7% SDS, 0.1 mg/ml alkali-denatured herring sperm DNA) at 65°C, and before hybridisation this was exchanged for 200 µl of prehybridisation solution with the addition of denatured human Cot-1 DNA (Gibco BRL) to a final concentration of 10 µg/ml. Probe mixtures containing ~100 pg of each sequence in 1 µl were mixed with 7 µg Escherichia coli DNA (DH5α DNA, digested with HaeIII), 0.5 µg ΦX174/HaeIII DNA, 20 pmol ‘end-blocking’ primers PZAX (AGTAACGGCCG-CCAGTGTGCTGGAATTCTGCAGAT) and PZBX (CGAG-CGGCCGCCAGTGTGATGGAT), and 1 µg human Cot-1 DNA (Gibco BRL), and denatured by adding 2 µl 1 M NaOH. ‘End-blocking’ primers are added to prevent cross-hybridisation between different probes used in the same mixture. After 1 min at 37°C, the probe mixture was placed on ice, neutralised by adding 3 µl 1 M NaH2PO4, and added to the hybridisation solution.
Hybridisation was left to proceed at 65°C overnight, and the filters were washed at 65°C sequentially in (i) two 1 ml changes of prehybridisation solution, (ii) 500 ml 1× SSC/1% SDS and (iii) 500 ml 0.1× SSC/0.1% SDS. Washed filters were then transferred to individual 50 µl amplification reactions (constituents as for probe amplification), and bound DNA amplified for five cycles of 95°C for 1 min and 70°C for 1 min. This low level preamplified solution was then used to seed further 10 µl amplifications using 33P-5′-end-labelled primer PZA. Products were separated by denaturing PAGE (22), and radioactivity detected either by standard autoradiography or (for quantitative analysis) using ImageQuant software analysis on data captured by a storage phosphorimager screen (Molecular Dynamics).
Quantitative and statistical analysis
To produce normalised ratios, each measured band intensity was first divided by the sum of the two nearest autosomal band intensities (but excluding SNRPN) from the same sample. This provides a ratio which reflects the band intensity relative to its neighbours, and should be approximately constant for that probe (given constant dosage) across all the samples. The mean value of this ratio across all samples was then calculated, weighting males at 50% for X-linked loci and excluding females for Y-linked loci. The ratio of each individual band was then normalised to that mean value, to give the normalised ratios shown in Figure 3.
Figure 3.

Quantitative analysis of signal intensity from two separate experiments each examining 12 DNA samples (the 10 individuals shown in Fig. 2 plus two further control samples) with a total of 40 probes. Phosphorimager data were used to produce estimates of relative intensity for each band, with the mean for each probe standardised to 1.0 (see Materials and Methods). Among control samples, ratios centre on 1.0 for autosomal probes and X-linked probes in females, and are clustered around 0.5 for X-linked probes in males.
RESULTS
Specific DNA or RNA sequences can be detected in complex genomes by hybridisation using a specific probe, for example in Southern blot hybridisation and fluorescent in situ hybridisation (FISH); such methods have generally involved labelling the probe, followed by detection of the label (23–26). In multiplex amplifiable probe hybridisation (MAPH), specific hybridisation to a test sample is detected by recovery and amplification of the probe itself (Fig. 1). Multiple loci can be detected simultaneously by preparing sets of different probes flanked by the same primer binding sites. Such sets are used in hybridisations with target nucleic acid, and all probes remaining bound after stringent washing can be amplified together with the same primer pair. A set can be assembled such that each contributing probe is distinguishable, for example by virtue of its gel mobility. Although different probes may be amplified with slightly different efficiencies, the proportional contribution from each locus will reflect its copy number in the sample. As it is the retained probe that is amplified, not the DNA in the sample, the gel mobility of the product is independent of (for example) substitutional polymorphism at that locus.
Figure 1.
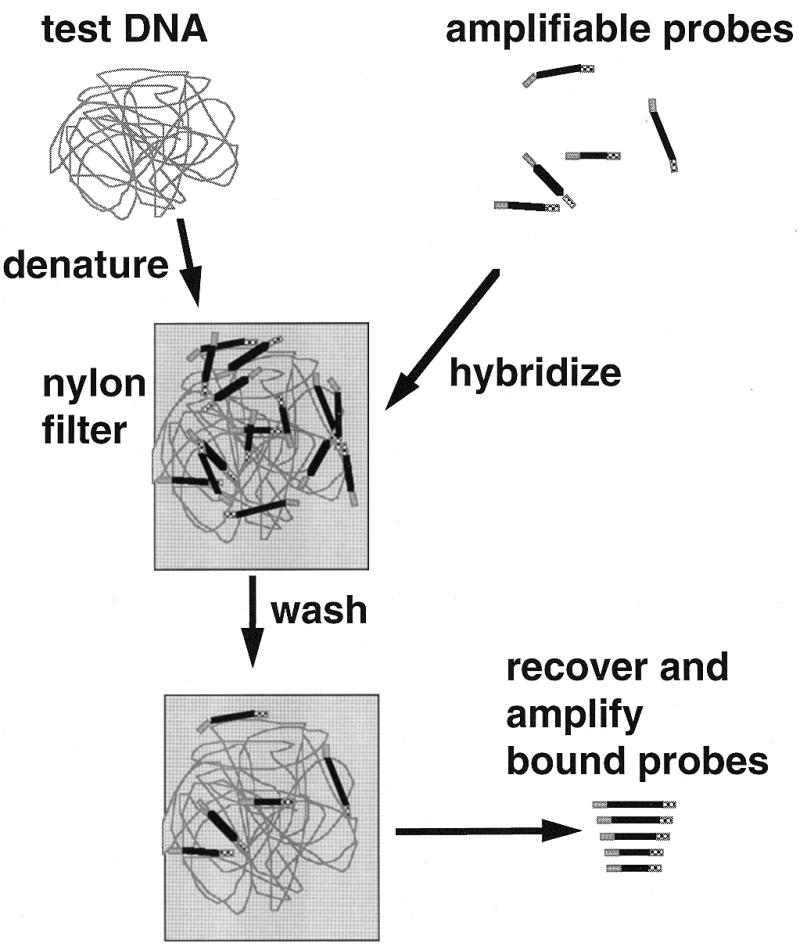
General principle of MAPH. Test DNA is denatured and hybridised with a set of amplifiable probes, each recognising a unique region in the genome. After stringent washing to allow retention only of specifically bound probes, the bound probe fragments are amplified using a common primer pair and quantified, for example after polyacrylamide gel electrophoresis. Since an excess of probe is used, the amount of each probe recovered will be proportional to the copy number of the corresponding sequence in the test DNA.
Figure 2 illustrates the appearance of copy number determination in 10 human DNA samples using MAPH at 40 loci, including some (DMD and SNRPN) involved in pathological deletions (causing Duchenne muscular dystrophy and Prader–Willi/Angelman syndromes, respectively). After hybridisation to the immobilised genomic DNA samples and high stringency washing, specifically retained probes were amplified using the flanking primers. The Y-linked probes (SRY) are only detectable in tests using DNA from males, who also yield reduced signal from X-linked loci. After quantitative analysis (see below and Fig. 3), deletions of DMD (X-linked) or SNRPN (autosomal) previously characterised by standard analyses were correctly identified among these samples in a ‘blind’ test: individual 9 (male) has a complete deletion of exon 53 of the DMD gene (probe DMD in Fig. 2); individuals 2 and 7 are female carriers of a deletion of this exon, resulting in a reduction in the relative intensity of this band. Individuals 1 and 6 have heterozygous deletions of SNRPN, demonstrated by three different probes from this gene, two of which are in the enlarged part of Figure 2.
Figure 2.
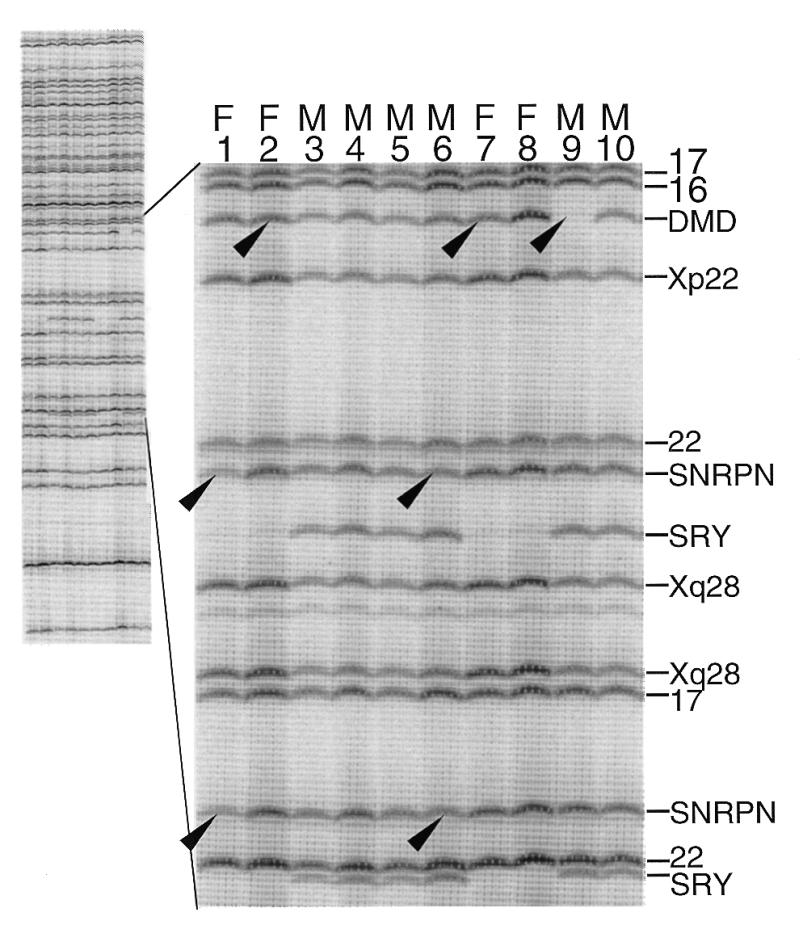
Gel analysis of recovered probes from analysis of DNA from 10 individuals examined using a mix of 40 probes from human loci, of which 13 are shown in the enlarged region. The chromosome or locus of origin for each probe is shown on the right. Arrows mark deleted bands (see also Fig. 3): individual 9 is a male with a complete deletion of exon 53 of DMD, and heterozygous deletions of this region of DMD can be seen in females 2 and 7 as reductions in the intensity relative to the adjacent Xp22 probe. Individuals 1 and 6 have heterozygous deletions of SNRPN.
Quantitative analysis of these data was performed by combining the results from these 10 samples with results from two further control samples, as well as results for these same 12 samples from a second experiment. Different probes give different signal intensities, and different samples yield different total signals. The intensity of each band was therefore compared with the nearest two autosomal bands, and the mean value of this ratio for any one probe across all samples was set to a value of 1.0 (with appropriate weighting for sex-linked bands; see also Materials and Methods). This procedure gives a ‘normalised ratio’ which can be used as an index of the relative intensity of a given band in a given sample. The distributions of these normalised ratios are shown in Figure 3, and the summary statistics given in Table 1.
Table 1. Summary statistics from two experiments (A and B), each of which examined copy number in the same 12 DNA samples using 40 probes.
| Probe type | Sample | Experiment | Mean ± SD | No. of bands scored |
|---|---|---|---|---|
| Autosomal | Control | A | 1 ± 0.10 | 330 |
| B | 1 ± 0.13 | 342 | ||
| X-linked (female) | Control | A | 1.00 ± 0.10 | 48 |
| B | 1.01 ± 0.11 | 43 | ||
| X-linked (male) | Control | A | 0.499 ± 0.045 | 69 |
| B | 0.496 ± 0.072 | 62 | ||
| Combined data | ||||
| All ‘diploid’ (autosomal + X-linked female) | (A+B) | 1 ± 0.114 | 763 | |
| All ‘haploid’ (X-linked male + deletions) | (A+B) | 0.497 ± 0.062 | 147 | |
| Inter-assay variation | A versus B | 0.060 (pairwise SD) | (468) |
| Incorrect calls (using a threshold ratio of 0.75) | Predicted | Observed | ||
|---|---|---|---|---|
| False positive | 1.4% | 0.9% (7/763) | ||
| False negative | 0.03% | 0% (0/147) |
The combined data pooled from both experiments is used to derive normal distributions for copy numbers of 2 (‘diploid’) and 1 (‘haploid’), and hence to predict the frequencies of incorrect calls. The inter-assay variation shows the mean pairwise standard deviation from 468 pairwise comparisons of corresponding results from the two experiments.
Relatively few pathological changes are detected in this study, but the larger scale detection of heterozygous deletions can be modelled by comparing the distribution of values from loci present at two copies (‘diploid’ in Table 1) with values from loci present at one copy (‘haploid’). The combined data sets each approximate well to a normal distribution, and if a threshold ratio of 0.75 is used, the probability that a false positive call will be made (i.e. that an undeleted locus will yield a ratio <0.75) is about 0.014, and that a false negative call will be made (i.e. that a deleted locus will give a value >0.75) is about 0.0003. These predicted frequencies are consistent with the observed frequencies (Table 1).
The availability of data from two experiments using the same samples and the same probes allowed assessment of inter-assay variation by pairwise comparison of the corresponding data points. While the intra-assay comparisons generally produced standard deviations of ~10% of the means, the overall standard deviation from 468 pairwise comparisons was about 0.06 (Table 1).
DISCUSSION
We have used the observation that amplifiable probes can be recovered quantitatively after hybridisation to develop a format in which copy number was assessed at 40 loci in a single experiment. With the ultimate aim of a genome-wide survey of copy number, how might this approach be extended?
Probes in the size range 140–600 bp have been used in these gel-based experiments, and careful size selection could lead to mixes containing more than 100 probes in this range, to be used (for example) as chromosome-specific subsets to analyse copy number at megabase resolution. Greater gel resolution, and therefore the potential to use more probes per test, may be possible using fluorescently labelled primers and apparatus and software designed for automated sequence analysis (27), and could in principle use multiple fluorophores in a single track. Our recent experience confirms that fluorescence detection may well improve the discrimination of the assay, but its generally lower dynamic range may limit its usefulness. It may be possible to overcome the limitations imposed by gel resolution, and thus to distinguish and quantify even larger numbers of different amplified probes, by using them to hybridise back to a reference grid of DNA from the probe set. This would be analogous to array-CGH (15) but without the need for fluorescence microscopy, and using preselected small probes capable of defining structural changes at higher resolution. Nevertheless, although the gel format may limit the number of probes used, it has the advantage of sample throughput: dozens of samples can be analysed on the same gel.
Because the loci analysed depend only on the probes chosen, by assembling different sets of probes, groups of loci appropriate to different biological questions can be examined. Work is in progress to assemble: (i) probes from the exons of genes subject to internal deletions, such as BRCA1 (9) and NF2 (10), at which mutation screening by exon amplification and sequence analysis can fail to reveal whole exon deletions; (ii) probes from sub-telomeric sequences, frequently involved in chromosomal rearrangements causing mental retardation (5,6); (iii) a set of 3000 single copy probes for whole genome scanning at megabase resolution; (iv) chromosome-specific subsets for higher resolution scanning. The work shown here uses genomic DNA as the target nucleic acid, but an obvious extension of this technology would be to use probes from known genes to analyse RNA (or cDNA) for highly parallel analysis of gene expression. Initial work (J.A.L.Armour and M.G.Hamshere, unpublished results) suggests that differential gene expression can indeed be examined using amplifiable probes.
The observed distributions of normalised signals from diploid (autosomal/X-linked in females) and haploid loci (X-linked loci in males and heterozygous deletions of SNRPN and DMD) allow predictions of the rate of false positive and false negative calls, which are consistent with the observed rates, and which may be partially reduced by further technical refinements. Using this assay to detect deletions and amplifications in (for example) mental retardation assumes that variation in the copy number of a locus is abnormal, rather than resulting from a polymorphism; wider application of this technique in unaffected controls has the potential to identify loci at which there are copy number polymorphisms. In principle, this technology can also be applied as a systematic screen for presence/absence differences between the genomes of closely related species, such as between humans and other primates.
Acknowledgments
ACKNOWLEDGEMENTS
We thank M. G. Hamshere, I. Young, J. D. Brook, R. G. Lloyd, A. Sharif, K. Carpenter and other colleagues for their help with this work. This work was made possible by funding from the University of Nottingham, and is the subject of a patent application. Requests for probes should be addressed to john.armour@ nott.ac.uk ; further updated details on methods and probes are available at http://www.nott.ac.uk/~pdzjala/maph/maph.html
REFERENCES
- 1.Baker S.J., Fearon,E.R., Nigro,J.M., Hamilton,S.R., Preisinger,A.C., Jessup,J.M., van Tuinen,P., Ledbetter,D.H., Barker,D.F., Nakamura,Y., White,R. and Vogelstein,B. (1989) Science, 244, 217–222. [DOI] [PubMed] [Google Scholar]
- 2.Fearon E., Cho,K.R., Nigro,J.M., Kern,S.E., Simons,J.W., Ruppert,J.M., Hamilton,S.R., Preisinger,A.C., Thomas,G., Kinzler,K.W. and Vogelstein,B. (1990) Science, 247, 49–56. [DOI] [PubMed] [Google Scholar]
- 3.Vogelstein B., Fearon,E.R., Kern,S.E., Hamilton,S.R., Preisinger,A.C., Nakamura,Y. and White,R. (1989) Science, 244, 207–211. [DOI] [PubMed] [Google Scholar]
- 4.Solomon E., Borrow,J. and Goddard,A.D. (1991) Science, 254, 1153–1160. [DOI] [PubMed] [Google Scholar]
- 5.Flint J., Wilkie,A.O.M., Buckle,V.J., Winter,R.M., Holland,A.J. and McDermid,H.E. (1995) Nature Genet., 9, 132–139. [DOI] [PubMed] [Google Scholar]
- 6.Wong A.C.C., Ning,Y., Flint,J., Clark,K., Dumanski,J., Ledbetter,D.H. and McDermid,H.E. (1997) Am. J. Hum. Genet., 60, 113–120. [PMC free article] [PubMed] [Google Scholar]
- 7.Chamberlain J.S., Gibbs,R.A., Ranier,J.E., Nguyen,P.N. and Caskey,C.T. (1988) Nucleic Acids Res., 16, 11141–11156. [DOI] [PMC free article] [PubMed] [Google Scholar]
- 8.Lupski J.R., Wise,C.A., Kuwano,A., Pentao,L., Parke,J.T., Glaze,D.G., Ledbetter,D.H., Greenberg,F. and Patel,P.I. (1992) Nature Genet., 1, 29–33. [DOI] [PubMed] [Google Scholar]
- 9.Puget N., Torchard,D., Serova-Sinilnikova,O.M., Lynch,H.T., Feunteun,J., Lenoir,G.M. and Mazoyer,S. (1997) Cancer Res., 57, 828–831. [PubMed] [Google Scholar]
- 10.Zucman-Rossi J., Legoix,P., Der Sarkissian,H., Cheret,G., Sor,F., Bernardi,A., Cazes,L., Giraud,S., Ollagnon,E., Lenoir,G. and Thomas,G. (1998) Hum. Mol. Genet., 7, 2095–2101. [DOI] [PubMed] [Google Scholar]
- 11.Prior T.W. (1998) Clin. Chem., 44, 703–704. [PubMed] [Google Scholar]
- 12.Kim J., Yu,W., Kovalski,K. and Ossowski,L. (1998) Cell, 94, 353–362. [DOI] [PubMed] [Google Scholar]
- 13.Kalinina O., Lebedeva,I., Brown,J. and Silver,J. (1997) Nucleic Acids Res., 25, 1999–2004. [DOI] [PMC free article] [PubMed] [Google Scholar]
- 14.Kallioniemi A., Kallioniemi,O.P., Sudar,D., Rutovitz,D., Gray,J.W., Waldman,F. and Pinkel,D. (1992) Science, 258, 818–821. [DOI] [PubMed] [Google Scholar]
- 15.Pinkel D., Segraves,R., Sudar,D., Clark,S., Poole,I., Kowbel,D., Collins,C., Kuo,W.-L., Chen,C., Zhai,Y., Dairkee,S.H., Ljung,B., Gray,J.W. and Albertson,D.G. (1998) Nature Genet., 20, 207–211. [DOI] [PubMed] [Google Scholar]
- 16.Armour J.A.L., Povey,S., Jeremiah,S. and Jeffreys,A.J. (1990) Genomics, 8, 501–512. [DOI] [PubMed] [Google Scholar]
- 17.Armour J.A.L., Crosier,M., Malcolm,S., Chan,J.C.-T. and Jeffreys,A.J. (1995) Proc. R. Soc. Lond. B, 261, 345–349. [DOI] [PubMed] [Google Scholar]
- 18.Armour J.A.L., Crosier,M. and Jeffreys,A.J. (1996) Ann. Hum. Genet., 60, 11–20. [DOI] [PubMed] [Google Scholar]
- 19.Goldfarb M., Shimizu,K., Perucho,M. and Wigler,M. (1982) Nature, 296, 404–409. [DOI] [PubMed] [Google Scholar]
- 20.Nakamura Y., Ballard,L., Leppert,M., O’Connell,P., Lathrop,G.M., Lalouel,J.M. and White,R. (1988) Nucleic Acids Res., 16, 5707. [DOI] [PMC free article] [PubMed] [Google Scholar]
- 21.Sandhu G.S., Precup,J.W. and Kline,B.C. (1989) Biotechniques, 7, 689–690. [PubMed] [Google Scholar]
- 22.Sambrook J., Fritsch,E.F. and Maniatis,T. (1989) Molecular Cloning: A Laboratory Manual, 2nd Edn. Cold Spring Harbor Laboratory Press, Cold Spring Harbor, NY.
- 23.Southern E.M. (1975) J. Mol. Biol., 98, 503–517. [DOI] [PubMed] [Google Scholar]
- 24.Pardue M.L. and Gall,J.G. (1969) Proc. Natl Acad. Sci. USA, 64, 600–604. [DOI] [PMC free article] [PubMed] [Google Scholar]
- 25.John H., Birnstiel,M. and Jones,K. (1969) Nature, 223, 582–587. [DOI] [PubMed] [Google Scholar]
- 26.Bauman J.G.J., Wiegant,J., Borst,P. and van Duijn,P. (1980) Exp. Cell Res., 138, 485–490. [DOI] [PubMed] [Google Scholar]
- 27.Smith L.M., Sanders,J.Z., Kaiser,R.J., Hughes,P., Dodd,C., Connell,C.R., Heiner,C., Kent,S.B.H. and Hood,L.E. (1986) Nature, 321, 674–679. [DOI] [PubMed] [Google Scholar]