

Abstract
Objectives—
H-scan ultrasound (US) imaging is a novel tissue characterization technique to detect apoptosis-induced changes in cancer cells after the initiation of effective drug treatment. The objective of the proposed research was to assess the sensitivity of 3-dimensional (3D) H-scan US technique for monitoring the response of breast cancer-bearing animals to neoadjuvant chemotherapy and correlate results to diffusion-weighted magnetic resonance imaging (DW-MRI) measurements of programmed cancer cell death.
Methods—
Experimental studies used female mice (N = 18) implanted with human breast cancer cells. Animals underwent H-scan US and DW-MRI imaging on days 0, 1, 3, 7, and 10. After imaging at day 0, breast tumor-bearing nude mice were treated biweekly with an apoptosis-inducing drug. Texture analysis of H-scan US images explored spatial relationships between local US scattering. At day 10, H-scan measurements were compared with DW-MRI-derived apparent diffusion coefficient (ADC) values and histological findings.
Results—
H-scan US imaging of low and high dose cisplatin-treated cancer-bearing animals revealed changes in image intensity suggesting a progressive decrease in aggregate US scatterer size that was not observed in control animals. Longitudinal trends discovered in H-scan US result matched with texture analysis and DW-MRI (P < .01). Further, analysis of the H-scan US image intensity and corresponding DW-MRI-derived ADC values revealed a strong linear correlation (R2 = .93, P < .001). These changes were due to cancer cell apoptotic activity and consider as early detectable biomarker during treatment.
Conclusions—
The 3D H-scan technique holds promise for assisting clinicians in monitoring the early response of breast cancer tumor to neoadjuvant chemotherapy and adding value to traditional diagnostic ultrasound examinations.
Keywords: apoptosis, breast cancer, diffusion-weighted magnetic resonance imaging, H-scan, tissue characterization, ultrasound
Introduction
Breast cancer is reported as the leading malignant disease in 2022 with the second-highest mortality rate.1 Over the last several decades, there has been a steady decline in cancer mortality due to improved screening and diagnosis. However, the problem associated with locally advanced breast cancer (LABC) is a major clinical concern, and 15% of the LABC patients are diagnosed with triple-negative breast cancer (TNBC). An essential characteristic of TNBC is insufficient expression of three major receptors: progesterone receptor, human epidermal growth factor receptor 2, and estrogen receptor. Therefore, this type of cancer tends to grow and migrate fast and has less treatment options due partly to insufficient targets. Additionally, it also has a higher recurrency rate compared with other breast cancer types.
TNBC is sensitive to neoadjuvant chemotherapy. Consequently, it has gradually become the routine for breast cancer pre-surgical care.2 Application of systemic therapy before surgery can benefit patients by decreasing tumor size and improving long-term survival. Studies have additionally shown that the early-stage response of the tumor to neoadjuvant chemotherapy is often used to predict patient’s recurrence-free survival (RFS). However, TNBC is a dynamic disease and the tumor becomes more heterogeneous during development.3 Personalized medicine consequently becomes an important procedure to optimize therapy strategies for each patient. The challenge remains as how to accurately track tumor response of neoadjuvant chemotherapy at an early stage.
Clinical assessment, mammography, positron emission tomography (PET), magnetic resonance imaging (MRI), and ultrasound (US) are promising modalities for the early evaluating purpose in the neoadjuvant setting.4 These traditional assessment methods typically rely on ascertaining overall tumor bulk changes using Response Evaluation Criteria in Solid Tumors (RECIST) guidelines. However, measurable tumor physical changes may need multiple cycles of therapy, which can bring unnecessary toxicity to the patient when the predefined treatment is not effective. Noninvasive diffusion-weighted magnetic resonance imaging (DW-MRI) is a sophisticated technique that monitors water molecule diffusion change caused by cell apoptosis. However, its clinical application is limited by the high demand of capital investment and some inherent safety issues.5
Research efforts have focused on using noninvasive US to quantitatively characterize tissue to assist clinical cancer chemotherapy for decades. Quantitative ultrasound (QUS) is a promising tissue characterization method to measure the frequency changes in the captured radiofrequency (RF) signal.6 The accuracy of QUS is typically dependent on a calibration step and reference signal measurements to remove the influence of user and US system settings. Clinical application of the QUS technique is limited partially due to it being too computational intensive for existing hardware.7 To help simplify the tissue characterization process, a newer high-resolution US-based modality has emerged. Termed H-scan US (where the “H” stands for Hermite or hue) imaging, this technique depicts the relative size of US scatterer ensembles.8 During H-scan US imaging, lower frequency backscattered signal content is produced by larger acoustic scatterers whereby higher frequency signals are generated by the US wave interacting with smaller scatterer aggregates. In short, this qualitative technique depicts spatial differences in tissue scatterers that are otherwise not visible in the conventional grayscale B-scan US images to add additional information to assist real-time US examinations.9 Initial experience has found that H-scan US examinations can be completed in seconds after patient preparation and are reproducible within and between subjects.10 Ongoing clinical research is exploring the use of noninvasive H-scan US imaging for applications like differentiating benign from malignant thyroid tumors11,12 and monitoring early breast cancer response to neoadjuvant chemotherapy.10
Literature studies have successfully demonstrated that early cumulative microstructural change often leads to tumor physical volume change. Multiple anti-cancer drugs that induce programmed cell death (ie, apoptosis) can trigger those changes in tumor microstructure. As demonstrated in Figure 1, one type of the advanced morphology change in breast cancer tumor undergoing apoptosis is subcellular nuclear condensation followed by fragmentation.13 Due to chromatin compaction during this biological process, these morphological alterations influence backscattered US signals14 and can be exploited for tissue characterization to monitor early stage TNBC tumor response during chemotherapy.15–18 To that end, the objective of this study was to introduce a new high-resolution H-scan US volumetric imaging technique for locally depicting tissue microstructure. By using a preclinical TNBC mice model, H-scan US and MRI imaging were performed at baseline and again at day 1, 3, 7, and 10 after systemic administration of neoadjuvant chemotherapy. Eventually, DW-MRI, textural homogeneity, and histological measurements were performed to evaluate the accuracy of 3D H-scan US imaging.
Figure 1.
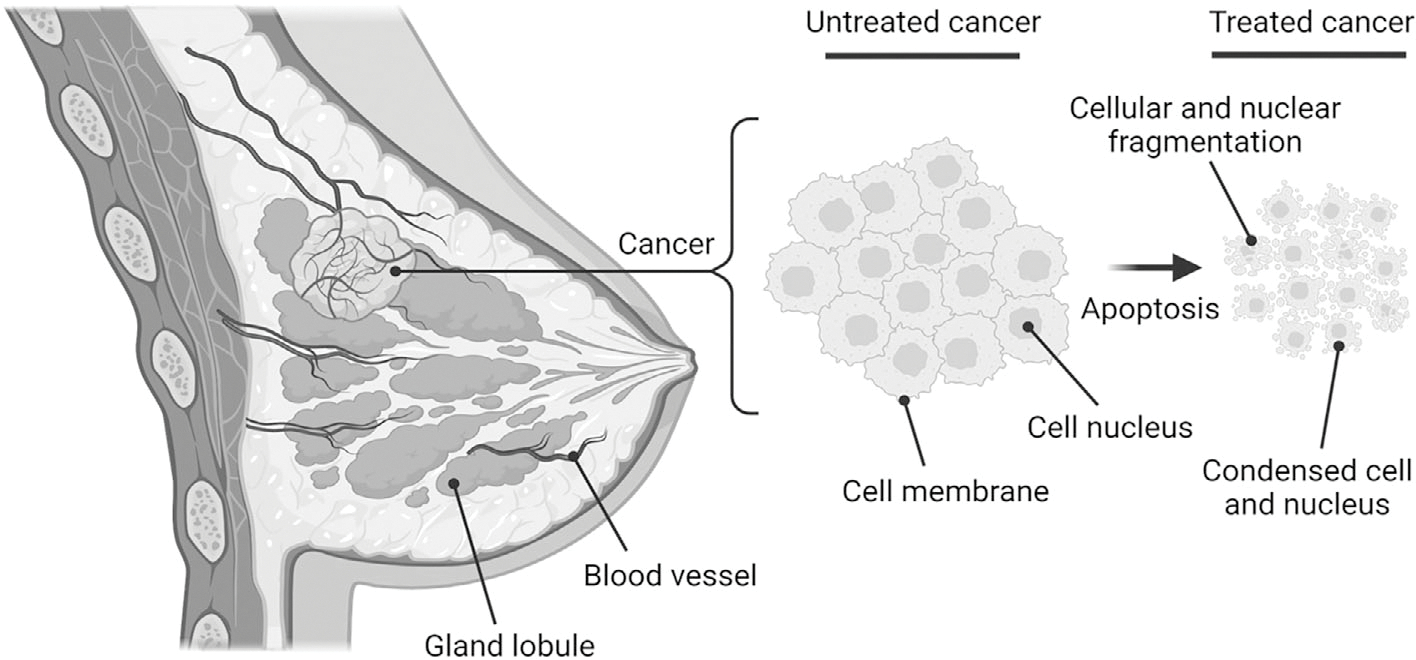
Following effective treatment with apoptosis-inducing chemotherapeutic drugs, cancer cell aggregates undergo morphological changes including nuclear condensation and then fragmentation at an early stage.
Materials and Methods
Animal Preparation and Treatment
Animal experiments met regulatory requirements and were approved by our Institutional Animal Care and Use Committee (IACUC). Preclinical experiments were performed using 6-week-old female athymic nude mice (N = 18, Charles River Laboratories, Wilmington, MA). One million TNBC cells (MDA-MB-231, American Type Culture Collection, Manassas, VA) in Dulbecco’s Modified Eagle Medium (DMEM) with 10% fetal bovine serum (FBS) and 1% Penicillin/Streptomycin were then implanted to the animal.19 When tumors reached about 500 mm3 in size, animals received biweekly intraperitoneal injections of 1) 5 mg/kg of control sterile saline, 2) 5 mg/kg (low dose), or 3) 25 mg/kg (high dose) of cisplatin (N = 6 per group). Imaging was performed at baseline before treatment (day 0) and again at different timelines. At study conclusion, tumors were harvested for ex vivo histological analysis. A timeline of the experimental protocol is presented in Figure 2.
Figure 2.
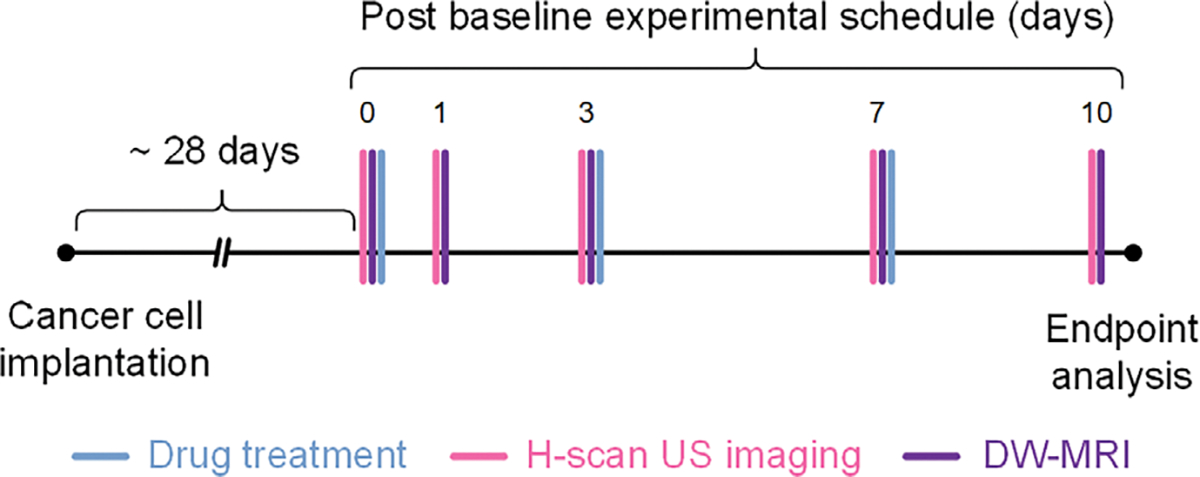
Experimental timeline including animal preparation, drug treatment, and H-scan ultrasound (US) and diffusion-weighted magnetic resonance imaging (DW-MRI) schedules. At study conclusion, animals were euthanized and tumors excised for histological analysis.
Image Acquisition
The backscattered US data was collected using a MX201 linear array transducer which equipped on an open-sourced Vevo 3100 US platform (FUJIFILM VisualSonics Inc, Toronto, Canada). This 256-element (0.125 mm pitch) preclinical transducer was operated at a center frequency of 15 MHz with bandwidth ranging from 10 to 21 MHz. Under B-scan US guidance, a mechanical positioning system was used to automatically sweep the transducer throughout the tumor burden as US images were acquired (50 μm frame spacing) to complete each volumetric data set. In-phase/quadrature (IQ) data was stored for conversion to RF format and additional post-processing.
Adaptive frequency-dependent attenuation correction technique was applied to all RF data to account for depth-dependent signal loss.20 Tissue scattering transfer functions were subsequentially classified through H-scan US processing. Given the U7S system two-way impulse response resembles a Gaussian-weighted Hermite (GH) polynomial function, two convolutional filters comprised of 6th- and 12th-order GH polynomials (GH6 and GH12) were adaptively applied to capture the low and high frequency backscattered US signal content. After energy normalization and envelope detection, these outputs were implemented into H-scan US volume reconstruction. Note that the GH6 and GH12 were mathematically modeled to simulate US pulse reflected from larger (redder hue) and smaller (bluer hue) US scatterer aggregates, respectively.21 Then H-scan US imaging technique was defined to denote bluer hues as increases of image intensity driven by smaller US scatterer aggregates. A summary of the H-scan US volumetric reconstruction technique is detailed in Figure 3.
Figure 3.
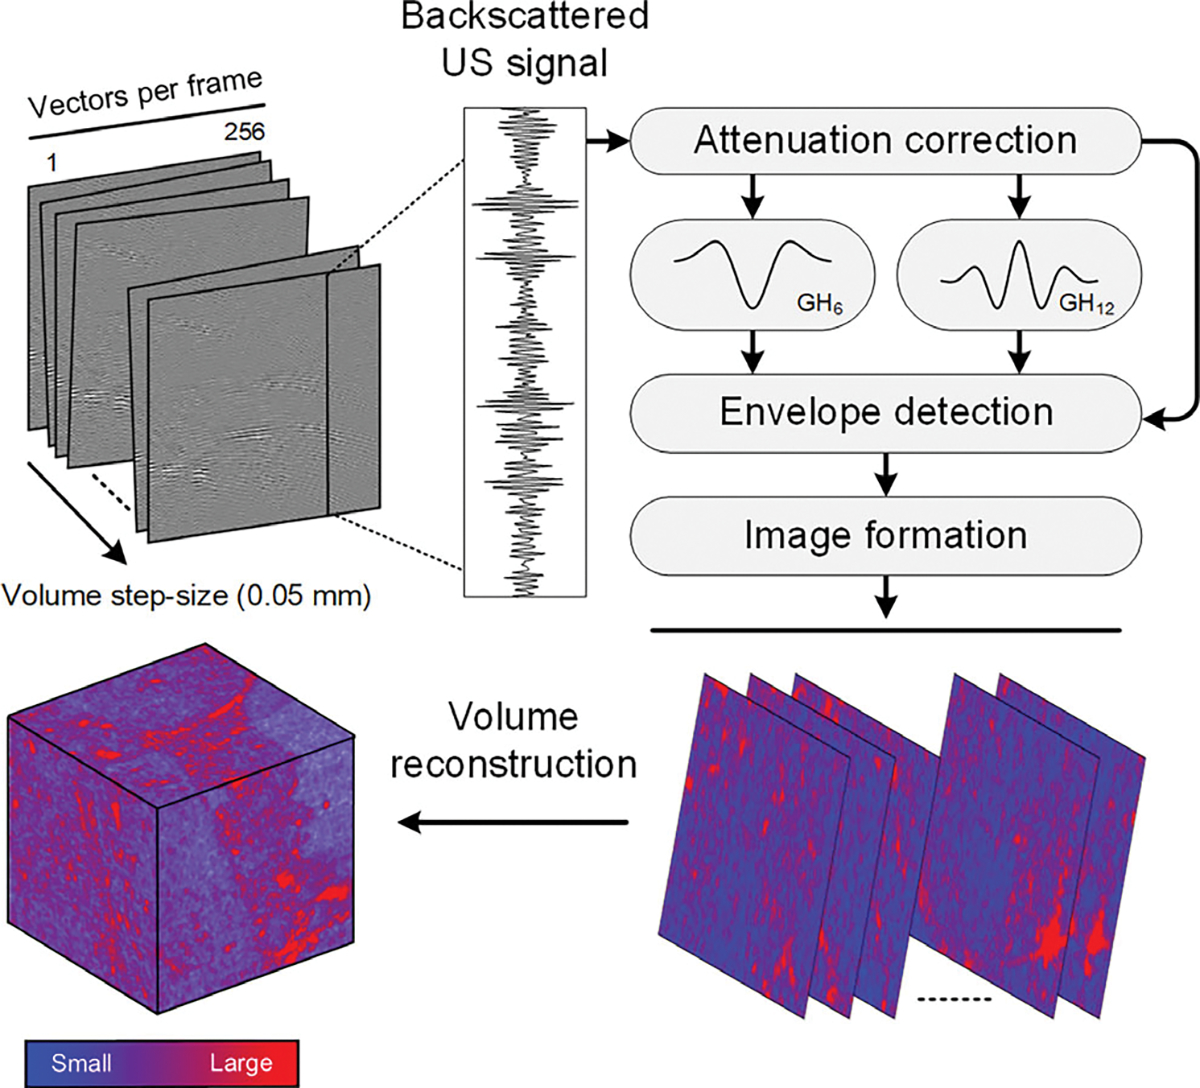
Schematic diagram highlighting the US data processing strategy for 3-dimensional (3D) H-scan US image reconstruction. Briefly, after attenuation correction, a pair of nth-order Gaussian-weighted Hermite polynomial filters (denoted GH6 and GH12) were applied to the US data for measuring the relative strength of the received signals. Thereafter, the isolated lower and higher frequency backscattered US signal content was assigned to bluer and redder hue channels to denote smaller and larger US scatterers, respectively.
In addition to mean-value H-scan US image intensity measurements of the segmented tumor volumes, the spatial relationship between local US scattering within the tumor space was quantified using extracted textural features. The gray-level co-occurrence matrix (GLCM) was calculated to analyze second-order texture parameters of the H-scan US images based on the angular relationship and the offset between neighboring pixels (11). To get reliable statistical results, four GLCM were calculated with angular values of 0° to 135° at 45° increments and pixel distance of 1. Image homogeneity was extracted accordingly from the corresponding GLCM and then subsequently averaged.
Preclinical MRI scanner (BioSpec 3T, Bruker Corp, Billerica, MA) equipped with a mouse body coil was used to perform DW-MRI. Images were acquired using a pulsed-gradient spin echo sequence with a (repetition time) TR/(echo time) TE of 30 ms, TR of 2300 ms, and a b-value of 650 s/mm2. Scans covered the entirety of the tumor volume, ranging from 10 to 15 slices using an image matrix size 44 × 32 and field-of-view (FOV) of 20.9 × 16.0 mm for a resolution of 0.5 mm. Using vendor software (Bruker), ROIs were drawn on the apparent diffusion coefficient (ADC) maps to measure average diffusion.
Histological Analysis
At the end of the proposed experiment, all animals were humanely euthanized and the tumors were harvested and sectioned to 5 μm. Multiple tissue slides were stained for H&E (cell morphology), AC3 (cell apoptosis), DAPI (nuclear size), and Ki67 (cell proliferation). The ×25 magnification was then used to optically imaging whole tissue slides for robust histological analysis (Axio Observer 7, Carl Zeiss Microscopy, White Plains, NY). Quantitative image analysis was performed using established protocols detailed previously.22 All parameters were summarized as percent activity of tumor cross-sectional area.
Due to the immense computational burden, nuclear segmentation from the digital DAPI images was performed using a customized encoder-decoder U-Net network with suppressed feature activations in the uninterested regions.23 To initialize the network, 70% of the image data was randomly selected and a patch size of 64 × 64 × 64 was set during training whereas the remaining 30% of data was used for validation. The learning rate was set to 0.001 during training and the typical Adam optimizer was used to update weights and bias. The network was fine-tuned using human-annotated DAPI data. The Dice coefficient measure was used to evaluate segmentation performance.24
Performance Measurements
All image data was summarized as mean ± standard error of the mean. Changes in tumor size and image data were evaluated through mixed-effects analysis of variance (ANOVA) test. A one-way ANOVA test was used to evaluate group differences in histology data at study conclusion. To assess sensitivity of drug responders, mean group values from H-scan US and DW-MRI images of cisplatin-treated mice were normalized by baseline measures and analyzed using linear regression methods. A simple linear regression analysis was also used to compare H-scan US to corresponding DW-MRI and histological results. Any P-value <.05 was considered as statistically different using Prism 9.0 (GraphPad Software, San Diego, CA).
Results
The reconstructed H-scan US volume was segmented to track TNBC response to apoptosis-inducing chemotherapy using a preclinical animal model. The chemotherapy included biweekly doses of control or cisplatin at lower (5 mg/kg) or higher (25 mg/kg) concentrations. Figure 4 depicts a set of reconstructed H-scan US tumor volumes and corresponding scatter plots of image intensity changes. It is noteworthy that the peripheral surfaces of segmented tumors exhibit subtle spatial heterogeneity. While no statistical color differences were determined at day 0 (P > .99), progressive blue hue shifts were present for mice undergoing chemotherapy whereas control group tumors appear the same over time. Furthermore, a statistically significant H-scan image intensity increase was found for both the low and high dose cisplatin-treated animal groups (P < .04) but not for controls (P = .92). Specifically, there were image intensity increases of 51.2 ± 5.1% and 68.4 ± 2.6% at day 10 for the low and high dose drug treatment groups relative to baseline measurements, which equated to a sensitivity of 0.36 and 0.41 dB/day, respectively (R2 > .90, P < .01). The H-scan US images also exhibited notable changes after textural analysis and calculation of the image homogeneity parameter plotted in Figure 4. While no changes were found in the control group values (−0.6 ± 0.4%; P = .24), tumors treated with a low or high dose of cisplatin resulted in significantly lower levels of tissue homogeneity by day 10 after start of drug treatment, −1.5 ± 0.4% and −2.5 ± 0.2%, respectively (P < .01).
Figure 4.
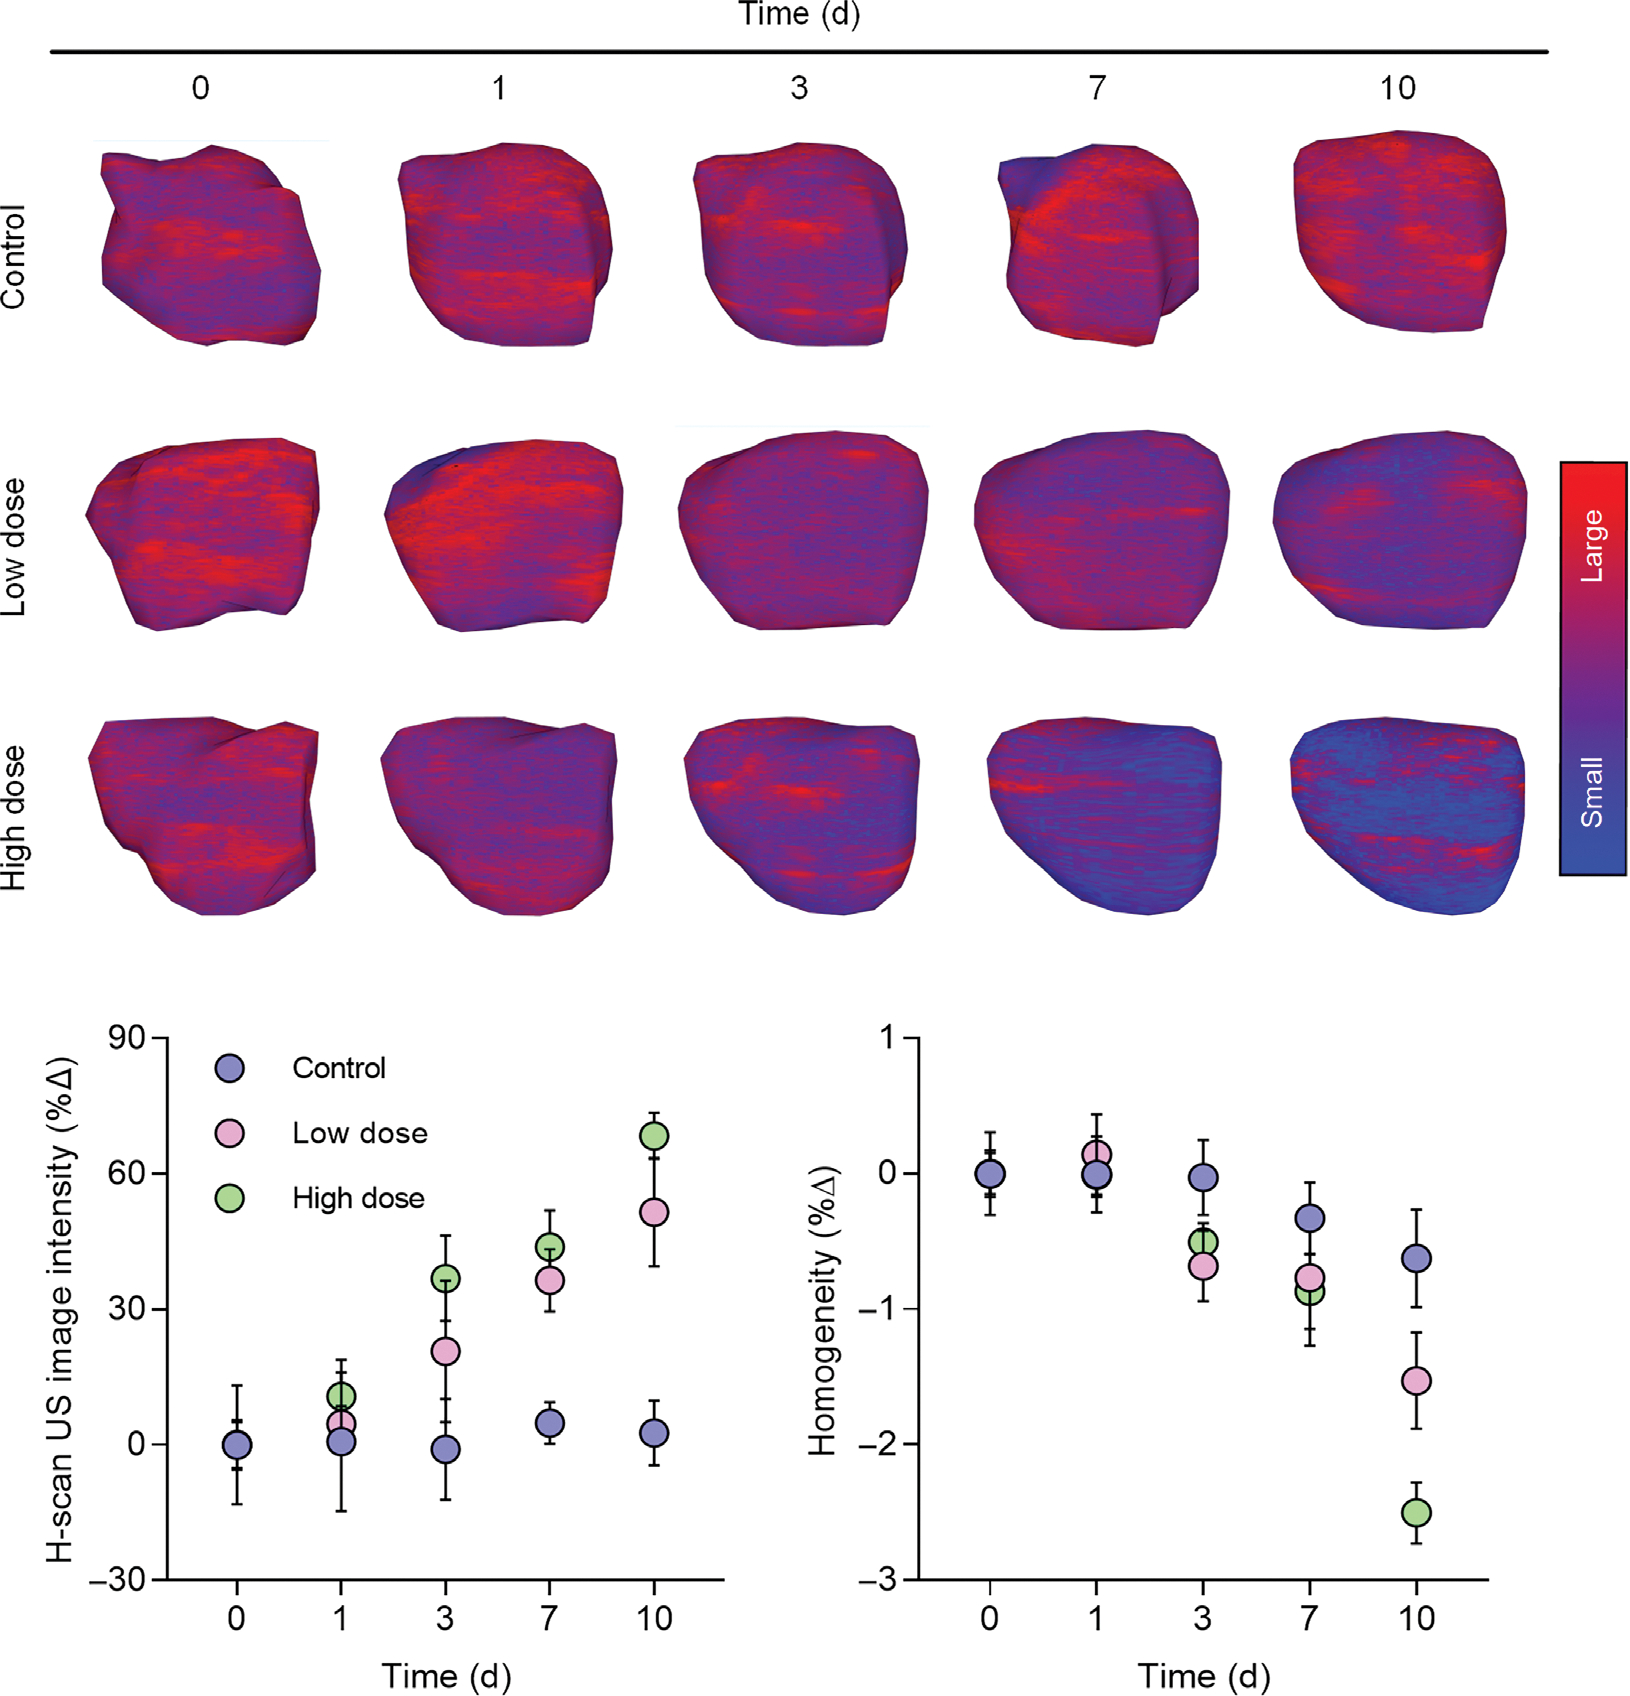
Representative 3D H-scan US images from breast cancer-bearing mice at baseline (day 0) and at day 1, 3, 7, and 10 after start of neoadjuvant chemotherapy with control drug, low dose cisplatin, or high dose cisplatin. A dot plot of mean H-scan US image intensities and textural analysis involving the image homogeneity parameter reveal changes within days of drug treatment initiation.
A representative set of the ADC maps calculated from the DW-MRI are presented in Figure 5. The DW-MRI data suggests a progressive increase in the mean ADC value from animals undergoing chemotherapy. Compared with the control group ADC measurements on day 10 (−2.6 ± 4.1%), those from low- and high-dose cisplatin groups were significantly higher, 37.7 ± 15.7% and 73.5 ± 2.9% (P < .01) that equated to the sensitivity of 0.27 and 0.39 dB/day, respectively (R2 > .88, P < .02). These observations were attributed to edema and increased water mobility due to drug-induced apoptosis. Next, it was found that the mean DW-MRI-derived ADC values were linearly proportional to their corresponding H-scan US image intensities for each animal (R2 = .93, P < .001).
Figure 5.
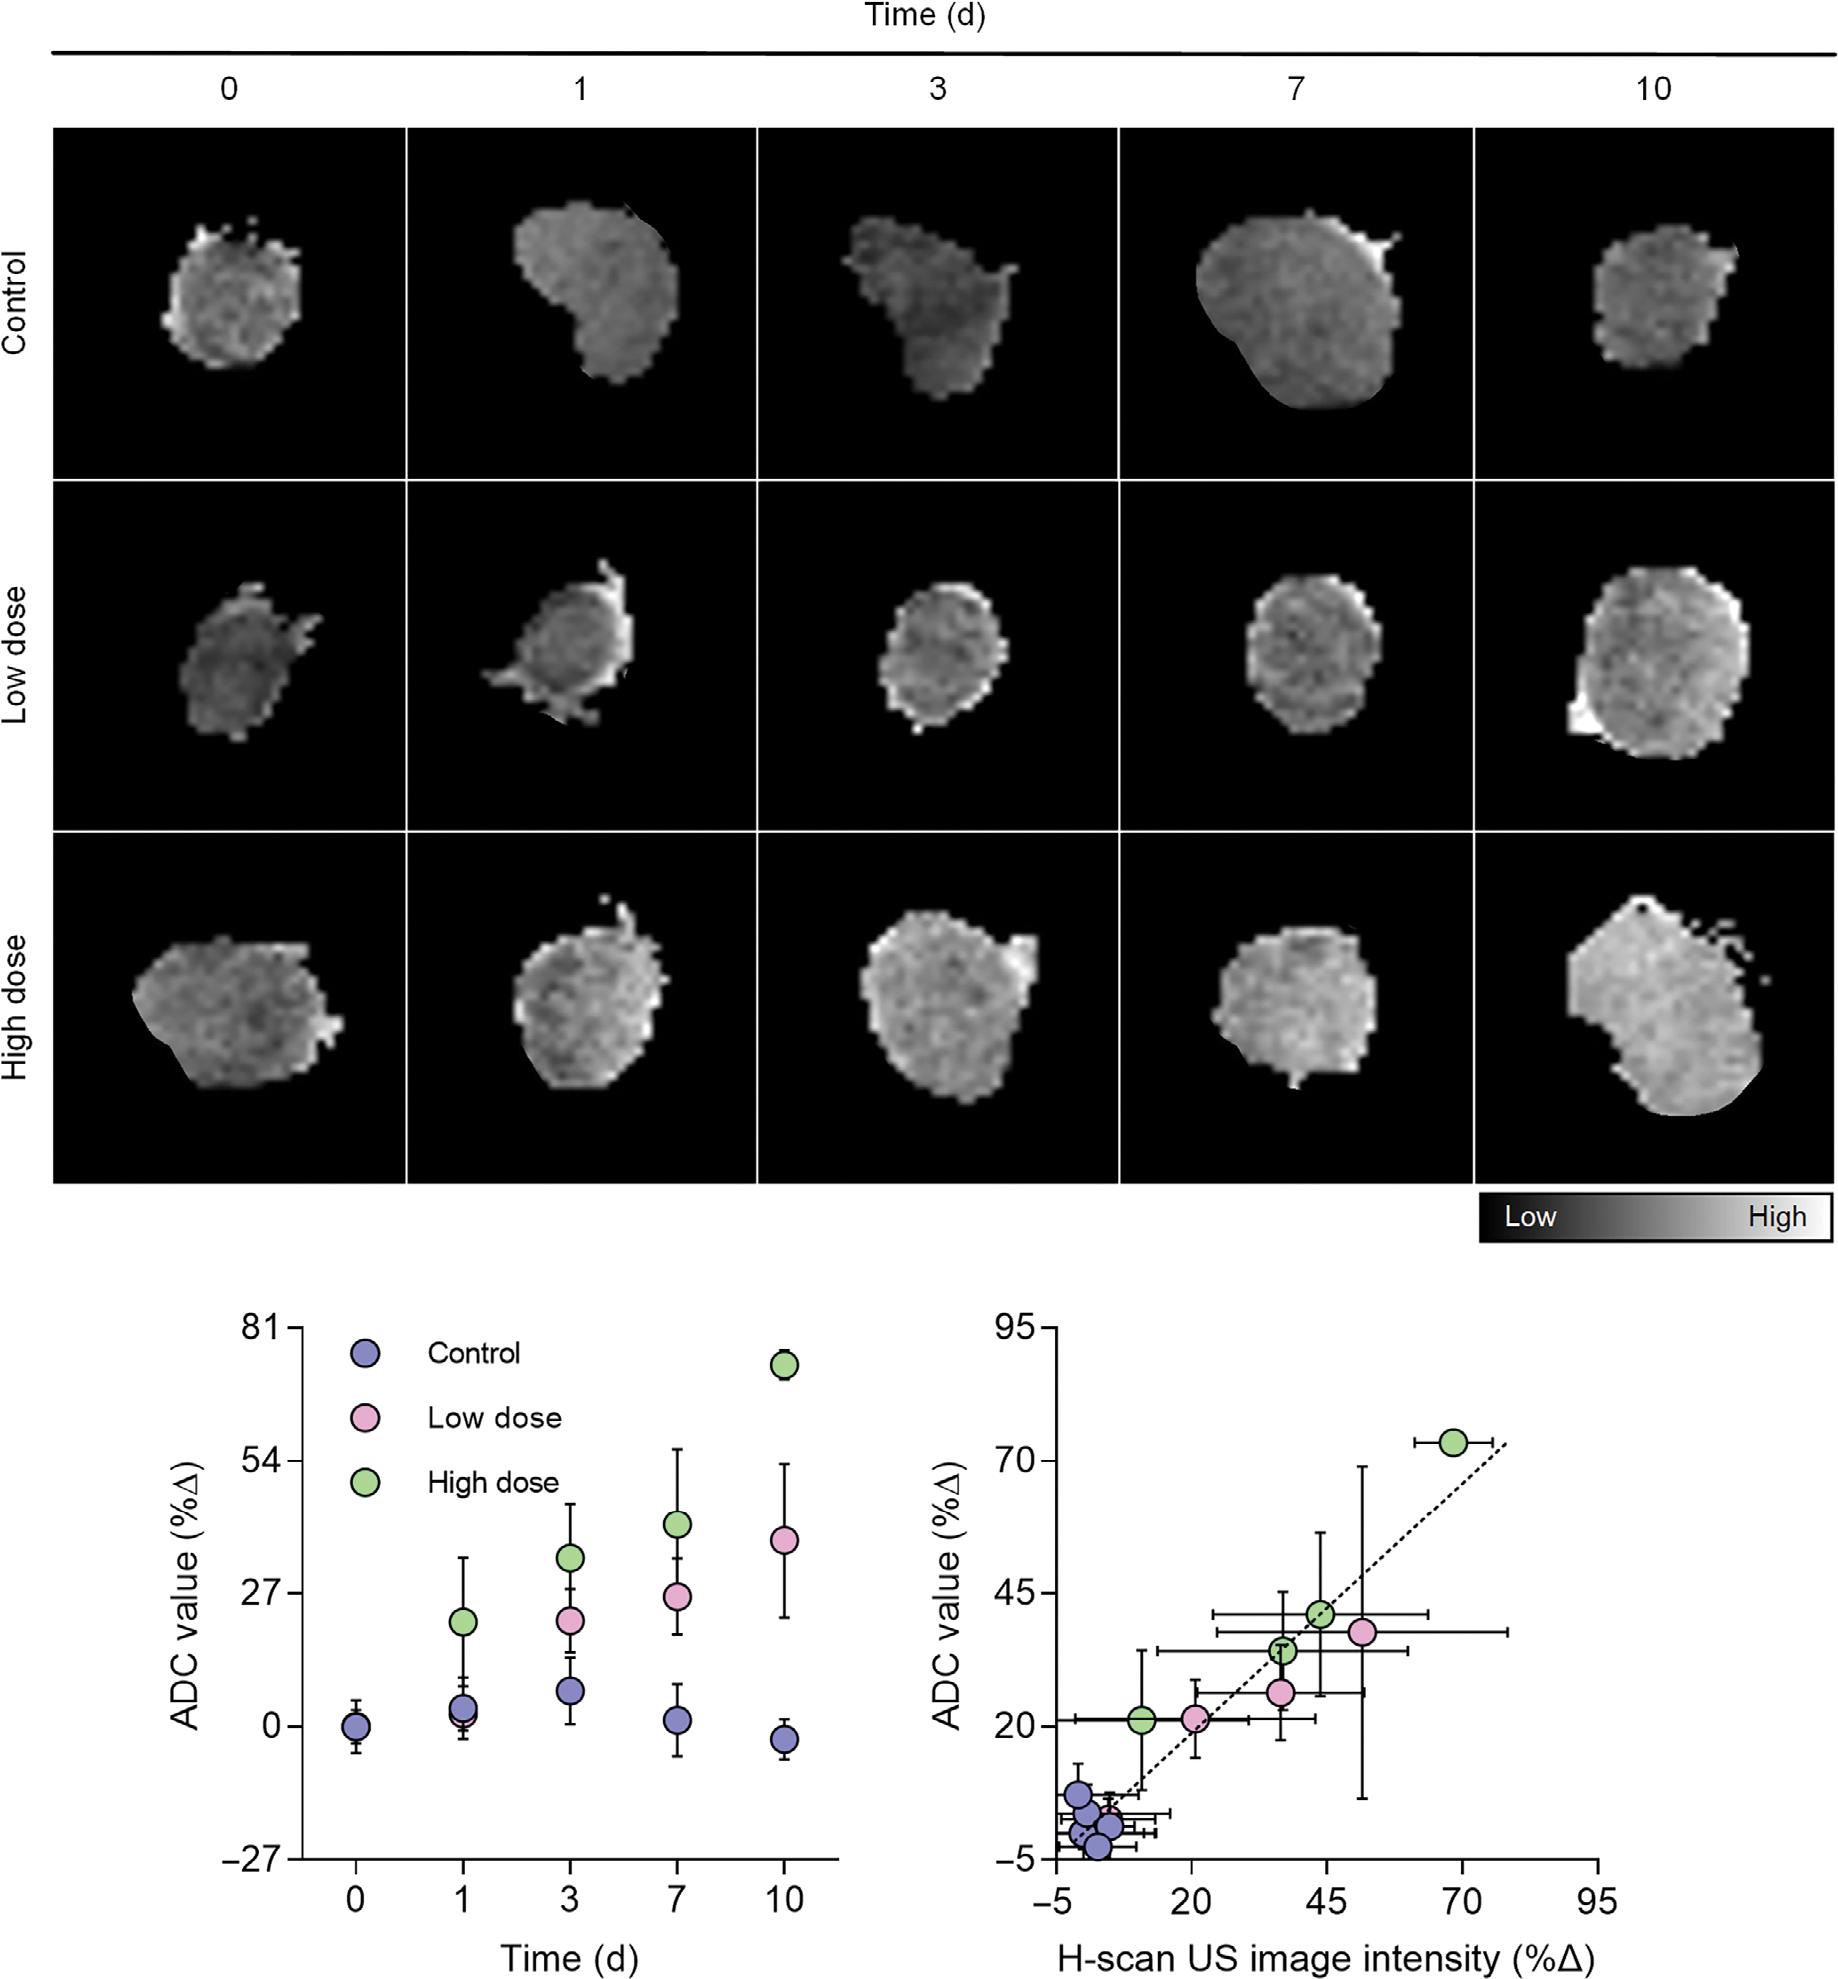
Representative DW-MRI-derived apparent diffusion coefficient (ADC) maps from breast cancer-bearing mice at baseline (day 0) and at day 1, 3, 7, and 10 after start of neoadjuvant chemotherapy with control drug, low dose cisplatin, or high dose cisplatin. A summary of mean ADC values reveals changes within days of drug treatment initiation. A comparison of H-scan US and DW-MRI-based intratumoral measures reveals a linear trend.
After conducting US and MRI imaging on the last day, tumor tissue was harvested for ex vivo histological processing. Digitized histology images suggest an obvious difference in the fraction of cancer cell apoptotic and proliferation activity for both the control and drug-treated tumors at termination (Figure 6). More specifically, cell proliferation activity was 79.3 ± 0.8%, 51.5 ± 2.6%, and 40.3 ± 4.5% for the control, low, and high dose cisplatin-treated tumors, respectively (P < .01 vs control). Apoptotic levels were 20.7 ± 0.9%, 48.5 ± 2.6%, and 59.7 ± 4.5% for the same groups, respectively (P < .01 vs control). Finally, cancer cell nuclear size was quantified through the registered DAPI-stained tissue sections. While mean nuclear size (diameter) measures from the control tumor group were found to be 17.6 ± 6.5 μm, nuclear size from tumors treated with low and high dose cisplatin were significantly smaller, 14.1 ± 4.5 and 8.9 ± 8.8 μm, respectively (P < .02). Correlation analysis of H-scan US and histological findings found a significant linear relationship for nuclear size (R2 = .21, P < .001), cell proliferation (R2 = .33, P < .001), and apoptotic activity (R2 = .40, P < .001).
Figure 6.
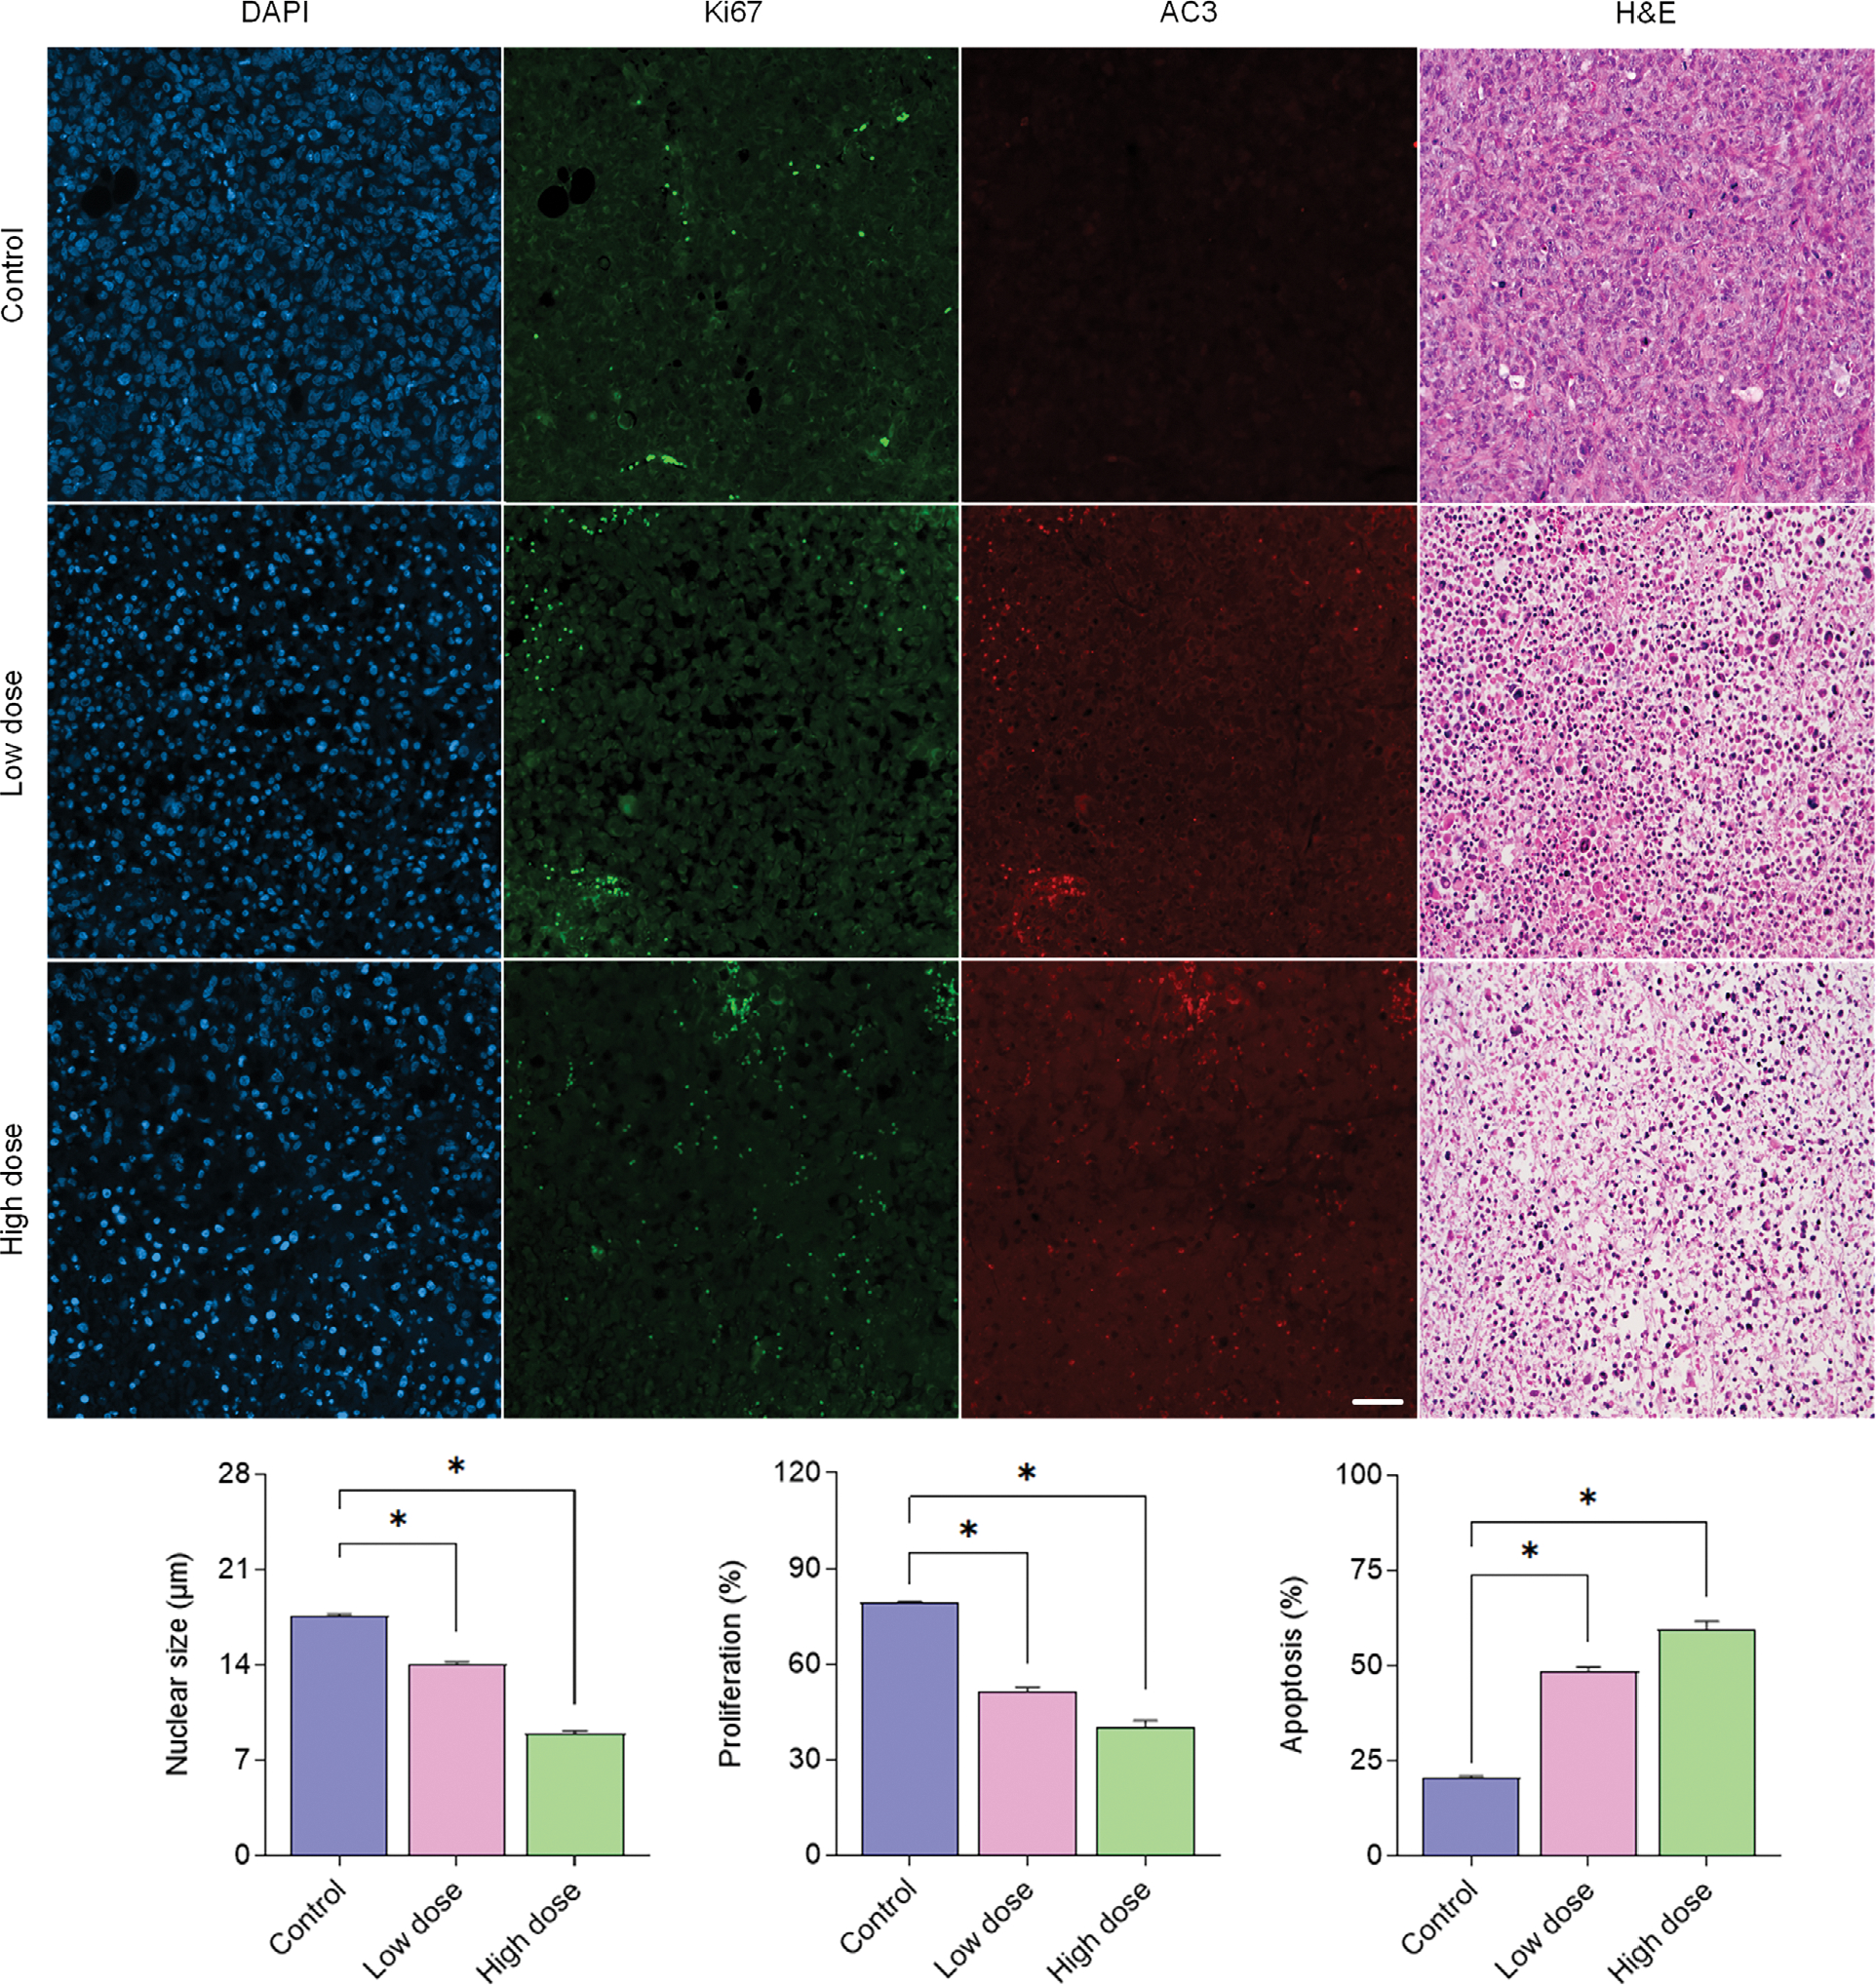
Representative histological images and mean group summary plots of tumor tissue after staining for cancer cell nuclear location (DAPI), proliferation (Ki67), apoptosis (AC3), and tissue morphology (H&E). *indicates P < .05 versus control.
Discussion
The primary objective of the proposed research was to evaluate the accuracy of using in vivo real-time H-scan US imaging technique for early-stage assessment of TNBC tumor-bearing mice given a biweekly control or chemotherapeutic drug (cisplatin) at relatively low or high doses. As experimental results demonstrate, H-scan US imaging technique detected progressive intratumoral changes in animals administered with chemotherapy, which suggests subcellular US scatterer aggregates in the treated tumors were getting smaller in size. No changes were observed in control animals. As cisplatin is an apoptosis-inducing chemotherapeutic drug, cancer cell aggregates undergo significant structural alterations in nuclear including condensation followed by fragmentation13 other than cellular elasticity and density changes.25 These alterations consequently affect backscattered US signals from the bulk tumor. At termination (day 10), results from our study revealed that the averaged intensity of H-scan US image was linearly proportional to nuclear size, proliferation, and apoptotic activity, which are all intimately related histological features. This observation supports previous studies that showed a linear relationship between H-scan US image intensity and tumor cell nuclear size measurements from registered histology images.22,26,27 In addition to mean-value H-scan US measurements of the segmented tumor volumes, a textural feature referred to as homogeneity was examined. Recall this image feature is helpful for quantifying the spatial relationship between local US scattering within the tumor space. As texture analysis revealed, there was less intratumoral homogeneity from the therapy group, which is consistent with other drug response studies.28 These US image textural analysis methods were recently shown to be promising for the classification of human breast lesions with very high accuracy.17 One potential limitation of preclinical treatment protocol is that a single drug was used. While chemotherapy is a standard therapeutic regimen to treat TNBC, chemotherapy alone does not result in significant improvement and often leads to drug resistance in patients.29 Future work should explore use of a combination therapy for TNBC treatment.
Several previous studies have already investigated imaging techniques for noninvasively monitoring TNBC response to neoadjuvant chemotherapy, including those based on contrast-enhanced mammography,30 positron emission tomography (PET), and dynamic contrast-enhanced MRI (DCE-MRI).31,32 However, these methods require intravenous injection of endogenous contrast agents, which lowers patient acceptance of the imaging procedures. While diffuse optical tomography has been shown capable of monitoring breast cancer response the treatment,33 optical techniques are hampered by lower resolution. DW-MRI is a sophisticated functional imaging modality that monitors water molecule Brownian motions in tissue. The ADC value calculated by DW-MRI is commonly used to monitor the magnitude of diffusion by providing information related to the cellularity and integrity of cell membranes in tumors. Several studies have demonstrated that ADC values can be used to categorize responders to neoadjuvant chemotherapy in breast cancer patients.34,35 In our study, we compared mean H-scan US image intensity to DW-MRI-derived ADC values and found a linear relationship between the two measurements (R2 = .93, P < .001). Compared with MRI scanners that require a considerable financial investment and physical resources for operation and maintenance, US is known for its relatively low cost, fast data acquisition speed, and easiness to operate. Notwithstanding, future work should compare in more detail the diagnostic performance between DW-MRI and H-scan US imaging for identifying responders to neoadjuvant chemotherapy.
Conclusion
Early assessment of therapeutic efficacy is essential to prevent unnecessary treatment and help optimize strategies to extend patient lives. H-scan US volumetric imaging is a promising method for tracking of the changes in US scatterer size. In tissue, this US technique relies on intrinsic contrast changes arising from changes in the acoustic properties during TNBC tumor cells apoptosis. As detailed in this article, H-scan US imaging can provide preclinical insight into the early stage TNBC tumor response to neoadjuvant chemotherapy as confirmed by MRI and histological findings.
Acknowledgments
This research was supported by the National Institutes of Health (NIH) grant R01CA269973 and R01EB025841, and Cancer Prevention and Research Institute of Texas (CPRIT) award RP180670.
Abbreviations
- 3D
3-dimensional
- ADC
apparent diffusion coefficient
- DW-MRI
diffusion-weighted magnetic resonance imaging
- FBS
fetal bovine serum
- FOV
field-of-view
- GLCM
gray-level co-occurrence matrix
- LABC
locally advanced breast cancer
- MRI
magnetic resonance imaging
- PET
positron emission tomography
- QUS
quantitative ultrasound
- RECIST
Response Evaluation Criteria in Solid Tumors
- RF
radiofrequency
- RFS
recurrence-free survival
- TNBC
triple-negative breast cancer
- US
ultrasound
Contributor Information
Haowei Tai, Department of Electrical and Computer Engineering, University of Texas at Dallas, Richardson, Texas, USA.
Ryan Margolis, Department of Bioengineering, University of Texas at Dallas, Richardson, Texas, USA.
Junjie Li, Department of Bioengineering, University of Texas at Dallas, Richardson, Texas, USA.
Kenneth Hoyt, Department of Bioengineering, University of Texas at Dallas, Richardson, Texas, USA.
References
- 1.Siegel RL, Miller KD, Fuchs HE, Jemal A. Cancer statistics, 2022. CA Cancer J Clin 2022; 72:7–33. [DOI] [PubMed] [Google Scholar]
- 2.Liedtke C, Mazouni C, Hess KR, et al. Response to neoadjuvant therapy and long-term survival in patients with triple-negative breast cancer. J Clin Oncol 2008; 26:1275–1281. [DOI] [PubMed] [Google Scholar]
- 3.Dagogo-Jack I, Shaw AT. Tumour heterogeneity and resistance to cancer therapies. Nat Rev Clin Oncol 2018; 15:81–94. [DOI] [PubMed] [Google Scholar]
- 4.Graham LJ, Shupe MP, Schneble EJ, et al. Current approaches and challenges in monitoring treatment responses in breast cancer. J Cancer 2014; 5:58–68. [DOI] [PMC free article] [PubMed] [Google Scholar]
- 5.Papaevangelou E, Almeida GS, Jamin Y, Robinson SP, DeSouza NM. Diffusion-weighted MRI for imaging cell death after cytotoxic or apoptosis-inducing therapy. Br J Cancer 2015; 112:1471–1479. [DOI] [PMC free article] [PubMed] [Google Scholar]
- 6.Oelze ML, Mamou J. Review of quantitative ultrasound: envelope statistics and backscatter coefficient imaging and contributions to diagnostic ultrasound. IEEE Trans Ultrason Ferroelectr Freq Control 2016; 63:336–351. [DOI] [PMC free article] [PubMed] [Google Scholar]
- 7.Oelze M Quantitative ultrasound successes: past, present and future. SPIE Med Imaging 2020; 11319:1–6. [Google Scholar]
- 8.Khairalseed M, Hoyt K, Ormachea J, Terrazas A, Parker KJ. H-scan sensitivity to scattering size. J Med Imaging 2017; 4:043501. [DOI] [PMC free article] [PubMed] [Google Scholar]
- 9.Khairalseed M, Brown K, Parker KJ, Hoyt K. Real-time H-scan ultrasound imaging using a Verasonics research scanner. Ultrasonics 2019; 94:28–36. [DOI] [PMC free article] [PubMed] [Google Scholar]
- 10.Dolui S, James D, Trinh B, et al. First-in-human H-scan ultrasound imaging of breast cancer. Proc IEEE Ultrason Symp 2022; 1:1–4. [Google Scholar]
- 11.Khairalseed M, Laimes R, Pinto J, et al. Classification of thyroid nodules in H-scan ultrasound images using texture and prinicipal component analysis. Proc IEEE Lat Am Ultrason Symp 2021; 1:1–4. [Google Scholar]
- 12.Khairalseed M, Laimes R, Pinto J, et al. H-scan ultrasound imaging for the classification of thyroid tumors. Proc IEEE Ultrason Symp 2022; 1:1–3. [Google Scholar]
- 13.Czarnota GJ, Kolios MC, Abraham J, et al. Ultrasound imaging of apoptosis: high-resolution non-invasive monitoring of programmed cell death in vitro, in situ and in vivo. Br J Cancer 1999; 81:520–527. [DOI] [PMC free article] [PubMed] [Google Scholar]
- 14.Pasternak M, Doss L, Farhat G, et al. Effect of chromatin structure on quantitative ultrasound parameters. Oncotarget 2017; 8:19631–19644. [DOI] [PMC free article] [PubMed] [Google Scholar]
- 15.Sadeghi-Naini A, Sannachi L, Tadayyon H, et al. Chemotherapy-response monitoring of breast cancer patients using quantitative ultrasound-based intra-tumour heterogeneities. Sci Rep 2017; 7: 10352. [DOI] [PMC free article] [PubMed] [Google Scholar]
- 16.DiCenzo D, Quiaoit K, Fatima K, et al. Quantitative ultrasound radiomics in predicting response to neoadjuvant chemotherapy in patients with locally advanced breast cancer: results from multi-institutional study. Cancer Med 2020; 9:5798–5806. [DOI] [PMC free article] [PubMed] [Google Scholar]
- 17.Osapoetra LO, Chan W, Tran W, Kolios MC, Czarnota GJ. Comparison of methods for texture analysis of QUS parametric images in the characterization of breast lesions. PLoS One 2020; 15:e0244965. [DOI] [PMC free article] [PubMed] [Google Scholar]
- 18.Khairalseed M, Javed K, Jashkaran G, Kim J-W, Parker KJ, Hoyt K. Monitoring early breast cancer response to neoadjuvant therapy using H-scan ultrasound imaging: preliminary preclinical results. J Ultrasound Med 2019; 38:1259–1268. [DOI] [PMC free article] [PubMed] [Google Scholar]
- 19.Khairalseed M, Xiong F, Kim J-W, Mattrey RF, Parker KJ, Hoyt K. Spatial angular compounding technique for H-scan ultrasound imaging. Ultrasound Med Biol 2018; 44:267–277. [DOI] [PMC free article] [PubMed] [Google Scholar]
- 20.Tai H, Khairalseed M, Hoyt K. Adaptive attenuation correction during H-scan ultrasound imaging using K-means clustering. Ultrasonics 2020; 102:105987. [DOI] [PMC free article] [PubMed] [Google Scholar]
- 21.Tai H, Khairalseed M, Hoyt K. 3-D H-scan ultrasound imaging and use of a convolutional neural network for scatterer size estimation. Ultrasound Med Biol 2020; 46:2810–2818. [DOI] [PMC free article] [PubMed] [Google Scholar]
- 22.Tai H, Song J, Li J, Reddy S, Khairalseed M, Hoyt K. Three-dimensional H-scan ultrasound imaging of early breast cancer response to neoadjuvant therapy in a murine model. Invest Radiol 2022; 57:222–232. [DOI] [PMC free article] [PubMed] [Google Scholar]
- 23.Schlemper J, Oktay O, Schaap M, et al. Attention gated networks: learning to leverage salient regions in medical images. Med Image Anal 2019; 53:197–207. [DOI] [PMC free article] [PubMed] [Google Scholar]
- 24.Xu H, Lu C, Berendt R, Jha N, Mandal M. Automatic nuclear segmentation using multiscale radial line scanning with dynamic programming. IEEE Trans Biomed Eng 2017; 64:2475–2485. [DOI] [PubMed] [Google Scholar]
- 25.Banihashemi B, Vlad R, Debeljevic B, Giles A, Kolios MC, Czarnota GJ. Ultrasound imaging of apoptosis in tumor response: novel preclinical monitoring of photodynamic therapy effects. Cancer Res 2008; 68:8590–8596. [DOI] [PubMed] [Google Scholar]
- 26.Khairalseed M, Rijal G, Hoyt K. Spatial comparison between the H-scan format for classification of ultrasound scatterers and histology - preliminary results using an animal model of breast cancer. Proc IEEE Ultrason Symp 2020; 1:1–4. [Google Scholar]
- 27.Khairalseed M, Rijal G, Hoyt K. H-scan format for classification of ultrasound scatterers and matched comparison to histology measurements. Proc IEEE Int Symp Biomed Imaging 2020; 1:1820–1823. [Google Scholar]
- 28.Sadeghi-Naini A, Suraweera H, Tran WT, et al. Breast-lesion characterization using textural features of quantitative ultrasound parametric maps. Sci Rep 2017; 7:13638. [DOI] [PMC free article] [PubMed] [Google Scholar]
- 29.Isakoff SJ. Triple-negative breast cancer: role of specific chemotherapy agents. Cancer J 2010; 16:53–61. [DOI] [PMC free article] [PubMed] [Google Scholar]
- 30.Jochelson MS, Lobbes MBI. Contrast-enhanced mammography: state of the art. Radiology 2021; 299:36–48. [DOI] [PMC free article] [PubMed] [Google Scholar]
- 31.Cheng Q, Huang J, Liang J, et al. The diagnostic performance of DCE-MRI in evaluating the pathological response to neoadjuvant chemotherapy in breast cancer: a meta-analysis. Front Oncol 2020; 10:93. [DOI] [PMC free article] [PubMed] [Google Scholar]
- 32.Avril S, Muzic RF, Plecha D, Traughber BJ, Vinayak S, Avril N. 18F-FDG PET/CT for monitoring of treatment response in breast cancer. J Nucl Med 2016; 57:34 S–9 S. [DOI] [PMC free article] [PubMed] [Google Scholar]
- 33.Gunther JE, Lim EA, Kim HK, et al. Dynamic diffuse optical tomography for monitoring neoadjuvant chemotherapy in patients with breast cancer. Radiology 2018; 287:778–786. [DOI] [PMC free article] [PubMed] [Google Scholar]
- 34.Suo S, Yin Y, Geng X, et al. Diffusion-weighted MRI for predicting pathologic response to neoadjuvant chemotherapy in breast cancer: evaluation with mono-, bi-, and stretched-exponential models. J Transl Med 2021; 19:236. [DOI] [PMC free article] [PubMed] [Google Scholar]
- 35.Santamaría G, Bargalló X, Fernández PL, Farrús B, Caparrós X, Velasco M. Neoadjuvant systemic therapy in breast cancer: association of contrast-enhanced MR imaging findings, diffusion-weighted imaging findings, and tumor subtype with tumor response. Radiology 2017; 283:663–672. [DOI] [PubMed] [Google Scholar]