

Abstract
Background
Postoperative delirium (POD) is a frequent complication in older adults, characterised by disturbances in attention, awareness and cognition, and associated with prolonged hospitalisation, poor functional recovery, cognitive decline, long-term dementia and increased mortality. Early identification of patients at risk of POD can considerably aid prevention.
Methods
We have developed a preoperative POD risk prediction algorithm using data from eight studies identified during a systematic review and providing individual-level data. Ten-fold cross-validation was used for predictor selection and internal validation of the final penalised logistic regression model. The external validation used data from university hospitals in Switzerland and Germany.
Results
Development included 2,250 surgical (excluding cardiac and intracranial) patients 60 years of age or older, 444 of whom developed POD. The final model included age, body mass index, American Society of Anaesthesiologists (ASA) score, history of delirium, cognitive impairment, medications, optional C-reactive protein (CRP), surgical risk and whether the operation is a laparotomy/thoracotomy. At internal validation, the algorithm had an AUC of 0.80 (95% CI: 0.77–0.82) with CRP and 0.79 (95% CI: 0.77–0.82) without CRP. The external validation consisted of 359 patients, 87 of whom developed POD. The external validation yielded an AUC of 0.74 (95% CI: 0.68–0.80).
Conclusions
The algorithm is named PIPRA (Pre-Interventional Preventive Risk Assessment), has European conformity (ce) certification, is available at http://pipra.ch/ and is accepted for clinical use. It can be used to optimise patient care and prioritise interventions for vulnerable patients and presents an effective way to implement POD prevention strategies in clinical practice.
Keywords: postoperative delirium, risk prediction, algorithm, clinical practice, older people
Graphical abstract

Key Points
Postoperative Delirium (POD) is a frequent complication associated with poor outcomes in older patients.
Early identification of patients at risk of delirium can significantly reduce the occurrence of POD.
We developed a robust POD risk prediction tool based on parameters commonly available in clinical practice.
The algorithm resulting from this study has ce certification, is available at http://pipra.ch/ and allowed for clinical use.
Introduction
Postoperative delirium (POD) is a frequent complication in older people, occurring in 10–50% of older patients after major surgical procedures [1]. POD is characterised by fluctuating disturbances in attention, awareness and cognition, and is associated with an increase in postoperative falls, prolonged hospitalisation, poor functional recovery, increased nursing home admissions, hospital readmissions and non-home discharges, cognitive decline, long-term dementia and increased mortality [2, 3]. A recent meta-analysis showed that delirium was significantly associated with long-term cognitive decline in both surgical and non-surgical patients [4], and a retrospective cohort study in a large health network has shown that an episode of delirium in surgical in-patients over the age of 50 is associated with a 13.9-fold increase of risk of a new dementia diagnosis in the year following surgery, after adjusting for baseline characteristics [5].
The early identification of patients at risk for POD is essential, as adequate and well-timed interventions reduce the occurrence of the condition by 43% compared with usual care [6–10]. The 5th International Perioperative Neurotoxicity Working Group recommends that all patients above 65 years of age should be informed about the risk of perioperative neurocognitive disorders and undergo baseline cognitive testing before an operation [11]. However, while several pre- and postoperative risk prediction models using multiple risk factors for POD have been developed in recent years (reviewed in [12]), these models target very specific populations and may not always be used in clinical practice. Therefore, at present, there are no universal, practicable and effective tests to screen patients at risk for POD. The aim of this study was to create PIPRA (Pre-Interventional Preventive Risk Assessment), a robust POD prediction tool, which can be effectively used in clinical practice to identify patients at risk and to start exploring the performance of this model in data external to the development process.
Materials and methods
Data sources
Training data
To develop a POD risk prediction algorithm, we first gathered patient data from previous peer-reviewed studies. A major obstacle to the creation of a suitable algorithm is the underdiagnosis of delirium; previous studies have shown that up to two-thirds of cases are missed by healthcare professionals caring for the patient [13–16], thereby making conventional hospital records unreliable for the creation of a risk prediction model. Hence, a systematic review and meta-analysis of risk factor studies with an outcome of POD (see protocol [17]) was conducted. Included studies assessed risk factors preoperatively and systematically assessed all patients for POD for at least the first 2 days post-surgery using a validated delirium diagnosis tool. We excluded studies that focused on non-postoperative types of delirium and studies of patients who had intracranial and cardiac surgery since these types of surgery can affect the pathophysiology of POD [18, 19]. Included studies are summarised in Table 1, and further details are available in the Supplementary Methods and Supplementary Figure 1.
Table 1.
List of studies from which patients’ data were derived for training the algorithm
| Study design | Inclusion criteria | Exclusion criteria | POD diagnostic tool | % POD | Sample size | Reference |
|---|---|---|---|---|---|---|
| Prospective cohort | Proximal femoral fracture caused by accidental fall | Severe sensory impairment | CAM | 42 | 98 | [24] |
| Prospective cohort | Urological surgery | Severe functional or cognitive impairment, pre-existing apparent dementia and cognitive loss, poor general health (ECOG >2) | DSM-V | 4.7 | 215 | [25] |
| Prospective cohort | >60 years, admitted with an expected duration of hospital stay of >3 days after major general surgery (gastrointestinal, hepatobiliary-pancreatic, colorectal, vascular or trauma surgery) | Cognitive dysfunction or scored less than 24 in MMSE, delirium on admission, with mechanical ventilation under sedation | Nu-DESC and CAM | 20 | 1,114 | [26] |
| Retrospective cohort | Elective colorectal surgery | None | DOSS and DSM-IV | 13 | 251 | [27] |
| Prospective cohort | Major elective colorectal surgery, > 50 years | Cognitive dysfunction and/or documented substance abuse | CAM | 35 | 118 | [28] |
| Prospective cohort | Traumatic hip fracture undergoing surgery | Polytrauma, having a life expectancy of <6 months, not admitted to the trauma wards for postoperative care | CAM | 27.9 | 164 | [29] |
| Before–after (longitudinal) | ≥50 years, admitted for emergency surgical treatment of an isolated primary hip fracture | None | 3D-CAM, version 3 | 33 | 300 | [30] |
| Randomised controlled trial | All patients with hip fracture | High energy trauma (defined as a fall from a higher level than 1 m), moribund at admittance. | CAM | 28 | 335 | [31] |
CAM, Confusion assessment method; ECOG, eastern cooperative oncology group scale; MMSE, mini-mental status examination; nu-DESC, nursing delirium screening scale; DOSS, delirium observational screening scale.
Next, several patient-level exclusion criteria were applied to the eight selected studies to include only data that would allow us to reliably train the algorithm (Figure 1, left). Patients younger than 60 years of age were excluded, as there were too few of them for the algorithm to work reliably in this age group. We also excluded patients for whom the POD outcome was not reported. As the endpoint was de-novo POD, we excluded patients going into surgery with preoperative delirium.
Figure 1.

Exclusion criteria employed in the selection of patient data for training and validating the POD risk prediction algorithm. Numbers represent the number of patients excluded and remaining at each selection step. The algorithm was validated in an external dataset.
External validation data
To externally validate our algorithm, we combined data from two sources: a completed internal quality control study and a randomised controlled trial also designed to collect data for PIPRA external validation. The 1st dataset was prospectively collected at a 70-bed Orthopaedic Surgery and Traumatology Department (Inselspital, University Hospital of Bern, Switzerland) between March 2010 and December 2011. During this quality control study, all patients were systematically assessed for POD by trained nurses using the delirium observational screening scale. The second dataset was collected at the LMU (Munich, Germany; DRKS00026801) from 01 March 2022, where patients were systematically assessed for POD using the validated 4AT tool (or the CAM-ICU for intubated patients). The study was not completed by the time of submission, and all non-cardiac patients enrolled up until 06 September 2022 were analysed in this publication (69 patients). Further details are provided in the Supplementary Methods.
Considered predictors
We considered a wide range of preoperative prognostic factors. In brief, risk factors were included based on published literature or recommendation based on clinical knowledge and their availability in the studies. Further details on predictor selection and data harmonisation are given in the Supplementary Methods.
As the type of surgery is a known risk factor for POD [20], we accounted for this by creating a variable for surgical risk. Two clinicians (NSG, NG) classified surgeries according to the surgical risk for cardiac events as defined by the European Society of Cardiology and the European Society of Anaesthesiology [21]. These categories (low, medium, high risk) identify operations with increased potential for substantial blood loss or other intraoperative and postoperative risks. There were no discrepancies between the assessments of the two clinicians.
POD outcome definition
The outcome of interest is POD after surgery. The Diagnostic and Statistical Manual of Mental Disorders, 5th Edition (DSM-5) defines POD based on the presence of disturbances in attention, cognition, or awareness that develop in-hospital over a short period of time (up to 1 week post-procedure or until discharge) and exhibit a fluctuating course. Various validated methods for diagnosis were used in the underlying studies in both the development and external validation datasets (Table 1).
Missing data handling
Missing data (Table 2) that could not be reconstructed based on other available variables (as described in the Supplementary Methods) were singly imputed by the predictor average for numeric variables and the mode for categorical variables.
Table 2.
Characteristics of the patients whose data were used for training of the algorithm
| Variables | Overall | Delirium | No delirium | P | Missing (%) |
|---|---|---|---|---|---|
| All | 2,250 | 444 | 1,806 | ||
| Male (%) | 1,228 (54.6) | 232 (52.3) | 996 (55.1) | 0.296 | 0 (0.0) |
| Age (%) | <0.001 | 0 (0.0) | |||
| 60–69 | 720 (32.0) | 53 (11.9) | 667 (36.9) | ||
| 70–79 | 920 (40.9) | 167 (37.6) | 753 (41.7) | ||
| 80+ | 610 (27.1) | 224 (50.5) | 386 (21.4) | ||
| History of delirium (%) | 66 (4.9) | 48 (19.8) | 18 (1.6) | <0.001 | 901 (40.0) |
| Cognitive impairment (%) | 176 (11.9) | 89 (26.7) | 87 (7.6) | <0.001 | 775 (34.4) |
| BMI (median [IQR]) | 23.70 [21.29, 26.40] | 23.04 [20.09, 25.54] | 23.88 [21.50, 26.51] | <0.001 | 179 (8.0) |
| ASA (%) | <0.001 | 302 (13.5) | |||
| 1 | 189 (9.7) | 10 (3.0) | 179 (11.1) | ||
| 2 | 1,069 (54.9) | 144 (43.0) | 925 (57.4) | ||
| 3 | 627 (32.2) | 164 (49.0) | 463 (28.7) | ||
| 4 | 61 (3.1) | 16 (4.8) | 45 (2.8) | ||
| 5 | 1 (0.1) | 1 (0.3) | 0 (0.0) | ||
| Preoperative CRP in mg/dl (median [IQR]) | 0.21 [0.10, 1.21] | 1.18 [0.11, 5.89] | 0.20 [0.10, 0.80] | <0.001 | 956 (42.5) |
| Number of medicationsa (median [IQR]) | 4.00 [1.00, 6.00] | 6.00 [3.00, 9.00] | 3.00 [1.00, 6.00] | <0.001 | 770 (34.2) |
| Surgery risk (%) | 0.013 | 16 (0.7) | |||
| 1 | 52 (2.3) | 3 (0.7) | 49 (2.7) | ||
| 2 | 1,885 (84.4) | 370 (83.7) | 1,515 (84.5) | ||
| 3 | 297 (13.3) | 69 (15.6) | 228 (12.7) | ||
| Laparotomy/thoracotomy (%) | 255 (16.1) | 88 (24.7) | 167 (13.6) | <0.001 | 664 (29.5) |
Data shown are n (%—percentage of total) or median (IQR—interquartile range). Statistical significance was tested using a t-test.
Preoperative.
The external validation data from Bern were missing the following variables: American Society of Anaesthesiologists (ASA) scores, C-reactive protein (CRP) value, the surgical risk for cardiac events and information on whether the operation was a laparotomy or thoracotomy. Using age, body mass index (BMI), co-morbidities, and type of surgery (reported in 14 categories instead of exact type of surgery, due to ethical considerations), two clinicians (NGS, NG) reconstructed the ASA scores, the surgical risk scores, and if the surgery was a laparotomy/thoracotomy (Supplementary Table 1). These clinicians were blinded to the delirium outcome. The average of the ASA scores given by the clinicians was used. Notably, there were no laparotomies/thoracotomies or high-risk surgeries.
Statistical analysis methods
Subject characteristics from the development and validation data were summarised, stratified by outcome, by mean (standard deviation) and frequency (percentage), dependent on data type. Differences in clinical parameters between patients with and without POD were explored using an unpaired, two-tailed t-test. Python and R [22] were used for modelling and assessment. Additional figures and tables were produced using GraphPad Prism 9.3.1.
Model development
Logistic regression (penalised), random forest and XGBoost were considered. Numeric variables were standardised based on the development sample mean and standard deviation. The squared and natural log values of numeric variables were also considered to account for non-linear relationships with the outcome risk. No explicit interactions were tested. Backward stepwise selection was performed until a decrease in AUC ≥ 0.005 was observed. The most frequently selected predictors across algorithms within 10-fold cross-validation were selected for use in the final model. The performance was similar across algorithms and logistic regression was deemed the most suitable algorithm considering the amount of data available [23], the final model was built with logistic regression with an L1 penalty (LASSO). The regularisation parameter alpha was set to 1, and the entire development set (n = 2,250) was used for the final fitting. The internal validation included 10-fold cross-validation for the assessment of discrimination (AUC) and calibration (plots of average risk per predicted risk decile).
Risk group stratification
Three risk thresholds were chosen to categorise each patient into one of four groups (low, medium, high and very high risk). The number of groups and the thresholds were chosen by interviewing experienced clinicians and subject-matter experts. For the cut-off between low-risk individuals and all others, high sensitivity was the goal, while for the cut-off between very high-risk individuals and all others, high specificity was the aim. The threshold between intermediate and high risk aimed to be a compromise between sensitivity and specificity. The accuracy of the model (as measured by sensitivity, specificity, predictive values and likelihood ratios) was assessed using the full development set.
Model validation on an external dataset
Initial external validation was performed using data completely independent of the model development. To compute the predicted risk on the new data, the following equation was applied: p = 1/(1 + exp(−lp)), where p is the predicted risk and lp is the linear combination of the individual predictor variables multiplied by the log odds coefficients (including the intercept). AUC and calibration are assessed on the validation data.
User interface
A user interface was created to allow for easy clinical input of the required variables and to provide a meaningful output of the absolute risk in percentage, together with the importance of the variables. The user interface and algorithm were ce-marked for medical use, made available online and named PIPRA.
Results
Data collection
Eight studies, including six cohort studies, one RCT and one large prospective study (including four hip fracture studies, one major surgery study and two elective colorectal studies) [24–31], fulfilled the inclusion criteria and were included in our algorithm development (Table 1). From a total of 2,584 patients across the eight selected studies, 334 patients were excluded (Figure 1), and the training database contained data from 2,250 patients (Table 2).
Clinical parameters of patients
The baseline characteristics of patients whose data were used to train the POD risk assessment algorithm are listed in Table 2. In the training dataset, 444 out of 2,250 patients developed delirium.
The POD prediction algorithm and internal performance
The following clinical parameters differed significantly between patients who developed POD and those who did not from the cohort and were selected for training the POD risk prediction algorithm: age, surgical risk for cardiac events, BMI, ASA status, laparotomy/thoracotomy (yes/no), cognitive impairment (yes/no), number of preoperative medications, history of delirium (yes/no) and CRP. Our clinical experts (NGS, NG) confirmed that all these variables, except CRP, are commonly available for every patient before surgery. Therefore, we developed two models, one with CRP and one without, in order to make CRP optional. The odds ratios estimated for the models with and without CRP are depicted in Supplementary Figure 2. A decrease in BMI and higher age and number of preoperative medications, and the presence of other predictors were associated with an increased risk of POD. Within the software, the user chooses which model to use by indicating whether a CRP value is available, and the corresponding predictive results are provided based on the user-provided data.
The apparent discrimination performance as measured by the AUC was 0.81 (95% CI: 0.79–0.83) for the full model and 0.81 (95% CI: 0.79–0.83) for the simpler model without CRP. At cross-validation, the CRP model had an AUC of 0.80 (95% CI: 0.77–0.82), and the model without CRP had an AUC of 0.79 (95% CI: 0.77–0.82). The internal validation calibration curves show that the models (with and without CRP) are well calibrated (Figure 2C), and most patients are classified as low risk (Figure 2E).
Figure 2.

Performance of the model. (A,B) Classification plots of the models with and without CRP for development (A) and validation (B). (C) Calibration plots of the models with and without CRP using 10-fold cross-validation with the total training dataset. (D) Calibration plot of the models with and without CRP on the external validation dataset. Each datapoint represents 10% of the data presented as mean ± 95% confidence intervals. The diagonal white line represents the ideal calibration line with an intercept of 0 and a regression coefficient of 1. (E, F) Based on the risk scores provided by the algorithm without CRP, the patients were separated into four risk groups, and the proportion of patients in each group are displayed.
Risk group stratification
To understand more about how the tool could be used in clinical practice, we stratified the risk scores into four categories based on the sensitivity and specificity of three thresholds. The 10% threshold exhibited high sensitivity [0.90 (95% CI: 0.87–0.93)], the 35% threshold exhibited high specificity [0.92 (95% CI: 0.91–0.94)] and the 20% threshold was a compromise between the two (68% sensitivity, 77% specificity). Results were similar for the model without CRP. Supplementary Table 2 displays this information as well as predictive values and likelihood ratios (with confidence intervals) for both models. The probability of POD in those above the threshold increases to almost 60% for the 35% cut-off for both models, while the probability of no POD in patients considered POD-negative by PIPRA is always relatively high (between 86 and 95%). The likelihood ratios indicate a modest increase in POD probability for those with positive PIPRA results, and a modest decrease in POD probability for those with negative PIPRA results, compared with the population prevalence. The categories are visualised in the classification plots (Figure 2A and B). We applied the stratification of the model without CRP to the full training dataset (Figure 2E) and found that 42.5% of patients were assigned low, 26.3% medium, 17.3% high and 13.9% very high risk according to the model. Findings were similar when applied to the validation dataset (Figure 2F) and in the model with CRP (42.6% low, 26.0% medium, 17.0% high and 14.4% very high risk). The risk category is displayed alongside the absolute risk in the user interface of the developed web application.
Pilot external validation
The combined external validation set contained 87 POD cases from 359 subjects. Compared with the development dataset (Supplementary Table 3), patients in the external validation dataset had higher BMI and ASA scores and took more medications before surgery. In addition, no high-risk surgeries or laparotomies/thoracotomies surgeries were contained in the external validation set. The proportions of patients with history of delirium and cognitive impairment did not differ between the training and validation datasets. As in the development set, external validation patients developing POD tended to be older and more likely to suffer from cognitive impairments (see Supplementary Table 4). The algorithm was then evaluated using the external dataset. The AUC was 0.74 (95% CI: 0.68–0.80) for both models, with and without CRP. The small decrease compared with internal validation suggests that the algorithm is robust. The calibration curve (Figure 2D) indicates good calibration for patients at higher risk and some underprediction for those with lower predicted scores.
CE certification and availability for clinical use
To enable clinical uptake, a user interface was created (Figure 3), and the interface and algorithm were certified for medical use in Europe. The user interface and clinical evidence were compiled into a technical file in compliance with European regulations. The algorithm was notified as a Class I medical device. The tool is allowed to be used in medical practice by healthcare professionals in the EU, UK, Iceland, Liechtenstein, Norway and Switzerland, and more information is available at http://pipra.ch/.
Figure 3.
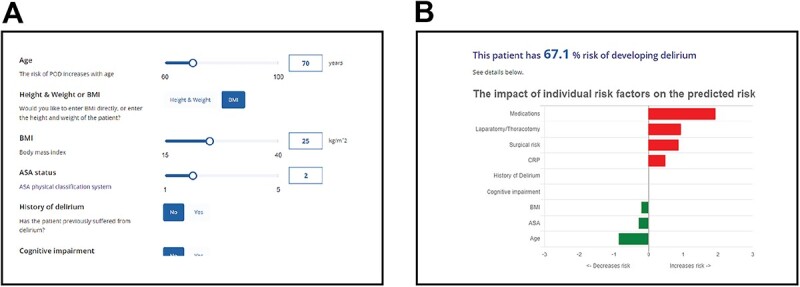
The PIPRA POD risk prediction algorithm clinical interface. Close-up images showing (A) the input screen and (B) the output screen of the web application. The impact of an individual risk factor on the overall risk is shown in comparison with the average (for continuous variables) or the most common (for categorical variables).
Discussion
We have created a clinically approved algorithm that can predict the risk of POD using commonly available clinical parameters. The algorithm presented here is the only clinically approved POD risk prediction method available to date. To the best of our knowledge, there is no other risk prediction method for POD that is based on multicentric, prospectively collected data and applicable to most surgeries. Most clinical delirium scores are for use in the ICU (intensive care unit), for medical delirium or for specific surgeries (e.g. hip surgery). Many are based on retrospective data from conventional hospital records and therefore have an inherent bias from the underdiagnosis of POD (reviewed in [12]). Our model was developed with specialist clinical advice and in accordance with the recommendations of Lindroth et al. [12], and it performs well in comparison with earlier prediction models [32]. Furthermore, all variables in the model have been independently confirmed as risk factors for delirium (reviewed in [33]).
International guidelines clearly state that early detection and prevention of delirium is essential to reduce the burden of this condition on patients, carers and the healthcare system. Theoretically, all older surgical patients would benefit from all POD prevention measures [7, 34–37]. However, because of a lack of resources, it is often not possible to implement such prevention measures [7]. The PIPRA algorithm can stratify patients into four risk groups for developing POD. The rationale for these thresholds is strongly linked to clinical practice and identifying patients with at least a medium risk (with high sensitivity) can be used to identify patients who would benefit from interventions aimed at early detection and prevention of delirium. Patients at high risk of developing POD could be referred to perioperative assessment and advisory services and could be prioritised to receive supplemented care, such as full non-pharmacological multicomponent interventions. Patients at very high risk could also be allocated rarer resources (such as sitters) and referral to Comprehensive Geriatric Assessment services [38].
Limitations
Large, well-curated datasets with valid and systematic assessment of POD are difficult to obtain. In this study, we conducted a systematic review and then tried to obtain individual level data from the study investigators. Although this development is based on eight high-quality studies, there were a large number of possibly eligible studies that did not contribute data (171 of 192). It is unclear to what extent this self-selection at the study level affects the development presented here. Furthermore, while these eight studies contributed more than enough data to precisely estimate the overall POD rate and to ensure only a small difference between apparent and adjusted R^2 performance, there was still a risk of overfitting [39]. To combat overfitting, clinical knowledge was used to decrease the total number of predictors considered and penalised regression was used for fitting; however, overfitting to the development data is still possible. Another limitation of the study is the amount of missing data in the training dataset, sometimes in key predictors such as cognitive impairment. This is a limitation of combining multiple studies, each with a different focus. Attempts were made to retrieve missing data from other related variables, however, missing data remained. A majority of the external validation data presented here were collected 10 years prior to this study, from an Orthopaedic Surgery and Traumatology Department rather than a general non-cardiac/non-intracranial population, and were missing several variables, which needed to be reconstructed from the available data. This validation is to be treated as a proof of principle study to motivate further validation data, rather than a true estimate of clinical performance. We have supplemented the external validation dataset with new data from a recent clinical study and a more general surgical setting; however, sample size calculations based on Pavlou et al. [40] suggest that closer to 500 observations will be needed for precise estimation of discrimination and calibration.
Strengths
The algorithm and software are ce-certified and are classed as a medical device in Europe, and have been designed to bring value to healthcare settings. The model uses clinical variables that are readily available, and it can be immediately used for all surgeries except cardiac and intracranial. The risk categories are relevant to clinical practice and in influencing perioperative models of care in hospitals.
The training data were sourced from eight centres in different countries and healthcare systems. The performance of the model did not erode appreciably between the internal and external validation; the AUC was 0.74 at external validation, with data from two new centres, suggesting that the model will be able to generalise to new but similar patients in different hospitals. This good performance is also on a par with the performance of other recently developed POD models. Menzenbach and colleagues developed a POD prediction tool with monocentric data, which was shown to have a slightly lower discriminatory power (AUC = 0.729) at external validation, albeit on patients from the same centre [41].
Conclusions
The algorithm resulting from this study is available for real-time use in clinical settings and enables clinicians to optimise care for older patients who are at risk of developing POD. We present our PIPRA algorithm as a way to prioritise early interventions for vulnerable patients and, therefore, optimise the implementation of POD prevention strategies.
Supplementary Material
Acknowledgements
We would like to thank Dr Gosia Furmanik from ScienceQuill (https://www.sciencequill.nl/) and Dr Mary-Anne Kedda for editing and reviewing this manuscript for English language. We would like to thank Dr Thomas Saller, Dr Diana Lungeanu, Dr Shingo Hatakeyama, Dr Jeroen van Vugt, Dr Linda Thomson Mangnall, Dr Koen Milisen, Dr Alwin Chuan, Dr Bjørn Erik Neerland, Dr Leiv Otto Watne and Dr Kris Denhaerynck for providing their original study data. We would like to thank Prof. Dr Manfred Berres for assistance with statistical analysis.
Contributor Information
Benjamin T Dodsworth, PIPRA AG, Zurich 8005, Switzerland.
Kelly Reeve, Institute of Data Analysis and Process Design, Zurich University of Applied Sciences, Winterthur 8400, Switzerland.
Lisa Falco, Zühlke Engineering AG, Zürcherstrasse 39J, Schlieren 8952, Switzerland.
Tom Hueting, Evidencio, Irenesingel 19, Haaksbergen 7481 GJ, Netherlands.
Behnam Sadeghirad, Department of Health Research Methods, Evidence, and Impact, McMaster University, Hamilton ON L8S 4L8, Canada; Department of Anesthesia, McMaster University, Hamilton ON L8S 4L8, Canada.
Lawrence Mbuagbaw, Department of Health Research Methods, Evidence, and Impact, McMaster University, Hamilton ON L8S 4L8, Canada; Department of Anesthesia, McMaster University, Hamilton ON L8S 4L8, Canada; Department of Pediatrics, McMaster University, Hamilton, ON L8S 4L8, Canada; Biostatistics Unit, Father Sean O'Sullivan Research Centre, St Joseph's Healthcare, Hamilton, ON L8S 4L8, Canada; Centre for Development of Best Practices in Health (CDBPH), Yaoundé Central Hospital, Yaoundé 12117, Cameroon; Division of Epidemiology and Biostatistics, Department of Global Health, Stellenbosch University, Cape Town 7600, South Africa.
Nicolai Goettel, Department of Anesthesiology, University of Florida College of Medicine, Gainesville FL 32610, USA; Department of Clinical Research, University of Basel, Basel 4031, Switzerland.
Nayeli Schmutz Gelsomino, PIPRA AG, Zurich 8005, Switzerland; Department of Anaesthesia, University Hospital Basel, Spitalstrasse 21, Basel 4031, Switzerland.
Declaration of Conflicts of Interest
NG has received consultancy fees from PIPRA AG (Zurich, Switzerland). BTD and NSG are founders and employees of PIPRA AG. LF was an employee of PIPRA AG (Zurich, Switzerland). BTD, NSG, LF and NG are shareholders of PIPRA AG. The remaining authors have no conflicts of interest to disclose.
Declaration of Sources of Funding
This study was funded by EIT Health. EIT Health is supported by the EIT, a body of the European Union.
Data Availability
Research data are not shared.
References
- 1. Raats JW, Eijsden WA, Crolla RM, Steyerberg EW, Laan L. Risk factors and outcomes for postoperative delirium after major surgery in elderly patients. PloS One 2015; 10: e0136071. 10.1371/journal.pone.0136071. [DOI] [PMC free article] [PubMed] [Google Scholar]
- 2. Bickel H, Gradinger R, Kochs E, Förstl H. High risk of cognitive and functional decline after postoperative delirium. Dement Geriatr Cogn Disord 2008; 26: 26–31 [DOI] [PubMed] [Google Scholar]
- 3. Saczynski JS, Marcantonio ER, Quach Let al. Cognitive trajectories after postoperative delirium. N Engl J Med 2012; 367: 30–9 [DOI] [PMC free article] [PubMed] [Google Scholar]
- 4. Goldberg TE, Chen C, Wang Yet al. Association of delirium with long-term cognitive decline: a meta-analysis. JAMA Neurol 2020; 77: 1373–81 [DOI] [PMC free article] [PubMed] [Google Scholar]
- 5. Mohanty S, Gillio A, Lindroth Het al. Major surgery and long term cognitive outcomes: the effect of postoperative delirium on dementia in the year following discharge. J Surg Res 2021; 270: 327–34 [DOI] [PMC free article] [PubMed] [Google Scholar]
- 6. Burton JK, Craig LE, Yong SQet al. Non-pharmacological interventions for preventing delirium in hospitalised non-ICU patients. Cochrane Database Syst Rev 2021; 7: CD013307. [DOI] [PMC free article] [PubMed] [Google Scholar]
- 7. Hughes CG, Boncyk CS, Culley DJet al. American Society for Enhanced Recovery and Perioperative Quality Initiative Joint Consensus Statement on postoperative delirium prevention. Anesth Analg 2020; 130: 1572–90 [DOI] [PMC free article] [PubMed] [Google Scholar]
- 8. Zhang H, Lu Y, Liu Met al. Strategies for prevention of postoperative delirium: a systematic review and meta-analysis of randomized trials. Crit Care 2013; 17: R47. 10.1186/cc12566. [DOI] [PMC free article] [PubMed] [Google Scholar]
- 9. Oh ES, Needham DM, Nikooie Ret al. Antipsychotics for preventing delirium in hospitalized adults: a systematic review. Ann Intern Med 2019; 171: 474–84 [DOI] [PubMed] [Google Scholar]
- 10. Nikooie R, Neufeld KJ, Oh ESet al. Antipsychotics for treating delirium in hospitalized adults: a systematic review. Ann Intern Med 2019; 171: 485–95 [DOI] [PubMed] [Google Scholar]
- 11. Berger M, Schenning KJ, CHt Bet al. Best practices for postoperative brain health: recommendations from the fifth international perioperative neurotoxicity working group. Anesth Analg 2018; 127: 1406–13 [DOI] [PMC free article] [PubMed] [Google Scholar]
- 12. Lindroth H, Bratzke L, Purvis Set al. Systematic review of prediction models for delirium in the older adult inpatient. BMJ Open 2018; 8: e019223. 10.1136/bmjopen-2017-019223. [DOI] [PMC free article] [PubMed] [Google Scholar]
- 13. Inouye SK, Foreman MD, Mion LC, Katz KH, Cooney LM Jr. Nurses' recognition of delirium and its symptoms: comparison of nurse and researcher ratings. Arch Intern Med 2001; 161: 2467–73 [DOI] [PubMed] [Google Scholar]
- 14. Rockwood K, Cosway S, Stolee Pet al. Increasing the recognition of delirium in elderly patients. J Am Geriatr Soc 1994; 42: 252–6 [DOI] [PubMed] [Google Scholar]
- 15. Gustafson Y, Brännström B, Norberg A, Bucht G, Winblad B. Underdiagnosis and poor documentation of acute confusional states in elderly hip fracture patients. J Am Geriatr Soc 1991; 39: 760–5 [DOI] [PubMed] [Google Scholar]
- 16. Geriatric Medicine Research C . Delirium is prevalent in older hospital inpatients and associated with adverse outcomes: results of a prospective multi-centre study on World Delirium Awareness Day. BMC Med 2019; 17: 229. 10.1186/s12916-019-1458-7. [DOI] [PMC free article] [PubMed] [Google Scholar]
- 17. Buchan TA, Sadeghirad B, Schmutz Net al. Preoperative prognostic factors associated with postoperative delirium in older people undergoing surgery: protocol for a systematic review and individual patient data meta-analysis. Syst Rev 2020; 9: 261. 10.1186/s13643-020-01518-z. [DOI] [PMC free article] [PubMed] [Google Scholar]
- 18. Harten AE, Scheeren TW, Absalom AR. A review of postoperative cognitive dysfunction and neuroinflammation associated with cardiac surgery and anaesthesia. Anaesthesia 2012; 67: 280–93 [DOI] [PubMed] [Google Scholar]
- 19. Viderman D, Brotfain E, Bilotta F, Zhumadilov A. Risk factors and mechanisms of postoperative delirium after intracranial neurosurgical procedures. Asian J Anesthesiol 2020; 58: 5–13 [DOI] [PubMed] [Google Scholar]
- 20. Schubert M, Schurch R, Boettger Set al. A hospital-wide evaluation of delirium prevalence and outcomes in acute care patients—a cohort study. BMC Health Serv Res 2018; 18: 550. 10.1186/s12913-018-3345-x. [DOI] [PMC free article] [PubMed] [Google Scholar]
- 21. Kristensen SD, Knuuti J, Saraste Aet al. 2014 ESC/ESA guidelines on non-cardiac surgery: cardiovascular assessment and management: The Joint Task Force on non-cardiac surgery: cardiovascular assessment and management of the European Society of Cardiology (ESC) and the European Society of Anaesthesiology (ESA). Eur Heart J 2014; 35: 2383–431 [DOI] [PubMed] [Google Scholar]
- 22. R Core Team . R: A Language and Environment for Statistical Computing. Vienna, Austria: R Foundation for Statistical Computing, 2021. https://R-project.org/. [Google Scholar]
- 23. Riley RD, Ensor J, Snell KIEet al. Calculating the sample size required for developing a clinical prediction model. BMJ 2020; 368: m441. 10.1136/bmj.m441. [DOI] [PubMed] [Google Scholar]
- 24. Vasilian CC, Tamasan SC, Lungeanu D, Poenaru DV. Clock-drawing test as a bedside assessment of postoperative delirium risk in elderly patients with accidental hip fracture. World J Surg 2018; 42: 1340–5 [DOI] [PubMed] [Google Scholar]
- 25. Sato T, Hatakeyama S, Okamoto Tet al. Slow gait speed and rapid renal function decline are risk factors for postoperative delirium after urological surgery. PloS One 2016; 11: e0153961. 10.1371/journal.pone.0153961. [DOI] [PMC free article] [PubMed] [Google Scholar]
- 26. Kim MY, Park UJ, Kim HT, Cho WH. DELirium prediction based on hospital information (Delphi) in general surgery patients. Medicine (Baltimore) 2016; 95: e3072. 10.1097/MD.0000000000003072. [DOI] [PMC free article] [PubMed] [Google Scholar]
- 27. Mosk CA, Vugt JLA, Jonge Het al. Low skeletal muscle mass as a risk factor for postoperative delirium in elderly patients undergoing colorectal cancer surgery. Clin Interv Ageing 2018; 13: 2097–106 [DOI] [PMC free article] [PubMed] [Google Scholar]
- 28. Mangnall LT, Gallagher R, Stein-Parbury J. Postoperative delirium after colorectal surgery in older patients. Am J Crit Care 2011; 20: 45–55 [DOI] [PubMed] [Google Scholar]
- 29. Van Grootven B, Detroyer E, Devriendt Eet al. Is preoperative state anxiety a risk factor for postoperative delirium among elderly hip fracture patients? Geriatr Gerontol Int 2016; 16: 948–55. [DOI] [PubMed] [Google Scholar]
- 30. Chuan A, Zhao L, Tillekeratne Net al. The effect of a multidisciplinary care bundle on the incidence of delirium after hip fracture surgery: a quality improvement study. Anaesthesia 2020; 75: 63–71 [DOI] [PubMed] [Google Scholar]
- 31. Watne LO, Torbergsen AC, Conroy Set al. The effect of a pre- and postoperative orthogeriatric service on cognitive function in patients with hip fracture: randomized controlled trial (Oslo Orthogeriatric Trial). BMC Med 2014; 12: 63. 10.1186/1741-7015-12-63. [DOI] [PMC free article] [PubMed] [Google Scholar]
- 32. Wong CK, Munster BC, Hatseras Aet al. Head-to-head comparison of 14 prediction models for postoperative delirium in elderly non-ICU patients: an external validation study. BMJ Open 2022; 12: e054023. 10.1136/bmjopen-2021-054023. [DOI] [PMC free article] [PubMed] [Google Scholar]
- 33. Bramley P, McArthur K, Blayney A, McCullagh I. Risk factors for postoperative delirium: an umbrella review of systematic reviews. Int J Surg 2021; 93: 106063. 10.1016/j.ijsu.2021.106063. [DOI] [PubMed] [Google Scholar]
- 34. Aldecoa C, Bettelli G, Bilotta Fet al. European Society of Anaesthesiology evidence-based and consensus-based guideline on postoperative delirium. Eur J Anaesthesiol 2017; 34: 192–214 [DOI] [PubMed] [Google Scholar]
- 35. Australian Commission on Safety and Quality in Health Care . Delirium Clinical Care Standard. Sydney: ACSQHC, 2021. [Google Scholar]
- 36. National Institute for Health and Care Excellence . Delirium: Prevention, Diagnosis and Management. London: National Institute for Health and Care Excellence (NICE), 2010.
- 37. Devlin JW, Skrobik Y, Gelinas Cet al. Clinical practice guidelines for the prevention and management of pain, agitation/sedation, delirium, immobility, and sleep disruption in adult patients in the ICU. Crit Care Med 2018; 46: e825–73 [DOI] [PubMed] [Google Scholar]
- 38. Dhesi J, Moonesinghe SR, Partridge J. Comprehensive geriatric assessment in the perioperative setting; where next? Age Ageing 2019; 48: 624–7 [DOI] [PubMed] [Google Scholar]
- 39. Riley RD, Snell KI, Ensor Jet al. Minimum sample size for developing a multivariable prediction model: PART II—binary and time-to-event outcomes. Stat Med 2019; 38: 1276–96 [DOI] [PMC free article] [PubMed] [Google Scholar]
- 40. Pavlou M, Qu C, Omar RZet al. Estimation of required sample size for external validation of risk models for binary outcomes. Stat Methods Med Res 2021; 30: 2187–206 [DOI] [PMC free article] [PubMed] [Google Scholar]
- 41. Menzenbach J, Kirfel A, Guttenthaler Vet al. Pre-operative prediction of postoperative DElirium by appropriate SCreening (PROPDESC) development and validation of a pragmatic POD risk screening score based on routine preoperative data. J Clin Anesth 2022; 78: 110684. 10.1016/j.jclinane.2022.110684. [DOI] [PubMed] [Google Scholar]
Associated Data
This section collects any data citations, data availability statements, or supplementary materials included in this article.
Supplementary Materials
Data Availability Statement
Research data are not shared.