

Abstract
The emergence of epidemics has seriously threatened the running of human society, such as COVID-19. During the epidemics, some external factors usually have a non-negligible impact on the epidemic transmission. Therefore, we not only consider the interaction between epidemic-related information and infectious diseases, but also the influence of policy interventions on epidemic propagation in this work. We establish a novel model that includes two dynamic processes to explore the co-evolutionary spread of epidemic-related information and infectious diseases under policy intervention, one of which depicts information diffusion about infectious diseases and the other denotes the epidemic transmission. A weighted network is introduced into the epidemic spreading to characterize the impact of policy interventions on social distance between individuals. The dynamic equations are established to describe the proposed model according to the micro-Markov chain (MMC) method. The derived analytical expressions of the epidemic threshold indicate that the network topology, epidemic-related information diffusion and policy intervention all have a direct impact on the epidemic threshold. We use numerical simulation experiments to verify the dynamic equations and epidemic threshold, and further discuss the co-evolution dynamics of the proposed model. Our results show that strengthening epidemic-related information diffusion and policy intervention can significantly inhibit the outbreak and spread of infectious diseases. The current work can provide some valuable references for public health departments to formulate the epidemic prevention and control measures.
Keywords: Multiplex networks, Policy intervention, Information diffusion, Epidemic spreading
Introduction
The outbreak and spread of epidemics (e.g., smallpox [1], measles [2], Ebola [3], COVID-19 [4], etc.) may cause serious consequences, such as personal or national economic burden, social panic, and even directly threatening human life and health. Specifically, no less than 205 million people have been infected and 4.3 million people have died worldwide due to COVID-19 as of August 13, 2021 [5], which has brought huge disasters to human society. Although vaccination is the most effective measure to prevent epidemics [6, 7], the development of vaccines for some emerging infectious diseases usually takes a relatively long time. Even after the vaccines are created, their function on epidemics may not be completely effective. Therefore, it is also worth taking measures to suppress the infectious disease propagation through non-pharmaceutical interventions [8, 9], such as strengthening information propaganda to raise people’s vigilance against infectious diseases and adopting relevant policies to increase social distance between people.
With the rapid progress of communication technology, information diffusion has been greatly improved. The information related to infectious diseases can be spread quickly in a short period of time when epidemics occur. After learning the information, people taking preventive measures spontaneously will have some influence on the propagation dynamics of epidemics [10–14]. Over the recent years, many scholars have been more interested in the relationship between information and infectious diseases, and have achieved some meaningful consequences [15–23]. As an example, Funk et al. analysed the influence of awareness dissemination on disease transmission through single-layered network in 2009. They found that awareness can reduce the incidence of epidemics, and even prevent the outbreak of diseases under certain conditions [24]. Subsequently, Granell et al. considered the mutual impact of information and infectious diseases transmission based on multiplex networks in the absence and presence of mass media [25, 26]. Kabir and Tanimoto constructed an SIR-UA model to explore the impact of information dissemination on disease spreading under various network structures [27]. Wang et al. further discussed the influence of two opposing information in social networks on the infectious diseases spreading with and without mass media. The experimental results indicate that these two types of information have opposite effects on epidemic prevention and control [28, 29]. In addition, Zhan et al. revealed two relatively common diseases spreading under the influence of information. They found that the spread of disease promotes the diffusion of information, which in turn inhibits the disease propagation [30]. The above studies indicate that the epidemic propagation and epidemic-related information diffusion are inextricably linked.
Apart from information dissemination, policy interventions also function a pivotal role in preventing disease transmission, such as closing schools or public places, isolating patients and forcing to wear masks [31–34]. One of the important ways of policy intervention is to increase the social distance between people during the epidemics. Increasing social distance can reduce the possibility of healthy individuals being infected to a certain extent. For the unfinished COVID-19, increasing social distance has always been one of the non-pharmaceutical intervention methods vigorously advocated by some countries in the world, such as China. Researchers have also conducted some studies on the link between social distancing and epidemic propagation [35–38]. Chu et al. found that maintaining at least one meter of social distance under the influence of various interventions was beneficial to reducing virus transmission [39]. Ahmed et al. explored that maintaining social distancing can delay and reduce the peak of flu patients in the workplace [40]. Mishra et al. proposed that social distancing is very effective in preventing COVID-19 in the absence of vaccines and adequate treatment [41]. Huang et al. studied the influence of two types of social distance on epidemic transmission, and they found that these two types of social distance can effectively suppress the epidemic propagation [42]. The above-mentioned researches point out that increasing social distance is an effective non-drug intervention to prevent infectious diseases.
Based on the afore mentioned analysis, the information diffusion and policy intervention both have a significant impact on the epidemic spreading. However, previous studies have not considered the effect of information dissemination and policy intervention on epidemic propagation at the same time. In reality, for some highly contagious infectious diseases, not only a large amount of relevant information is disseminated in social networks, but also relevant departments and agencies usually adopt some policies to interfere with some people’s behaviors. A typical example is the outbreak of COVID-19. In addition to making people know as much information as possible about the epidemic through social media, many countries also adopt policies to increase the social distance between people to reduce the probability of infection. Thereby, it is worthwhile to study the relationship among information dissemination, disease propagation and policy intervention. We present a two-layered propagation model, in which the upper layer depicts disease-related information dissemination and the lower one describes the spread of epidemics. A special node directly connected to all nodes in the lower layer is used to represent the policy node, which will inform all nodes in the lower layer, and the policy intervention is achieved by increasing the social distance between individuals. Moreover, the influence of the whole infected size on the diffusion of information among the population is also considered in the proposed model.
Compared with previous research work, the impact of both information diffusion and policy intervention on epidemic spreading is considered in the proposed model. The main innovations of the current work can be described as below:
A new model of information and infectious diseases co-evolution propagation under policy intervention is established on the basis of the multiplex network. The social distance between individuals caused by policy interventions is characterized by using the weights of the edges in the lower network. The influence of the epidemic size on the dissemination of relevant information is introduced in the model.
The MMC method is further applied to analyze the spread of infectious diseases on weighted networks, and the dynamic equations of co-evolutionary model are obtained according to the MMC method. The corresponding epidemic threshold is further derived to characterize the critical properties.
A large number of simulation experiments are carried out to depict the effect of information dissemination and policy intervention on the epidemic size and threshold.
The remaining section of this paper is arranged as below. Firstly, Sect. 2 depicts the co-evolutionary spreading model in detail. Next, the dynamic equations of the model are given and the epidemic threshold of infectious disease is obtained through theoretical analysis in Sect. 3. After that, some experimental results are used to discuss the proposed model in Sect. 4. Finally, a brief summary of this work is given in Sect. 5.
Model description
The simplified diagram of the co-evolution propagation model is illustrated in Fig. 1. Since the transmission paths of information and diseases may have certain differences, a two-layered network is used to characterize the information dissemination and disease propagation, respectively. The upper layer is virtual network (e.g., Twitter, Weibo or Facebook) describing the diffusion of epidemic-related information, and the lower one is physical contact networks (e.g., family, friends or colleagues) depicting the spread of epidemics among individuals. In particular, the lower layer is a weighted network. In Fig. 1, the different thicknesses of the edges in the lower layer indicate that the weights of the edges are different. The nodes on each layer refer to individuals in reality, and the edges between them describe the relationships between individuals in online virtual space and the real world, respectively. We assume that all individuals in the proposed model are involved in two processes: information dissemination and disease propagation. Therefore, each node on the upper and lower layers corresponds to each other, which is marked with the dashed line in Fig. 1. The two corresponding nodes both represent the same individual participating in the two processes. The purple node under the lower layer is used to portray policy intervention on the epidemic propagation. This special node is linked to each node in lower layer, which means that the implementation of the policy has an impact on all individuals. We will further illustrate details on information diffusion, epidemic spreading and policy intervention below.
Fig. 1.

Schematic diagram of the co-evolutionary propagation model of information and disease based on policy intervention. The upper layer denotes epidemic-related information dissemination. The lower one depicts disease transmission. The purple dot under the lower layer refers to the policy issuing node
Information diffusion
For the diffusion of disease-related information, we use the unaware-aware-unaware (UAU) model, where the node state is either A or U. Individuals in states U are not aware of information related to the epidemic, therefore, they will not spontaneously take epidemic prevention measures. Individuals in states A are aware of epidemic-related information and will take certain safeguard procedures against the epidemic. Individuals in state A will spread information to neighbors in state U with the probability of . At the same time, their forgetting rate of information is . Moreover, epidemic spreading at the lower layer also promotes the diffusion of information at the upper layer. On the one hand, the infected individuals actively inform relevant information to their neighbors. In other words, the infected individuals keep their status as A in the upper layer. On the other hand, the actual information diffusion rate will also be affected by the size of infected individuals. The more individuals infected in the lower layer, the greater the actual information diffusion rate in the upper layer. Specifically, the actual spreading probability of information affected by the epidemic is
| 1 |
where , and is the probability that individual j is in the state I at time step t. Moreover, represents the strengthening factor of the disease to the information diffusion. The principle of Eq. (1) is that the probability of individual spreading information about infectious diseases may be affected by the epidemic size. In Eq. (1), represents the information dissemination probability when there is no outbreak of the epidemic. represents the additional information dissemination probability due to the outbreak of the epidemic.
Epidemic propagation
In this model, we mainly focus on infectious diseases in which infected individuals have a period of immunity after recovery. Therefore, the transmission characteristics of infectious diseases are depicted through the susceptible-infected-recovered-susceptible (SIRS) model. The state of each node in the lower layer is one of S, I or R. Here, the susceptible (S) nodes is not immune to infectious diseases, and he can be infected with the probability once he is connected to one of infected (I) nodes. Meanwhile, the infected individuals recover with probability , and their states change to R after recovery. Furthermore, the recovered (R) individuals only have short-term immunity, and they may switch to the S state with probability . Introducing the influence of information diffusion, the probability of susceptible individuals being infected can be further divided into and . and represent the disease infection rate when the individual status is U and A, respectively, where and . The parameter indicates the effectiveness of preventive measures. The larger the value of , the more effective the protective measures taken by the individuals. In addition, policy intervention also has a significant impact on epidemic spreading, which is explained in detail below.
Policy intervention
The policy intervention method considered in this model is to increase the social distance between individuals. We employ p to indicate the level of policy intervention, and the smaller p denotes the greater policy intervention intensity. The social distance between individuals is described by the weight of the edge in the lower layer. For the nodes i and j with an edge, represents the weight between them. The smaller the , the greater the social distance between individuals i and j. In reality, it is difficult for everyone to maintain the same social distancing from the intervention of relevant policy. Therefore, we consider that the weights of all edges in the lower layer are uniformly distributed in this model, that is, . Furthermore, is the weight corresponding to the minimum social distance that people may maintain when the policy intervention level is p, and it can be written as
| 2 |
The principle of Eq. (2) is to map the policy intervention level p into the weight of the edge used to represent the minimum social distance. Equation (2) is constructed for two considerations. On the one hand, the value of can be in the range of [0, 1). On the other hand, the value of can decrease nonlinearly as p decreases. It is worth noting that the weights of the edges in the lower layer are all 1 when there is no policy intervention. Under the influence of policy intervention, the probability that the susceptible individual i who is U (A) in the upper layer is infected by his infected neighbor j is .
Considering information diffusion, epidemic spreading and policy intervention together, the states of individuals in the system can be divided into 5 types: unaware and susceptible (US), aware and susceptible (AS), aware and infected (AI), unaware and recovered (UR), aware and recovered (AR). It is worth noting that, the states UI is ignored because infected individual can immediately detect the presence of the infectious disease. The mutual conversion between each state can be depicted by Fig. 2.
Fig. 2.
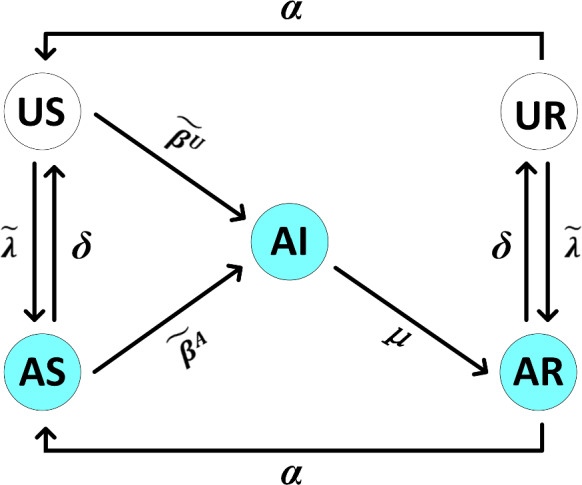
Schematic diagram of the conversion between all 5 states
Theoretical analysis
In this section, we obtain the dynamic equation of the co-evolutionary spreading model of information and disease under policy intervention by using the MMC method and analyze its epidemic threshold. Let and describe the adjacency matrix of the upper and lower layers respectively, where N is the node size of each layer. The probability of individual i being in each state at time t can be defined as , , , , , respectively. Suppose the probability that the individual i in state US and UR does not know the epidemic-related information at time t is . For the disease spreading, the probability that an individual i with the status US (AS) will not be infected at time step t is set to (). Their specific manifestations are recorded as
| 3 |
| 4 |
| 5 |
where .
Based on the above definitions, we use the probability transition tree to intuitively describe the possible transitions of each state and the corresponding probability in Fig. 3. Five probability transition trees respectively represent the possible state transitions of individuals in each state. Taking the probability transition tree in the upper left of Fig. 3 as an example, it indicates that the individuals in states US may change their states to US, AI and AS at the next time step.
Fig. 3.
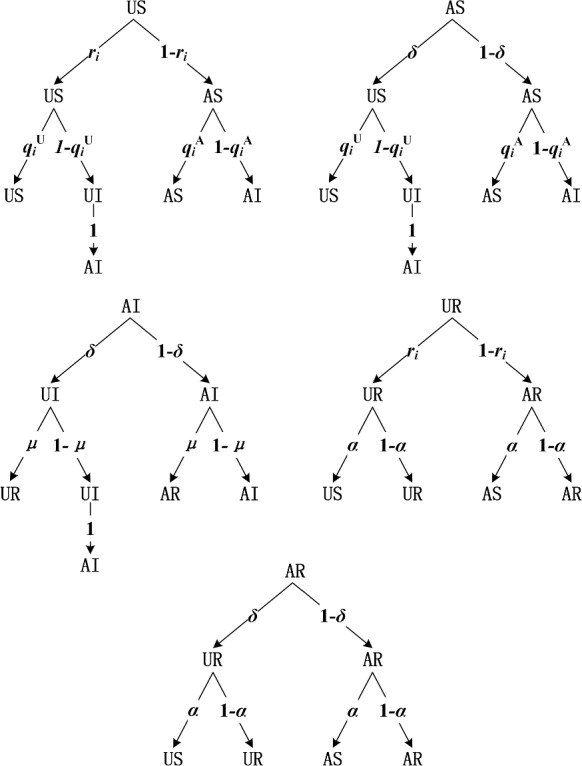
Transition probability trees of US, AS, AI, UR, AR in co-evolution propagation model
Combining with MMC method [43], we can get the evolution equations of the proposed model based on the five transition probability trees as follows
| 6 |
| 7 |
| 8 |
| 9 |
| 10 |
where .
In order to compute the critical threshold , we require a stable solution to Eqs. (6)-(10). Therefore, for Eqs. (6)-(10), we can have
| 11 |
| 12 |
| 13 |
| 14 |
| 15 |
According to the stability of the spread of infectious diseases, if , the epidemic in the system gradually disappears; otherwise, the epidemic in the system always exists. In particular, because is almost 0 at steady state when is infinitely close to , we can set . Hence, Eqs. (4) and (5) can be approximately transformed into
| 16 |
| 17 |
Substituting Eqs. (11)-(17) into Eqs. (6)-(10), we can get
| 18 |
| 19 |
| 20 |
| 21 |
| 22 |
Since when , we can get and . Therefore, Eqs. (18)-(22) can be simplified to
| 23 |
| 24 |
| 25 |
Inserting Eqs. (23) and (24) into Eq. (25), Eq. (25) can be further simplified as
| 26 |
Combining the previous definition, and , . Then, Eq. (26) can be written as
| 27 |
where is 1 () or 0 ().
Let M be a matrix, where each element is , Eq. (27) can be further transformed into
| 28 |
where . The non-zero solution of Eq. (28) is the eigenvector of the matrix M belonging to the eigenvalue . Let the maximum eigenvalue of matrix M be , then the epidemic threshold is
| 29 |
According to Eqs. (27)–(29), we can find that critical threshold of the model is directly connected with disease-related information dissemination, effectiveness of the preventive measures and network structure of the lower layer. Moreover, the policy intervention can also indirectly affect the epidemic threshold through its influence on the weights of edges in the lower network. In general, both information diffusion and policy intervention have a significant effect on critical threshold.
Numerical simulations
In the following, we verify the above-mentioned theoretical results and discuss some interesting propagation phenomena through a large number of MMC and Monte Carlo (MC) simulations. In the experiments, we use two types of networks to construct the two-layer network model: scale-free network and random network, which are generated by Barabási-Albert (BA) [44] and Erdös-Rényi (ER) [45] model, respectively. They are hereinafter referred to as BA network and ER network. The size and average degree of the network are both and . For the lower layer, we generate a set of weights that satisfy and randomly assign them to each edge in the lower network. Let , , , , and denote the individual densities of states A, I, US, UR, and AR, respectively. At the initial moment, we usually set , , and , respectively.
Verification the accuracy of the MMC method
Here, based on micro-Markov chain method and Monte Carlo simulations, we first discuss the experimental results under the same parameter conditions. As shown in Fig. 4, we use MMC method and MC simulation to obtain the steady state values of , and on two different networks topologies. The calculation methods of , and in the MMC method are , and , respectively. But in MC simulation, , and are calculated as , and , respectively. The results of MC simulation are averaged over 20 independent runs. In Fig. 4, the red symbols describe , the green symbols represent , and the blue symbols characterize . At the same time, the hollow symbols denote the result of MMC calculation, and the solid symbols show the result of MC simulation. It can be seen from Fig. 4 that the results of MMC and MC are in a relatively high degree of agreement no matter in the BA network or the ER network. In order to compare the similarity of two methods more accurately, we give the average relative errors of , and on two different networks from Tab. 1. It can be observed from Table 1 that Eqs. (6)–(10) obtained by using the MMC method have good performance in describing the coupling dynamics of information and disease under policy intervention in multiplex networks. Therefore, we will mainly provide the results obtained by the MMC method in what follows.
Fig. 4.

The densities of A, I and R are obtained as changes of on different network topologies by MMC method and MC simulation. The two layers of networks are both BA networks in panel (a). In panel (b), the two-layered networks are set to be BA (upper) and ER (lower) ones, respectively. The parameters: , , , , , and
Table 1.
The average relative errors of , and obtained between the MMC and MC methods in Fig. 4
Effect of network topologies on epidemic spreading
Then, we depict the effect of different network topologies on epidemic transmission. In Fig. 5, the red symbols denote the result of both the upper and lower layers being the BA network, while the blue ones represent the result of the upper layer being the BA network and the lower layer being the ER network. Meanwhile, panel (a) depicts the result of taking different values at when the system is stable, and panel (b) describes the curve of the value of changing with . Figure 5 shows that the outbreak threshold in the BA network is lower than that in the ER one. In other words, the epidemic broke out on the BA network earlier than the ER one. Subsequently, once an epidemic breaks out, the values of and will increase with in these two networks. However, in the early stage of the disease outbreak, the increase rate of and in the ER network will be faster than in the BA network. When , the values of and in the system tend to be equal regardless of whether the lower layer is BA or ER network. When , the values of and in the system where the lower layer is ER gradually exceed those values in the BA network. The main reason is determined by the characteristics of these two types of networks. Among them, there are hub nodes in the BA network, which makes the system more prone to outbreaks. Nevertheless, the degree distribution of nodes in ER network obeys a uniform Poisson distribution, which is easier to spread when the disease breaks out in the system. From this we can conclude that the difference in network topology directly affects the outbreak threshold and scale of the disease.
Fig. 5.

Effect of different network topologies and on and . Panel (a): The curve of changing with . Panel (b): The curve of changing with . Here, , , , , , and
Influence of information and policy intervention on epidemic spreading
After that, we investigate the influence of multiple parameters on disease size. As shown in Figs. 6, 7, and 8, we discuss the impact of the three main parameters: (the strengthening factor of the disease to the information diffusion), (the effectiveness of preventive measures) and p (the level of policy intervention) in the model on and at the stable state. First, we discuss the influence of on and in Fig. 6. The red lines denote the epidemic outbreak threshold calculated by Eq. (29) when takes different values in Fig. 6b, d. We find that the outbreak threshold of epidemics in the system does not change with the increase of . The results show that has no influence on critical threshold. Looking at Fig. 6, it will be found that when the epidemic does not break out, that is, , the change of will not affect the values of and . This also indicates that the absence of an epidemic in the lower layer does not affect the diffusion of epidemic-related information in the upper layer. It can be observed from Fig. 6a, c that when , the value of will increase with the increase of . The reason is that as the value of increases, epidemic outbreaks in the lower layer will promote the information dissemination in the upper layer. In addition, when , will decrease appropriately as increases in Fig. 6b, d. This is because aware individuals in the upper layer take certain precautions to avoid potential infection. As the proportion of aware individuals increases, this will in turn inhibit the spread of epidemics. The results show that when an epidemic spreads in the system, making more people aware of the existence of an epidemic will help reduce the epidemic spreading. But it is not enough to control the epidemic propagation simply by letting more people learn about epidemics.
Fig. 6.
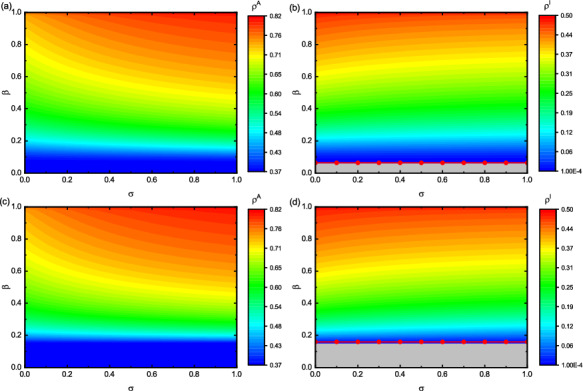
Impact of and on and in different network topologies. The two layers are both BA networks in panel (a) and (b). The two-layered networks are set to be BA (upper) and ER (lower) ones in panel (c) and (d), respectively. Panel (a) and (c) denote the values of with respect to , and panel (b) and (d) present with respect to . The parameters: , , , , and . The gray area represents
Fig. 7.
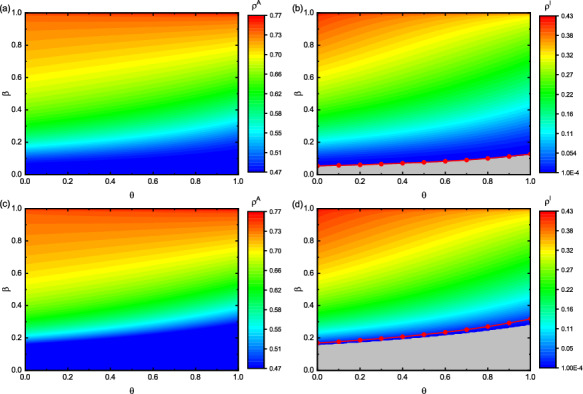
Effect of and on and in different network topologies. The two layers are both BA networks in panel (a) and (b). The two-layered networks are set to be BA (upper) and ER (lower) ones in panel (c) and (d), respectively. Panel (a) and (c) denote the values of with respect to , and panel (b) and (d) present with respect to . Here, , , , , and . The gray area represents
Fig. 8.
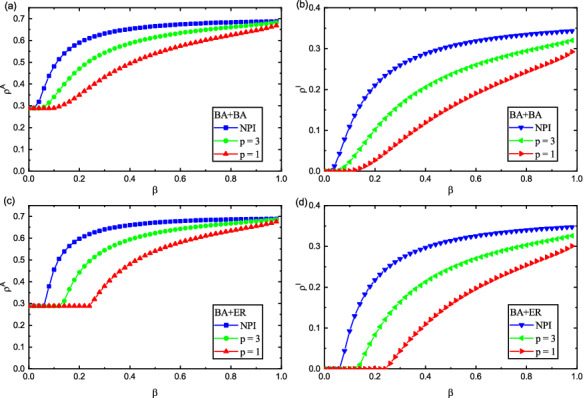
Impact of p and on and in different network topologies. The two layers are both BA networks in panel (a) and (b). The two-layered networks are set to be BA (upper) and ER (lower) ones in panel (c) and (d), respectively. Panel (a) and (c) denote the values of with respect to , and panel (b) and (d) present with respect to . Here, , , , , and . NPI means no policy intervention
We scrutinize the influence of on and in Fig. 7. The red lines in Fig. 7b, d stand for the epidemic outbreak threshold calculated by Eq. (29) when takes different values. It can be shown from Fig. 7 that the epidemic threshold will change with the increase of , and the change is more obvious in the ER network. When takes a fixed value, the values of and decrease as increases, as shown in Fig. 7. The reason for this is that the larger the value of , the more effective the preventive measures, which makes the proportion of infected individuals gradually decrease. As the epidemic size in the system shrinks, it will slow down the diffusion of epidemic-related information, and thus the aware individuals size in the system will decrease accordingly. Specifically, we analyze this phenomenon through a set of data. When , we observe the cases of , 0.5 and 1 in Fig. 7b, d. The values of in Fig. 7b is 0.1826, 0.1212, and 0.0502, respectively. Likewise, is 0.1789, 0.0988, and 0.0102 in Fig. 7d, respectively. These values further illustrate that the effectiveness of preventive measures taken by individuals is very important. Therefore, when the epidemic is spreading, improving the effectiveness of preventive measures taken by individuals, such as vaccination, wearing masks, going out less and washing hands frequently, can effectively suppress the epidemic transmission.
Figure 8 further demonstrates the impact of p on and in, where red, green and blue symbols provide the results for , , and NPI (no policy intervention), respectively. So as to compare the impact of policy intervention on the epidemic transmission, we choose NPI to mean that the impact of policy intervention is not considered, that is, the lower layer is the standard unweighted SIRS model. We can implement this by assuming the weight of edges to be 1.0. From Fig. 8, it can be shown that epidemic outbreak threshold is different for different values of p. Comparing and in Fig. 8, it is found that when , the threshold is smaller and the epidemic is more prone to outbreaks. Once a disease breaks out, it will spread rapidly in the system. At the same time, epidemic-related information diffuses rapidly across the network. In addition, we also find that when the disease broke out, the size of aware and infected individuals is larger at than at in the system. The results show that the greater the value of p, the smaller the intensity of policy intervention, the faster the epidemic-related information dissemination and epidemic propagation, and the higher the value of and . This phenomenon can be understand as follows: the smaller the intensity of policy intervention, the shorter the social distance between individuals, which increases the risk of being infected, and then results in a larger size of infected individuals in the system. As the larger infected size in the lower layer, it promotes the information dissemination in the upper layer, and ultimately leads to the larger the aware individuals size in the system. In addition, We observe that infectious diseases are more likely to break out without policy intervention (NPI) in Fig. 8. Comparing the situation at the initial stage of the outbreak of the respective epidemics, the epidemic-related information diffusion and the epidemic spreading without considering policy interventions is faster than that considering policy interventions. Under the same parameter conditions, when policy intervention is not considered, the values of and are the largest, which means that under the same conditions, policy intervention has an inhibitory effect on the spread of epidemics. Therefore, we conclude that when the disease extensively spreads, it is significant to control the epidemic spreading through policy intervention.
Discussion on epidemic threshold
Finally, we deeply analyze the epidemic threshold derived in Eq. (29). Figures 9 and 10 discuss the effect of , p, and on the epidemic threshold, respectively. Observing Fig. 9a, c, we find that when p is a constant, increases with the increase of , and the change is more obvious when , which shows that improving the effectiveness of preventive measures is conducive to suppressing the outbreak of epidemics. Moreover, the stronger the policy intervention, the more obvious the restraining effect. Looking at Fig. 9b, d, decreases with p when is fixed, and the change of is more obvious when . The results indicate that increasing the intensity of policy intervention can raise the outbreak threshold, which is more obvious when the preventive measures taken by individuals are more effective. From these phenomena, we find that when an epidemic is spreading in the network, improving the effectiveness of individual preventive measures and strengthening policy interventions are conducive to curbing the spread of the epidemic. In order to achieve a better control effect, stressing policy interventions while encouraging individuals to take more effective preventive measures is more beneficial to restraining the epidemic spreading in the system.
Fig. 9.

Effect of p and on in different network topologies. The two layers are both BA networks in panel (a) and (b). The two-layered networks are set to be BA (upper) and ER (lower) ones in panel (c) and (d), respectively. Panel (a) and (c) denote the values of with respect to . Panel (b) and (d) present with respect to p. Here, , , , and . NPI means no policy intervention
Fig. 10.

Influence of p and on in different network topologies. The two layers are both BA networks in panel (a). The two-layered networks are set to be BA (upper) and ER (lower) ones in panel (b), respectively. Here, , , , and . NPI means no policy intervention
Figure 10 explores the changes of with when p takes different values. We find that when policy intervention is not considered (NPI), the change of with is the smallest. When p is smaller, that is, the higher the intensity of policy intervention, the more obvious the change of with . When p is a constant value, increases with the increase of . The results demonstrate that increasing the information dissemination is beneficial to suppressing the outbreak of epidemic, but the effect is not obvious when only changing this factor. Increasing the diffusion of epidemic-related information while strengthening policy interventions is more conducive to suppressing large-scale outbreaks of epidemics.
Conclusion
In summary, this paper investigates the co-evolutionary propagation of information and disease based on policy intervention in a novel two-layer network, where the upper and lower layers depict epidemic-related information dissemination and epidemic transmission, respectively. What’s more, the lower layer is a weighted network, which is due to the direct effect of policy interventions on disease propagation. In addition, the propagation dynamics of the two layers will affect each other. On the one hand, aware individuals will take preventive measures to avoid contracting diseases; on the other hand, infected individuals will spontaneously realize the epidemic-related information. At the same time, the size of the epidemic in the lower layer will also promote the information dissemination in the upper layer. Then, we get the dynamic equation by establishing the probability transition tree between each state. After that, we utilize the MMC method to simplify the equation and transform it into solving the eigenvalue problem to acquire the propagation threshold. Finally, a myriad of experimental results are obtained through numerical simulations. Specifically, we verify the accuracy of MMC method characterization by comparing MMC method and MC simulation results. Meanwhile, we discuss the influence of different network structures on epidemic propagation. Moreover, we also study the influence of some of the main parameters: , , p and in this model on the aware individuals size, the epidemic size and threshold. Experimental results show that increasing the intensity of policy intervention, expanding the diffusion of epidemic-related information, and promoting individuals to take more effective preventive measures are conducive to raising the outbreak threshold and reducing the scale of epidemic spreading.
The current results can be used as a theoretical clues for the co-evolutionary propagation of information and epidemics under policy intervention. Furthermore, our work can also provide valuable reference for disease prevention and control, which can further help the epidemic prevention and control department to formulate reasonable response measures. For the prevention and control of COVID-19, our results can provide two potential directions. On the one hand, promoting the spread of epidemic information can increase the awareness of individual prevention and then inhibit the outbreak of COVID-19. On the other hand, increasing the social distance between individuals through policy intervention is conducive to the control of COVID-19 epidemic. In addition, there are still some meaningful work worthy of further discussions in the following researches, such as limit system and stability analysis of the proposed model.
Author Contributions
QY: Formal analysis, Investigation, Writing-original draft; ZW: Formal analysis, Investigation, Software, Writing-original draft; CX: Conceptualization, Investigation, Methodology, Writing-reviewing & editing, Funding acquisition.
Funding
This work is partially supported by the National Natural Science Foundation of China (NSFC) under Grant Nos. 62173247 by Chengyi Xia, and the Tianjin Research Innovation Project for Postgraduate Students under Grant 2020YJSB076 by Qian Yin.
Data availability
All data and materials can be obtained under the proposed model and algorithms.
Code availability
All algorithms are implemented in Python, and the code is available once the request to the corresponding author is reasonable.
Declarations
Conflicts of interest/Conflict of interest
The authors declare that they have no conflict of interest.
Footnotes
Publisher's Note
Springer Nature remains neutral with regard to jurisdictional claims in published maps and institutional affiliations.
References
- 1.Mack TM. Smallpox in Europe, 1950–1971. J. Infect. Dis. 1972;125(2):161–169. doi: 10.1093/infdis/125.2.161. [DOI] [PubMed] [Google Scholar]
- 2.Moss WJ, Griffin DE. Global measles elimination. Nat. Rev. Microbiol. 2006;4:900–908. doi: 10.1038/nrmicro1550. [DOI] [PMC free article] [PubMed] [Google Scholar]
- 3.Emond RTD, Evans B, Bowen ETW, Lloyd G. A case of Ebola virus infection. Brit. Med. J. 1977;2:541–544. doi: 10.1136/bmj.2.6086.541. [DOI] [PMC free article] [PubMed] [Google Scholar]
- 4.Quaranta G, Formica G, Machado JT, Lacarbonara W, Masri SF. Understanding COVID-19 nonlinear multi-scale dynamic spreading in Italy. Nonlinear Dyn. 2020;101:1583–1619. doi: 10.1007/s11071-020-05902-1. [DOI] [PMC free article] [PubMed] [Google Scholar]
- 5.Coronavirus (COVID-19) resource center, Johns Hopkins University (JHU), United States [Online]. (2021). https://coronavirus.jhu.edu/map.html [August 13 2021]
- 6.Bauch CT. Imitation dynamics predict vaccinating behaviour. Proc. Royal Soc. London Ser. B. 2005;272:1669–1675. doi: 10.1098/rspb.2005.3153. [DOI] [PMC free article] [PubMed] [Google Scholar]
- 7.Bauch CT, Earn DJ. Vaccination and the theory of games. Proc. Natl. Acad. Sci. USA. 2004;101:13391–13394. doi: 10.1073/pnas.0403823101. [DOI] [PMC free article] [PubMed] [Google Scholar]
- 8.Lai S, Ruktanonchai NW, Zhou L, Prosper O, Luo W, Floyd JR, Wesolowski A, Santillana M, Zhang C, Du X, Yu H, Tatem AJ. Effect of non-pharmaceutical interventions to contain COVID-19 in China. Nature. 2020;584:410–413. doi: 10.1038/s41586-020-2293-x. [DOI] [PMC free article] [PubMed] [Google Scholar]
- 9.Yang L, Draief M, Yang X. The impact of the network topology on the viral prevalence: a node-based approach. PLoS ONE. 2015;10:e0134507. doi: 10.1371/journal.pone.0134507. [DOI] [PMC free article] [PubMed] [Google Scholar]
- 10.Zhang H, Xie J, Chen H, Liu C, Small M. Impact of asymptomatic infection on coupled disease-behavior dynamics in complex networks. Europhys. Lett. 2016;114(3):38004. doi: 10.1209/0295-5075/114/38004. [DOI] [Google Scholar]
- 11.Litvinova M, Liu Q, Kulikove ES, Ajelli M. Reactive school closure weakens the network of social interactions and reduces the spread of influenza. Proc. Natl. Acad. Sci. USA. 2019;116(27):13174–13181. doi: 10.1073/pnas.1821298116. [DOI] [PMC free article] [PubMed] [Google Scholar]
- 12.Yin Q, Wang Z, Xia C, Dehmer M, Emmert-Streib F, Jin Z. A novel epidemic model considering demographics and intercity commuting on complex dynamical networks. Appl. Math. Comput. 2020;386:125517. [Google Scholar]
- 13.Li W, Zhou J, Lu J. The effect of behavior of wearing masks on epidemic dynamics. Nonlinear Dyn. 2020;101:1995–2001. doi: 10.1007/s11071-020-05759-4. [DOI] [PMC free article] [PubMed] [Google Scholar]
- 14.Guo H, Yin Q, Xia C, Dehmer M. Impact of information diffusion on epidemic spreading in partially mapping two-layered time-varying networks. Nonlinear Dyn. 2021;105(4):3819–3833. doi: 10.1007/s11071-021-06784-7. [DOI] [PMC free article] [PubMed] [Google Scholar]
- 15.Zhu P, Zhi Q, Guo Y, Wang Z. Analysis of epidemic spreading process in adaptive networks. IEEE Trans. Circuits Syst. II. 2019;66(7):1252–1256. [Google Scholar]
- 16.Xia C, Wang Z, Zheng C, Guo Q, Shi Y, Dehmer M, Chen Z. A new coupled disease-awareness spreading model with mass media on multiplex networks. Inform. Sci. 2019;471:185–200. doi: 10.1016/j.ins.2018.08.050. [DOI] [Google Scholar]
- 17.Velásquez-Rojas F, Ventura PC, Connaughton C, Moreno Y, Rodrigues FA, Vazquez F. Disease and information spreading at different speeds in multiplex networks. Phys. Rev. E. 2020;102:022312. doi: 10.1103/PhysRevE.102.022312. [DOI] [PubMed] [Google Scholar]
- 18.Wang Z, Guo Q, Sun S, Xia C. The impact of awareness diffusion on SIR-like epidemics in multiplex networks. Appl. Math. Comput. 2019;349:134–147. [Google Scholar]
- 19.Wang H, Ma C, Chen H, Zhang H. Effects of asymptomatic infection and self-initiated awareness on the coupled disease-awareness dynamics in multiplex networks. Appl. Math. Comput. 2021;400:126084. [Google Scholar]
- 20.Shao Q, Xia C, Wang L, Li H. A new propagation model coupling the offline and online social networks. Nonlinear Dyn. 2019;98:2171–2183. doi: 10.1007/s11071-019-05315-9. [DOI] [Google Scholar]
- 21.Wu J, Zheng M, Xu K, Gu C. Effects of two channels on explosive information spreading. Nonlinear Dyn. 2020;99:2387–2397. doi: 10.1007/s11071-019-05427-2. [DOI] [Google Scholar]
- 22.Yin Q, Wang Z, Xia C, Bauch CT. Impact of co-evolution of negative vaccine-related information, vaccination behavior and epidemic spreading in multilayer networks. Commun. Nonlinear Sci. Numer. Simul. 2022;109:106312. doi: 10.1016/j.cnsns.2022.106312. [DOI] [Google Scholar]
- 23.Kabir KMA, Kuga K, Tanimoto J. The impact of information spreading on epidemic vaccination game dynamics in a heterogeneous complex network–a theoretical approach. Chaos Solitons Fract. 2020;132:109548. doi: 10.1016/j.chaos.2019.109548. [DOI] [Google Scholar]
- 24.Funk S, Gilad E, Watkins C, Jansen VAA. The spread of awareness and its impact on epidemic outbreaks. Proc. Natl. Acad. Sci. USA. 2009;106(16):6872–6877. doi: 10.1073/pnas.0810762106. [DOI] [PMC free article] [PubMed] [Google Scholar]
- 25.Granell C, Gómez S, Arenas A. Dynamical interplay between awareness and epidemic spreading in multiplex networks. Phys. Rev. Lett. 2013;111:128701. doi: 10.1103/PhysRevLett.111.128701. [DOI] [PubMed] [Google Scholar]
- 26.Granell C, Gómez S, Arenas A. Competing spreading processes on multiplex networks: awareness and epidemics. Phys. Rev. E. 2014;90:012808. doi: 10.1103/PhysRevE.90.012808. [DOI] [PubMed] [Google Scholar]
- 27.Kabir KMA, Tanimoto J. Analysis of epidemic outbreaks in two-layer networks with different structures for information spreading and disease diffusion. Commun. Nonlinear Sci. Numer. Simul. 2019;72:565–574. doi: 10.1016/j.cnsns.2019.01.020. [DOI] [Google Scholar]
- 28.Wang Z, Xia C, Chen Z, Chen G. Epidemic propagation with positive and negative preventive information in multiplex networks. IEEE Trans. Cybern. 2021;51(3):1454–1462. doi: 10.1109/TCYB.2019.2960605. [DOI] [PubMed] [Google Scholar]
- 29.Wang Z, Xia C. Co-evolution spreading of multiple information and epidemics on two-layered networks under the influence of mass media. Nonlinear Dyn. 2020;102:3039–3052. doi: 10.1007/s11071-020-06021-7. [DOI] [PMC free article] [PubMed] [Google Scholar]
- 30.Zhan X, Liu C, Zhou G, Zhang Z, Sun G, Zhu JJH, Jin Z. Coupling dynamics of epidemic spreading and information diffusion on complex networks. Appl. Math. Comput. 2018;332:437–448. doi: 10.1016/j.amc.2018.03.050. [DOI] [PMC free article] [PubMed] [Google Scholar]
- 31.Pan A, Liu L, Wang C, Guo H, Hao X, Wang Q, Huang J, He N, Yu H, Lin X, Wei S, Wu T. Association of public health interventions with epidemiology of COVID-19 outbreak in Wuhan. JAMA. 2020;323(19):15–23. doi: 10.1001/jama.2020.6130. [DOI] [PMC free article] [PubMed] [Google Scholar]
- 32.Fong MW, Gao H, Wong JY, Xiao J, Shiu EYC, Ryu S, Cowling BJ. Nonpharmaceutical measures for pandemic influenza in nonhealthcare settingssocial distancing measures. Emerg. Infect. Dis. 2020;26:976–984. doi: 10.3201/eid2605.190995. [DOI] [PMC free article] [PubMed] [Google Scholar]
- 33.Arenas A, Cota W, Gómez-Gardeñes J, Gómez S, Granell C, Matamalas JT, Soriano-Paños D, Steinegger B. Modeling the spatiotemporal epidemic spreading of COVID-19 and the impact of mobility and social distancing interventions. Phys. Rev. X. 2020;10:041055. [Google Scholar]
- 34.Lü X, Hui H, Liu F, Bai Y. Stability and optimal control strategies for a novel epidemic model of COVID-19. Nonlinear Dyn. 2021 doi: 10.1007/s11071-021-06524-x. [DOI] [PMC free article] [PubMed] [Google Scholar]
- 35.Valdez, L.D., Macri, P.A., Braunstein, L.A.: Intermittent social distancing strategy for epidemic control. Phys. Rev. E 85, 036108 (2012) [DOI] [PubMed]
- 36.Yasir KA, Liu W. Social distancing mediated generalized model to predict epidemic spread of COVID-19. Nonlinear Dyn. 2021 doi: 10.1007/s11071-021-06424-0. [DOI] [PMC free article] [PubMed] [Google Scholar]
- 37.Perra N. Non-pharmaceutical interventions during the COVID-19 pandemic: a review. Phys. Rep. 2021;913:1–52. doi: 10.1016/j.physrep.2021.02.001. [DOI] [PMC free article] [PubMed] [Google Scholar]
- 38.Fazio RH, Ruisch BC, Moore CA, Samayoa JAG, Boggs ST, Ladanyi JT. Social distancing decreases an individual likelihood of contracting COVID-19. Proc. Natl. Acad. Sci. USA. 2021;118(8):e2023131118. doi: 10.1073/pnas.2023131118. [DOI] [PMC free article] [PubMed] [Google Scholar]
- 39.Chu DK, Akl EA, Duda S, Solo K, Yaacoub S, Schünemann HJ. Physical distancing, face masks, and eye protection to prevent person-to-person transmission of SARS-CoV-2 and COVID-19: A systematic review and meta-analysis. Lancet. 2020;395:1973–1987. doi: 10.1016/S0140-6736(20)31142-9. [DOI] [PMC free article] [PubMed] [Google Scholar]
- 40.Ahmed F, Zviedrite N, Uzicanin A. Effectiveness of workplace social distancing measures in reducing influenza transmission: a systematic review. BMC Public Health. 2018;18:518. doi: 10.1186/s12889-018-5446-1. [DOI] [PMC free article] [PubMed] [Google Scholar]
- 41.Mishra BK, Keshri AK, Rao YS, Mishra BK, Mahato B, Ayesha S, Rukhaiyyar BP, Saini DK, Singh AK. COVID-19 created chaos across the globe: Three novel quarantine epidemic models. Chaos Solitons Fract. 2020;138:109928. doi: 10.1016/j.chaos.2020.109928. [DOI] [PMC free article] [PubMed] [Google Scholar]
- 42.Huang H, Chen Y, Yan Z. Impacts of social distancing on the spread of infectious diseases with asymptomatic infection: a mathematical model. Appl. Math. Comput. 2021;398:125983. doi: 10.1016/j.amc.2021.125983. [DOI] [PMC free article] [PubMed] [Google Scholar]
- 43.Gómez S, Arenas A, Borge-Holthoefer J, Meloni S, Moreno Y. Discrete-time Markov chain approach to contact-based disease spreading in complex networks. Europhys Lett. 2010;89:38009. doi: 10.1209/0295-5075/89/38009. [DOI] [Google Scholar]
- 44.Barabási AL, Albert R. Emergence of scaling in random networks. Science. 1999;286:509–512. doi: 10.1126/science.286.5439.509. [DOI] [PubMed] [Google Scholar]
- 45.Erdös P, Rényi A. On the evolution of random graphs. Publ. Math. Inst. Hung. Acad. Sci. 1960;5:17–60. [Google Scholar]
Associated Data
This section collects any data citations, data availability statements, or supplementary materials included in this article.
Data Availability Statement
All data and materials can be obtained under the proposed model and algorithms.
All algorithms are implemented in Python, and the code is available once the request to the corresponding author is reasonable.