


Abstract
We have probed the effects of altering buffer conditions on the behaviour of two aptamer RNAs for the bacteriophage MS2 coat protein using site-specific substitution of 2′-deoxy-2-aminopurine nucleotides at key adenosine positions. These have been compared to the wild-type operator stem–loop oligonucleotide, which is the natural target for the coat protein. The fluorescence emission spectra show a position and oligonucleotide sequence dependence which appears to reflect local conformational changes. These are largely similar between the differing oligonucleotides and deviations can be explained by the individual features of each sequence. Recognition by coat protein is enhanced, unaffected or decreased depending on the site of substitution, consistent with the known protein–RNA contacts seen in crystal structures of the complexes. These data suggest that the detailed conformational dynamics of aptamers and wild-type RNA ligands for the same protein target are remarkably similar.
INTRODUCTION
The translational repression complex formed between a dimer of bacteriophage MS2 coat protein and MS2 genomic RNA has been the paradigm for sequence-specific protein–RNA recognition of a simple stem–loop structure since Uhlenbeck and his colleagues defined a 19 nt minimal consensus RNA binding site (1,2). This translational operator (TR) has been characterised biochemically (1–3) by both enzymatic and solid phase synthesis, and structurally by NMR solution studies (4,5). Our understanding of the molecular recognition complex has recently been extended by X-ray structures of the coat protein dimer bound to the RNA (6) and by a large number of X-ray structures determined by soaking the RNA or sub-fragments into crystals of RNA-free recombinant T = 3 capsids (7–10).
Such a well-characterised system was an obvious choice for a test of the technique of in vitro selection of degenerate RNA molecules (SELEX; 11–13). This suggested that tight binding RNAs corresponded to the consensus defined earlier. Recently, however, the in vitro selection process was repeated looking for non-consensus sites in a 30N pool (14). This yielded a series of aptamer families (Fig. 1) which appeared to break the rules of the consensus. We therefore determined their structures in complex with the coat protein using the capsid soaking approach (15,16). The results suggested that apparently widely variant primary sequences could adapt to satisfy the recognition requirements of the MS2 coat protein with the majority of the conformational variability being seen in the RNA component. These studies, together with recent structures for chemically variant RNA complexes (Grahn et al., in preparation), have led to a more refined definition of the minimal recognition consensus. It appears that the critical features are the number of nucleotide steps between A–10 and A–4 (see Fig. 1 for numbering scheme). Formation of the intermolecular contacts is only part of the pathway towards overall complex formation, since it is known that the unliganded RNA exists in solution primarily in a conformer which is distinct from that bound by the protein. Thus, RNA dynamics are an essential feature of the MS2 coat protein–RNA interaction (4,17).
Figure 1.

Secondary structures of RNA fragments used. Sequences and secondary structures of RNA stem–loops that bind to MS2 coat protein. Base numbering is relative to the start of the MS2 replicase initiation codon +1. All sites of 2AP substitution are highlighted in boxes. (i) Sequence of the wild-type operator; (ii) consensus sequence of the F5 aptamer family (the secondary structure shown is based on the X-ray crystal structure of the protein complex; 16); (iii) consensus sequence of the F6 aptamer sequence. Note that in order to compare base positions easily the cytidine of the additional base pair between the loop and the A–10 position of the F6 aptamer is labelled –3.5. (Inset) Structures of 2′-deoxyadenosine ribonucleoside and 2AP ribonucleoside.
RNA aptamers have great potential as research tools in molecular recognition and evolution studies, as well as in commerce and medicine. It is therefore important to understand how they interact with their targets. The MS2 system is an excellent model in which to study the behaviour of a series of aptamers whose three-dimensional structures with a protein ligand are all known, and also in which it is possible to compare the aptamer structures to the wild-type RNA. In order to probe the dynamics of both the wild-type operator and the aptamer RNAs, we have used solid phase chemical synthesis to incorporate the fluorescent nucleotide 2′-deoxy-2-aminopurine (2AP) at various important adenosine positions (Fig. 1). Substitution of oligonucleotides with 2AP has been widely used in the past to monitor conformational changes. When incorporated into helical nucleic acids, the quantum yield of the fluorophore can be reduced by a factor of up to 1000 (18). Subsequent studies have made use of the fact that significant fluorescence from 2AP in polymers only occurs when the base is solvent exposed, e.g. at the end of a helix (19). In the MS2 translational operator, the adenosine residues are either stacked or intercalated in solution but several become extruded during interaction with protein (7,8). It seemed therefore that 2AP substitution would be a sensitive probe of these conformational changes.
MATERIALS AND METHODS
Synthesis/purification of RNA operators
Solid phase synthesis, deprotection and purification of RNA fragments was carried out as described previously (20). The modified base precursor, 5′-O-(dimethoxytrityl)-N-2-(dimethylaminomethylidene)deoxypurineriboside-3′-O-((2-cyanoethyl)- N,N-isopropyl)-phosphoramidite was purchased from Glen Research (Virginia). Three derivatives of the wild-type operator (TR) sequence (19 nt) were synthesised, as were four derivatives of the F5 aptamer (18 nt) and two derivatives of the F6 aptamer (14 nt) (Fig. 1 and Table 1). Derivatives –4TR, –7TR and –10TR refer to the wild-type operator sequence containing a single 2AP substitution at adenosine positions –4, –7 and –10, respectively. Derivatives –1F5, –4F5, –7F5 and –10F5 and –4F6 and –10F6 refer to equivalent substitutions within the F5 and F6 aptamer sequences, respectively. Concentrations were determined by UV spectrophotometry, using nucleotide and dinucleotide extinction coefficients at A260 estimated according to Johnson and Gray (21) and a ɛ260 = 1000 M–1cm–1 for 2AP in aqueous solutions, pH >3.63 (22). Calculated extinction coefficients for all 2AP modified RNAs are listed in Table 2.
Table 1. 2AP derivatised operator sequences.

Sites of substitution (X) and base positions essential to coat protein recognition (–10, –7, –5 and –4) are labelled.
Table 2. Characterisation of the various 2AP modified operators and their unmodified parent RNAs.

AKd values of unmodified RNAs were determined from coat protein tryptophan quenching curves.
B–1F5 showed a complex coat protein binding curve, which does not fit to a simple rectangular hyperbola.
CA solution of 0.2 µM coat protein, rather than 0.5 µM (see Materials and Methods), was titrated against the operator in this instance.
Characterisation of RNA
Mass spectrometry. Aliquots of RNA oligonucleotides (10 pmol µl–1 in 50% v/v aqueous methanol and 1% v/v triethylamine) were analysed by negative electrospray ionisation in conjunction with a single quadrupole, bench-top Platform II mass spectrometer (Micromass UK Ltd, Cheshire, UK). Data were acquired in multi-channel analysis mode over the appropriate m/z range, with a half-height peak width of 0.7 Da. The m/z spectra were transposed onto a true molecular mass scale for more facile identification using maximum entropy techniques (23). An external calibration using horse heart myoglobin (mol. wt 16 9515.5; 10 pmol µl–1 in 50% v/v aqueous methanol and 1% v/v triethylamine) was performed to ensure mass accuracy (expected to be within 0.01% of the mass). Theoretical masses were calculated by the program BioLynx, a MassLynx software product provided by Micromass UK Ltd, using IUPAC determined nucleotide masses (24). Table 2 compares the theoretical and experimentally observed masses, which suggest that the synthetic RNAs were the expected products.
Thermal denaturation. RNA operator samples (~0.5 µM) in phosphate buffer (100 mM potassium phosphate, pH 7.5, 2 mM MgCl2, 80 mM KCl) were heated to 90°C and allowed to cool gradually to room temperature. Thermal melting experiments were then carried out on a Perkin Elmer Lambda 2 UV/VIS spectrometer fitted with a PTP-1 peltier temperature programmer and temperature sensor accessory, controlled by the program PETEMP. A standard 1 cm path length quartz cuvette was used in these experiments. A thin film of mineral oil was placed on each sample to counteract solvent evaporation at high temperatures. Samples were heated at a rate of 0.75°C min–1 from 10 to 85°C and the absorbance at 260 nm was recorded at every 0.2°C temperature step. The first derivative plots of the thermal melting profiles of the operator families are shown in Figure 2. The corresponding Tm values are listed in Table 2.
Figure 2.
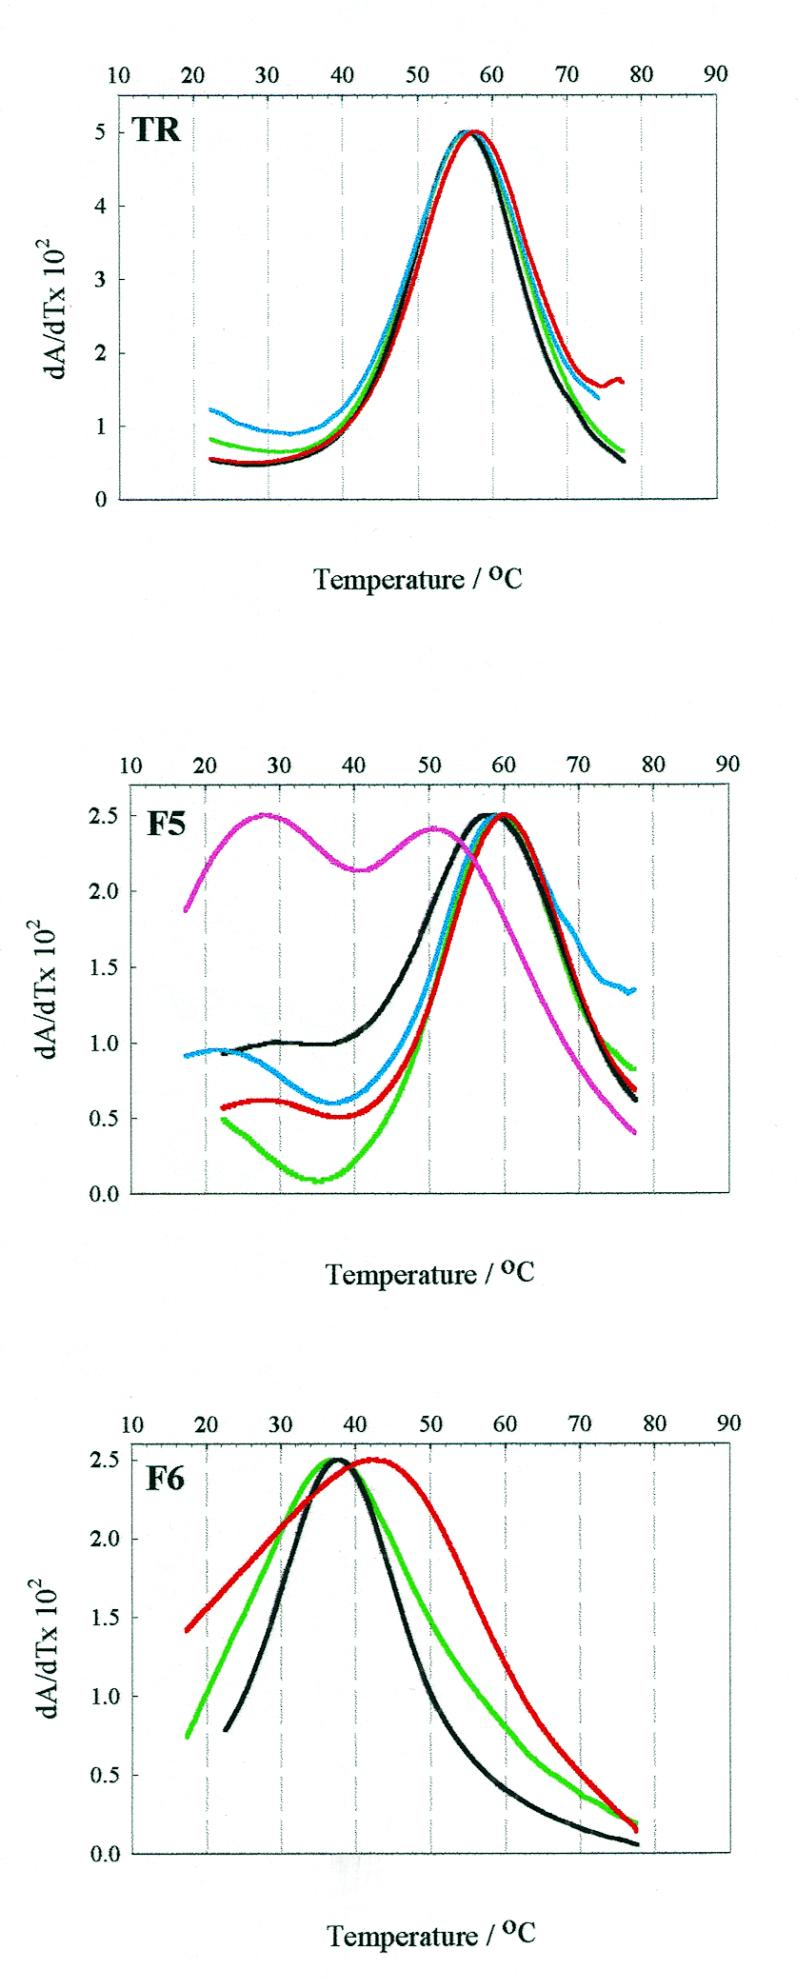
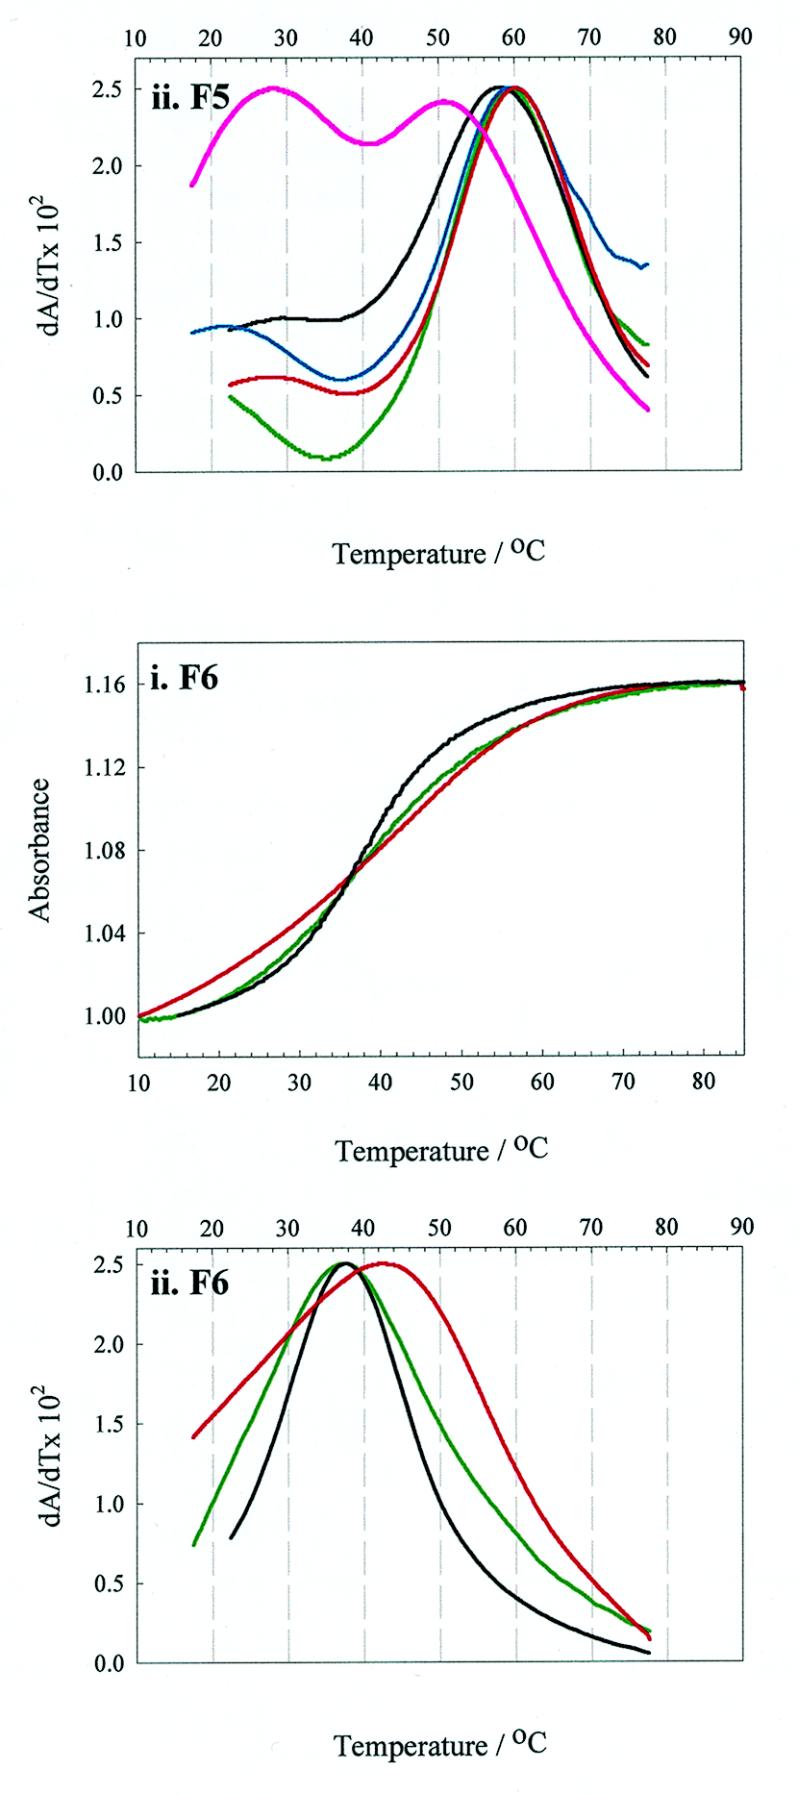
Thermal denaturation curves of the unmodified RNAs and their 2AP derivatives. Melting curves of unmodified and 2AP derivatised wild-type operator (TR) and the F5 and F6 aptamers. Green lines represent unmodified RNA, whilst red, blue and black lines denote 2AP substitution at positions –4, –7 and –10, respectively. The pink line represents the –1F5 derivative. The figure shows the first derivative plots from which the Tm values were determined.
Fluorescence measurements
Fluorescence excitation and emission spectra of the 2AP-substituted operators under various solvent conditions were obtained on a Perkin Elmer LS50B fluorimeter at 20°C. Excitation and emission spectra were scanned from 200 to 340 nm and from 330 to 500 nm with fixed monochromator wavelengths of 368 and 306 nm at scan speeds of 120 and 240 nm min–1, respectively. Spectral band widths were set at 3.0 (excitation) and 10.0 nm (emission). An aqueous solution of 0.3 µM 2AP derivatised RNA, pH 5.2, in a 1.5 ml stirred luminescence cuvette was converted to TMK buffer (100 mM Tris, pH 7.5, 80 mM KCl and 10 mM MgCl2), by consecutive addition of buffer components. First, Tris, pH 7.5, was added to a concentration of 100 mM, then KCl to concentrations of 5, 10, 20, 40 and 80 mM, and finally MgCl2 to a concentration of 10 mM. Spectra were generated from an average of five scans, the baseline subtracted and corrected for dilution.
Fluorescence equilibrium binding assays. Coat protein affinities were determined at 20°C on a Perkin Elmer LS50B fluorimeter with an excitation bandwidth of 3 nm and an excitation wavelength of 320 nm. Emission bandwidths were optimised to yield ~95% maximum transmission response, reflecting the relative fluorescence intensities of the fluorophore at different positions in different operators (Fig. 3). The emission wavelength was set at the peak maximum of the RNA:coat protein complex, either 368 or 363 nm (for position –10 substituted operators). The experiment was conducted as described previously (25,26) with RNA being titrated into 0.5 µM coat protein (with respect to dimer) in TMK buffer, pH 7.5.
Figure 3.
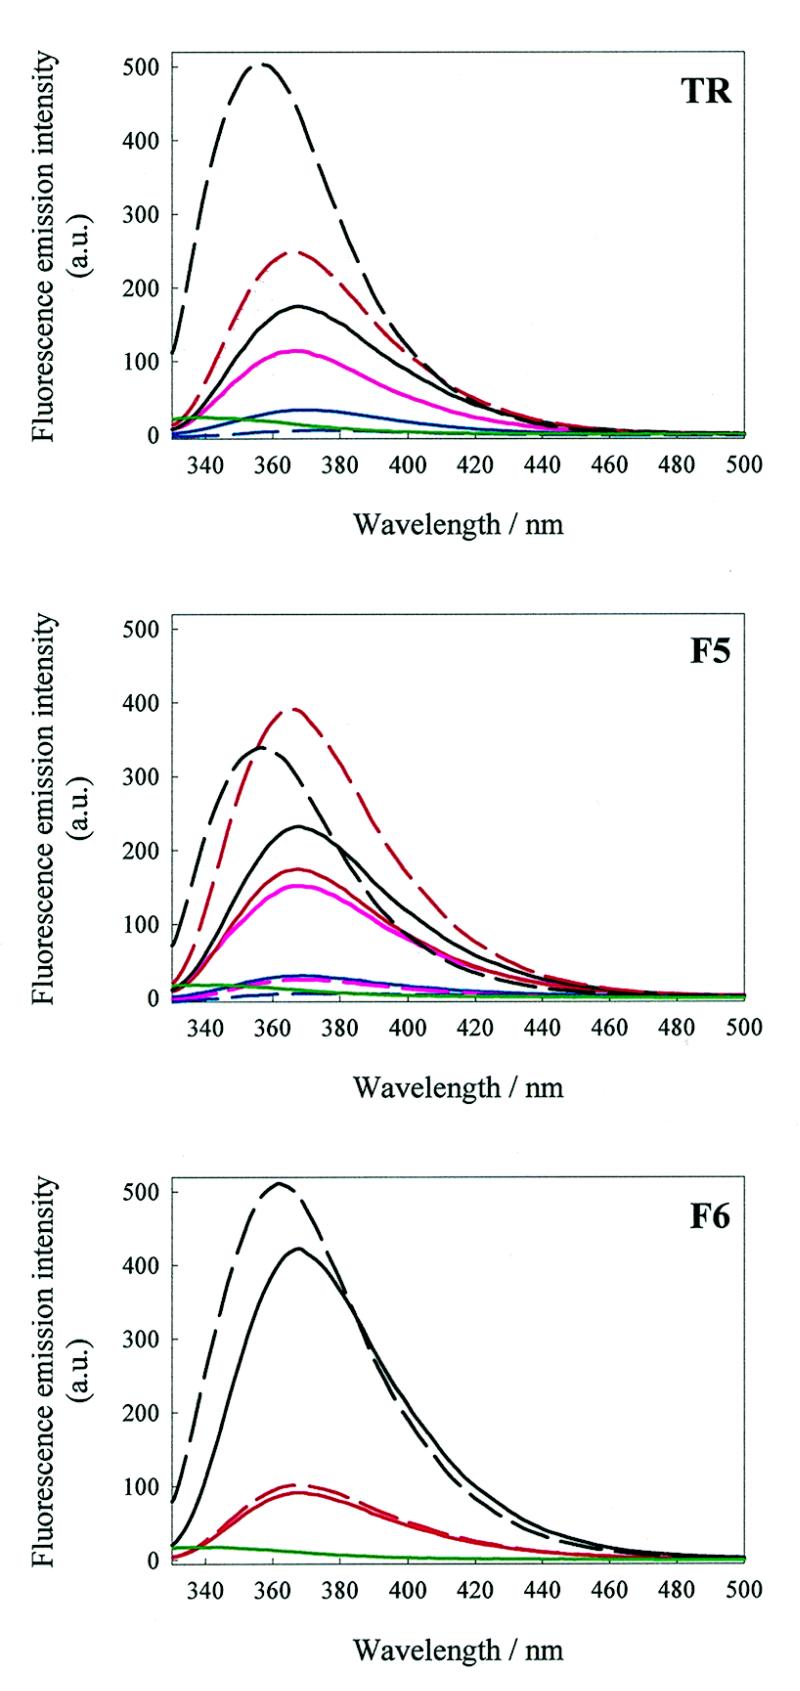
Fluorescence emission spectra of bound and unbound RNA fragments. Fluorescence emission spectra of 0.3 µM 2AP derivatised RNAs in TMK buffer, pH 7.5, in the presence and absence of a saturating concentration of MS2 coat protein (1 µM, dimer). Spectral bandwidths were 3 (excitation) and 8 nm (emission) and the excitation wavelength was set at 306 nm. Red, blue and black lines denote fluorescence emission from 2AP substituted at positions –4, –7 and –10, respectively. The pink line represents the uncomplexed aptamer –1F5 derivative and the green line represents the free coat protein fluorescence. Dashed lines represent the fluorescence emission of the corresponding coat protein:operator complexes.
The intrinsic fluorescence of MS2 coat protein, emanating primarily from the two tryptophan residues (Trp45 and Trp82), decreases by ~30% at 340 nm upon binding operator RNA (25,26). This assay was used to monitor the binding of wild-type TR and unmodified aptamers to coat protein. Spectral bandwidths were set at 3.5 (excitation) and 8.0 nm (emission). Tryptophan was excited at 295 nm and the fluorescence emission recorded at 340 nm.
Binding curves from the fluorescence titrations were fitted to rectangular hyperbolas by non-linear regression analysis using the program GRAFIT v.3.01 (Table 2).
RESULTS AND DISCUSSION
Synthesis of 2-aminopurine derivatives
Sequence variation experiments with the wild-type operator have revealed the importance of adenosines A–4, A–7 and A–10 in determining coat protein affinity (1–3).
Equivalent adenosine positions exist in the F5 aptamer and positions A–10 and A–4 also exist in the F6 aptamer (7,8,15,16). It was at these positions that 2AP was incorporated. Additionally, the adenosine position A–1 of the F5 aptamer, which forms a G (anti)–A (anti) base pair when complexed to coat protein (16) (Fig. 1), was also substituted.
We have shown previously that 2′-deoxyadenosine substitution at the wild-type A–4, A–7 and A–10 operator positions is silent in terms of coat protein affinity (3), at least as judged by filter binding assays, although there is a water-mediated contact to the sugar residue at A–10 from Ser47 and Arg49 of the B subunit (8). Presumably, this contact does not contribute significantly to the overall free energy of complexation. The X-ray structures of the F5 and F6 aptamer complexed with coat protein show similar contacts at all these residues (16).
All nine singly substituted 2AP derivatised RNAs were synthesised and purified as described in Materials and Methods. Mass spectrometry was used to confirm the identity of the products. Thermal denaturation profiles were monophasic for both 2AP derivatised and unmodified RNAs, with the exception of –1F5, which was at least biphasic. The Tm values of the derivatised RNAs were largely similar to those of the relevant unmodified operator, which is consistent with the assumption that 2AP substitution would have little effect upon gross secondary structure. Slight exceptions were –4TR, which melts ~1°C higher than wild-type operator, and –10F5, which melts ~1.5°C lower than the F5 aptamer. Major exceptions were –4F6, which has a markedly higher Tm to that of unmodified F6 (42.5°C compared with 37.4°C), and the –1F5 operator, which shows complex melting behaviour.
The solution behaviour of 2AP derivatised RNAs
Previously, we showed that the reactivity of functional groups within the wild-type operator towards diethylpyrocarbonate changed significantly with alterations in the solution buffer conditions, from a ‘destabilising’ buffer, containing EDTA at relatively low ionic strength and slightly acidic pH (6.8) to a more ‘physiological’ buffer containing 100 mM Tris, pH 7.5, 80 mM KCl and 10 mM MgCl2 (TMK buffer) (17). In order to assay whether the fluorescence of the 2AP derivatives would be similarly affected by changing solution conditions, we recorded their emission spectra in water and then observed the changes caused by adding the buffer components of TMK. Large changes (e.g. >3-fold enhancement) in emission intensity were observed, although these were well within the range of variation reported previously (18). Repetition of the experiments with salts alone, i.e. in the absence of Tris, showed that the primary effects were being caused by electrostatic shielding of the phosphate groups (data not shown). Raising the pH from that of water (pH ~5.5) did have a slight effect, leading to a small blue shift of the emission maxima.
In order to confirm that these effects were the result of conformational changes in the RNA, the following control experiments were performed. The fluorescence emission of 3′,5′-diphosphate 2′-deoxy-2-aminopurine ribonucleotide was assayed. The fluorescence excitation and emission spectra resembled those published for the nucleoside in water (18) and were largely unaffected by the components of TMK buffer, apart from magnesium ions, which produced a 6% enhancement in emission intensity (Fig. 4A). Additionally, the emission spectrum of the –7TR derivative was recorded in water or TMK at either 25 or 75°C. The higher temperature is well above the Tm for this RNA, which should therefore lack any secondary structure under these conditions. The two spectra at 75°C are superimposable (Fig. 4B), consistent with the interpretation that the intensity changes observed for the 2AP derivatives at lower temperature are due to alterations in their secondary and tertiary structures.
Figure 4.

Fluorescence spectra of 2AP nucleotide and an unfolded, substituted oligonucleotide. (A) Fluorescence excitation and emission spectra of 0.5 µM 2′-deoxy-2-aminopurine-3′,5′-diphosphate mononucleotide. An aqueous solution (blue) of the nucleotide, pH ~5.5, in a 1.5 ml stirred luminescence cuvette was converted to TMK buffer, pH 7.5, by consecutive addition of buffer components. First, Tris, pH 7.5, was added to a concentration of 100 mM (red), then KCl to concentrations of 5, 10, 20 (light green), 40 and 80 mM (dark green), and finally MgCl2 (black) to a concentration of 10 mM. Instrument parameters were as in Materials and Methods, apart from the spectral bandwidths, which were set at 5 (excitation) and 6.5 nm (emission). (B) Temperature dependence of the fluorescence emission spectrum of the 2AP derivative –7TR. The emission spectra are shown of 0.5 µM –7TR in water or in TMK buffer, pH 7.5, at 25 (blue) and 75°C (red). Solid and dashed lines represent fluorescence emission in water and TMK, respectively. The 75°C curves are superimposed. Fluorescence measurements were taken using a Photon Technology International (PTI) spectrofluorimeter controlled by the programme FeliX, fitted with a PE60 Linkam thermo-controller and PTI temperature sensor accessory. Emission spectra were scanned from 330 to 500 nm at 240 nm min–1, exciting at 306 nm. Spectra were generated from an average of three scans and the baseline subtracted.
Derivatives of the wild-type operator. The excitation and emission spectra for –4TR (Fig. 1) are shown in Figure 5A. Addition of Tris, pH 7.5, resulted in a significant increase in emission intensity (~40% at 368 nm), followed by further slight increases as KCl and MgCl2 were added. The excitation spectrum shows three absorption bands with relative intensities of 100, 28 and 34% with peak maxima at 218, 242 and 304 nm, respectively, and was similar to that of the nucleoside standard (Fig. 4A). The relative shape and intensity of these bands did not vary significantly with changing ionic strength after addition of the buffering counter-ion.
Figure 5.
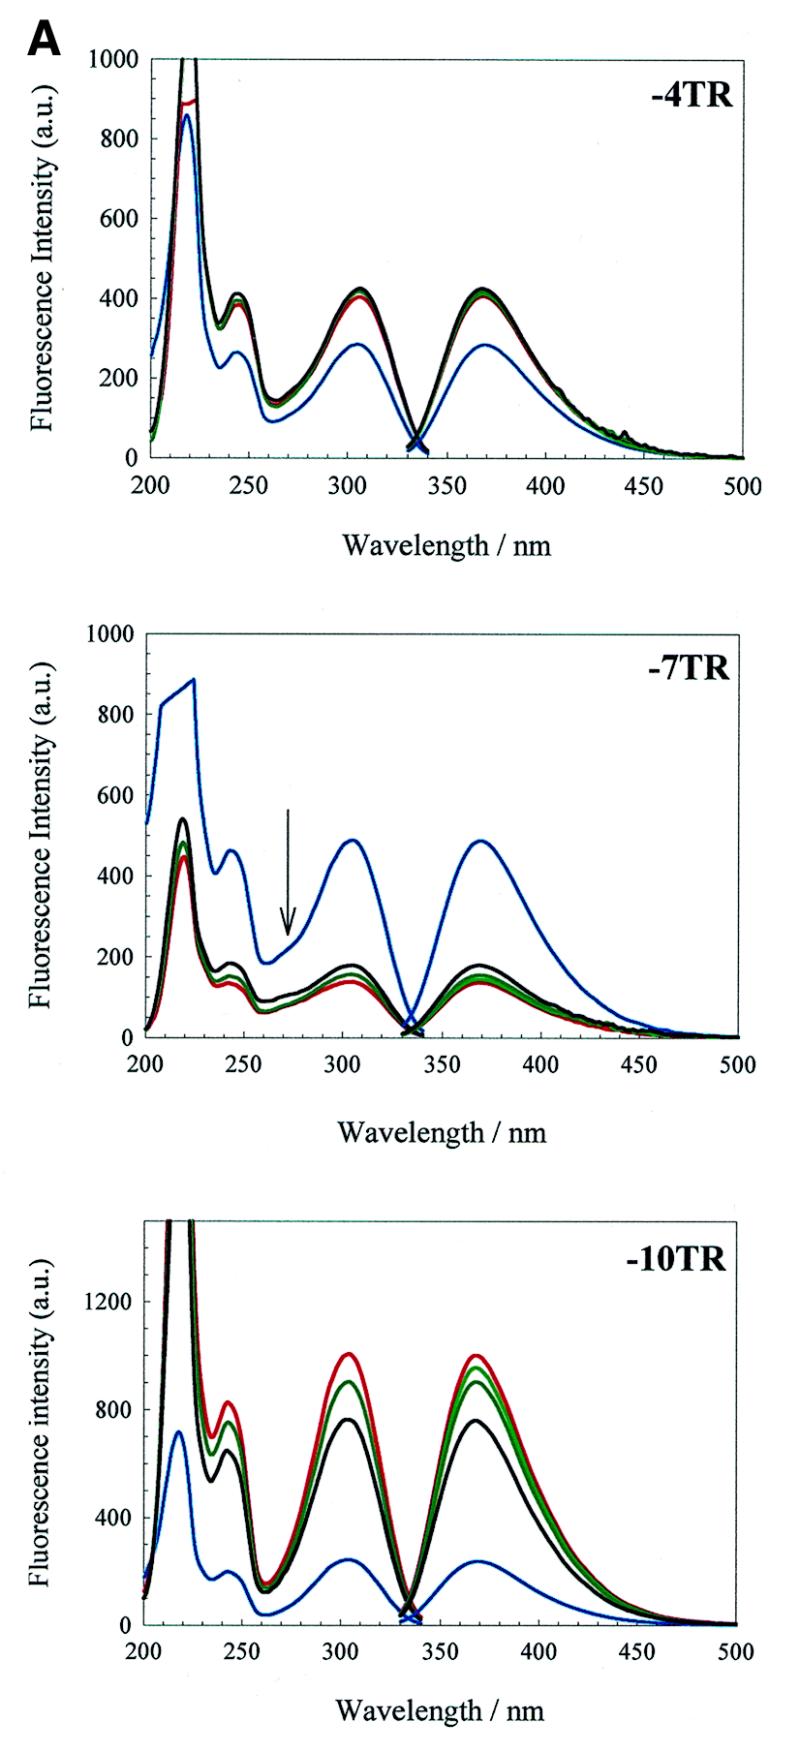
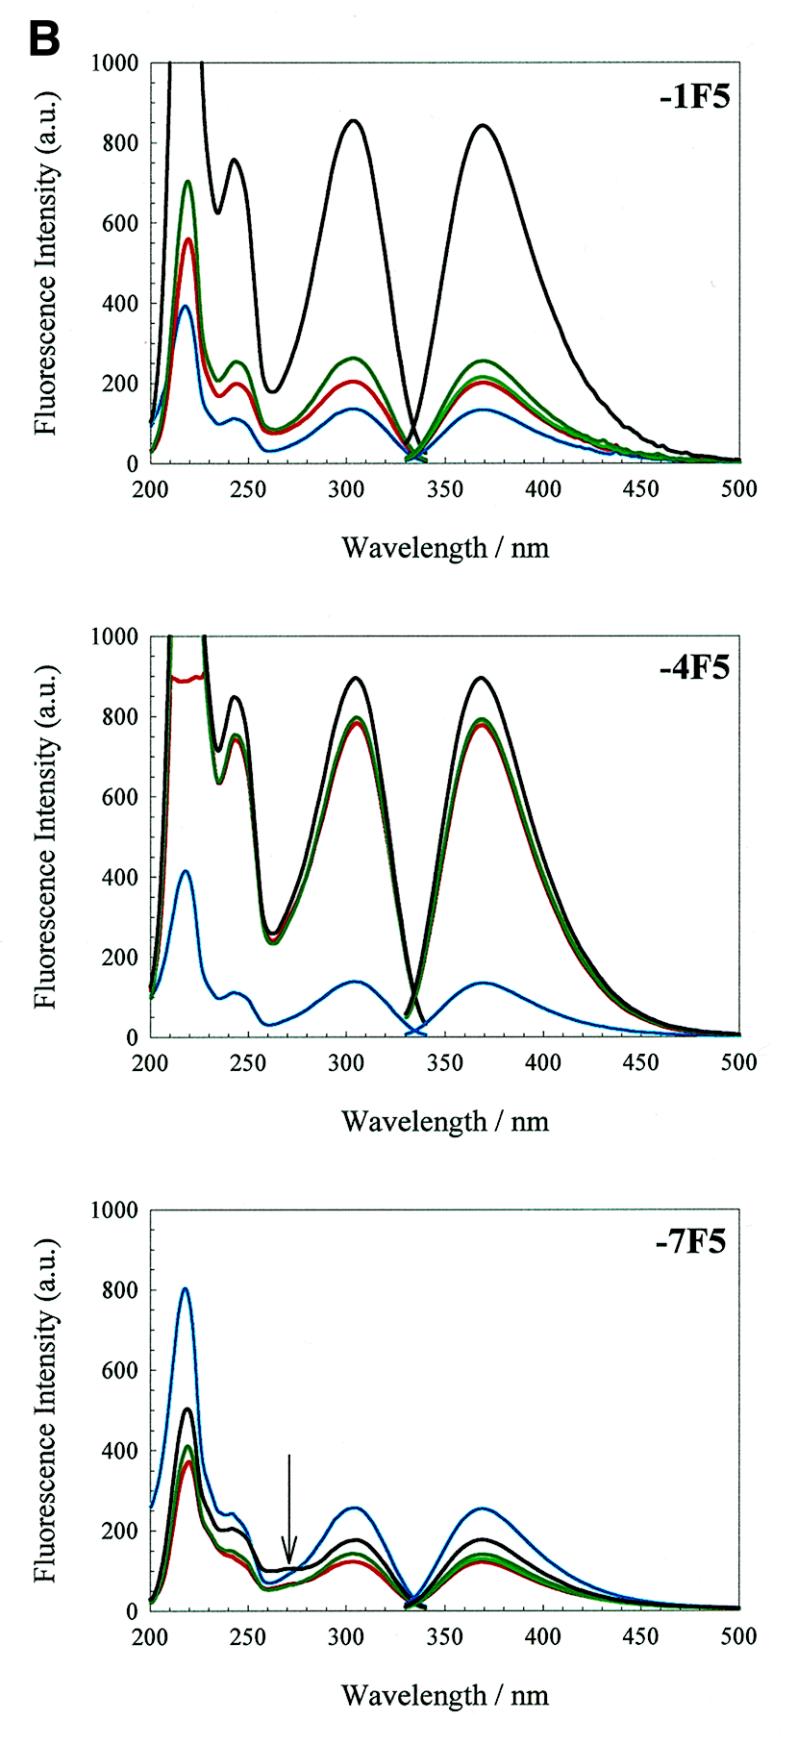
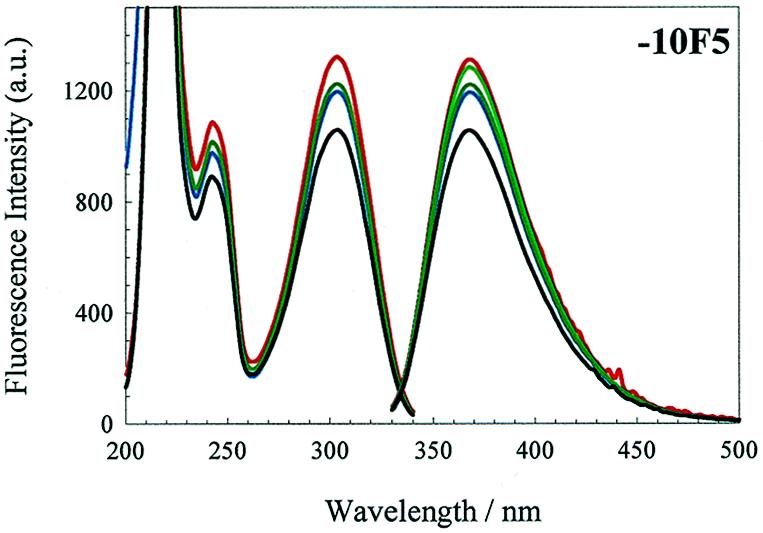
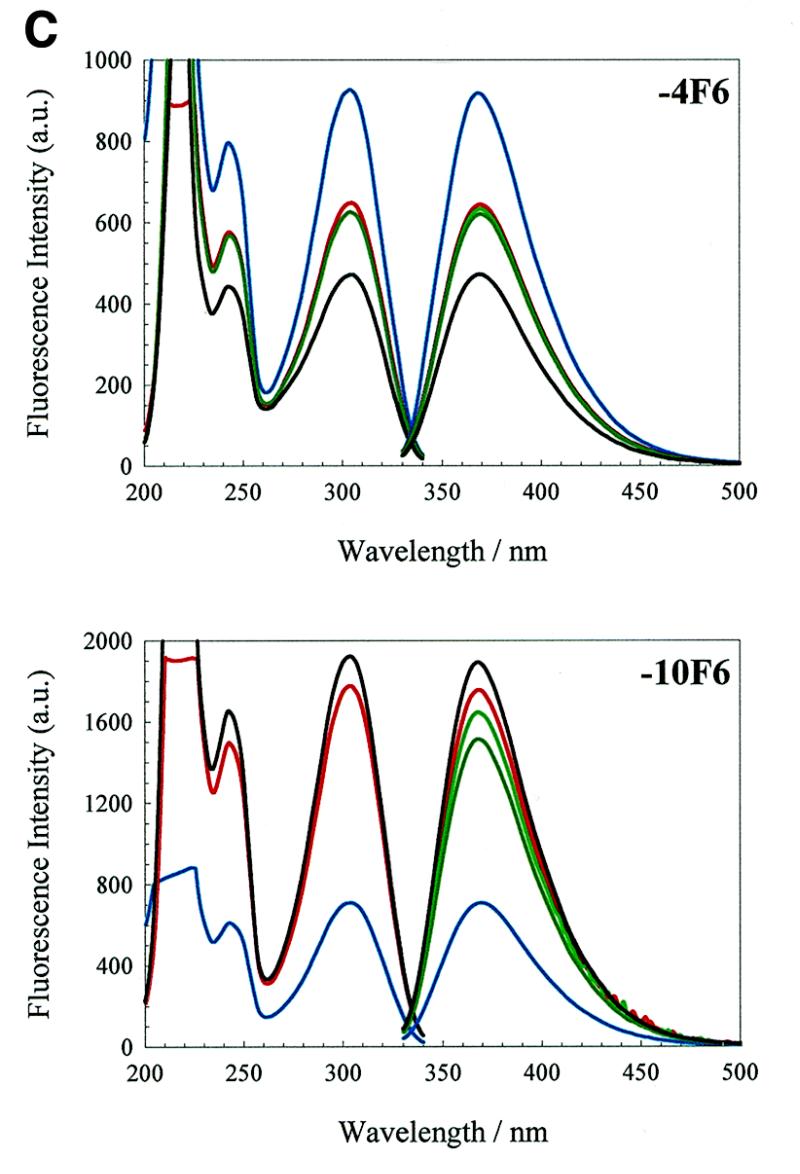
(Opposite and above) Effects of changing solution conditions on the fluorescence emission spectra. Fluorescence excitation and emission spectra of the 2AP derivatives of the wild-type operator and the F5 and F6 aptamers. Note that the 270 nm band is highlighted with an arrow in the –7TR and –7F5 excitation spectra. An aqueous solution of 0.3 µM 2AP derivatised operator, pH 5.2, in a 1.5 ml stirred luminescence cuvette was converted to TMK buffer, pH 7.5, by consecutive addition of buffer components. The colour code is as in Figure 4A.
Similar spectra were obtained for –7TR and –10TR (Fig. 5A), although the nature of the effects of adding buffer on emission intensity varied. Addition of Tris, pH 7.5, to –7TR caused a dramatic reduction (3-fold) in emission intensity. Further addition of KCl and MgCl2 resulted in slight increases in intensity, so that in the final TMK buffer the emission intensity was 37% of that in water. The excitation spectrum also shows evidence of an additional absorption band compared to the –4TR derivative, centred around 270 nm (seen as a shoulder on the 304 nm absorption band), and has relative peak intensities of 100, 34, 18 and 33%. A similar ~270 nm absorption band has been described for duplex DNA molecules substituted with 2-aminopurine (27) and has been interpreted as being due to excitation energy transfer between bases in an oligonucleotide. The appearance of this band in the –7TR excitation spectrum suggests that a similar phenomenon occurred here. This is consistent with the known solution structures for the wild-type operator (4), which show the bases near the loop stacking on the base paired stem underneath. Scaling and superposition of the derivative spectra (not shown) suggest that relative to the nucleoside standard both –7 derivatives have strong absorption bands at this wavelength, whilst the –4 derivatives only show a very slight shoulder in this region and there is no evidence of an absorption band at this wavelength for the –10 derivatives.
The –10TR undergoes a dramatic increase in fluorescence emission on addition of Tris, then a gradual decrease as KCl and MgCl2 are titrated in, resulting in a final emission band in TMK at 368 nm 320% higher than in water.
Derivatives of F5 and F6 aptamers. The excitation and emission spectra of aptamers F5 and F6 are shown in Figure 5B and C, respectively. Derivatives –4F5, –7F5, –10F5 and –10F6 have extremely similar trends in emission behaviour, in water and under increasing ionic strength, to the corresponding wild-type RNA derivatives –4TR, –7TR and –10TR. These results suggest that the 2AP fluorophore experiences a similar microenvironment at comparable sites of substitution in the different oligonucleotides. Notable exceptions to these trends are discussed below.
Interpretation of the changes in fluorescence emission. If we assume that the changing fluorescence emission intensities reflect the degree of local base stacking by 2AP (18,19,28,29), it is possible to interpret these data in terms of the known X-ray structures for MS2 operators and the solution structure of a related R17 operator having a –5C loop sequence (4,8). Operators having cytidine at position –5 (C-variants) have increased affinity for coat protein compared to the wild-type (–5U) sequence. One explanation for this increase appears to be increased ordering of the unliganded loop conformation due to the formation of an additional intramolecular hydrogen bond between the exocyclic amino group of –5C and the phosphate backbone at residue –6 (8). This is the case for both aptamer derivatives (16). The R17 C-variant operator has an identical loop sequence to that of the MS2 C-variant operator. Its solution structure was determined in 5 mM phosphate buffer, 25 mM NaCl, pH 7 (I = 38.6 mM), i.e. an ionic strength approximately equivalent to half that of our spectra in 100 mM Tris buffer (I = 86.3 mM) (Fig. 5). In solution, the major difference from the conformation observed when bound to the protein is that A–10 is intercalated into the helical stem. A–7 appears to be stacked upon the 5′-side of the base paired stem whilst A–4 is apparently mobile. Both loop residue conformations are reasonably consistent with those seen in the X-ray crystal structure of the coat protein complex (8).
Addition of salt to the 2AP derivatives in water leads to increases in the emission of –4TR, consistent with reduced stacking. The –7TR emission decreases slightly and the absorption band at 270 nm is enhanced with increasing salt. These results are consistent with increased stacking (27). The –10TR operator shows the largest change in emission intensity. This is consistent with reduced intercalation with increasing ionic strength, however, the solution structure suggests that at slightly lower ionic strength this conformation is an insignificant contribution to the entire population. An alternative explanation is that in water the –10 base is fully stacked and that the helical distortion that is seen in the NMR structure disrupts this stacking, increasing the fluorescence emission, consistent with the absence of the 270 nm absorption band from the –10 absorption spectrum.
Derivative –4F5 has approximately half the intensity of –4TR in water, suggesting a more stacked conformation for this base. In TMK, however, –4F5 has roughly twice the emission intensity of –4TR, consistent with a loop structure in which the –4 base is more excluded from the stem. This result appears consistent with the X-ray structure and the NMR result implying flexibility for the –4 base. The –7F5 derivative has approximately half the emission intensity of –7TR in water, and shows a much smaller decrease in intensity on addition of TMK. Again, this is consistent with a stacked conformation in water which is further stabilised in salt by the additional intramolecular hydrogen bond compared to the wild-type.
It is more difficult to interpret the derivatives in the stem for the F5 aptamer. The –1F5 residue causes significant destabilisation as judged from the Tm (Table 2). Its behaviour during salt titration suggests that there is a large change in conformation when magnesium ions are added, but since this leads to large increases in emission intensity it does not appear that this conformer contains the G–11:A–1 base pair seen in the complex with protein (16). The –10F5 derivative has a melting transition 1.5°C lower than the unmodified F5 aptamer, suggesting that 2AP substitution at this position also destabilises the secondary structure. In contrast to the other –10 derivatives, it has a greater emission intensity in water than in TMK, although the emission intensity changes on addition of buffer components are very similar to those seen with –10TR. A simple explanation for the increased fluorescence in water is that substitution of the –1A residue leads to a severely disrupted stem region preventing the stacking and subsequent quenching of –10A.
The behaviour of the F6 aptamer derivatives are the converse of those of F5, as might have been expected. In F6, the –10 residue follows the pattern set by the –10TR derivative, despite the differences in the identities of the base pairs flanking the –10 site. A minor difference is that the introduction of magnesium ions resulted in a slight enhancement of the emission intensity rather than diminishing it. This could be a consequence of the shorter stem of the F6 aptamer, which is probably more dependent on magnesium ions for overall stability.
In contrast is the behaviour of the –4 residue in the 3 nt loop. The emission intensity of –4F6 diminishes with increasing ionic strength; this is the inverse of the effects seen in the TR derivative and the F5 aptamer, implying that –4F6 becomes more stacked, not less, as buffer is added. It might be that at very low ionic strength the geometry of the 3 nt loop causes complete extrusion of the –4 residue due to phosphate repulsion.
Recognition by coat protein
The complexes each of the RNAs makes with the coat protein represent one of the extremes of the conformational distribution being probed by the 2AP data. The effect of 2AP substitution on recognition by the coat protein was assayed in TMK and compared with the affinities of the unmodified parent RNA fragments (Table 2). RNAs were titrated into a fixed concentration of coat protein. The fluorescence emission spectra of the 2AP derivatives were markedly altered when bound to coat protein and allowed simple fluorescence binding titrations to be conducted (Materials and Methods). Fluorescence emission changes were found to be dependent on the position of 2AP substitution (Fig. 3), consistent with the assumption that the fluorophores report changes in the local RNA structure.
All operators were titrated against a total concentration of MS2 coat protein dimer that was at least an order of magnitude higher than their respective apparent equilibrium dissociation constants. The affinities of the parent oligonucleotides vary considerably, the F5 molecule having a higher affinity than TR, consistent with its –5C substitution, whilst F6 has a slightly reduced affinity as reported previously (26). The –4A residue makes several hydrogen bonds to the protein in all the RNA complexes (ThrA45–N7, SerA47–N1 and a double contact from the exocyclic 6-amino group to ThrA45 and ThrA59). Not surprisingly, removal of the exocyclic amino group reduces affinity, by factors of >17 and >30 for TR and F5, respectively, and to undetectable levels for F6. The –7A residue does not contact the protein directly and so it is difficult to ascribe reasons for the small effects seen on the affinities of the TR and F5 derivatives. The method used to determine affinities is, however, relatively imprecise (26,30) and so these changes may be within experimental error. The –10A makes hydrogen bonds via N1 and the 6-amino group to ThrB45, and via N3 to SerB47. Substitution of the wild-type RNA at this position with a number of purine derivatives (2) and with –10G is well tolerated (1). This apparent flexibility in the interaction may account for the increased affinity of all of the –10 2AP derivatives compared to their respective parent molecules. Presumably, the base at –10 is able to adjust its position allowing new contacts from the 2-amino group to form, compensating for those that are lost.
As well as their effects on recognition, the 2AP derivatives allow us to interpret the spectral changes induced by protein binding. The –4TR and –4F5 derivatives show enhanced emission in the presence of protein, consistent with decreased stacking as the residue binds into the pocket on the protein subunit. There are no shifts in the emission wavelength. The effect of binding to –4F6 was very slight, although it was detectable (Fig. 3), consistent with the argument that the 3 nt loop forces the –4 residue into a more exposed location even in the absence of the coat protein. Operators substituted at –7 have diminished fluorescence emission intensity accompanied by an invariant peak wavelength, which is consistent with decreased flexibility in a stacked location for the complexes with protein. The fluorescence emission intensity of operators substituted at position –10 is enhanced in all three cases and the peak maxima blue-shifted by as much as 11.5 nm upon binding coat protein, again consistent with a shift from an intercalated to an extruded conformation.
The –1F5 derivative undergoes a significant drop in emission intensity, as might be expected for formation of the non-Watson–Crick base pair stacked into the stem. Base pair formation, however, is unlikely due to the loss of the 6-amino group (31). The effect may therefore be due simply to stacking of the 2AP residue in the helical stem. As might have been expected from the multiphasic melting curve (Fig. 2), the binding data from this derivative did not fit to a simple 1:1 binding model. It was possible, however, to estimate the end-point of the fluorescence titration, which was after the addition of 0.5 µM coat protein dimer, suggesting that a 1:1 complex was being formed.
CONCLUSIONS
These data have allowed us for the first time to compare the solution behaviour of two RNA aptamer families with a wild-type ligand. Individual residues within the RNAs appear to experience similar microenvironments, given the constraints imposed by their secondary structures. Loop and stem residues appear to be independent of each other. The pathway to coat protein binding is clearly complex, although these data support the X-ray results for RNA fragments bound to a preformed capsid, which suggest that each RNA is sufficiently flexible to be able to conform to the binding requirements of the protein, with the result that each of the related important adenosine residues can adopt similar conformations and make identical intermolecular contacts. The coat protein affinities of the substituted RNAs support the idea that recognition at –4 is more critical than for any of the other adenosine positions. The –10F5 variant has the highest affinity for coat protein of any RNA ligand yet reported (>65× wild-type), benefiting from both the –5C loop sequence and the positive effect of 2AP at –10.
Acknowledgments
ACKNOWLEDGEMENTS
We thank Mrs Jenny Baker for expert technical assistance. This work was supported in part by the UK BBRSC and MRC and the Leverhulme and Wellcome Trusts.
REFERENCES
- 1.Witherall G.W., Gott,J.M. and Uhlenbeck,O.C. (1991) Prog. Nucleic Acid Res. Mol. Biol., 40, 185–220. [DOI] [PubMed] [Google Scholar]
- 2.Stockley P.G., Stonehouse,N.J., Murray,J.B., Goodman,S.T.S., Talbot,S.J., Adams,C.J., Liljas,L. and Valegård,K. (1995) Nucleic Acids Res., 23, 2512–2518. [DOI] [PMC free article] [PubMed] [Google Scholar]
- 3.Talbot S.J., Goodman,S., Bates,S.R.E., Fishwick,C.W.G. and Stockley,P.G. (1990) Nucleic Acids Res., 18, 3521–3528. [DOI] [PMC free article] [PubMed] [Google Scholar]
- 4.Borer P.N., Lin,Y., Wang,S., Roggenbuck,M.W., Gott,J.M., Uhlenbeck,O.C. and Pelczer,I. (1995) Biochemistry, 34, 6488–6503. [DOI] [PubMed] [Google Scholar]
- 5.Nooren I.M.A., Wang,K.Y., Borer,P.N. and Pelczer,I. (1998) J. Biomol. NMR, 11, 319–328. [DOI] [PubMed] [Google Scholar]
- 6.Ni C.-Z., Syed,R., Kodandapani,R., Wickersham,J., Peabody,D.S. and Ely,K.R. (1995) Structure, 3, 255–263. [DOI] [PubMed] [Google Scholar]
- 7.Valegård K., Murray,J.B., Stockley,P.G., Stonehouse,N.J. and Liljas,L. (1994) Nature, 371, 623–626. [DOI] [PubMed] [Google Scholar]
- 8.Valegård K., Murray,J.B., Stonehouse,N.J., Van den Worm,S.H.E., Stockley,P.G. and Liljas,L. (1997) J. Mol. Biol., 270, 724–738. [DOI] [PubMed] [Google Scholar]
- 9.Van den Worm S.H.E., Stonehouse,N.J., Valegård,K., Murray,J.B., Walton,C., Fridborg,K., Stockley,P.G. and Liljas,L. (1998) Nucleic Acids Res., 26, 1345–1351. [DOI] [PMC free article] [PubMed] [Google Scholar]
- 10.Grahn E., Stonehouse,N.J., Murray,J.B., Van den Worm,S., Valegård,K., Fridborg,K., Stockley,P.G. and Liljas,L. (1999) RNA, 5, 131–138. [DOI] [PMC free article] [PubMed] [Google Scholar]
- 11.Schneider D., Tuerk,C. and Gold,L. (1992) J. Mol. Biol., 228, 862–869. [DOI] [PubMed] [Google Scholar]
- 12.Tuerk C. and Gold,L. (1990) Science, 249, 505–510. [DOI] [PubMed] [Google Scholar]
- 13.Gold L., Brown,D., He,Y.Y., Shtatland,T., Singer,B.S. and Wu,Y. (1997) Proc. Natl Acad. Sci. USA, 94, 59–64. [DOI] [PMC free article] [PubMed] [Google Scholar]
- 14.Hirao,I., Spingola,M., Peabody,D. and Ellington,A.D. (1998) Mol. Divers., 4, 75–89. [DOI] [PubMed] [Google Scholar]
- 15.Convery M., Rowsell,S., Stonehouse,N.J., Ellington,A.D., Hirao,I., Murray,J.B., Peabody,D.S., Phillips,S.E.V. and Stockley,P.G. (1998) Nature Struct. Biol., 5, 133–139. [DOI] [PubMed] [Google Scholar]
- 16.Rowsell S., Stonehouse,N.J., Convery,M.A., Adams,C.J., Ellington,A.D., Hirao,I., Peabody,D.S., Stockley,P.G. and Phillips,S.E.V. (1998) Nature Struct. Biol., 5, 970–975. [DOI] [PubMed] [Google Scholar]
- 17.Talbot S.J., Medina,G., Fishwick,C.W.G., Haneef,I. and Stockley,P.G. (1991) FEBS Lett., 283, 159–164. [DOI] [PubMed] [Google Scholar]
- 18.Ward D.C., Reich,E. and Stryer,L. (1969) J. Biol. Chem., 244, 1228–1237. [PubMed] [Google Scholar]
- 19.Hochstrasser R.A., Carver,T.E., Sowers,L.C. and Millar,D.P. (1994) Biochemistry, 33, 11971–11979. [DOI] [PubMed] [Google Scholar]
- 20.Murray J.B., Collier,A.K. and Arnold,J.R.P. (1994) Anal. Biochem., 218, 177–184. [DOI] [PubMed] [Google Scholar]
- 21.Puglisi J.D. and Tinoco,I.,Jr (1989) Methods Enzymol., 180, 304–325. [DOI] [PubMed] [Google Scholar]
- 22.Fox J.J., Wempen,I., Hampton,A. and Doerr,I.L. (1958) J. Am. Chem. Soc., 80, 1669–1675. [Google Scholar]
- 23.Skilling J. (1988) In Smith,C.R. and Erickson,E.J. (eds), Maximum Entropy and Bayesian Methods in Science and Engineering. Kluwer Academic Press, Dordrecht, The Netherlands, pp. 173–187.
- 24.Delaeter J.R. (1991) Pure Appl. Chem., 63, 975–990. [Google Scholar]
- 25.Beckett D. and Uhlenbeck,O.C. (1988) J. Mol. Biol., 204, 927–938 [DOI] [PubMed] [Google Scholar]
- 26.Lago H., Fonseca,S.A., Murray,J.B., Stonehouse,N.J. and Stockley,P.G. (1998) Nucleic Acids Res., 26, 1337–1344. [DOI] [PMC free article] [PubMed] [Google Scholar]
- 27.Nordlund T.M., Xu,D. and Evans,K.O. (1993) Biochemistry, 32, 12090–12095. [DOI] [PubMed] [Google Scholar]
- 28.Beechem J.M., Otto,M.R., Bloom,L.B., Eritja,R., Reha-Krantz,L.J. and Goodman,M.F. (1998) Biochemistry, 37, 10144–10155. [DOI] [PubMed] [Google Scholar]
- 29.Law S.M., Eritja,R., Goodman,M.F. and Breslauer,K.J. (1996) Biochemistry, 35, 12329–12337. [DOI] [PubMed] [Google Scholar]
- 30.Carpenter M.L. and Kneale,G.G. (1994) In Kneale,G.G. (ed.), Methods in Molecular Biology. DNA–Protein Interactions: Principles and Protocols. Humana Press, Totowa, NJ, Ch. 24, pp. 313–325. [DOI] [PubMed]
- 31.Fazakerley G.V., Quignard,E., Woisard,A., Guschlbauer,W., Van der Marel,G.A., Van Boom,J.H., Jones,M. and Radman,M. (1986) EMBO J., 5, 3697–3703. [DOI] [PMC free article] [PubMed] [Google Scholar]