Abstract
Thermal-stress events on coral reefs lead to coral bleaching, mortality, and changes in species composition. The coral reefs of Yap, in the Federated States of Micronesia, however, remained largely unaffected by major thermal-stress events until 2020, when temperatures were elevated for three months. Twenty-nine study sites were examined around Yap to determine geographical and taxonomic patterns of coral abundance, bleaching susceptibility, and environmental predictors of bleaching susceptibility. Island-wide, 21% (± 14%) of the coral cover was bleached in 2020. Although inner reefs had a greater proportion of thermally-tolerant Porites corals, the prevalence of bleaching was consistently lower on inner reefs (10%) than on outer reefs (31%) for all coral taxa. Corals on both inner and outer reefs along the southwestern coast exhibited the lowest prevalence of coral bleaching and had consistently elevated chlorophyll-a concentrations. More broadly, we revealed a negative relationship between bleaching prevalence and (moderate) chlorophyll-a concentrations that may have facilitated resistance to thermal stress by reducing irradiance and providing a heterotrophic energy source to benefit some corals exposed to autotrophic stress. Southwestern reefs also supported a high but declining fish biomass, making these bleaching-resistant and productive reefs a potential climate-change refuge and a prime target for conservation.
Subject terms: Climate-change ecology, Marine biology
Introduction
The past three decades of climate change have seen a rise in the intensity of thermal-stress events, raising concerns about the future of coral reefs1,2. Thermal-stress events disrupt the relationship between host corals and their symbiotic microalgae, leading to coral-host starvation and mass mortality of corals when bleached3. Global studies have documented extensive coral loss from thermal-stress events4,5, with consistent susceptibility patterns across coral taxa6–8. In the past, widespread coral bleaching was only associated with El Niño-Southern Oscillation (ENSO) events, but coral bleaching is now associated with many climate-change-related oceanographic and climate features beyond ENSO. As a consequence, modern coral reefs are experiencing less time to recover between thermal-stress events than in the past8–10. To potentially mitigate these frequent bleaching events, management must identify (i) local factors that influence bleaching susceptibility and (ii) local and regional stressors that influence subsequent recovery.
Some environmental factors, such as turbidity, have been documented to increase bleaching resistance over regional scales11; however, relatively few studies have examined the spatial distribution of bleaching resistance at local scales12–14. One such study following the 2010 ENSO event in Palau noted that coral bleaching was lowest on nearshore reefs where reduced irradiance, through moderate turbidity, appeared to enhance thermal tolerance13. Yet, studies in the Florida Keys15, the Great Barrier Reef16, and French Polynesia17 showed higher bleaching where nutrient concentrations were elevated. Corals in controlled field and laboratory experiments also showed both positive18,19 and negative20–22 effects of dissolved inorganic nitrogen on bleaching susceptibility that may be a consequence of moderate versus high concentrations, respectively. In addition, corals in Mauritius experienced more intense bleaching on the windward coast where water flow rates were higher and temperature fluctuations were less variable than on the leeward coast12. Clearly, there are interactions among temperature, light, nutrients, and water-flow rates that influence bleaching susceptibility. These interactions need further investigation across a suite of spatial scales, especially at local scales where environmental factors are most dynamic, while also accounting for taxonomic variations in bleaching susceptibility.
Here, we examined bleaching susceptibility in response to the first major thermal-stress event in Yap, Micronesia. We used a stratified sampling approach to identify spatial differences in the bleaching of different coral genera across reef types and geography. In addition, we used satellite-derived data on chlorophyll-a concentrations and temperature to determine whether these environmental variables influenced coral bleaching during thermal stress. The differential susceptibilty of coral taxa to heat stress we observed mainly followed past studies; however, novel relationships were revealed between moderate chlorophyll-a environments and bleaching that will provide decision support for management strategies to mitigate the effects of climate change.
Methods
Study location and field methods
The main island of Yap is the largest of the 15 islands comprising Yap State (~ 100 km2) and is home to roughly two-thirds of the state’s 11,377 residents (FSM Statistics Office, 2020). Management of Yap’s marine resources is unique, balancing modern state-driven legislation with traditional reef tenure23. A strong sense of community involvement has been associated with the success of several marine protected areas (MPA) around the island24. Nonetheless, in recent years growing fishing pressure, intermittent Crown-of-Thorns seastar outbreaks, and to a lesser extent land-based pollution have caused declines in Yap’s coral-reef resources25.
In 2017, Yap experienced its first heat-stress event when the Degree Heating Weeks (DHW) exceeded 8 °C-weeks during October (Fig. 1). Mild bleaching was observed for Acropora corals and a slight shift in dominance to Porites corals occurred over the next two years26. However, in the summer of 2020, the combination of a La Niña and a negative Pacific Decadal Oscillation, not associated with any ENSO cycle, led to prolonged thermal stress in the western Pacific Ocean. During this time, the 8 °C-weeks threshold27 was exceeded for nearly three months (Fig. 1). Previous research suggested that these oceanographic conditions may lead to significant heat stress for Yap26 and, coupled with National Oceanic and Atmospheric Administration (NOAA) Coral Reef Watch products at short time intervals, these predictions enabled local teams to secure the financial, logistical, and technical support needed to conduct island-wide surveys during the 2020 thermal-stress event.
Figure 1.
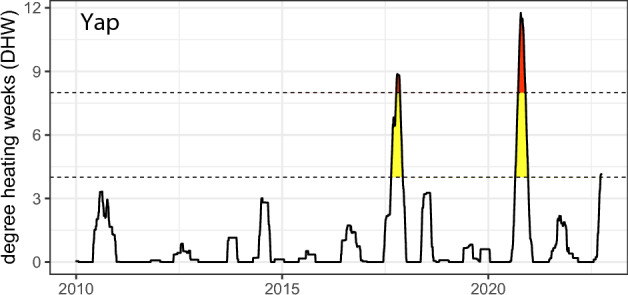
Degree heating weeks (°C) for Yap State, 2010 to 2022. Dashed lines indicate the thresholds of 4 °C weeks (yellow), thought to induce bleaching, and 8 °C weeks (red), associated with widespread bleaching mortality.
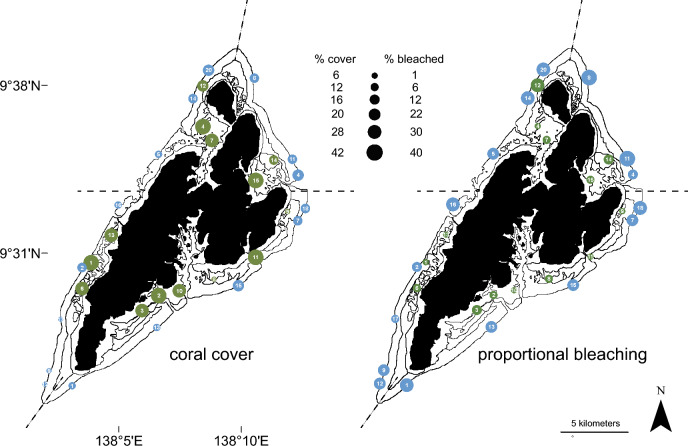
We used a stratified random survey design, with stratification across both inner and outer reefs and the four geographic sectors (northeast, northwest, southeast, and southwest). Overall, we surveyed 14 inner and 15 outer reefs distributed across Yap (Fig. 2). Snorkel surveys were conducted between November and December of 2020 following the thermal peak. At each site, three 30-m transect tapes were placed parallel to the 3-m depth contour. Along each transect, surveyors took a series of 1-m2 photo-quadrats, captured at 1-m intervals along the transect lines. These transects provided a total survey area of 90 m2 per site.
Figure 2.
Coral cover (left) and proportional bleaching (right) across study sites. Circle size is proportional to the contribution of each variable. Outer and inner reef types are differentiated by blue and green circles, respectively. Numbers indicate unique site identifiers (Supplementary Table S1. Dashed lines indicate boundaries of the four geographic quadrants.
Image analysis
Within each photo quadrat, corals were identified to genera following the taxonomy outlined by Veron28, Budd and Bosellini29, and Huang et al.30. The number of coral colonies within each genus was counted in each image. Estimates of total coral cover for each genus were determined to the nearest percentage by overlaying the images with a 10 cm by 10 cm grid. The prevalence of coral bleaching was similarly estimated to determine the overall proportion of coral colonies that were bleached. Using these methods, we evaluated a total of 29,221 coral colonies, ranging between 402 to 1611 colonies per site.
Environmental variables
Environmental data were gathered to characterize the bleaching event and examine potential relationships between bleaching prevalence, sea-surface temperatures, and chlorophyll-a concentrations across Yap. Firstly, to evaluate the cumulative heat stress Yap had experienced since 2010, DHW data were accessed from the NOAA National Environmental Satellite, Data, and Information Services (NESDIS) that are served through the Pacific Islands Ocean Observing System (https://pae-paha.pacioos.hawaii.edu/erddap/index.html). We summarized DHW with respect to two established thresholds, representing bleaching warning and expected bleaching events (4 °C-weeks and 8 °C-weeks, respectively)27.
Additionally, sea-surface temperature and chlorophyll-a satellite data were downloaded from the NOAA Coastwatch server AVHRR Pathfinder and VIIRS data products, respectively (https://coastwatch.pfeg.noaa.gov/) to examine localized differences in these two potential drivers of spatial differences in bleaching susceptibility8,11,16,31. Site-level chlorophyll-a concentrations were derived for outer reefs from our satellite data by averaging the nearest six-cell values, and sea surface temperatures from the nearest two-cell values due to lower resolution. Shallow reef pixels were excluded from satellite-derived data because reef-associated pixels provide false estimates of chlorophyll-a and temperature depending on the size and shape of the reefs.
Finally, given a previous study which partitioned the contribution of different stressors, including fishing pressure and pollution, on Yap’s reefs and found that fishing pressure was a primary determinant of reef condition32, we accessed data on fish biomass from the long-term Micronesia Reef Monitoring database as an additional metric of human impact (https://micronesiareefmonitoring.com/). Fish data were collected using replicate, stationary-point-count surveys along five 50-m transects across 20 sites, stratified by reef type and MPA status25,32. While species-level data were collected during long-term monitoring, the fish-biomass data used in the present study were binned into six major guilds: (i) small herbivores/detritivores, (ii) large herbivores/detritivores, (iii) Bolbometopon muricatum, (iv) small secondary consumers, (v) large secondary consumers, and (vi) tertiary consumers (defined further by Houk et al.33). Temporal trends in fish biomass were graphically highlighted for outer reefs where data were collected near the present study sites used in the bleaching assessment.
Data analysis
Coral cover and bleaching prevalence were visually compared by aggregating data at the site level and plotting proportional circles for both metrics on a map of the island. To compare bleaching prevalence across geographical sectors and reef types, while taking taxonomic differences in bleaching susceptibility into account, we used a linear mixed-effects model approach using the R package lme434. Random effects were coral genera and transects within sites. Data on bleaching prevalence were used for each genus so that we did not violate any assumptions of independence when comparing across genera. Post-hoc comparisons were conducted when significant overall variation was detected across the geographic sectors, or between reef types. Both additive and interactive models were tested for the best fit, which was determined by Chi-Square examinations of the residuals and the Akaike Information Criterion (AIC). We also used standard least-squares regression models to examine the relationships between coral cover and bleaching prevalence within each coral genus. Additionally, to visualize spatial and taxonomic trends in bleaching, we created a heatmap organized by geography and reef type, using hierarchical clustering based on Bray–Curtis dissimilarities.
Given the observed spatial patterns in bleaching prevalence, we investigated potential associations between sea-surface temperature, chlorophyll-a, and bleaching prevalence for Yap’s outer reefs, where satellite observations were not influenced by shallow reef pixels. Linear mixed-effects models were used to compare bleaching prevalence against chlorophyll-a, sea-surface temperature, and their potential interaction. Models with both random slopes and intercepts for coral genera were investigated to account for potential differences in susceptibility to bleaching and magnitude of influence with chlorophyll-a. Sea-surface temperature data did not significantly improve model fit and were therefore excluded from our final model. All analyses were undertaken in R version 4.2.135.
Results
The first widespread coral bleaching event in Yap started in August 2020 and extended until November 2020, when the 8 °C-weeks threshold was surpassed for nearly three months (Fig. 1). Island-wide, 21% (SD = 14%) of coral cover was affected by bleaching; however, all reefs were not impacted equally. While inner reefs supported higher overall coral cover (M = 41%, SD = 22%) than outer reefs (M = 18%, SD = 4%), only 10% (SD = 9%) of the coral cover on inner reefs bleached, whereas 31% (SD = 9%) of the coral cover on outer reefs bleached (Fig. 2). Bleaching patterns also varied depending on coral genera, reef type, and geography.
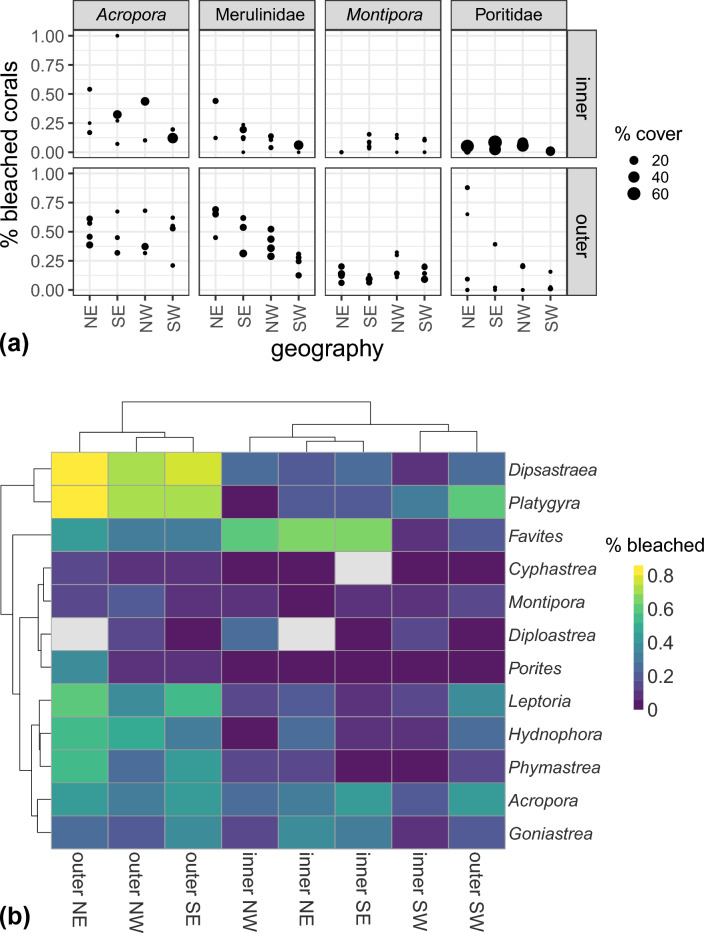
Corals in the genera Acropora, Montipora, and Porites, along with many genera within the family Merulinidae, were dominant on Yap’s reefs (Fig. 3, Supplementary Fig. S1). Porites dominated inner reefs whereas a more even coverage of all genera existed on outer reefs (Fig. 3a). Despite differences in coral community composition between reef types, linear mixed-effects models revealed that the prevalence of coral bleaching was significantly lower on inner reefs than on outer reefs for all genera (Table 1). Interestingly, geographic sector was also a significant predictor of bleaching prevalence for both inner and outer reefs. Bleaching was highest on northeastern reefs and lowest on southwestern reefs across all coral taxa (Table 1).
Figure 3.
Trends in (a) coral cover and bleaching intensity for major compositional taxa across reef type and geographic quadrant. Circles represent individual sites within each geographic quadrant, and the size of each circle is proportional to coral cover at the corresponding site. (b) Similarities in bleaching response were grouped by geographical quadrant/reef type and coral genera. Dendrograms depict similarities in bleaching responses across coral genera, colors indicate proportional bleaching.
Table 1.
Estimated coefficients and standard errors for the Linear Mixed Effects models for coral bleaching in Yap, Micronesia, in 2020.
| Bleaching prevalence model | Chlorophyll-a/bleaching resistance model | |
|---|---|---|
| Dependent variable | ||
| Proportion bleached | Proportion bleached (outer reefs) | |
| NW | − 0.102** (0.032) | |
| SE | − 0.081* (0.033) | |
| SW | − 0.178*** (0.033) | |
| Reef type—outer | 0.175*** (0.024) | |
| Chlorophyll-a | − 7.197*** (2.263) | |
| Constant | 0.255*** (0.051) | 0.820*** (0.192) |
| Observations | 269 | 169 |
| Log likelihood | 43.718 | 40.244 |
| Akaike Inf. crit | − 73.437 | − 68.487 |
| Bayesian Inf. crit | − 48.274 | − 49.708 |
Asterisks indicate the degree of significance.
*p < 0.05; **p < 0.01; ***p < 0.001.
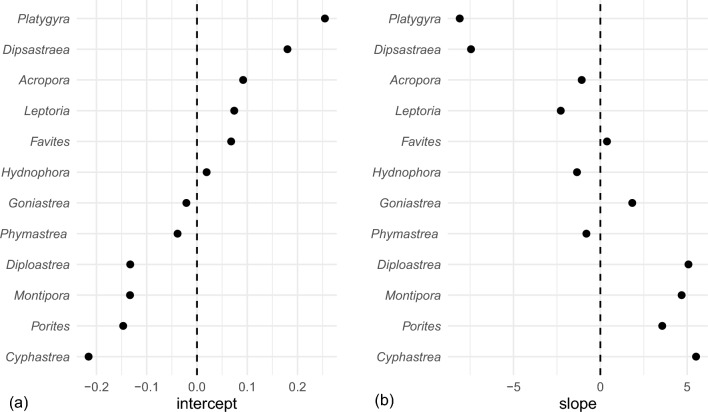
Significant random effects indicated which genera were most vulnerable to the thermal-stress event (Fig. 4a). Among the dominant genera, Acropora (M = 36%, SD = 17%), Platygyra (M = 56%, SD = 30%), Dipsastraea (M = 47%, SD = 31%), Leptoria (M = 38%, SD = 25%), Favites (M = 37%, SD = 23%), and Hydnophora (M = 30%, SD = 23%) were most sensitive to bleaching. By contrast, the most resistant corals were Porites (M = 10%, SD = 19%), Cyphastrea (M = 7%, SD = 10%), Diploastrea (M = 10%, SD = 17%), and Montipora (M = 12%, SD = 8%). No significant relationships were observed between coral cover and bleaching prevalence for any dominant genera. Thus, while coral composition and cover differed around Yap, these factors were either controlled for as random effects or were non-significant predictors of bleaching prevalence. Therefore, consistent patterns of bleaching prevalence that existed across reef types and geography, for all coral taxa, appeared to be related to different environmental settings.
Figure 4.
Random effects associated with linear mixed effects modeling. Random intercepts (a) of the bleaching-prevalence model highlight which coral genera were most sensitive or resistant to heat stress. Random slopes (b) of the chlorophyll-a-bleaching-resistance model indicate the relative magnitude of the relationship between bleaching prevalence and chlorophyll-a for each coral genus.
Cluster analyses revealed similar patterns in bleaching susceptibility to those described above for the major taxa across the geographic quadrants and reef types (Fig. 3b). For reefs in the northeastern, northwestern, and southeastern sectors, patterns in bleaching appeared to be most strongly influenced by reef type, with outer reefs experiencing the highest bleaching prevalence. However, the southwestern reefs showed a high affinity and separation in the cluster analysis, suggesting a different environmental setting than elsewhere in Yap.
While satellite data indicated that sea-surface temperatures were relatively uniform around the island during the bleaching event, and over the past 10 years (Supplementary Fig. S2), 10-year primary productivity was more spatially variable. Higher concentrations of chlorophyll-a were observed along the leeward, west coast than along with the exposed, east coast, and a distinct hotspot was noted in the southwestern quadrant (Fig. 5). Linear mixed effects model revealed that chlorophyll-a significantly reduced bleaching prevalence for all genera on outer reefs except Montipora and Diploastrea (Table 1, Supplementary Fig. S3). Interestingly, the magnitude (i.e. slope) of this relationship was greatest for coral genera with the greatest bleaching susceptibility (Fig. 4).
Figure 5.
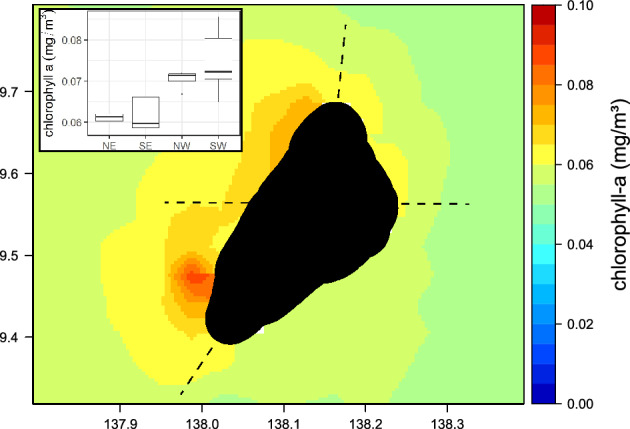
Ten-year long-term chlorophyll-a data between 2010 and 2020 (mg m−3), obtained from NOAA VIIRS server (https://coastwatch.pfeg.noaa.gov/), for Yap. Raster data were interpolated to create a smooth vector surface. Boxplots indicate chlorophyll-a concentrations at outer reef sites within each of the geographic quadrants (NE northeast, SE southeast, NW northwest, SW southwest).
Additionally, we found that southwestern reefs, where primary productivity was greatest, also consistently supported the highest fish biomass around the island, exceeding island-wide averages by approximately 30% (Fig. 6).
Figure 6.
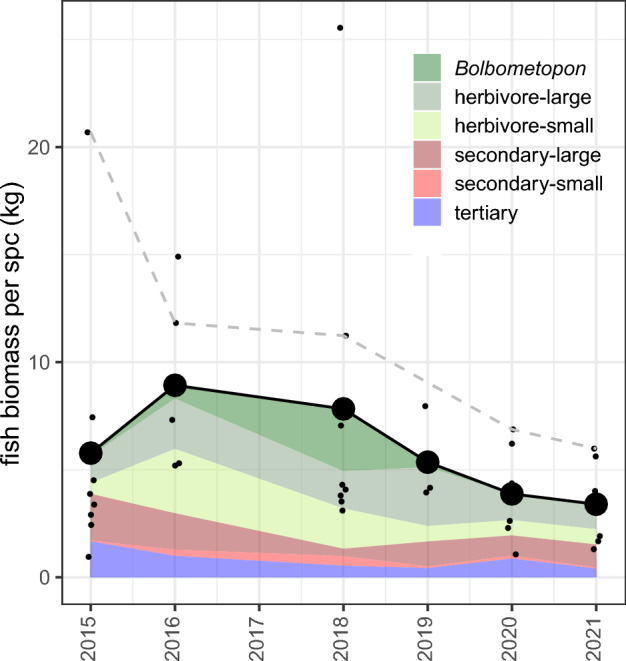
Trends in fish biomass from replicate stationary-point-count (SPC) surveys for Yap. Colors indicate fish guilds. Small black dots indicate individual reefs, whereas large black dots indicate annual means. Dashed line indicates fish biomass at one long-term site associated with the southwestern quadrant where enhanced productivity was observed.
Discussion
Yap was one of the few Pacific islands to escape major thermal stress and coral bleaching over the past three decades. The island’s first major coral bleaching event occurred in the late summer of 2020 when unprecedented heat stress caused 21% of shallow-water corals to bleach. However, there was significant variability among coral genera, across reef types, and among geographic quadrants. Taxonomic trends generally followed studies in other parts of the Indo-Pacific, with thermally-tolerant genera including Cyphastrea, Diploastrea, and Porites experiencing less bleaching than thermally-sensitive genera, such as Acropora36–38. Yet, Montipora, which is reported among the most sensitive corals36,37, experienced comparatively low bleaching in Yap. Conversely, Dipsastraea (formerly Favia) and Platygyra, which are reported among the more resilient corals7,38, experienced the most severe bleaching across all reef locations. Our findings reinforce that, while general taxonomic trends tend to be well established for dominant corals such as Porites and Acropora, there are differences in coral bleaching susceptibility across biogeographic regions.
At the local scale, the present study showed more extensive bleaching on outer reefs than inner. The high bleaching resistance of Yap’s inner reefs was similar to reports from nearby Palau, where corals on reefs in sheltered bays exhibited lower bleaching prevalence during a 2010 thermal-stress event13. Greater resistance to bleaching in Palau’s bays was attributed to moderate turbidity which reduced irradiance. These findings echoed observations from Bermuda, where bleaching was lowest for coral colonies on inshore reefs39. Similarly, on the Great Barrier Reef, Morgan and colleagues40 showed lower bleaching on turbid reefs than elsewhere, despite high thermal stress. Our findings supported the conclusions of these studies and suggested that the stress-tolerant coral communities and turbid conditions of inner reefs make them potential refugia against climate change. However, we add that moderate productivity may also contribute to bleaching resistance and may be difficult to disentangle from turbidity.
Despite little temperature variability around the island, we showed differences in the prevalence of bleaching across Yap’s four geographic quadrants. Windward reefs in the northeast were most heavily impacted by thermal stress and leeward reefs in the southwest were most resistant. McClanahan and colleagues12 described similar geographic trends around the island of Mauritius and concluded that higher water flow on windward reefs reduced background stressors and stabilized environmental conditions, leading to the establishment of less thermally-tolerant coral communities. Alternatively, we suggest that productivity contributed to our spatial trends as coral bleaching resistance was greatest where chlorophyll-a concentrations were moderately elevated.
The accumulation of chlorophyll-a along the leeward coast was attributed to the ‘island mass effect’, whereby oceanographic eddies form in the wake of islands which enhance productivity41,42. Variation in nearshore productivity has been linked to trophic ecology with one model coral, Pocillopora meandrina, acquiring a greater proportion of its nutrition heterotrophically in regions of high primary productivity43. While not applicable to all species, similar variations in heterotrophy may have contributed to the observed resistance to bleaching among productive reefs44. In support, Hughes et al. (Extended Data Table 1)8 showed that chlorophyll-a reduced the impact of thermal stress on corals across the Great Barrier Reef based upon concentrations that were approximately one order of magnitude greater than on the southwest reefs of Yap. We synthesize that the moderate productivity found on inner and southwestern reefs may have induced bleaching resistance by (i) providing a supplemental food source for corals able to utilize a heterotrophic diet during periods of autotrophic stress, and (ii) shading corals from the interaction between high temperatures and high irradiance during the bleaching event. While further work is required to appreciate the influences of nutrients, shading, primary production on bleaching resistance, our findings suggest that the most susceptible corals to thermal and irradiance stress experienced the greatest benefits most from these two mechanisms.
Our findings of increased bleaching resistance of corals where chlorophyll-a was moderate add to the rapidly increasing literature involving coral bleaching susceptibility in response to thermal stress, chlorophyll-a, and nutrient concentrations15,17,19–21,45–48. Given the contrasting reports of coral bleaching intensity at differing levels of productivity, in combination, these studies suggest that a hump-shaped relationship may exist between productivity in the water column and coral-bleaching resistance. Increasing productivity in the water column increases bleaching resistance up to a threshold, beyond which high productivity may become detrimental for corals. In support, coral growth has long been known to exhibit a humped relationship with suspended organic matter49 and a similar relationship between nutrients and species diversity drives the classic ‘paradox of enrichment’50. Yet, moderate productivity likely acts in concert with other environmental regimes to determine bleaching resistance across local scales.
The inverse relationship between sensitivity to thermal stress in and out of moderately productive areas (Fig. 4) suggests that areas of moderate productivity, such as those found in Yap’s southwest, may act as refugia for otherwise thermally sensitive coral populations. In order to preserve these thermally resistant southwestern reefs, additional protection from local fishing pressure and land-based pollution may be warranted. Unfortunately, long-term fisheries monitoring data for Yap suggested that the high-fish biomass once evident in southwestern reefs is now declining faster than on other reefs. Furthermore, previous studies have shown that fishing pressure is highest among inner reefs, close to humans, and with low wind-wave exposure24. Using MPAs as one management tool, our results can help guide MPA placement, timing, and duration. For example, the implementation of temporary protection during and after heat stress may be warranted for exposed northern and eastern reefs, where the greatest coral impacts were observed. Temporary MPAs, for 3–4 years, would maximize the beneficial responses of fish assemblages following bleaching, as observed across Micronesia33. By contrast, long-term fisheries management efforts may be prioritized on leeward reefs that are easily accessed because of low wave energy, and are located near eddies that fuel fisheries production, larval retention, and anecdotal spawning aggregations.
In conclusion, our study revealed that the resistance of corals to an unprecedented thermal-stress event on Yap was highest among inner and southwestern reefs where moderate chlorophyll-a concentrations existed. While differences in thermal resistance across reef types have been well established13,39, our findings of resistance along Yap’s southwestern reefs, associated with oceanographic productivity, were novel but likely acted in concert with other factors including differences in irradiance associated with changes in productivity. Spatial patterns in bleaching resistance around Yap suggested that heat-stress mitigation strategies should be incorporated into evolving management strategies that deal with both local and global stressors.
Supplementary Information
Acknowledgements
Financial support was provided by the National Oceanic and Atmospheric Administration Coral Conservation Program and the Micronesia Conservation Trust to authors P.H., R.K., A.Y., and J.N. The authors are grateful for the support of the coastal communities in Yap that allowed access to the study reefs during the bleaching event.
Author contributions
R.K., P.H., J.N., A.Y., R.W.—study inception; A.Y., J.N.—data collection; R.K., A.Y., J.N., P.H. data curation and analyses, R.K., A.Y., J.N., R.W., P.H.—writing.
Data availability
Competing interests
The authors declare no competing interests.
Footnotes
Publisher's note
Springer Nature remains neutral with regard to jurisdictional claims in published maps and institutional affiliations.
Supplementary Information
The online version contains supplementary material available at 10.1038/s41598-023-36355-2.
References
- 1.Donner SD. Coping with commitment: Projected thermal stress on coral reefs under different future scenarios. PLoS ONE. 2009;4:e5712. doi: 10.1371/journal.pone.0005712. [DOI] [PMC free article] [PubMed] [Google Scholar]
- 2.Glynn PW. Widespread coral mortality and the 1982–83 El Nino Warming Event. Environ. Conserv. 1984;11:133–146. doi: 10.1017/S0376892900013825. [DOI] [Google Scholar]
- 3.Douglas AE. Coral bleaching––How and why? Mar. Pollut. Bull. 2003;46:385–392. doi: 10.1016/S0025-326X(03)00037-7. [DOI] [PubMed] [Google Scholar]
- 4.Eakin CM, Sweatman HPA, Brainard RE. The 2014–2017 global-scale coral bleaching event: Insights and impacts. Coral Reefs. 2019;38:539–545. doi: 10.1007/s00338-019-01844-2. [DOI] [Google Scholar]
- 5.Sully S, Burkepile DE, Donovan MK, Hodgson G, van Woesik R. A global analysis of coral bleaching over the past two decades. Nat. Commun. 2019;10:1264. doi: 10.1038/s41467-019-09238-2. [DOI] [PMC free article] [PubMed] [Google Scholar]
- 6.Marshall PA, Baird AH. Bleaching of corals on the Great Barrier Reef: Differential susceptibilities among taxa. Coral Reefs. 2000;19:155–163. doi: 10.1007/s003380000086. [DOI] [Google Scholar]
- 7.Loya Y, et al. Coral bleaching: The winners and the losers. Ecol. Lett. 2001;4:122–131. doi: 10.1046/j.1461-0248.2001.00203.x. [DOI] [Google Scholar]
- 8.Hughes TP, et al. Global warming and recurrent mass bleaching of corals. Nature. 2017;543:373–377. doi: 10.1038/nature21707. [DOI] [PubMed] [Google Scholar]
- 9.Skirving WJ, et al. The relentless march of mass coral bleaching: A global perspective of changing heat stress. Coral Reefs. 2019;38:547–557. doi: 10.1007/s00338-019-01799-4. [DOI] [Google Scholar]
- 10.Hughes TP, et al. Climate change, human impacts, and the resilience of coral reefs. Science. 2003;1979(301):929–933. doi: 10.1126/science.1085046. [DOI] [PubMed] [Google Scholar]
- 11.Sully S, Woesik R. Turbid reefs moderate coral bleaching under climate-related temperature stress. Glob. Change Biol. 2020;26:1367–1373. doi: 10.1111/gcb.14948. [DOI] [PMC free article] [PubMed] [Google Scholar]
- 12.McClanahan T, Maina J, Moothien-Pillay R, Baker A. Effects of geography, taxa, water flow, and temperature variation on coral bleaching intensity in Mauritius. Mar. Ecol. Prog. Ser. 2005;298:131–142. doi: 10.3354/meps298131. [DOI] [Google Scholar]
- 13.Van Woesik R, et al. Climate-change refugia in the sheltered bays of Palau: Analogs of future reefs. Ecol. Evol. 2012;2:2474–2484. doi: 10.1002/ece3.363. [DOI] [PMC free article] [PubMed] [Google Scholar]
- 14.Teixeira CD, et al. Sustained mass coral bleaching (2016–2017) in Brazilian turbid-zone reefs: Taxonomic, cross-shelf and habitat-related trends. Coral Reefs. 2019;38:801–813. doi: 10.1007/s00338-019-01789-6. [DOI] [Google Scholar]
- 15.Wagner D, Kramer P, van Woesik R. Species composition, habitat, and water quality influence coral bleaching in southern Florida. Mar. Ecol. Prog. Ser. 2010;408:65–78. doi: 10.3354/meps08584. [DOI] [Google Scholar]
- 16.Wooldridge SA, Done TJ. Improved water quality can ameliorate effects of climate change on corals. Ecol. Appl. 2009;19:1492–1499. doi: 10.1890/08-0963.1. [DOI] [PubMed] [Google Scholar]
- 17.Donovan MK, et al. Local conditions magnify coral loss after marine heatwaves. Science. 2021;1979(372):977–980. doi: 10.1126/science.abd9464. [DOI] [PubMed] [Google Scholar]
- 18.Dobson KL, et al. Moderate nutrient concentrations are not detrimental to corals under future ocean conditions. Mar. Biol. 2021;168:98. doi: 10.1007/s00227-021-03901-3. [DOI] [Google Scholar]
- 19.Han JHJ, Stefanak MP, Rodgers KS. Low-level nutrient enrichment during thermal stress delays bleaching and ameliorates calcification in three Hawaiian reef coral species. PeerJ. 2022;10:e13707. doi: 10.7717/peerj.13707. [DOI] [PMC free article] [PubMed] [Google Scholar]
- 20.Burkepile DE, et al. Nitrogen identity drives differential impacts of nutrients on coral bleaching and mortality. Ecosystems. 2020;23:798–811. doi: 10.1007/s10021-019-00433-2. [DOI] [Google Scholar]
- 21.Vega Thurber RL, et al. Chronic nutrient enrichment increases prevalence and severity of coral disease and bleaching. Glob. Change Biol. 2014;20:544–554. doi: 10.1111/gcb.12450. [DOI] [PubMed] [Google Scholar]
- 22.Wiedenmann J, et al. Nutrient enrichment can increase the susceptibility of reef corals to bleaching. Nat. Clim. Change. 2013;3:160–164. doi: 10.1038/nclimate1661. [DOI] [Google Scholar]
- 23.Tafileichig A, Inoue A. Marine resources in Yap State, FSM: The current status of customary and traditional regulation. Kagoshima Univ. Res. Centre Pacific Islands Occas. Pap. 2001;34:113–116. [Google Scholar]
- 24.Johnson SM, Reyuw BM, Yalon A, McLean M, Houk P. Contextualizing the social-ecological outcomes of coral reef fisheries management. Biol. Conserv. 2020;241:108288. doi: 10.1016/j.biocon.2019.108288. [DOI] [Google Scholar]
- 25.Houk P, Benavente D, Fread V. Characterization and evaluation of coral reefs around Yap Proper, Federated States of Micronesia. Biodivers. Conserv. 2012;21:2045–2059. doi: 10.1007/s10531-012-0296-0. [DOI] [Google Scholar]
- 26.Houk P, et al. Predicting coral-reef futures from El Niño and Pacific Decadal Oscillation events. Sci. Rep. 2020 doi: 10.1038/s41598-020-64411-8. [DOI] [PMC free article] [PubMed] [Google Scholar]
- 27.Kayanne H. Validation of degree heating weeks as a coral bleaching index in the northwestern Pacific. Coral Reefs. 2017;36:63–70. doi: 10.1007/s00338-016-1524-y. [DOI] [Google Scholar]
- 28.Veron JEN. Corals of the World. Australian Institute for Marine Sciences; 2000. [Google Scholar]
- 29.Budd AF, Bosellini FR. Revision of Oligocene Mediterranean meandroid corals in the scleractinian families Mussidae, Merulinidae and Lobophylliidae. J. Syst. Palaeontol. 2016;14:771–798. doi: 10.1080/14772019.2015.1102171. [DOI] [Google Scholar]
- 30.Huang D, et al. Taxonomic classification of the reef coral families Merulinidae, Montastraeidae, and Diploastraeidae (Cnidaria: Anthozoa: Scleractinia) Zool J Linn Soc. 2014;171:277–355. doi: 10.1111/zoj.12140. [DOI] [Google Scholar]
- 31.Conti-Jerpe IE, et al. Trophic strategy and bleaching resistance in reef-building corals. Sci. Adv. 2020 doi: 10.1126/sciadv.aaz5443. [DOI] [PMC free article] [PubMed] [Google Scholar]
- 32.Houk P, et al. The Micronesia challenge: Assessing the relative contribution of stressors on coral reefs to facilitate science-to-management feedback. PLoS ONE. 2015;10:e0130823. doi: 10.1371/journal.pone.0130823. [DOI] [PMC free article] [PubMed] [Google Scholar]
- 33.Houk P, et al. Climate change disturbances contextualize the outcomes of coral-reef fisheries management across Micronesia. PLOS Climate. 2022;1:e0000040. doi: 10.1371/journal.pclm.0000040. [DOI] [Google Scholar]
- 34.Bates D, Mächler M, Bolker B, Walker S. Fitting Linear Mixed-Effects Models Using lme4. J. Stat. Softw. 2015 doi: 10.18637/jss.v067.i01. [DOI] [Google Scholar]
- 35.R Core Team. R: A language and environment for statistical computing. (2022).
- 36.McClanahan T, et al. Western Indian Ocean coral communities: Bleaching responses and susceptibility to extinction. Mar. Ecol. Prog. Ser. 2007;337:1–13. doi: 10.3354/meps337001. [DOI] [Google Scholar]
- 37.McClanahan TR, et al. Large geographic variability in the resistance of corals to thermal stress. Glob. Ecol. Biogeogr. 2020;29:2229–2247. doi: 10.1111/geb.13191. [DOI] [Google Scholar]
- 38.Paulay G, Benayahu Y. Patterns and consequences of coral bleaching in Micronesia (Majuro and Guam) in 1992–1994. Micronesica. 1999;31:109–124. [Google Scholar]
- 39.Cook CB, Logan A, Ward J, Luckhurst B, Berg CJ. Elevated temperatures and bleaching on a high latitude coral reef: The 1988 Bermuda event. Coral Reefs. 1990;9:45–49. doi: 10.1007/BF00686721. [DOI] [Google Scholar]
- 40.Morgan KM, Perry CT, Johnson JA, Smithers SG. Nearshore Turbid-Zone corals exhibit high bleaching tolerance on the great barrier reef following the 2016 ocean warming event. Front. Mar. Sci. 2017 doi: 10.3389/fmars.2017.00224. [DOI] [Google Scholar]
- 41.Elliott, J., Patterson, M. & Gleiber, M. Detecting ‘Island Mass Effect’ through remote sensing. in Proceedings of the 12th International Coral Reef Symposium, 5A Remote sensing of reef environments 9–13 (2012).
- 42.Heywood KJ, Barton ED, Simpson JH. The effects of flow disturbance by an oceanic island. J. Mar. Res. 1990;48:55–73. doi: 10.1357/002224090784984623. [DOI] [Google Scholar]
- 43.Fox MD, et al. Gradients in primary production predict trophic strategies of mixotrophic corals across spatial scales. Curr. Biol. 2018;28:3355–3363.e4. doi: 10.1016/j.cub.2018.08.057. [DOI] [PubMed] [Google Scholar]
- 44.Grottoli AG, Rodrigues LJ, Palardy JE. Heterotrophic plasticity and resilience in bleached corals. Nature. 2006;440:1186–1189. doi: 10.1038/nature04565. [DOI] [PubMed] [Google Scholar]
- 45.van Woesik R, McCaffrey KR. Repeated thermal stress, shading, and directional selection in the Florida reef tract. Front. Mar. Sci. 2017 doi: 10.3389/fmars.2017.00182. [DOI] [Google Scholar]
- 46.de Barros Marangoni LF, Ferrier-Pagès C, Rottier C, Bianchini A, Grover R. Unravelling the different causes of nitrate and ammonium effects on coral bleaching. Sci. Rep. 2020;10:11975. doi: 10.1038/s41598-020-68916-0. [DOI] [PMC free article] [PubMed] [Google Scholar]
- 47.DeCarlo TM, et al. Nutrient-supplying ocean currents modulate coral bleaching susceptibility. Sci. Adv. 2020 doi: 10.1126/sciadv.abc5493. [DOI] [PMC free article] [PubMed] [Google Scholar]
- 48.Bell PRF, Elmetri I, Lapointe BE. Evidence of Large-scale chronic eutrophication in the great Barrier Reef: Quantification of chlorophyll a thresholds for sustaining coral Reef communities. Ambio. 2014;43:361–376. doi: 10.1007/s13280-013-0443-1. [DOI] [PMC free article] [PubMed] [Google Scholar]
- 49.Tomascik T, Sander F. Effects of eutrophication on reef-building corals. Mar. Biol. 1987;94:53–75. doi: 10.1007/BF00392900. [DOI] [Google Scholar]
- 50.Rosenzweig ML. Paradox of enrichment: Destabilization of exploitation ecosystems in ecological time. Science. 1971;1979(171):385–387. doi: 10.1126/science.171.3969.385. [DOI] [PubMed] [Google Scholar]
Associated Data
This section collects any data citations, data availability statements, or supplementary materials included in this article.


