


Abstract
We have designed histidylated oligolysines which increase the uptake, the cytosolic delivery and the nuclear accumulation of antisense oligonucleotides (ODN). Flow cytometry analysis showed a 10-fold enhancement of the ODN uptake in the presence of histidylated oligolysines. The intracellular localizations of fluorescein-labeled ODN and of rhodamine-labeled histidylated oligolysines were investigated by confocal microscopy. Histidylated oligolysines favor the cytosolic delivery of ODN from endosomes and increase their nuclear accumulation. In contrast, in their absence fluorescent ODN were not observed inside the nucleus but were distributed overwhelmingly within the vesicles in the cytosol. In addition, histidylated oligolysines yielded a more than 20-fold enhancement of the biological activity of antisense ODN towards the inhibition of transient as well as constitutive gene expression. Prevention of endosome lumen acidification using bafilomycin A1 abolished the effect of histidylated oligolysines, suggesting that protonation of the histidyl residues was involved in the transmembrane passage of ODN.
INTRODUCTION
Antisense oligonucleotides (ODN) are attractive potential drugs able to inhibit or regulate gene expression (1). These last years, the field of ODN has grown very quickly. Several chemical modifications have been performed to increase the stability of ODN towards nucleases and to increase their cellular uptake. A variety of different macromolecules as carriers have been designed but, so far, their therapeutic application is still limited (2,3). In spite of these efforts, the efficiency of ODN has not increased drastically. Studies on the intracellular location of ODN pointed out that in a majority of cell types, once taken up most ODN are confined inside vesicles and only a small amount finds its way to the RNA or DNA targets (4–6). ODN complexed with a glycosylated polylysine were taken up by cells more efficiently compared to plain ODN, but despite the enhanced cell uptake, an increase in their biological activity required the presence of chloroquine, which helps ODN to escape from the endocytic vesicles (7). Because of their low molecular mass, once in the cytosol ODN penetrate rapidly into the nucleus (8–11). Therefore, an increase in ODN delivery into the cytosol upon endocytosis is expected to increase their biological activity. Strategies using devices including fusogenic and/or permeabilizing peptides which permeabilize the membranes of ODN-containing vesicles have been developped (12–14). Anionic amphipathic peptides derived from the N-terminal fragment of the HA2 subunit of the influenza virus hemagglutinin did not significantly enhance the biological activity of ODN even when the peptides were linked to ODN (13). The amount of peptides present inside endosomes was probably too low. Conversely, when the plasma membrane was permeabilized by these anionic peptides upon acidification of the extracellular medium, ODN readily penetrated to the cell nucleus (15). Recently, several reports have shown that carrier molecules including liposomes and cationic polymers containing imidazole groups increase gene as well as ODN transfer: (i) liposomes containing imidazole-substituted lipids were found to increase the gene transfer efficiency (16) and antisense ODN efficiency (17); (ii) the peptide GLFHAIAHFIHGGWHGLIHGWYG permeabilizes the cell membrane at a slightly acidic pH (pH 6.4) and favors gene transfer mediated by glycosylated polylysine/DNA complexes (18); and (iii) histidylated polylysine increased gene transfer (19). Poly-l-histidine mediates an acid-dependent fusion and leakage of negatively charged liposomes after protonation of the imidazole group of histidyl monomers (the pK of which is ~6.0) (20,21). While partially histidylated polylysine was not efficient in the transfer of oligonucleotides, we found that histidylated oligolysines were efficient.
We show in this paper that histidylated oligolysines allow ODN to accumulate in the nucleus. Histidylated oligolysines increased the biological efficiency of antisense ODN directed against the ICAM-1 gene in a TNF-α-induced ICAM-1 gene expression assay and that of antisense ODN directed against the HIV-1 gag gene in a constitutive expression model. The effect of histidylated oligolysines is supposed to involve protonation of the imidazole groups in the acid lumen of endosomes because both ODN delivery into the cytosol and ODN biological activity were inhibited by bafilomycin A1.
MATERIALS AND METHODS
Preparation of histidylated oligolysines (HoK)
Oligolysine [poly-l-lysine, HBr salt, average molecular weight 3950, average degree of polymerization (DP) 19; Bachem Feinchemikalien, Bubendorf, Switzerland] was changed to oligolysine, p-toluene sulfonate salt, as described previously (22).
Preparation of HoK1. Oligolysine, p-toluene sulfonate salt (50 mg, 8.6 µmol) in 2 ml dimethylsulfoxide (Aldrich, Strasbourg, France) in the presence of diisopropylethylamine (50 µl, 344 µmol) (Aldrich) was reacted for 20 h at 20°C with (Boc)His(Boc)-OH (64 mg, 146 µmol) (Novabiochem, Bad Soden, Germany) in the presence of benzotriazol-1-yl-oxy-tris-(dimethylamino)-phosphonium hexafluorophosphate (BOP) (159 mg, 358 µmol) (Richelieu Biotechnology, Saint Hyacinthe, Canada). The unreacted ɛ-amino groups of the oligomer were then substituted with gluconoyl residues as previously described (22). The N-protecting Boc group was removed after adding 10 vol of a H2O/trifluoroacetic acid mixture (1:1 v/v) for 24 h at 20°C. Water and trifluoroacetic acid were removed under reduced pressure. The oligomer was precipitated by adding 10 vol of isopropanol and centrifuged (1800 g for 15 min). The pellet was washed with isopropanol, collected by centrifugation (1800 g for 15 min), solubilized in distilled water and freeze dried. The average number of histidyl residues bound per oligolysine molecule determined by 1H-NMR spectroscopy using the value of the integrated signal at 8.7 p.p.m. corresponding to the proton (1H C12) (see Fig. 1) of histidyl residues, as previously described (19), was found to be 12. The average number of gluconoyl residues bound per HoK1 molecule determined by 1H-NMR spectroscopy as previously described (22) was found to be three. The average number of free ɛ-amino groups left per HoK1 molecule was calculated to be four. HoK1 was labeled with rhodamine by reaction with tetramethylrhodamine isothiocyanate (TRITC mixed isomers; Molecular Probes, La Jolla, CA).
Figure 1.

Schematic structure of histidylated oligolysines. HoK1, R = NH3+ (25%), histidylamido (60%) and gluconoylamido (15%); HoK2, R = NH3+ (10%), histidylamido (75%) and acetylamido (15%); HoK3, R = NH3+ (10%), N-acetyl-histidylamido (75%) and acetylamido (15%).
Preparation of HoK2. Oligolysine, p-toluene sulfonate salt (80 mg, 13.7 µmol) in 3 ml dimethylsulfoxide in the presence of diisopropylethylamine (90 µl, 620 µmol) was reacted for 6 h at 20°C with the N-succinimidyl derivative of (Boc)His(Boc)-OH (92 mg, 204 µmol) (Bachem Feinchemikalien). The unsubstituted ɛ-amino groups of the oligomer was then acetylated with acetic anhydride (Aldrich) for 30 min at 20°C. The average number of histidyl residues bound per HoK2 molecule was found to be 15. The average number of acetyl residues on the HoK2 molecule, determined by 1H-NMR spectroscopy from the integrated value of the 2.04 p.p.m. peak corresponding to the three protons of acetyl residues, was found to be three. The average number of remaining free ɛ-amino groups per HoK2 molecule was one.
Preparation of HoK3. Oligolysine, p-toluene sulfonate salt (85 mg, 14.6 µmol) in 3 ml dimethylsulfoxide was reacted for 20 h at 20°C with N-acetyl-His-OH (288 mg, 307 µmol) (Sigma) in the presence of diisopropylethylamine (80 µl, 555 µmol) and BOP (265 mg, 597 µmol). Similar treatments as described for HoK2 were then performed. The average number of histidyl residues per HoK3 molecule was found to be 15. The average number of remaining free ɛ-amino groups per HoK3 molecule was calculated to be one.
Oligonucleotides
GEM-91 (5′-CTC TCG CAC CCA TCT CTC TCC TTC T-3′), kindly provided by Dr S. Agrawal (Hybridon, Worcester, MA), is complementary to the AUG initiation site of the HIV-1 gag gene. ISIS 1939 (5′-CCC CCA CCA CTT CCC CTC T-3′), targeted to the 3′ non-coding region of ICAM-1 mRNA (23), and a 20mer phosphorothioate ODN of random sequence were supplied by Eurogentec (Seraing, Belgium). GEM-91 was fluoresceinylated (F-PS-ODN) on some of its non-bridging sulfurs of the internucleotidic phosphorothioate linkages as previously described (24). A phosphodiester oligonucleotide (PO-ODN) complementary to the AUG initiation site of the HIV-1 gag gene (25mer, 5′-CTC TCG CCA TCT CTC TCC TTC T-3′) was supplied by Eurogentec (Seraing, Belgium). The 5′-end was substituted by an alkyl dithiopyridine moiety and the 3′-end by an alkylamine: pyridyl-S-S-R1-(5′-ODN-3′)-R2-NH2, where R1 = (CH2)6-O-PO2– and R2 = PO2–-O-(CH2)6. These modifications protect PO-ODN from exonuclease degradation. The PO-ODN was fluoresceinylated (F-PO-ODN) as previously described (25).
Cell culture
Human non-small cell lung carcinoma (A549) (ATCC CCL 185; ATCC, Rockville, MD), pRET-Luc and HepG2 human hepatoma (ATCC 8055 HB; ATCC) cells were cultured in DMEM (Gibco, Paisley, UK) containing 2 mM l-glutamine, 10% heat-inactivated fetal bovine serum (FBS), 100 U/ml penicillin and 100 µg/ml streptomycin (Gibco). The medium for pRET-Luc cells was supplemented with G418 (100 µg/ml) (Gibco).
pRET-Luc cells (kindly given by Dr Alain Legrand, CNRS, Orléans, France) express luciferase. These cells were established by transfection of Rb-1 cells (a rabbit smooth muscle cell line) (26) with the pRET plasmid encoding the firefly luciferase reporter (under the control of the human phosphoglycerate kinase promoter) and further selection by geneticin sulfate salts (G418). The sequence around the AUG codon of the luciferase gene was replaced by the initiator AUG codon and several downstream codons of the HIV-1 gag gene.
Cells were grown at 37°C in a humidified atmosphere containing 5% CO2/95% air. Cells were harvested after treatment at 37°C for 10 min with PBS containing 0.02% (w/v) EDTA and 2.5 µg/ml trypsin (Gibco). Cells were mycoplasma-free as evidenced by bisbenzimidazole (Hoeschst 33258) (27).
ODN uptake measurement by flow cytometry
A549 cells plated in 24-well plates (2 × 10⁵ cells/well) were incubated at 37°C in 0.5 ml culture medium containing F-PS-ODN either in the absence or presence of oligomers. Cells were washed once with PBS and then incubated twice for 5 min with 5 µM SdC28 in PBS in order to remove membrane-associated ODN (7). Cells were harvested by trypsin, washed with PBS, centrifuged (500 g for 5 min) and resuspended in sheath fluid (134 mM NaCl, 3.75 mM KCl, 15.2 mM NaF, 1.9 mM KH2PO4, 16.5 mM Na2HPO4 buffer, pH 7.4 containing 0.2% 2-phenoxyethanol). The cell fluorescence intensity was measured after post-incubation for 30 min at 4°C in the presence or absence of 50 µM monensin (Sigma) (28,29). Monensin treatment, which induces the neutralization of all acidic compartments, releaves fluorescein from quenching (30). The cell fluorescence intensity was recorded at 520 nm using a FACSort flow cytometer (Becton Dickinson, Le Pont de Claix, France) at an excitation wavelength of 488 nm and was expressed as the mean value of the fluorescence intensity of 5000 cells.
Laser scanning confocal microscopy analysis
Cells were seeded onto sterile coverslips in 20 mm wells (2 × 10⁵ cells/well) and allowed to adhere for 24 h. Oligomer (0.25 ml of a 40 µM solution in serum-free culture medium) and then F-PS-ODN (0.25 ml of a 0.25 µM solution in serum-free culture medium) were added to the cells and incubated for 4 h at 37°C. Cells were washed twice and incubated with fresh culture medium containing 10% FBS. Cells were fixed for 30 min at room temperature in PBS containing 20 mg/ml paraformaldehyde. Cells were washed and mounted on slides in a PBS/glycerol mixture (1:1 v/v) containing 10 mg/ml DABCO [2,4 diazabicyclo-(2,2,2)-octane] as an antifading agent (31). Cells were analyzed with a confocal microscope imaging system (MRC-1024; Bio-Rad) equipped with a Nikon Optiphot epifluorescence microscope (Nikon, Tokyo, Japan) and a Planapo objective (numerical aperture 1.4). The krypton/argon laser was tuned to produce a 488 nm fluorescein excitation and a 565 nm rhodamine excitation wavelength beam allowing simultaneous monitoring of both fluorescent signals and image merging. The diaphragm and fluorescence detection levels were adjusted to minimize the interference between the fluorescein and rhodamine channels. Pictures were recorded under a Kalman filter (an average of 10 images).
Inhibition of ICAM-1 expression in A549 cells
A549 cells were plated onto 96-well microtiter plates (104 cells/well). One day later, the culture medium was removed and the cells were washed. Oligomer (50 µl of a 40 µM solution in serum-free culture medium) and then ODN in 50 µl serum-free culture medium were added. After a 4 h incubation at 37°C, 0.1 ml of culture medium supplemented with 10% FBS and 10 ng/ml TNF-α (Gibco) was added to induce overexpression of ICAM-1. No TNF-α was added to assess basal ICAM-1 expression. The percentage of FBS was raised to 5% and, after 18 h incubation, cells were washed three times with PBS and fixed for 20 min at room temperature in PBS containing 20 mg/ml paraformaldehyde. Cells were washed and incubated for 90 min at 37°C with mouse anti-ICAM-1 antibody (Becton Dickinson), diluted 20 times in PBS containing 20 mg/ml BSA. Cells were washed three times with PBS and then incubated for 1 h at 37°C with a rabbit anti-mouse antibody–horseradish peroxidase conjugate (Becton Dickinson) diluted 2000 times in PBS containing 20 mg/ml BSA. After three washes, the peroxidase activity was assessed using 100 µl of o-phenylenediamine dihydrochloride (Sigma P-9187 peroxidase substrate tablet set) solution. After 15 min incubation at 37°C, the reaction was stopped by adding 25 µl of 3 N H2SO4 and the absorbance was read at 492 nm. The percentage of TNF-α-induced expression of ICAM-1 was calculated as follows: [(ATNF-αODN – A0)/(ATNF-α – A0)] × 100, where ATNF-αODN is the absorbance of ODN-treated and cytokine-induced cells, A0 the absorbance of cells incubated with no ODN and no TNF-α and ATNF-α the absorbance of cytokine-induced cells incubated without ODN.
RT–PCR
Total RNA was extracted from either untreated, ODN-treated or ODN + oligomer-treated A549 cells with guanidinium thiocyanate with selective precipitation and isopycnic centrifugation using lithium chloride and cesium trifluoroacetate according to the manufacturer’s procedure (Pharmacia Biotech). Total RNA (400 ng) was reverse transcribed and the resulting cDNA amplified using primer pairs specific for ICAM-1 [from position 1754, a 21mer (3′-GGT ACG TCG ATG TGG ATG GCC-5′) and from position 1261, a 22mer (5′-GAC TGG ACG AGA GGG ATT GTC C-3′)], giving a 606 bp amplicon, and primer pairs (5′-TGA AGG TCG GAG TCA ACG GAT TTG GT-3′ and 3′-CAT GTG GGC CAT GAG GTC CAC CAC-5′) specific for GAPDH, giving a 983 bp amplicon (Clontech, CA). The number of RT–PCR cycles was 33 for the ICAM-1 gene (94°C for 2 min, 57°C for 30 s, 72°C for 59 s) and 30 for the GAPDH gene (94°C for 2 min, 60°C for 30 s, 72°C for 2 min). RNA amplification products were analyzed by 1.8% agarose gel electrophoresis. Quantification was with a Videomicroscope (Bioprobe Systems) using Image Quant software (Molecular Dynamics) for data processing.
Inhibition of the luciferase activity in pRET-Luc cells
Oligomer (0.1 ml of a 40 µM solution in culture medium containing 2% FBS) and then GEM-91 in 0.1 ml culture medium containing 2% FBS were added to pRET-Luc cells seeded 1 day before onto 24-well plates (2 × 10⁵ cells/well). After 18 h incubation at 37°C, the luciferase activity was measured by luminescence (32). Cells were washed three times with PBS. The homogenization buffer (0.2 ml of 8 mM MgCl2, 1 mM dithiotreithol, 1 mM EDTA, 15% glycerol, 1% Triton X-100, 25 mM Tris–phosphate buffer pH 7.8) was poured into each well. The tissue culture plates were shaken and kept at 20°C for 10 min. The solution was recovered and centrifuged (5 min at 800 g). ATP (95 µl of a 2 mM solution in homogenization buffer without Triton X-100) was added to 60 µl supernatant and vigorously mixed. Luminescence was recorded for 4 s using a luminometer (LUMAT LB 9501; Berthold, Wildbach, Germany) upon addition of 0.15 ml of a 167 mM luciferin solution in water. The percentage of luciferase inhibition was calculated using [(RLUODN – RLU)/RLU] × 100, where RLUODN and RLU are the luciferase activity of cell lysates incubated in the presence and absence of ODN, respectively.
RESULTS
Histidylated oligolysines
Oligolysine (DP = 19) was substituted with histidyl residues protected as (Boc)2-His-OH. Before deprotection of both the α-amino and the imidazole groups of the histidyl residues, the remaining ɛ-amino groups of lysyl residues were blocked by either acetylation or gluconoylation. Gluconoyl residues, polyhydroxyalkanoyl moieties which are not recognized by any known cell surface receptor, increase the water solubility of polylysine derivatives (22). After deprotection of the histidyl residues, two types of oligomers were obtained: (i) HoK1 containing 12 histidyl and three gluconoyl residues; and (ii) HoK2 containing 15 histidyl and three acetyl residues (Fig. 1). The oligomer HoK3 corresponds to HoK2 in which all amino groups of histidyl residues were acetylated. At neutral pH, HoK1 and HoK2 containing 16 positive charges (the α-amino group of each histidyl residue and a few unsubstituted ɛ-amino groups) interact with ODN. Indeed, the fluorescence intensity of 0.25 µM F-GEM-91 was almost totally quenched in the presence of 8 µM HoK1 or HoK2; half quenching was obtained when the oligomer:ODN ratio was ~16 (Fig. 2). In contrast, when oligomers had no charge, as in the case of HoK3, ODN seems not to interact with the oligomer because the F-ODN fluorescence intensity did not change significantly upon addition of HoK3 (Fig. 2).
Figure 2.

Interactions between ODN and histidylated oligolysines. F-GEM-91 (0.25 µM) in PBS was mixed with either HoK1 (circle), HoK2 (triangle) or HoK3 (diamond) at room temperature. The ODN fluorescence intensity was measured at 520 nm under a 495 nm excitation wavelength. Fo and F are the fluorescence intensities in the absence and in the presence of oligomers, respectively.
Influence of histidylated oligolysines on the cellular uptake of ODN
A549 cells were incubated for 4 h with F-PS-ODN in the absence or presence of 20 µM of each of the oligomers. In the absence of the oligomer, the amount of cell-associated PS-ODN was low (Fig. 3). A post-treatment with monensin induced an increase (4 times) in the cell fluorescence intensity, indicating that the intracellular PS-ODN was in an acidic environment. The uptake of PS-ODN was ~10-fold greater when incubation was performed in the presence of 20 µM HoK1 or HoK2 (Fig. 3). The cell fluorescence intensity increased linearly with PS-ODN concentration, suggesting a non-saturable cell uptake. Upon post-treatment with monensin, the cell fluorescence intensity with HoK2 was enhanced 2-fold and with HoK1 even less, suggesting that PS-ODN was located in a slightly acidic environment. The uptake of PS-ODN (0.5 µM) was maximal in the presence of 5 µM HoK1 or HoK2 (Fig. 3, inset).
Figure 3.

Uptake of F-PS-ODN. A549 cells were incubated for 4 h at 37°C with various concentrations of F-PS-ODN in the absence (filled square, open square) or presence of 20 µM HoK1 (filled circle, open circle) or HoK2 (filled triangle, open triangle). (Inset) Influence of the oligomer concentration on cellular uptake. A549 cells were incubated in the presence of 0.5 µM F-PS-ODN and various concentrations of HoK1. Cell fluorescence intensity was measured by flow cytometry after a post-incubation for 30 min on ice in the absence (filled square, filled circle, filled triangle) or presence (open square, open circle, open triangle) of 50 µM monensin.
The effect of the oligomers depends on the cell type: for instance, ODN uptake by pRET-Luc cells was less sensitive (5-fold) than that of A549 cells (10-fold) (data not shown).
Intracellular location of ODN related to the presence of histidylated oligolysines
The intracellular location of PS-ODN in the presence of an oligomer was assessed by confocal microscopy. A549 cells incubated for 4 h at 37°C with F-PS-ODN in the absence of oligomers exhibited faint vesicular staining (Fig. 4Aa). In the presence of either HoK1 (Fig. 4Ab) or HoK2 (Fig. 4Ac), the fluorescence intensity was stronger, indicating an enhancement of ODN uptake. In addition, the size of vesicles containing ODN appeared larger and both the cytosol and the nucleus were labeled. The cytosolic and nuclear staining was more intense in the presence of HoK2 than in the presence of HoK1, probably because HoK2, which contains a higher number of histidyl residues than HoK1, induced more efficient membrane destabilization. In contrast, the cell-associated fluorescence was low in the presence of histidine-free oligolysine (Fig. 4Ae) as well as in the presence of HoK3, which did not interact with ODN (Fig. 4Ad). The effect of oligomers was also observed when F-PO-ODN was incubated in the presence of HoK2. Upon an overnight chase, both PO-ODN and PS-ODN were still detectable in the cytosol as well as in the nucleus (Fig. 4B). The staining intensity of the nucleus was higher than that observed without chase (not shown). The intracellular localization of oligomer and ODN was determined by double staining experiments using rhodamine-labeled HoK2 (R-HoK2) and F-PS-ODN. After a 4 h incubation at 37°C, all vesicles scattered throughout the cytosol were yellow colored (Fig. 5c), indicating that R-HoK2 (Fig. 5a) and F-ODN (Fig. 5b) were co-localized. Green labeling of the nucleus indicated that F-PS-ODN reached the nucleus while R-HoK2 remained within the vesicles.
Figure 4.
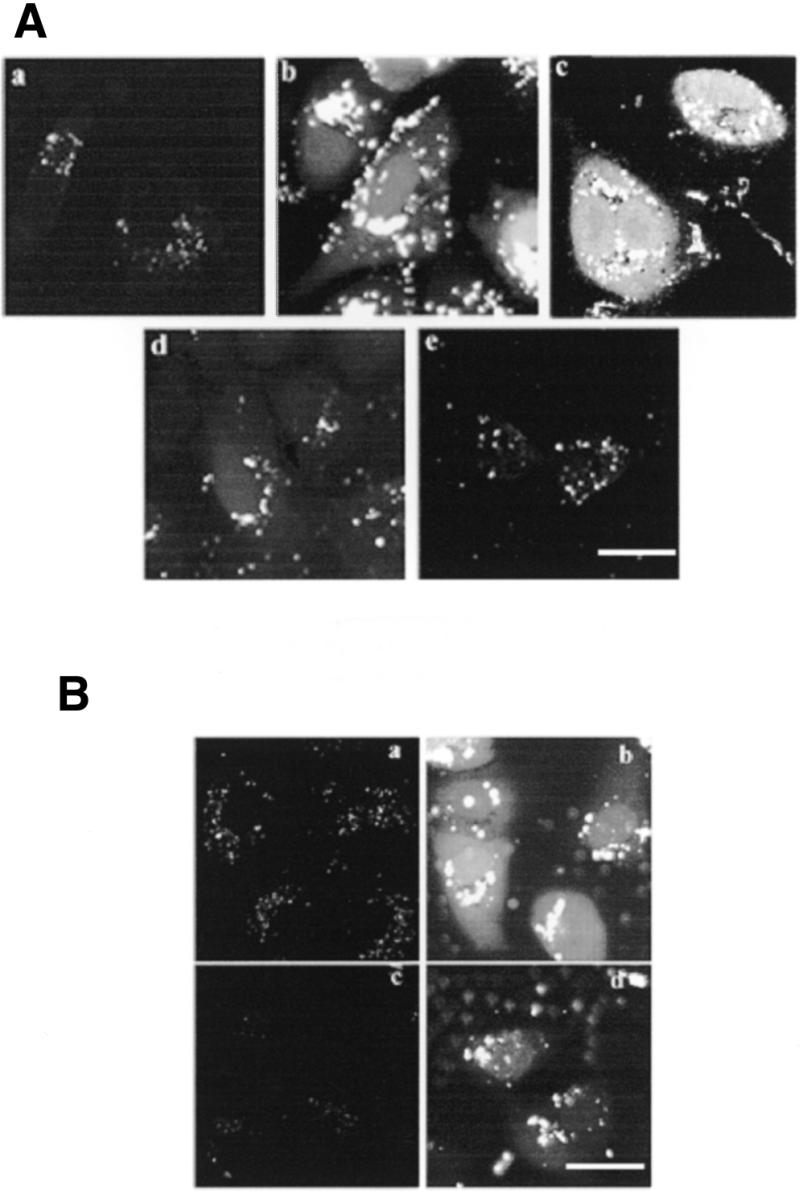
(A) Effect of histidylated oligolysines on the intracellular location of PS-ODN. A549 cells were incubated in the presence of 0.125 µM F-PS-ODN for 4 h at 37°C in the absence (a) or presence of 20 µM HoK1 (b), HoK2 (c), HoK3 (d) or histidine-free oligolysine (e). Cells were fixed with 2% p-formaldehyde and visualized under a confocal microscope. Images were acquired using identical settings. Scale bar 25 µm. (B) Fate of F-ODN. A549 cells were treated for 4 h at 37°C with 0.125 µM F-PS-ODN (a and b) or 5 µM F-PO-ODN (c and d) either in the absence (a, c) or presence (b, d) of 20 µM HoK2. Then, the medium was removed and cells were further incubated in fresh medium for 24 h at 37°C in the absence of any other additive. Cells were fixed with 2% p-formaldehyde and visualized under a confocal microscope. Images were acquired by using identical settings. Scale bar 25 µm.
Figure 5.
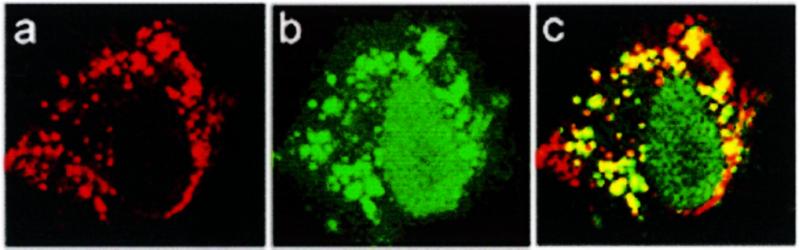
Intracellular location of histidylated oligolysines and ODN. A549 cells were incubated for 4 h at 37°C in the presence of both 20 µM rhodamine-labeled HoK2 and 0.125 µM fluorescein-labelled PS-ODN. Cells were fixed with 2% p-formaldehyde and visualized under a confocal microscope. Localization of HoK2 (a), PS-ODN (b) and superimposition of the green and the red images (c). Images were obtained by reconstitution of optical Z series.
Cytosolic and nuclear delivery of ODN induced by oligomer was also observed in cell lines such as HepG2 (Fig. 6b) and pRET-Luc (Fig. 6d) cells. Nevertheless, the efficiency of ODN delivery into the cytosol and the nucleus depended on cell type: for example it was greater for A549 cells than HepG2 cells.
Figure 6.
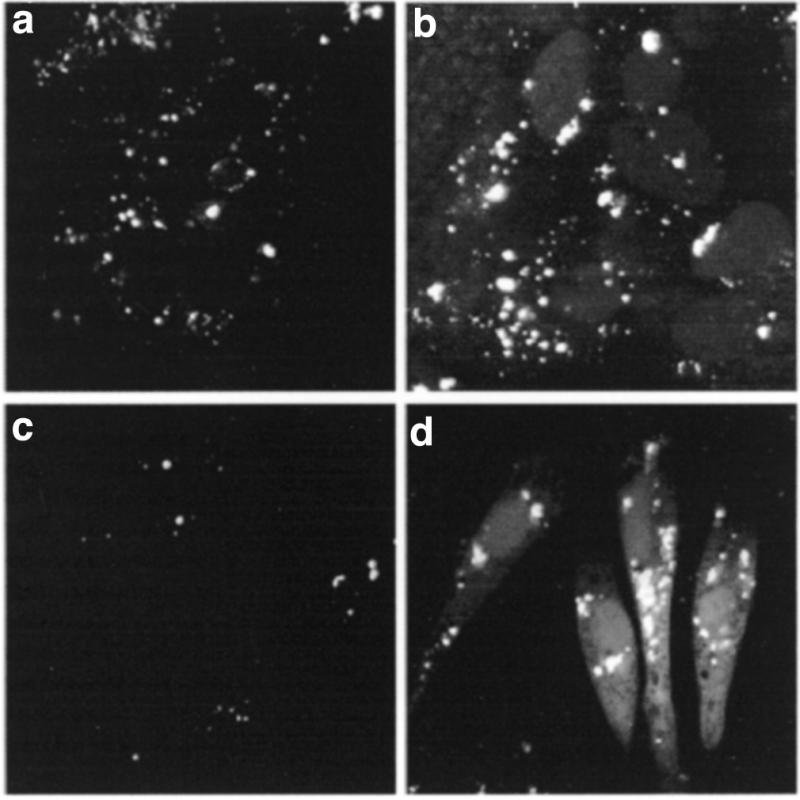
Intracellular location of PS-ODN in HepG2 and pRET-luc cells. HepG2 cells (a and b) or pRET-Luc cells (c and d) were incubated for 4 h at 37°C with 0.125 µM F-PS-ODN without (a and c) or with (b and d) 20 µM HoK2. Cells were fixed with 2% p-formaldehyde and visualized under a confocal microscope.
Histidylated oligolysines increased the biological activity of ICAM-1 antisense PS-ODN
Inhibition of transient expression of ICAM-1 in A549 cells induced by TNF-α was assessed using ISIS 1939, an antisense PS-ODN complementary to the 3′ non-coding region (23). ICAM-1 expression induced by TNF-α was inhibited by ISIS 1939 in the presence of 20 µM HoK1 or HoK2 (Fig. 7). The inhibition was low in the absence of oligomer even up to 1 µM ODN (20% inhibition). Histidylated oligolysines by themselves did not induce any inhibition of ICAM-1 expression upon induction by TNF-α. The inhibition was sequence specific because a random PS-ODN did not induce inhibition and GEM-91, a PS-ODN complementary to the AUG initiation site of the HIV-1 gag gene, induced limited inhibition in the presence of HoK2 (Fig. 7). Unfortunately, histidine-free oligolysine, which is quite cytotoxic, could not be used as a control. Oligomers up to 40 µM were not cytotoxic as assessed by the MTT colorimetric method. PS-ODN (at high concentration, i.e. 1 µM) induced a 20% decrease in cell viability in the presence as well as absence of HoK1 or HoK2. The activity of ISIS 1939 increased with the duration of cell incubation in the presence of ODN and HoK2: HoK2 was ineffective when cells were incubated for a period less than 2 h; in contrast, 60 and 80% inhibition was obtained after 4 and 24 h incubation, respectively (Fig. 7, inset).
Figure 7.

Inhibition of TNF-α-induced ICAM-1 expression by ISIS 1939. A549 cells were incubated at 37°C for 4 h in 100 µl DMEM serum-free medium containing ISIS 1939 ODN either in the absence (filled square) or presence of 20 µM HoK1 (filled circle) or HoK2 (open square). Cells were also incubated with GEM-91 ODN (filled triangle) or random PS-ODN (open circle) in the presence of HoK2. One volume of fresh medium containing 10 ng/ml TNF-α was added and cells were further incubated for 18 h. (Inset) Influence of the incubation period. Cells were incubated at 37°C in the presence of ISIS 1939 ODN and 20 µM HoK2. Cells were then washed and further incubated for up to 24 h at 37°C in fresh complete medium containing 5 ng/ml TNF-α. ICAM-1 expression was quantified by ELISA using anti-ICAM-1 antibodies. Results shown are typical of experiments carried out in triplicate and repeated at least twice. Data are means ± SD of triplicate experiments of the percentage of control ICAM-1 expression induced by TNF-α.
Inhibition of ICAM-1 expression by ISIS 1939 in the presence of oligomer was also evident at the ICAM-1 mRNA level by RT–PCR experiments (Fig. 8). The relative intensity of the band corresponding to mRNA of TNF-α-induced cells treated with ISIS 1939 in the presence of HoK2 was significantly lower than that of TNF-α untreated cells (40 ± 5% versus 100%) and to that of cells treated with ISIS 1939 alone (80%). In contrast, the relative intensity of the bands corresponding to the fragment of G3PDH used as an internal control was identical for both treated and untreated cells.
Figure 8.
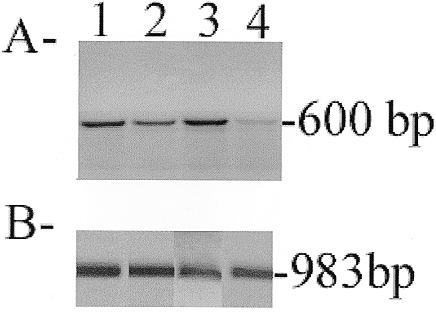
Reduction of ICAM-1 mRNA. A549 cells were treated as described in Figure 7 with 1 µM of ISIS 1939 in the absence or presence of 20 µM HoK2. RT–PCR was performed as described in Materials and Methods. (A) Location of the 600 bp from ICAM-1; and (B) location of 983 bp from G3PDH, used as an internal control. Lane 1, TNF-α-induced ICAM-1 mRNA expression; lane 2, ICAM-1 mRNA basal expression; lane 3, ICAM-1 mRNA in ISIS 1939-treated cells; lane 4, ICAM-1 mRNA expression in the presence of ISIS 1939 and HoK2.
Histidylated oligolysines increase the biological activity of GEM-91 antisense PS-ODN
Inhibition of constitutive expression of the luciferase gene in pRET-Luc cells was assessed using GEM-91. In these cells, luciferase activity was expected to decrease in the presence of GEM-91, which is complementary to the HIV-1 gag gene. The inhibitory activity of GEM-91 (IC50 >5 µM) was 10 times higher in the presence of 20 µM HoK2 (IC50 0.25 µM) than in its absence (Fig. 9). The inhibition was sequence specific because at 1 µM, a random PS-ODN gave 10% inhibition in the presence of HoK2. In contrast, HoK3 neither enhanced the cytosolic and nuclear delivery of PS-ODN (Fig. 4) nor increased the inhibition of luciferase expression by GEM-91 (Fig. 9). Oligolysines bearing different numbers of histidyl residues as well as different charge densities were also tested for their ability to increase the inhibitory effect of GEM-91. The results showed that to be efficient, at least 60% of oligolysine side chains have to be substituted with histidyl residues and the number of free ɛ-amino groups must be quite low to avoid cytotoxicity (data not shown).
Figure 9.

Inhibition of luciferase gene expression by GEM-91. pRET-Luc cells were treated for 4 h at 37°C in DMEM supplemented with 2% FBS containing GEM-91, in the absence of oligomer (open circle), in the presence of 20 µM HoK2 (filled circle) or in the presence of 20 µM HoK3 (filled square). Then, FBS was raised to 5% and the cells were further incubated for 18 h. Luciferase gene expression was measured by luminescence as described in Materials and Methods. Results show typical experiments carried out in triplicate and repeated at least twice. Data are means ± SD of triplicate experiments.
Influence of intravesicular pH on the activity of histidylated oligolysines
Histidylated oligolysines are supposed to favor the delivery of ODN into the cytosol by permeabilizing the endocytotic vesicles which contain both ODN and oligomers. This destabilization probably involves the protonation of imidazole groups in the acidic lumen of endosomes. Indeed, bafilomycin A1, a potent inhibitor of the vacuolar proton pump involved in endosome acidification (33,34), drastically reduced the inhibitory effect of GEM-91 (1 µM) induced by the presence of HoK2 (Fig. 10). The luciferase activity was close to that obtained with GEM-91 in the absence of HoK2. As a control, cells were incubated in the presence of bafilomycin A1 but in the absence of GEM-91 and HoK2; neither luciferase activity nor cytotoxicity, as assessed by MTT assay and by trypan blue exclusion, was affected. Bafilomycin A1 treatment also did not decrease the uptake of 0.125 µM F-GEM-91 as shown by flow cytometry analysis: the fluorescence intensity of cells incubated with HoK2 for 4 h at 37°C in the absence and presence of bafilomycin A1 was identical (495 and 475 arbitrary units, respectively). These results indicate that to be active, histidylated oligolysines require acidification of the intracellular vesicles.
Figure 10.

Influence of the intravesicular pH on the effect of histidylated oligolysine. pRET-Luc cells were incubated with 1 (open bars) or 0.5 µM (hatched bars) GEM-91 and 20 µM HoK2, either in the absence or presence of bafilomycin A1. The incubation was first carried out for 4 h at 37°C in the presence of 800 nM bafilomycin A1 and in the presence of GEM-91 and HoK2. Then, the medium was removed and the cells were incubated overnight in fresh complete medium containing 200 nM bafilomycin A1. Luciferase gene expression was measured by luminescence as described in Materials and Methods. Results show typical experiments carried out in triplicate and repeated at least twice. Data are means ± SD of triplicate experiments.
DISCUSSION
Histidylated oligolysines were prepared with the aim of destabilizing the membranes of acidic compartments in order to favor the delivery of oligonucleotides into the cytosol.
The uptake of fluorescein-labeled PS-ODN was enhanced (5- to 10-fold) in the presence of oligomers. This increase induced by oligomers can be explained by the formation of complexes via electrostatic interactions between the negative charges of ODN phosphates and the positive charges of oligolysines carrying histidyl residues with free α-amino groups. Indeed, an oligolysine substituted with N-acetylhistidyl residues, which does not form complexes with ODN, did not increase ODN uptake. Dose–response curves indicated that the uptake was non-saturable, suggesting that it was not receptor mediated, while ODN uptake in the absence of oligomer was concentration dependent, as previously reported (24,35). Once taken up, PS-ODN are usually found in an acidic environment, as shown by the enhancement (4-fold) of the cell fluorescence intensity upon monensin post-treatment. In contrast, the cell fluorescence intensity in the presence of oligomers was increased by 1.5- to 2-fold upon monensin post-treatment, suggesting that the PS-ODN was located in a less acidic environment. This would indicate that histidylated oligolysines have induced a change in the intracellular distribution of PS-ODN.
This statement is further supported by data obtained by confocal microscopy. F-PS-ODN taken up in the absence of HoK were located inside vesicles and no labeling was detected either in the cytosol or in the nucleus, in agreement with previous reports (5,8,9). In contrast, in the presence of oligomer, F-PS-ODN was present inside vesicles scattered throughout the cytoplasm as well as in the cytosol and in the nucleus. These data are in line with the flow cytometry analysis because the fluorescence intensity ratio after post-treatment with monensin was low; the F-PS-ODN was most probably in a non-acidic compartment, presumably in the cytosol and in the nucleus. These data suggest that ODN in the presence of oligomer are delivered to the cytosol. The protonation of histidyl residues in an acidic medium is supposed to destabilize the endosomal membrane and to improve ODN escape from endosomes. Indeed, bafilomycin A1, an inhibitor of the proton pump ATPase, drastically reduced PS-ODN biological activity in the presence of oligomer. Membrane destabilization might occur by a membrane fusion or a membrane permeabilization mechanism. In an acidic medium, poly-l-histidine is more fusogenic than poly-l-lysine. Indeed, the fusion of liposomes containing phosphatidylserine occurs at a ratio of the number of positive charges of poly-l-histidine to the number of negative charges of the liposomes equal to 0.2, while it occurs at a ratio equal to 1 in the case of poly-l-lysine (20). In the presence of oligomer the size of vesicles containing ODN, which was larger than in the absence of the oligomer, could suggest that there is fusion of several vesicles. In addition, membrane permeabilization could also occur because poly-l-histidine is able to induce the leakage of negatively charges liposomes (20) and because the peptide GLFHAIAHFIHGGWHGLIHGWYG permeabilizes the cell surface membrane at slightly acidic pH (pH 6.4) but not at neutral pH (18).
As is evident using rhodamine-labeled HoK2 and fluorescein-labeled PS-ODN, once taken up and delivered in acidic vesicles, the oligomer remained inside vesicles while the ODN were delivered to the cytosol and the nucleus. The nucleus was still labeled even after an overnight chase, suggesting that the ODN escaped slowly from the endosomes, probably because the oligomer remained inside the vesicles. This behavior is similar to that reported for cationic lipids, which remained inside the endosomal compartment while ODN left the vesicles and accumulated in the nucleus (36–38). As expected, the increase in ODN delivery to the cytosol correlates with biological activity. Indeed, the biological activity of the PS-ODN was enhanced in the presence of histidylated oligolysines (IC50 ~ 0.25–0.5 µM versus >2 µM in their absence). The positive effect of oligomers was observed both on the inhibition of induced gene expression (ICAM-1) by ISIS 1939 and the inhibition of reporter gene expression (luciferase) in a stable transfected cell line by PS-ODN GEM-91. As previously described, ISIS 1939 is inactive in A549 cells unless used in conjunction with cationic lipids (IC50 ~ 0.5 µM) (23) or complexed with fucosylated poly-l-lysine in the presence of chloroquine (IC50 ~ 0.5 µM) (7).
The oligomers not only enhanced PS-ODN delivery to the cytosol and the nucleus but also enhanced PO-ODN delivery. In addition, these oligomers were effective in different cell lines, but their efficiency varied from one cell type to another. They were less effective in HepG2 cells than in A549 or pRET-Luc cells. This variability was probably related to differences in the pH of the lumen of vesicles as well as in the uptake efficiency and in intracellular trafficking.
Recently, we reported that histidylated polylysine (DP = 190) is an efficient carrier for DNA delivery and cell transfection (19). Unfortunately, efficient ODN delivery does not occur when long histidylated polylysine (DP from 190 down to 36) are used. Conversely, the shortest histidylated oligolysines (DP = 19) were not efficient in DNA delivery and cell transfection. This lack of efficacy is probably due to the inability of such small oligocationic molecules to efficiently compact DNA.
Efficient histidylated oligolysines must have less than one-third free ɛ-amino groups to avoid a cytotoxic effect. Indeed, because the electrostatic interactions between ODN and oligomers are weak, ODN-free oligomers are always present and therefore the cytotoxicity is directly related to the cytotoxicity of the oligomers. Highly substituted oligolysines are not cytotoxic while moderately substituted or histidine-free oligolysines are quite cytotoxic.
In conclusion, histidylated oligolysines are suitable vectors to increase the uptake of ODN and to destabilize the endosomal membrane leading to transfer of ODN to both the cytosol and the nucleus. As a consequence, they clearly improve antisense oligonucleotide-induced inhibition of gene expression.
Acknowledgments
ACKNOWLEDGEMENTS
We would like to thank Dr A.-M. Aubertin (Strasbourg, France) for providing the pRET-Luc plasmid, Drs M.Y. Ardourel and J.F. Cloix for helping us in RT–PCR and M.-T. Bousser for her excellent technical assistance. We thank Dr A.C. Roche for critical reading of the manuscript. This work was supported by the Agence Nationale de Recherche sur le Sida.
REFERENCES
- 1.Helène C. and Toulmé,J.J. (1990) Biochim. Biophys. Acta, 1049, 99–125. [DOI] [PubMed] [Google Scholar]
- 2.Stein C.A. and Krieg,A.M. (eds) (1998) Applied Antisense Oligonucleotide Technology. Wiley-Liss, New York, 540 pp.
- 3.Malvy C., Harel-Bellan,A. and Pritchard,L.L. (1999) In Triple Helix Forming Oligonucleotides. Klewer Academic, Boston, MA, 297 pp.
- 4.Temsamani J., Kubert,M., Tang,J., Padmapriya,A. and Agrawal,S. (1994) Antisense Res. Dev., 4, 35–42. [DOI] [PubMed] [Google Scholar]
- 5.Akhtar S. and Juliano,R.L. (1992) Trends Cell Biol., 2, 139–158. [DOI] [PubMed] [Google Scholar]
- 6.Gao W.Y., Storm,C., Egan,W. and Cheng,Y.C. (1993) Mol. Pharmacol., 43, 45–50. [PubMed] [Google Scholar]
- 7.Stewart A.J., Pichon,C., Meunier,L., Midoux,P., Monsigny,M. and Roche,A.C. (1996) Mol. Pharmacol., 50, 1487–1494. [PubMed] [Google Scholar]
- 8.Leonetti J.P., Mechti,N., Degols,G., Gagnor,C. and Lebleu,B. (1991) Proc. Natl Acad. Sci. USA, 88, 2702–2706. [DOI] [PMC free article] [PubMed] [Google Scholar]
- 9.Chin D.J., Green,G.A., Zon,G., Szoka,F.C. and Straubinger,R.M. (1990) New Biol., 2, 1091–1100. [PubMed] [Google Scholar]
- 10.Fisher T.L., Terhorst,T., Cao,X. and Wagner,R.W. (1993) Nucleic Acids Res., 21, 3857–3865. [DOI] [PMC free article] [PubMed] [Google Scholar]
- 11.Spiller D.G. and Tidd,D.M. (1995) Antisense Res. Dev., 5, 13–21. [DOI] [PubMed] [Google Scholar]
- 12.Derossi D., Joliot,A.H., Chassaing,G. and Prochiantz,A. (1994) J. Biol. Chem., 269, 10444–10450. [PubMed] [Google Scholar]
- 13.Bongartz J.P., Aubertin,A.M., Milhaud,P.G. and Lebleu,B. (1994) Nucleic Acids Res., 22, 4681–4688. [DOI] [PMC free article] [PubMed] [Google Scholar]
- 14.Bergan R., Hakim,F., Schwartz,G.N., Kyle,E., Cepada,R., Szabo,J.M., Fowler,D., Gress,R. and Neckers,L. (1996) Blood, 88, 731–741. [PubMed] [Google Scholar]
- 15.Pichon C., Freulon,I., Midoux,P., Mayer,R., Monsigny,M. and Roche,A.C. (1997) Antisense Nucleic Acid Drug Dev., 7, 335–343. [DOI] [PubMed] [Google Scholar]
- 16.Budker V., Gurevich,V., Hagstrom,J.E., Bortzov,F. and Wolff,J.A. (1996) Nature Biotechnol., 14, 760–764. [DOI] [PubMed] [Google Scholar]
- 17.Hughes J.A., Aronsohn,A.I., Avrutskaya,A.V. and Juliano,R.L. (1996) Pharm. Res., 13, 404–410. [DOI] [PubMed] [Google Scholar]
- 18.Midoux P., Kichler,A., Boutin,V., Maurizot,J.C. and Monsigny,M. (1998) Bioconjug. Chem., 9, 260–267. [DOI] [PubMed] [Google Scholar]
- 19.Midoux P. and Monsigny,M. (1999) Bioconjug. Chem., 10, 406–411. [DOI] [PubMed] [Google Scholar]
- 20.Wang C.-Y. and Huang,L. (1984) Biochemistry, 23, 4409–4416. [DOI] [PubMed] [Google Scholar]
- 21.Uster P.S. and Deamer,W.D. (1985) Biochemistry, 24, 1–8. [DOI] [PubMed] [Google Scholar]
- 22.Derrien D., Midoux,P., Petit,C., Nègre,E., Mayer,R., Monsigny,M. and Roche,A.C. (1989) Glycoconjug. J., 6, 241–255. [DOI] [PubMed] [Google Scholar]
- 23.Chiang M.Y., Chan,H., Zounes,M.A., Freier,S.M., Lima,W.F. and Bennett,C.F. (1991) J. Biol. Chem., 266, 18162–18171. [PubMed] [Google Scholar]
- 24.Stewart A.J., Pichon,C., Midoux,P., Mayer,R., Aubertin,A.M., Monsigny,M. and Roche,A.C. (1997) New J. Chem., 21, 87–98. [Google Scholar]
- 25.Bonfils E., Depierreux,C., Midoux,P., Thuong,N.T., Monsigny,M. and Roche,A.C. (1992). Nucleic Acids Res., 20, 4621–4629. [DOI] [PMC free article] [PubMed] [Google Scholar]
- 26.Nachtigal M., Nagpal,M.L., Greenspan,P., Nachtigal,S.A. and Legrand,A. (1989) In Vitro Cell. Dev. Biol., 25, 892–898. [DOI] [PubMed] [Google Scholar]
- 27.Chen T.R. (1977) Exp. Cell Res., 104, 255–262. [DOI] [PubMed] [Google Scholar]
- 28.Monsigny M., Roche,A.C. and Midoux,P. (1984) Biol. Cell, 51, 187–196. [DOI] [PubMed] [Google Scholar]
- 29.Midoux P., Roche,A.C. and Monsigny,M. (1987) Cytometry, 8, 327–334. [DOI] [PubMed] [Google Scholar]
- 30.Maxfield F.R. (1989) J. Cell Biol., 95, 676–681. [DOI] [PMC free article] [PubMed] [Google Scholar]
- 31.Johnson G.D., Davidson,R.S., McNamee,K.C., Russell,G., Goodwin,D. and Holborow,E.J. (1982) J. Immunol. Methods, 55, 231–242. [DOI] [PubMed] [Google Scholar]
- 32.De Wet J.R., Wo De Luca,M., Helinsky,D.R. and Subramani,S. (1987) Mol. Cell. Biol., 7, 725–737. [DOI] [PMC free article] [PubMed] [Google Scholar]
- 33.Bowman E.J., Siebers,A. and Altendorf,K. (1988) Proc. Natl Acad. Sci. USA, 85, 7972–7976. [DOI] [PMC free article] [PubMed] [Google Scholar]
- 34.Johnson L.S., Dunn,K.W., Pytowski,B. and McGraw,T.E. (1993) Mol. Biol. Cell, 4, 1251–1266. [DOI] [PMC free article] [PubMed] [Google Scholar]
- 35.Tonkinson J.L. and Stein,C.A. (1994) Nucleic Acids Res., 22, 4268–4275. [DOI] [PMC free article] [PubMed] [Google Scholar]
- 36.Bennett C.F., Chiang,M.Y., Chan,H., Shoemaker,J.E. and Mirabelli,C.K. (1992) Mol. Pharmacol., 41, 1023–1033. [PubMed] [Google Scholar]
- 37.Zelphati O. and Szoka,F.C. (1996) Proc. Natl Acad. Sci. USA, 93, 11493–11498. [DOI] [PMC free article] [PubMed] [Google Scholar]
- 38.Marcusson E.G., Bhat,B., Manoharan,M., Bennett,C.F. and Dean,N.M. (1998) Nucleic Acids Res., 26, 2016–2023. [DOI] [PMC free article] [PubMed] [Google Scholar]