

Abstract
Abnormal expression of the progesterone receptor (PGR) isoforms, PGRA and PGRB, is often observed in women with reproductive tract cancer. To assess the importance of the PGR isoform ratio in the maintenance of the healthy reproductive tract, mice with Cre recombinase-activated PGRA and PGRB transgenes were bred with the PGRCre mouse model to generate strains expressing either PGRA or PGRB in PGR positive tissues. The PGRB mice developed ovarian neoplasms at 23 weeks of age derived from ovarian luteal cells, while the PGRA expressing mice displayed a reduced frequency of tumor development. Transcriptomic analyses of the ovarian tumors revealed an enhanced AKT pathway, as well as a PGR signature in human ovarian and endometrial cancers. Effective treatment with the PGR antagonist RU486 stalled tumor growth and decreased the expression of cell cycle genes. We concluded that tumor growth and proliferation is hormone and PGR isoform dependent. Further analysis of the PGRB cistrome identified binding events of critical mitotic phase entry genes. This work suggests an intriguing mechanism whereby the expression of the PGR isoforms determines in vivo neoplasia through high-jacking of the cell cycle pathway.
One Sentence Summary:
Progesterone receptor isoform specific expression promotes differential ovarian neoplasm formation.
Introduction
Proper functioning of the reproductive tract depends on the appropriate signaling and expression of the hormone receptors and their ligands for pregnancy and the maintenance of a healthy fertile state (1). Disruption of hormone signaling not only results in infertility and miscarriage, but also can lead to diseases such as leiomyoma, endometriosis, and reproductive tract cancer (2). Endometrial cancer and ovarian cancer collectively contribute to over 37,000 deaths per year in the United States (3). Further understanding of hormone signaling in the reproductive tract, especially as it relates to the initiation and progression of disease, can accelerate the development of specialized therapies to treat these diseases and cancers.
The ovary produces the female steroid hormones, estrogen and progesterone under the direction from gonadotropins secreted from the pituitary gland (1). These hormones function by binding to their cognate receptors, the estrogen and progesterone receptors, to elicit activation or repression of their respective target genes. The progesterone receptor (PGR) is expressed in all uterine compartments, yet is limited to the pre-ovulatory granulosa cells of the ovary (4). PGR function is further induced and inhibited through the unique expression of different isoforms (5, 6). Genetically engineered mice have been generated with specific ablation of both isoforms: PGRAKO and PGRBKO. Phenotypic analysis of these mice demonstrated that the PGRA isoform is critical for female mouse fertility. The PGRBKO mice were fertile with normal ovulation and embryo implantation, yet displayed a mammary gland phenotype of altered ductal epithelial proliferation (7). The only uterine phenotype attributed to the PGRB isoform in the mouse was the ability to promote epithelial proliferation in the absence of the PGRA isoform (8). However, the reported proliferative role of progesterone within endocrine organs is variable and somewhat contradictory (2, 9, 10).
Alterations in progesterone signaling such as irregular hormone levels, decreased receptor activity, or even abnormal isoform expression ratios can result in aberrant proliferation and reproductive-associated disease (2). Within endometrial cancer, dominance of either PGR isoform over the other is an early biomarker for tumorigenesis (11). Furthermore, the PGRB isoform is expressed at high levels in ovarian cancers (reviewed in (2)). Therefore, we hypothesized that alteration of PGR isoform expression would have a detrimental impact on reproductive tract homeostasis. To test this hypothesis, conditional PgrA and PgrB expression alleles were utilized as previously described (12, 13). Mice positive for either expression allele were individually mated to Pgrcre mice (14), resulting in the constitutive expression of either the PGRA or PGRB isoform in PGR positive tissues. PGRB expressing mice developed poorly differentiated ovarian neoplasms at 23 weeks of age that stop growing upon treatment with the PGR inhibitor RU486 (mifepristone). PGRA expressing mice also develop similar ovarian neoplasms, yet at a much lower frequency. Transcriptomic profiles from the PGRB expressing ovarian neoplasms exhibit a pro-proliferative signature. These mouse models provide a new perspective regarding the function of the PGR isoforms in the initiation and progression of solid tumors in endocrine tissues.
Results
Murine models generated to express the PGR isoforms.
To assess the importance of the PGR isoform ratio in the maintenance of the reproductive tract, PGR overexpression models were generated. The altered PGR isoform ratio was achieved by mating mPgrALsL/+ (12) mice or mPgrBLsL/+ (13) mice to the Pgrcre mice (14), resulting in Cre recombinase expression in PGR expressing cells. As a result, the PGRA or PGRB isoform was constitutively expressed in all compartments of the uterus compared to wildtype, in which PGR is expressed at differing levels across estrous stages and pregnancy (PGRA published in (12), PGRB in fig. S1A–B). Furthermore, PGRB expression was observed in scattered cells within the ovarian corpora lutea of the Pgrcre/+mPgrBLsL/+ mice detected by myc-tag immunohistochemistry (fig. S1C–F). To assess the total level of PGR protein within the uterus relative to the PGRB transgene expression, protein isolated from whole uterine tissue was measured for PGR. Whole uterine protein isolates from Pgrcre/+mPgrBLsL/+ mice displayed elevated levels of myc-tagged PGRB protein (118 kDa) compared to wildtype Pgrcre/+ mice, with both groups exhibiting similar PGRA protein expression (90 kDa) (fig. S1G).
PGR expressing mice develop ovarian neoplasia.
Surprisingly, Pgrcre/+mPgrBLsL/+ female mice developed ovarian tumors with 100% penetrance by 28 weeks of age. Pgrcre/+mPgrALsL/+also developed tumors but at a much reduced frequency of 18.2% (Table 1). A time course of tumor development was assessed by sacrificing mice at 13, 23, 28, and 33 weeks of age. Additionally, various mice exhibited bilateral tumor growths. To assess whether increased age correlated with bilateral tumor growth, bilateral and unilateral tumor formation was recorded at 23, 28, and 33 weeks of age in the Pgrcre/+mPgrBLsL/+ mice. We concluded that bilateral tumor formation generally increased with age in the Pgrcre/+mPgrBLsL/+ mice, yet was stochastic in occurrence (table S1). Despite appearing healthy, the intact ovary in a tumor-laden mouse often exhibited the presence of pre-neoplastic cells. Thus, ovarian tumor development was divided into two categories. The presence of abnormal cells in the ovaries was categorized as “pre-neoplastic” while the presence of tumors was called “neoplastic”. At 23 weeks of age, the Pgrcre/+mPgrBLsL/+ mice exhibited the presence of abnormal cells (pre-neoplastic) or visible tumors (neoplastic) in the ovarian interstitium compared to wildtype (Table 1, Fig. 1A–L). As tumor development progressed, the tumor tissue effaced the normal ovarian architecture and filled the ovarian bursa. In the initial stages, numerous large pleomorphic cells were present in and around the corpora lutea. At a later stage when the tumor is completely formed, they were composed of polygonal cells admixed with large blood-filled spaces and interstitial cells. The neoplastic cells had variably distinct borders, scant to abundant eosinophilic cytoplasm and variably sized nucleus with coarsely stippled chromatin. Marked anisocytosis and anisokaryosis was present. There were multiple, prominent nucleoli in some of the cells. Occasional multinucleated cells were present. Mitotic figures were rare. Many of the cells appeared to have a large vacuole in their cytoplasm. Based on the histomorphology, the tumors were diagnosed as poorly differentiated neoplasms of the ovary. Ovarian neoplastic cells exhibited intense staining for PGR and the proliferative marker, Ki67, in neoplastic tissues compared to wildtype ovarian corpus luteum and interstitium (Fig. 2A–B, D–E, G–H, J–K, M–N, P–Q, S–T). Furthermore, the expression of the apoptotic marker, cleaved caspase 3 (CASP3), is reduced compared to wildtype, yet not significant by intensity H score in Pgrcre/+mPgrBLsL/+ ovarian tumor tissue (Fig. 2C, F, I, L, O, R, U) The cyclooxygenase (COX) pathway has been associated with advanced tumorigenic profiles in the ovary (15–17). Thus, protein levels of COX1 and COX2 were examined in the Pgrcre/+mPgrBLsL/+ ovarian neoplasia. Consequently, COX1 and COX2 protein expression was increased in neoplastic tumor tissue at 33 weeks of age from Pgrcre/+mPgrBLsL/+ mice compared to controls (Fig. 3A–C).
Table 1:
Time Course of Ovarian Tumor Development in Pgrcre/+mPgrALsL/+ mice and Pgrcre/+mPgrBLsL/+ mice. wk: weeks. Number in parenthesis: number of total mice.
| Age (n) | Pre-Neoplastic | Neoplastic | Total (%) | |
|---|---|---|---|---|
| Control | 33wk (10) | 0 | 0 | 0 |
|
| ||||
| 13wk (16) | 100 | 0 | 100 | |
| Pgr cre/+ mPgrB LsL/+ | 23wk (11) | 27.3 | 72.7 | 100 |
| 28wk (12) | 0 | 100 | 100 | |
| 33wk (11) | 0 | 100 | 100 | |
|
| ||||
| Pgr cre/+ mPgrA LsL/+ | 33wk (11) | 18.2 | 18.2 | 36.4 |
Figure 1:
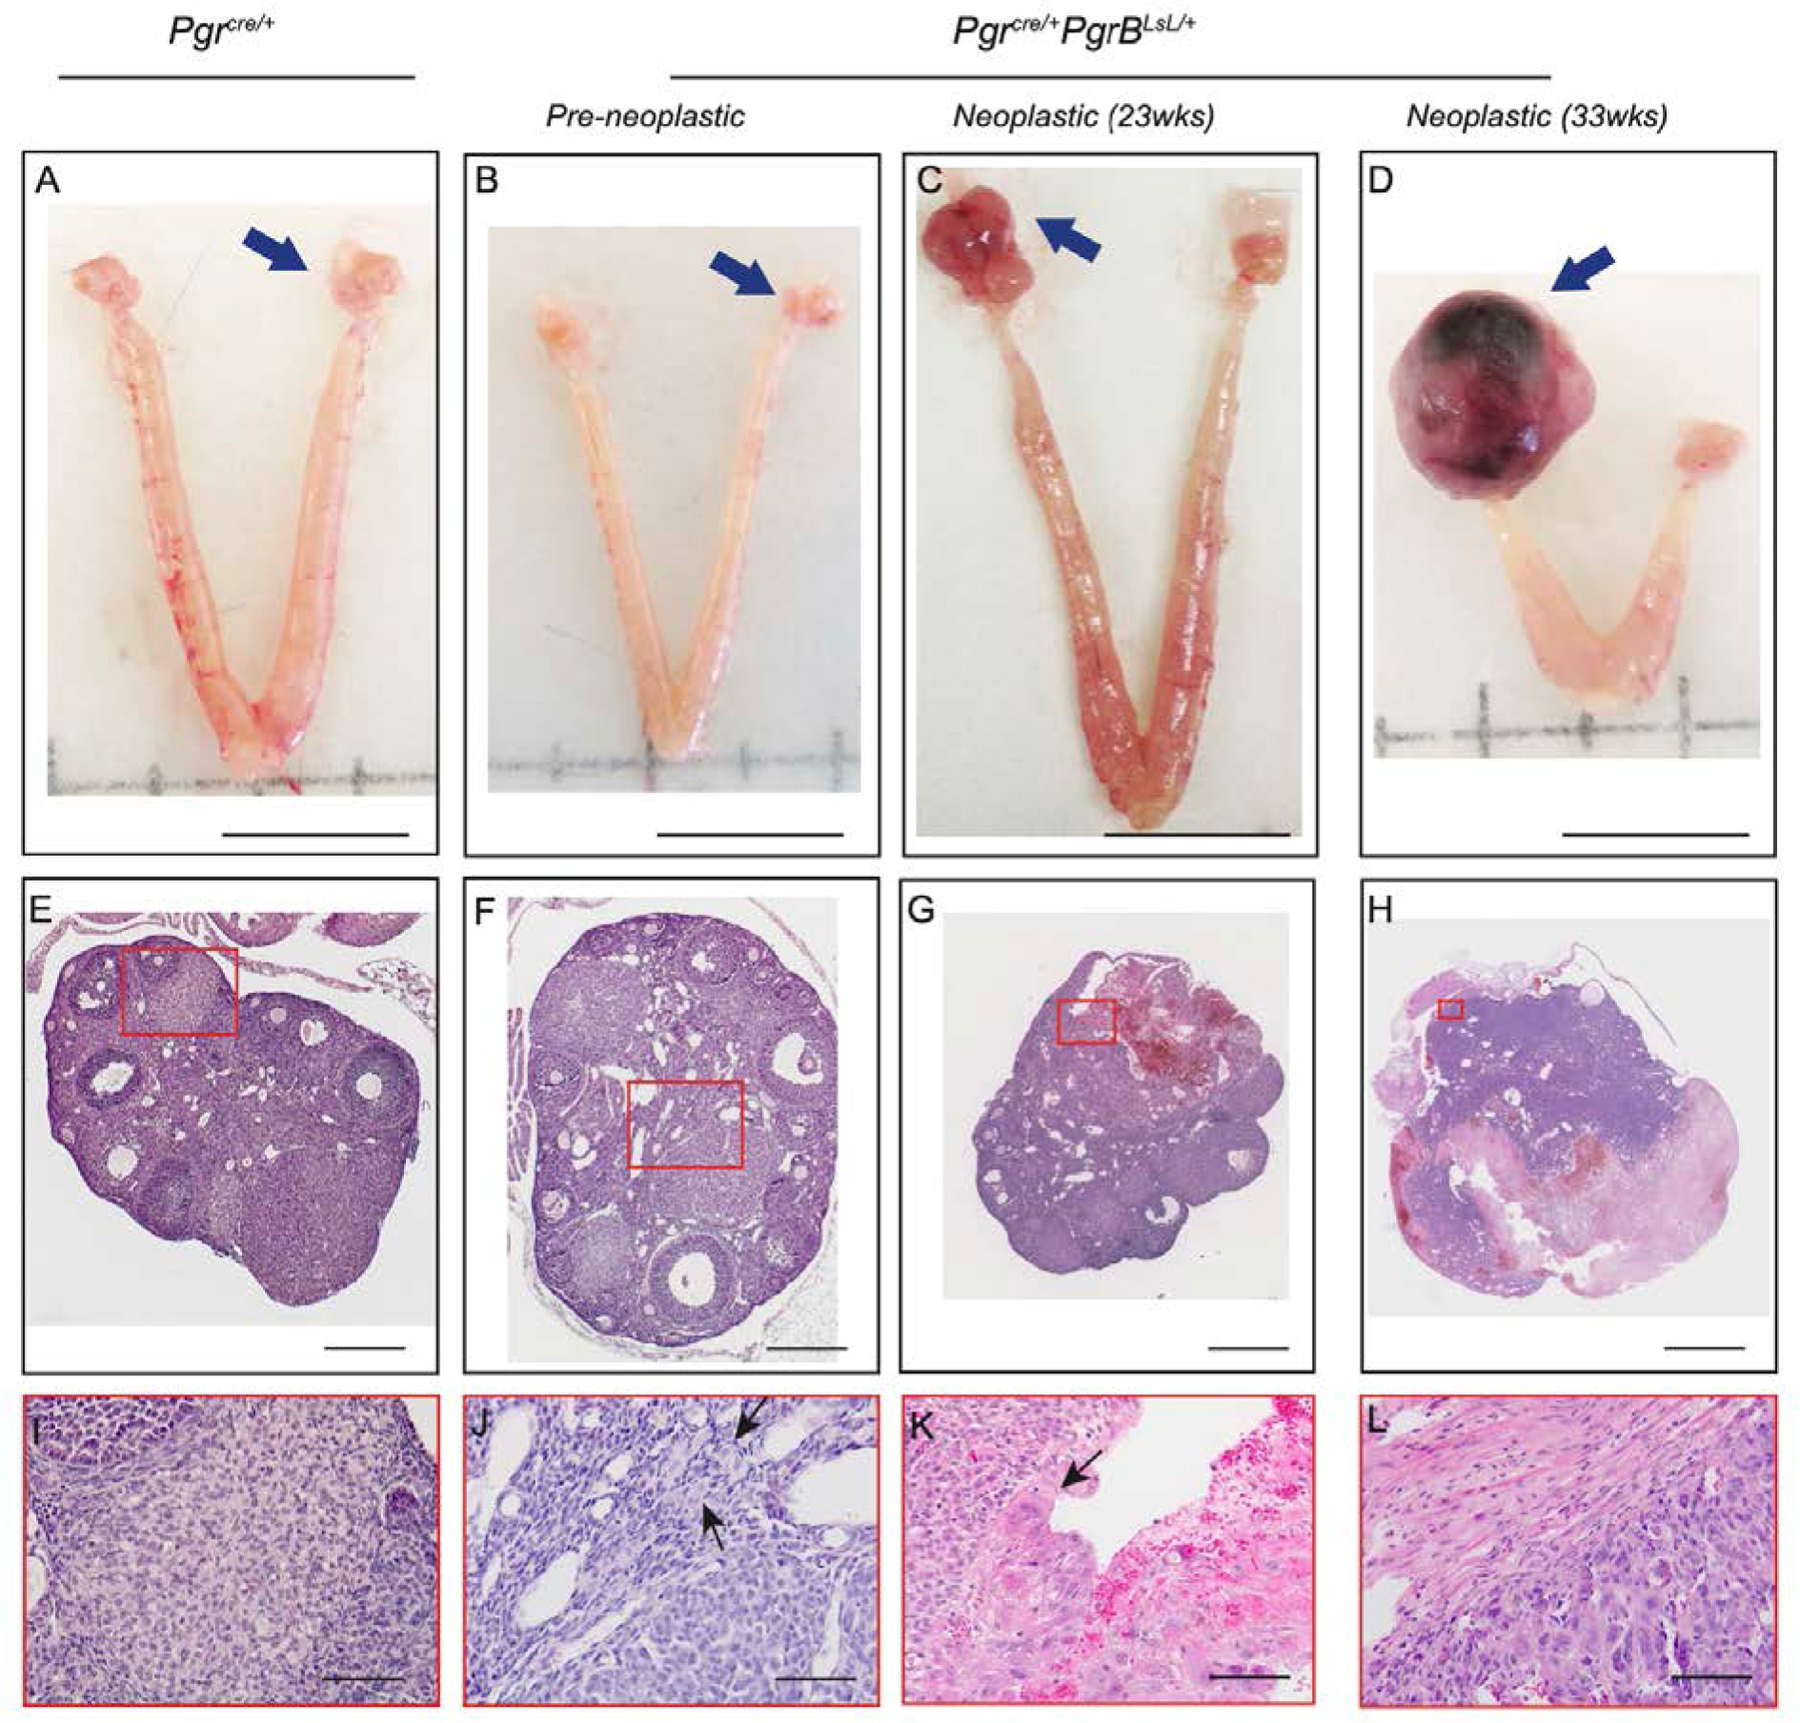
Constitutive PGRB expression induces ovarian tumors in mice. Pictures of ovary (A-D), hematoxylin and eosin stained sections of ovaries (E-H) and the higher magnification of selected regions (I-L) in Pgrcre/+mice (A, E, I, n=10) and pre-neoplastic (B, F, J, n=21) and neoplastic at 23 (C, G, K, n=8) and 33 (D, H, L, n=11) weeks of age in ovarian tumors from Pgrcre/+mPgrBLsL/+ mice. Red rectangle indicates the selected regions for higher magnification. Black arrows indicate tumor cells with big nuclear size and/or big cell size. Blue arrows indicate the imaged ovary or ovarian tumor. Scale bar for A-D is 1cm. Scale bar for E, F is 0.2mm. Scale bar for G is 0.4mm. Scale bar for H is 2mm. Scale bar for I-L is 50μm.
Figure 2:
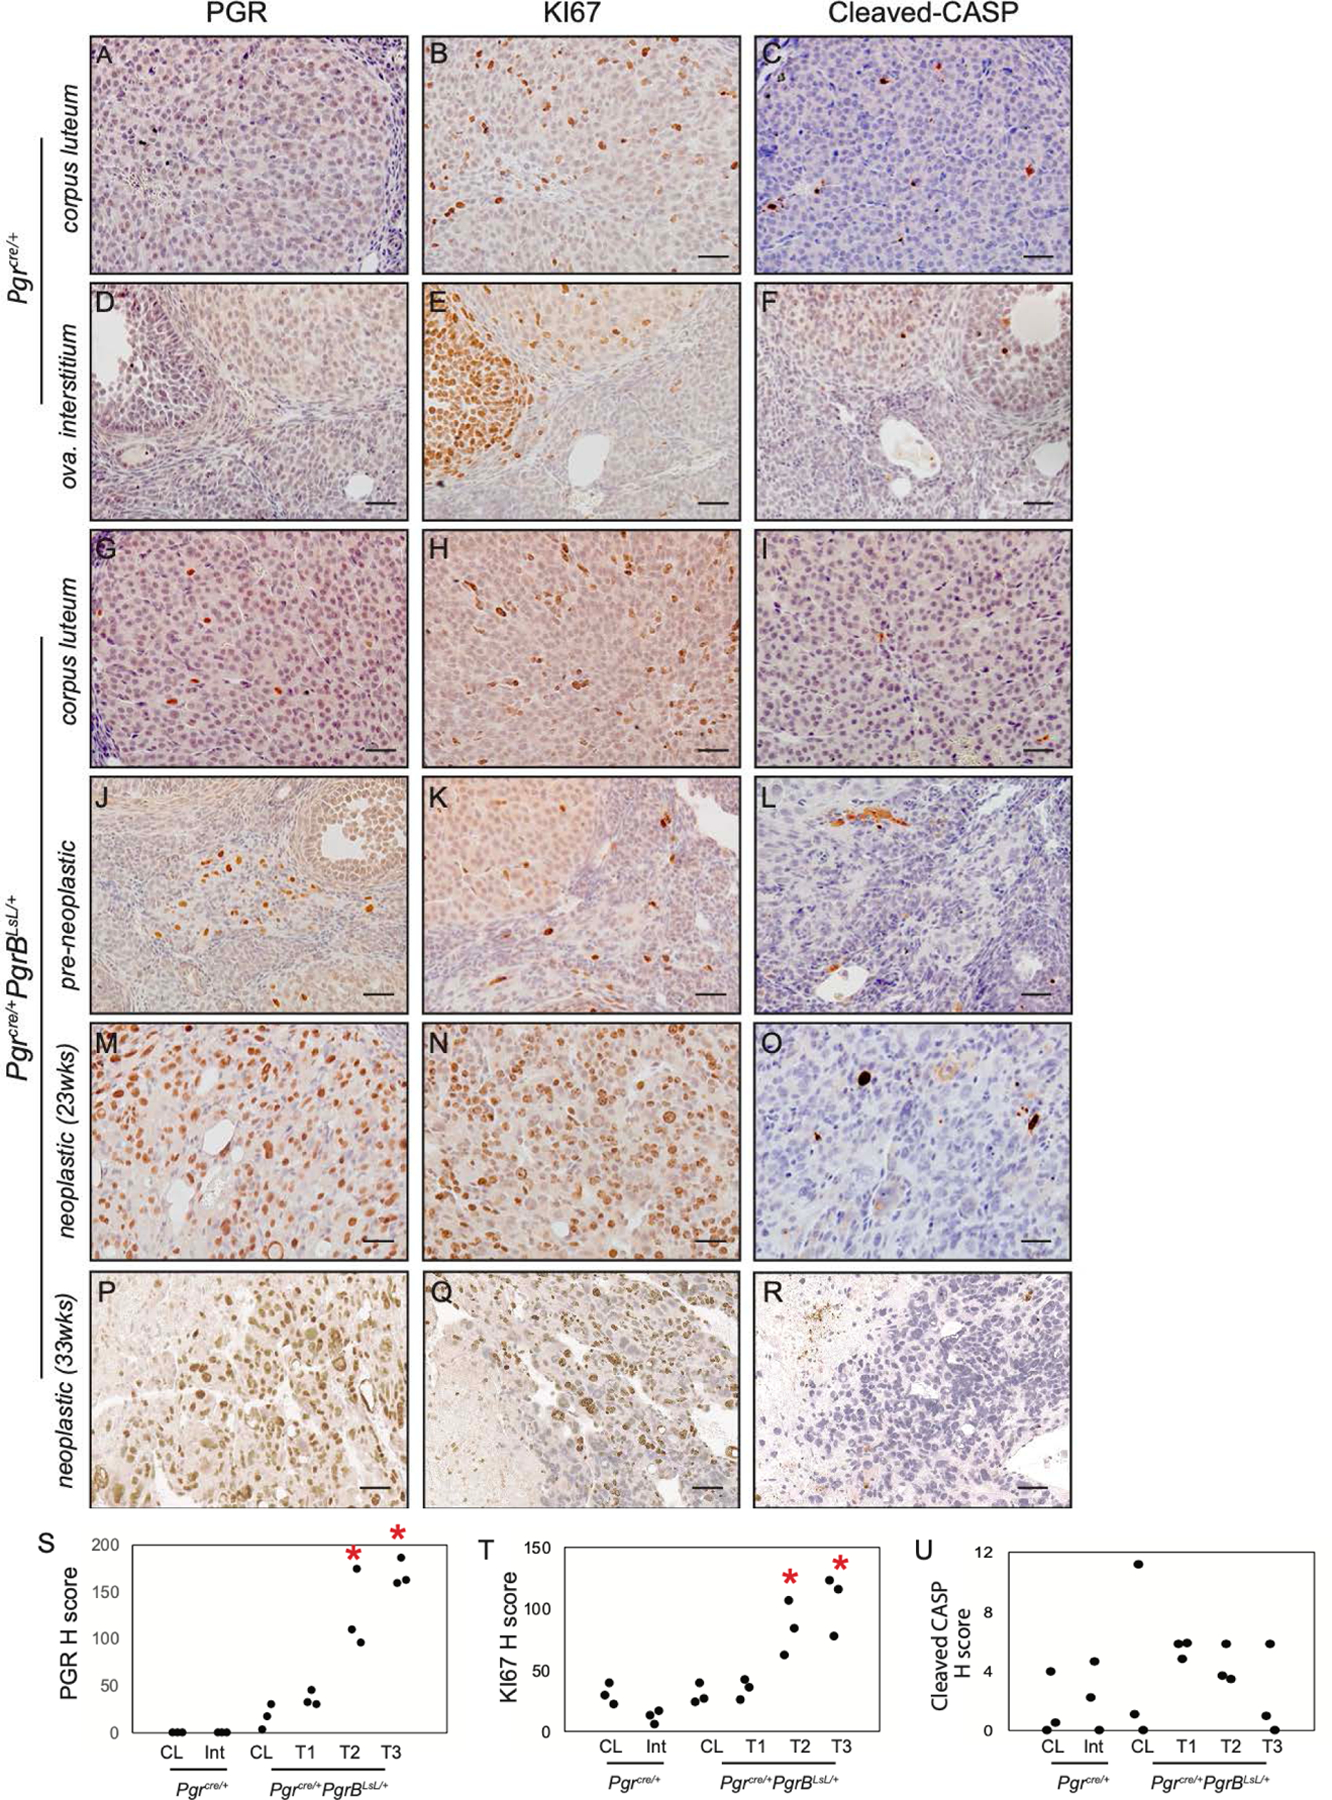
Increased PGR and KI67 positive staining in ovarian neoplasia from Pgrcre/+mPgrBLsL/+ mice. Immunohistochemistry of PGR (A, D, G, J, M, P), KI67 (B, E, H, K, N, Q), and cleaved caspase 3 (CASP3) (C, F, I, L, O, R) in Pgrcre/+mouse corpus luteum (A-C) and ovarian interstitial tissue (D-F) and Pgrcre/+mPgrBLsL/+ mouse normal corpus luteum (G-I), pre-neoplastic abnormal cells (J-L), neoplastic tumor cells from 23 weeks of age (M-O), and neoplastic tumor cells from 33 weeks of age (P-R) using DAB chromogen with hematoxylin counterstain. H score for PGR (S), KI67 (T), and cleaved CASP3 (U) immunohistochemistry for corpus luteum (CL), ovarian interstitium (Int), pre-neoplastic (T1), neoplastic (23wks) tumor (T2), and neoplastic (33wks) tumor (T3). One-way ANOVA with post-hoc Tukey’s test. *p<0.05 compared to CL. n=3 mice. Scale bar is 50μm.
Figure 3:
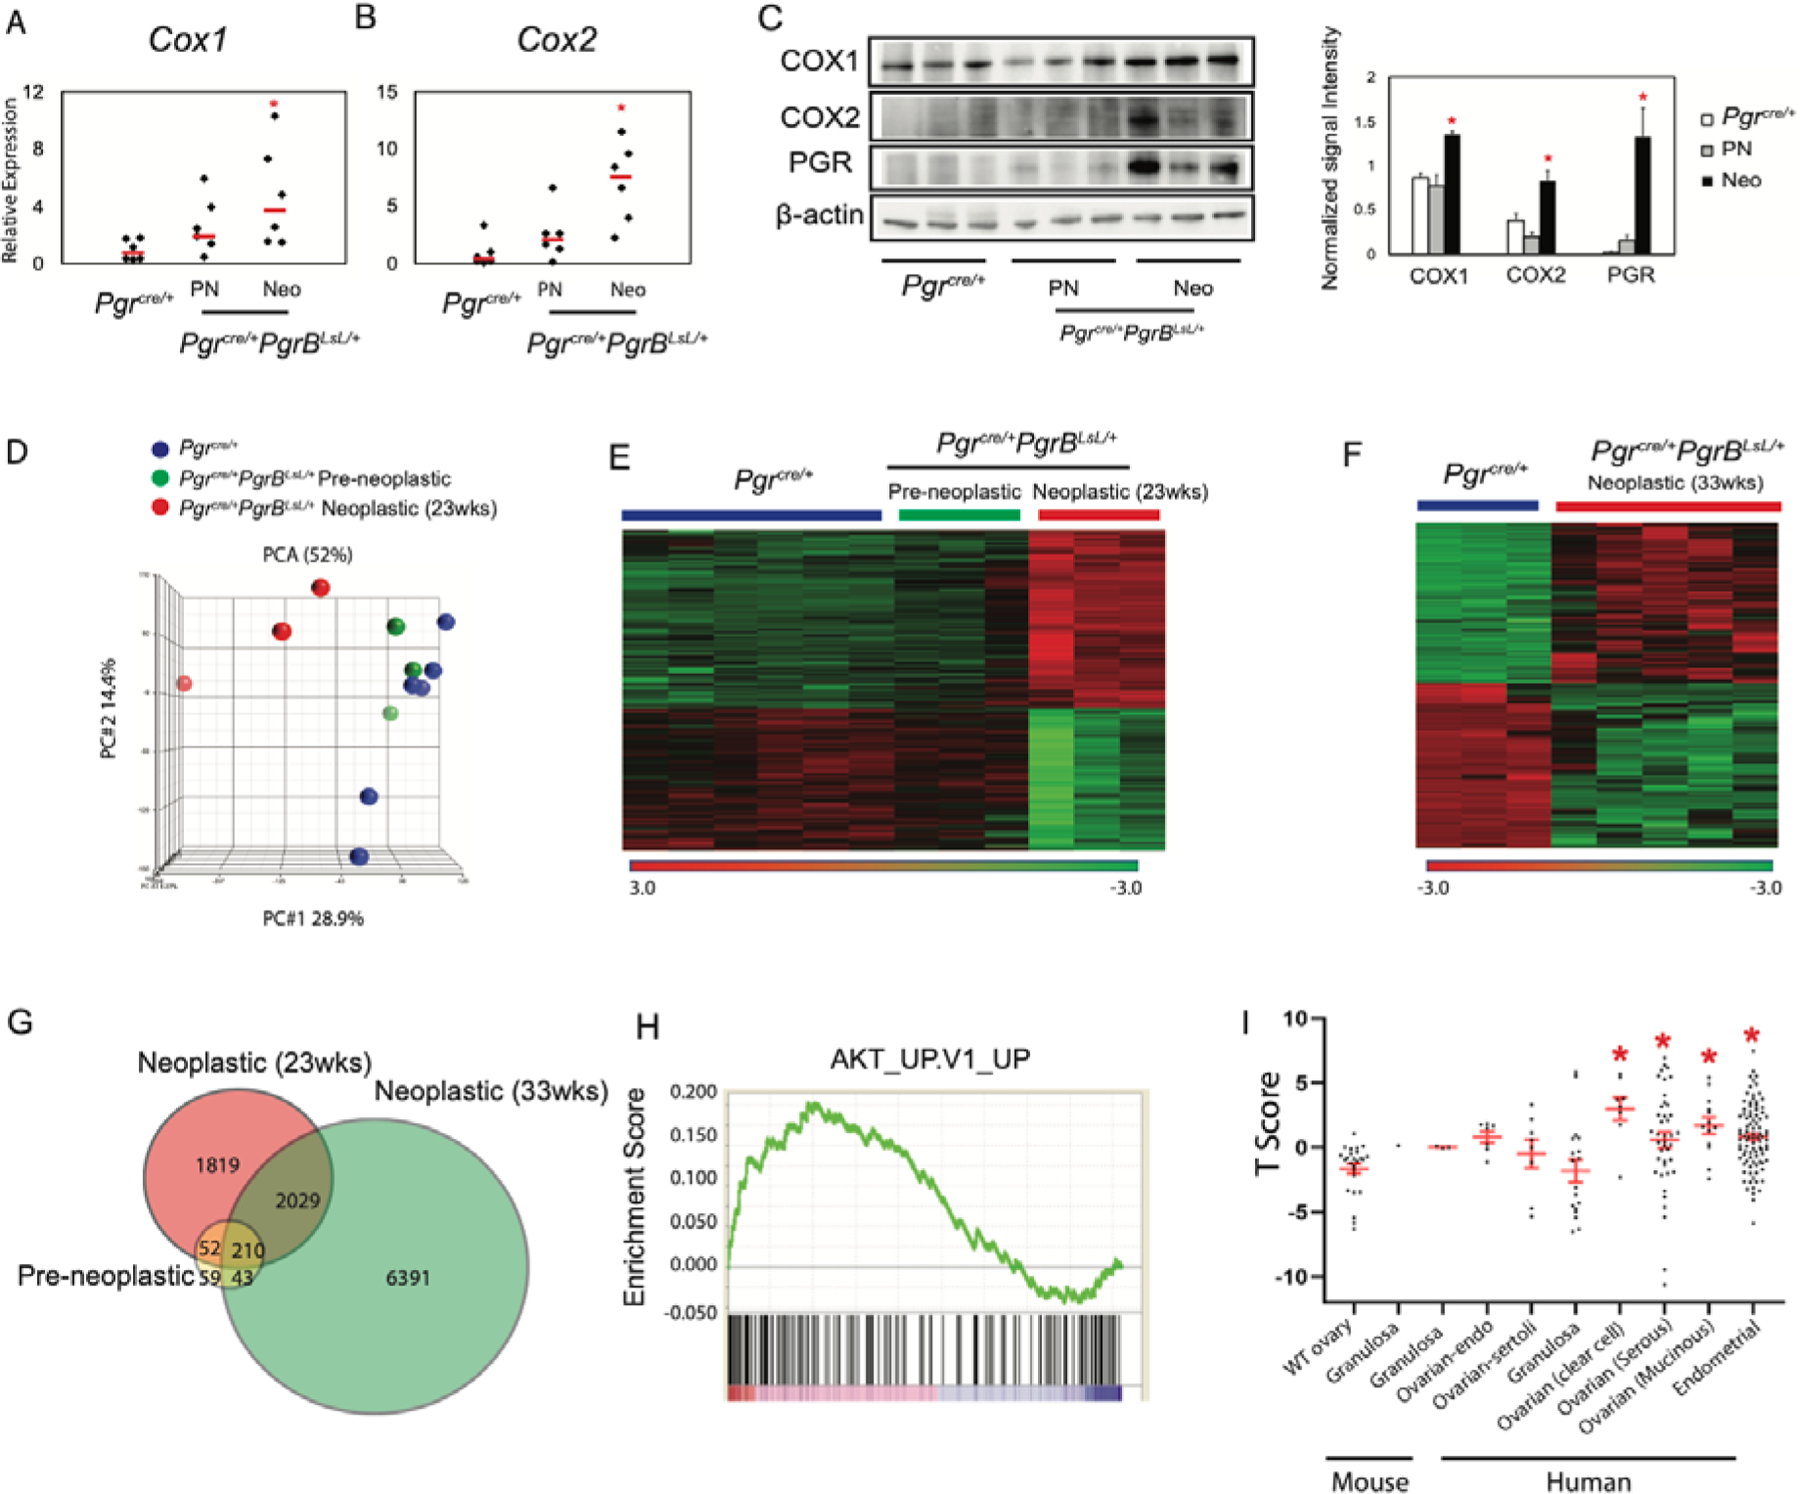
COX1 and COX2 Expression and Gene transcriptome alterations in Pgrcre/+mPgrBLsL/+ mice during tumor progression. Real-time PCR of Cox1 (A) and Cox2 (B) and western blot (C) of COX1, COX2, PGR, and β-actin protein expression and the associated quantification in the Pgrcre/+and Pgrcre/+mPgrBLsL/+ preneoplastic (PN) and neoplastic (Neo) mouse tissues. N=6 mice for real-time PCR and N=3 mice for western blot. One-way ANOVA with post-hoc Tukey’s test. *p<0.05 compared to Pgrcre/+data. Scale bar means SEM. (D) Principle component analysis (PCA) identified two clusters in 23-week-old Pgrcre/+mPgrBLsL/+ mouse ovaries, defined as pre-neoplastic and neoplastic. (E) Transcriptome heatmap demonstrating shifts in expression levels from pre-neoplastic to neoplastic ovarian tissue from 23-week-old Pgrcre/+mPgrBLsL/+ mice. (F) Transcriptome heatmap of neoplastic ovarian tissue from 33-week-old Pgrcre/+mPgrBLsL/+ mice compared to wildtype Pgrcre/+mouse ovaries. (G) Venn diagram depicting differentially regulated genes in pre-neoplastic, neoplastic at 23 weeks of age, and neoplastic at 33 weeks of age from Pgrcre/+mPgrBLsL/+ mouse ovarian tissue with a p-value<0.05, fold changes <−1.3 and >1.3. (H) Gene set enrichment analysis (GSEA) depicts Protein Kinase B (AKT) is the top positively enriched pathway. (I) The T score of transcriptomic signature between 33-week-old Pgrcre/+mPgrBLsL/+ ovarian tumor and other published mouse ovarian tumor, human ovarian and endometrial cancer. One-way ANOVA with post-hoc Tukey’s test. * p<0.05 compared to WT ovary.
To assess whether this ovarian pathology was unique to the PGRB isoform, Pgrcre/+mPgrALsL/+ mice were aged and assessed for the presence of tumor formation. The Pgrcre/+mPgrALsL/+ mice exhibited a similar formation of ovarian pathology, yet with a much lower frequency (Table 1). Both mouse models did not exhibit any metastases. The difference in frequency in tumor development between mice expressing mPgrB versus mPgrA may be a result of differential expression of the isoforms in these mice. Assessment of the expression levels of the mPgrA and mPgrB targeted alleles by immunohistochemistry showed that the levels were comparable in the ovarian interstitial tissue and corpus luteum with expected increased levels in ovarian tumor tissue in the Pgrcre/+mPgrBLsL/+ mice (fig. S2A–L). However, due to the low frequency of expression in the non-tumorigenic ovaries, a more stringent quantification of the expression of the Pgr transgenes was not practical. In order to quantitatively compare the expression of mPGRA and mPGRB protein, western blot analysis of uterine tissue was conducted. Accordingly, levels of the mPgrA and mPgrB targeted alleles exhibit similar protein expression in whole uterine isolates (fig. S2M). Since both targeted alleles are under the same promoter and inserted into the same genomic locus, the expression of the construct in the ovaries after activation by Cre recombinase may be similar, and the differential tumor formation is likely due to differences in the activity of the PGR isoforms. Thus, differential expression and activity of the individual PGR isoforms resulted in ovarian neoplasia with increased proliferation and decreased apoptosis, potentially derived from corpora luteal cells.
Pgrcre/+RosamT/mG mouse model demonstrates the presence of Cre recombination in regressing corpora lutea.
We next wanted to further understand the cell type-specific origin of the ovarian PGR isoform expression. Endogenous PGR is expressed in the granulosa cells of the pre-ovulatory follicle. Upon immunohistochemical analysis, PGR positive cells from regressing corpora lutea were found maintained in the ovarian stroma (fig. S3A–D). This would indicate that these tumors originated from the luteal cells. This is supported by the observation that the ovarian tumors also demonstrated high expression levels of the steroidogenic acute regulatory protein (StAR), a regulator of steroidogenesis and reminiscent of normal corpora lutea (fig. S3E–F). To determine the cell lineage depicting PgrCre activity in the mouse ovary, Pgrcre/+RosamT/mG mice were implemented. In this model, expression of the mTomato (red) marker indicates cells with no Cre recombinase activity. Cells expressing GFP (green) demarcates the cells in the lineage of Pgrcre expression (18). To identify where the Pgrcre/+ initiates recombination and resultant PGRB expression in the ovary, fluorescence was measured in ovarian tissue from Pgrcre/+mPgrBLsL/+ mice (fig. S4A–H). Positive green staining demonstrates recombination occurring in regressing corpora lutea of the ovary (fig. S4C–D, G–H). Thus, the origin of the Pgrcre/+mPgrBLsL/+ mouse ovarian neoplasms is likely within the regressing corpora lutea at the site of recombination.
Cycling progesterone levels and FSH and LH levels are normal in conditional PGR expression mice.
In order to determine if the ovarian pathology observed in these mice impacted function, we assayed ovulation and ovarian endocrine regulation in mice expressing the Pgr alleles. Pgrcre/+mPgrALsL/+ and Pgrcre/+mPgrBLsL/+ mice exhibited normal ovulation rates (fig. S5A–B). Although the PGR is genetically engineered to express at high levels in the Pgrcre/+mPgrBLsL/+ mice and the previously described Pgrcre/+mPgrALsL/+ mice (12), the effect of the conditional allele on circulating progesterone ligand is unknown. Excess levels of cycling progesterone in mice can affect the amount of active PGR signaling. To identify the levels of endogenous progesterone levels, serum was obtained from virgin, 23-week old Pgrcre/+mPgrBLsL/+ and Pgrcre/+mPgrALsL/+ mice and submitted to the Ligand Assay and Analysis Core at the Center for Research in Reproduction at the University of Virginia. The level of cycling progesterone across all mice was comparable with no significant differences (fig. S6A). Additionally, follicle-stimulating hormone (FSH) and luteinizing hormone (LH), which signal from the pituitary to the ovary to produce the steroid hormones (1), also exhibited normal levels across all genotypes (fig. S6B–C). Circulating estradiol levels exhibited no change in the Pgrcre/+mPgrBLsL/+ mice (fig. S6D). Thus, the PGRB and PGRA overexpression alleles do not impair circulating progesterone ligand or FSH and LH levels, nor are estrogen levels impaired upon PGRB expression.
Comparative transcriptomic analysis of tumor development reveal two distinct neoplastic stages from Pgrcre/+mPgrBLsL/+ mice.
To identify changes in gene expression during tumor progression, ovarian tumors were harvested from Pgrcre/+mPgrBLsL/+ mice, while age-matched ovaries from wildtype Pgrcre/+ mice served as control. Total RNA was isolated and RNA microarrays were performed. Principle component analysis on the raw microarray data for wildtype, pre-neoplastic, and neoplastic stages at 23 weeks of age revealed the transcriptome from Pgrcre/+ tissue was similar to the profile from pre-neoplastic tissue samples (Fig. 3D). However, the neoplastic transcriptome profile exhibited an overall differential expression compared to wildtype or pre-neoplastic profiles. These same results were confirmed in RNA profiling heatmap analysis (Fig. 3E). The pre-neoplastic expression profile, although similar to the wildtype profile, also exhibits some similarity to the neoplastic profile (Fig. 3E). Furthermore, separate transcriptomic analyses between 33 week old Pgrcre/+ ovarian tissue and neoplastic tumor tissue demonstrate a profile very similar to the changes observed between 23 week old wildtype and neoplastic profiles (Fig. 3E–F). Therefore, the 23 and 33 week old neoplastic tumor RNA expression profiles differ from age-matched wildtype ovarian tissue.
To further compare these microarray profiles, significant genes from each tumor stage expression profile were intersected in Venn diagram format (Fig. 3G). Neoplastic profiles from both 23 and 33 weeks of age exhibit strong similarity with 2,029 genes overlapped, with 210 of those genes also observed in the pre-neoplastic expression profile. Total lists of differentially expressed genes for pre-neoplastic, neoplastic at 23 weeks of age, and neoplastic at 33 weeks of age are reported in Data File S1.1–1.3. Further examination was performed using Ingenuity Pathway Analysis to identify the top altered canonical pathways in neoplastic ovarian tissue at 23 weeks of age. This expression profile exhibits strong characteristics for proliferation, growth, and immune cell signaling (table S2). Notably, the PI3K/AKT pathway and cell cycle pathway were significantly changed, representing two routes of regulation of cell growth (19). Thus, at 23 weeks of age, the neoplastic ovarian tumor tissue exhibits a strong growth profile, indicative of neoplasia.
Gene expression enrichment and correlative comparisons suggest molecular similarities between PGRB neoplasia and ovarian and endometrial cancer.
To further examine how the PGRB-driven ovarian neoplasia correlates with human disease, online gene correlation tools were implemented. Gene Set Enrichment Analysis (GSEA) was performed to measure the enrichment score for AKT signaling in the 33 week-old neoplastic ovarian tumor tissue. Utilizing the publicly available GSEA Enrichment Scoring, the ovarian neoplasia exhibited a highly positive enrichment score for the AKT pathway (Fig. 3H). We compared the transcriptomic signature of the Pgrcre/+mPgrBLsL/+ 33-week old neoplastic ovarian tumors with mouse granulosa (GSE8156, GSE67662 (20, 21)) and ovarian endometrial tumors (GSE5987 (22)) as well as human ovarian-sertoli (GSE71160 (23)), granulosa (E-MTAB-483 (24)), endometrial (GSE17025 (25)), ovarian-clear cell, serous and ovarian-mucinous (GSE6008 (26)) tumors. Consequently, there was only a significant T score in the comparisons of the Pgrcre/+mPgrBLsL/+ tumor with human endometrial, ovarian clear cell, ovarian serous, and ovarian mucinous tumors. Thus, independent of cell origin, the transcriptome of the Pgrcre/+mPgrBLsL/+ tumor reflected a similar PGR-driven signature observed in human endometrial and ovarian tumors compared to that of mouse or human granulosa cell transcriptomes (Fig. 3I).
Pgrcre/+mPgrBLsL/+ ovarian tissue exhibits a pro-proliferative expression profile independent of mTORC1 activation.
Due to the strong PI3K/AKT signature identified in the top canonical pathway list for neoplastic ovarian tissue at 23 weeks of age (table S2, Fig. 3H), immunohistochemistry on all stages of ovarian tissue from Pgrcre/+mPgrBLsL/+ mice was examined, first for active AKT signaling. Staining for AKT and active, phosphorylated AKT was performed on wildtype ovarian corpus luteum and interstitium and compared to ovarian tissue from pre-neoplastic and neoplastic staged Pgrcre/+mPgrBLsL/+ mice. AKT and pAKT positive staining was observed in neoplastic tissue from Pgrcre/+mPgrBLsL/+ mice (Fig. 4A–B, D–E, G–H, J–K, M–N, P–Q, S–T). Additionally, CCND1, a critical cyclin protein required for S phase entry into the cell cycle, was identified to be increased in neoplastic ovarian tissue at both 23 and 33 weeks of age from Pgrcre/+mPgrBLsL/+ mice compared to wildtype (Fig. 4C, F, I, L, O, R, U). H score intensity analysis confirmed significant increases in pAKT and CCND1 levels in Pgrcre/+mPgrBLsL/+ interstitium and neoplastic tissues.
Figure 4:
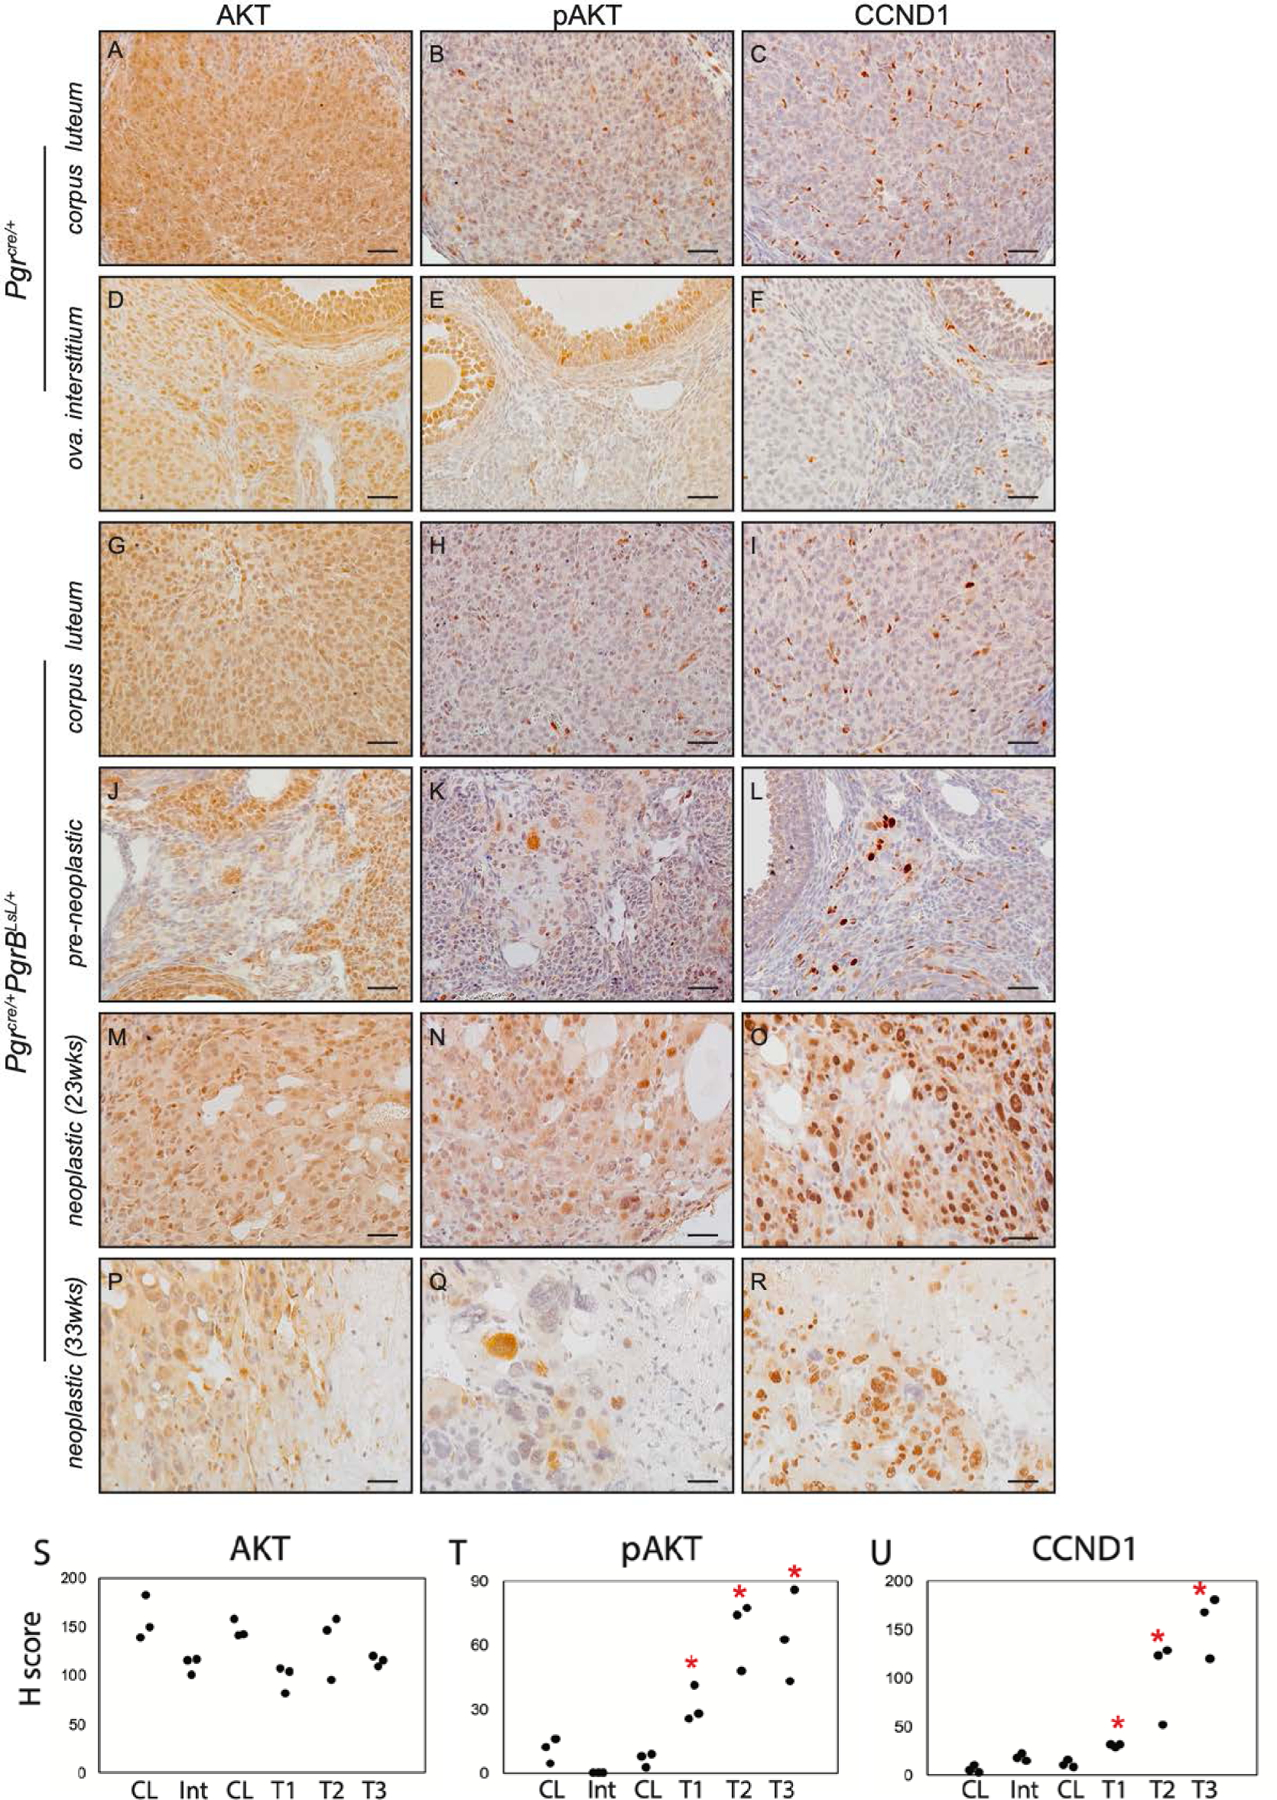
Increased pAKT and CCND1 positive cells in ovarian neoplasia from Pgrcre/+mPgrBLsL/+ mice. Immunohistochemistry of AKT (A, D, G, J, M, P), pAKT (B, E, H, K, N, Q), and CCND1 (C, F, I, L, O, R) in Pgrcre/+mouse corpus luteum (A-C) and ovarian interstitial tissue (D-F) and Pgrcre/+mPgrBLsL/+ mouse normal corpus luteum (G-I), pre-neoplastic abnormal cells (J-L), neoplastic tumor cells from 23 weeks of age (M-O), and neoplastic tumor cells from 33 weeks of age (P-R) using DAB chromogen with hematoxylin counterstain. H score indices for AKT (S), pAKT (T), and CCND1 (U) immunohistochemistry for corpus luteum (CL), ovarian interstitium (Int), pre-neoplastic (T1), neoplastic (23wks, T2), and neoplastic (33wks, T3) tumor. One-way ANOVA with post hoc Tukey’s test. *p<0.05 compared to CL. n=3 mice. Scale bar: 50 μm.
To further examine the extent of activation of this AKT-driven proliferation pathway, MAPK1/ERK and mTORC1 signaling were examined. MAPK1/ERK protein levels were unchanged, yet phosphorylated ERK was significantly increased in advanced ovarian tumor stages from Pgrcre/+mPgrBLsL/+ mice (Fig. 5A–N). However, this activation is independent of mTORC1 as phosphorylation levels surprisingly decrease in Pgrcre/+mPgrBLsL/+ ovarian tumor tissue compared to intact ovaries from control mice (fig. S7A–K). AKT and ERK signaling pathway activation was similar in ovarian interstitial tissue and corpus luteum between both the Pgrcre/+mPgrALsL/+ and Pgrcre/+mPgrBLsL/+ mice (fig. S8A–T). Yet, pAKT and pERK expression significantly increased in tumorigenic tissue from Pgrcre/+mPgrBLsL/+ mice compared to corpus luteum and ovarian interstitium from Pgrcre/+mPgrALsL/+ mice (fig. S8H, P, R, T). Tumors from Pgrcre/+mPgrALsL/+ mice did not exhibit changes in the AKT or the MAPK1/ERK pathway, confirming this activated proliferation cascade is dependent on PGRB presence (fig. S9A–F). Therefore, PGRB expression in the ovary results in heightened levels of AKT and the MAPK1/ERK pathway, yet decreased levels of mTORC1 phosphorylation with combined increases in cell cycle pathways resulting in a proliferative signature.
Figure 5:
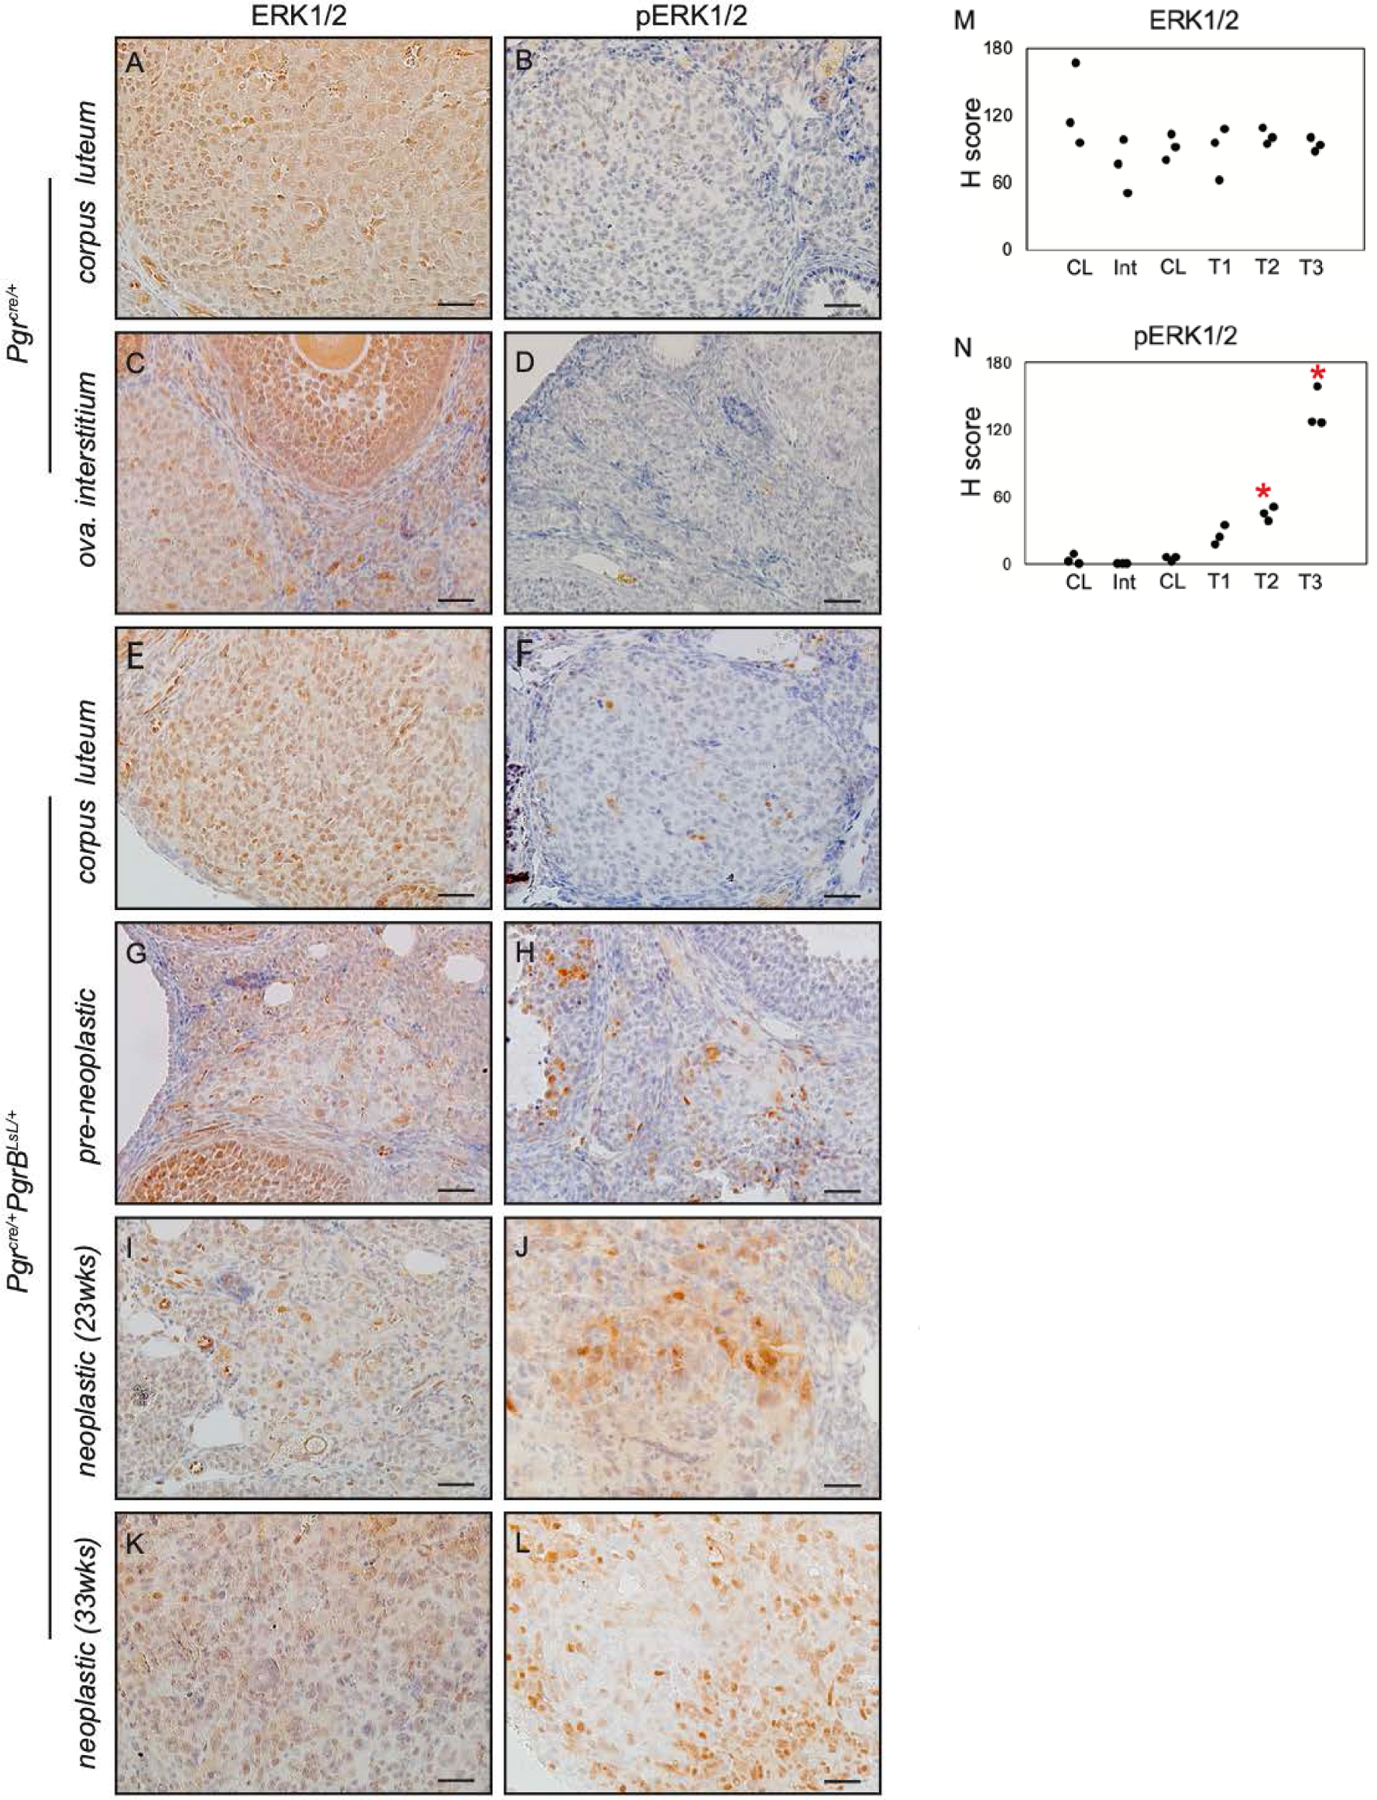
pERK levels increase in Pgrcre/+mPgrBLsL/+ ovarian tumor. Immunohistochemistry of ERK (A, C, E, G, I, K) and pERK (B, D, F, H, J, L) in the corpus luteum (A, B) and ovarian interstitial tissue (C, D) of the Pgrcre/+ovary (A-D), the corpus luteum (E, F), pre-neoplastic (G, H), Neoplastic (23wks, I, J) and Neoplastic (33wks, K, L) of Pgrcre/+mPgrBLsL/+ ovary (E-L). H score of ERK (M) and pERK (N) in the corpus luteum (CL), ovarian interstitium (Int), pre-neoplastic (T1), Neoplastic (23wks, T2) and Neoplastic (33wks, T3). One-way ANOVA with post-hoc Tukey’s test. *p <0.05 compared to CL. n=3 mice. Scale bar: 50 μm.
Estrogen receptor expression is often observed in ovarian carcinogenesis (27). Yet, both Esr1 and Esr2 mRNA levels were not changed in the Pgrcre/+mPgrALsL/+ and Pgrcre/+mPgrBLsL/+ ovaries at pre-neoplastic stages (fig. S10A–B). This suggests Esr expression is not responsible for the isoform distinct tumor development. Accompanied with the increased Pgr expression, multiple granulosa marker genes including Foxl2, Gata4, Inhbb, Foxo1 were all decreased in the neoplastic tissues of Pgrcre/+mPgrBLsL/+ ovaries (fig. S10C–G). Thus, these data suggest that expression of the PGRB isoform in neoplastic ovarian tissues causes decreased estrogen receptor signaling and aberrant granulosa cell markers, thereby failing to maintain granulosa cell characteristics.
Chronic RU486 treatment prevents tumor growth in PGRB expressing mice.
Due to the robust phenotype of abnormal cells and developing tumors in the Pgrcre/+mPgrBLsL/+ mice, it was important to determine whether progesterone signaling was responsible for driving tumor growth. To test this, Pgrcre/+mPgrBLsL/+ mice exhibiting an ovarian tumor through ultrasound imaging were treated chronically for 8 weeks with placebo or the PGR antagonist, RU486. Tumor growth was measured weekly as described above. The treatment with RU486 prevented the increase in tumor size compared to control (Fig. 6A). Additionally, the average tumor volume fold change from the start of the treatment until the end of the treatment decreases slightly with RU486 treatment, yet was not significant. After 8 weeks of treatment or until the allowable end point was reached, mice were euthanized, and tissue was harvested. Vehicle treated Pgrcre/+mPgrBLsL/+ mice were often euthanized due to moribundity before the end of the 8-week study. However, none of the RU486 treated mice exhibited moribundity before the end of the experiment. The gross tumor morphology for Pgrcre/+mPgrBLsL/+ animals treated with placebo or RU486 exhibited size differences (Fig. 6B–C). Ultrasound still images from the initiation of the 8-week treatment to the completion of the study demonstrate changes in size and density of the placebo and RU486 treated tumors (Fig. 6D–G). ImageJ analysis of the ultrasound still images at the completion of the study reported increased cell area, cell signal, and integrative density in placebo treated tumors compared to RU486 treated tumors (fig. S11A–C). Chronic RU486 treatment also resulted in decreased pAKT and pERK protein levels, confirming successful inhibition of proliferative signaling pathways observed in the Pgrcre/+mPgrBLsL/+ tumor tissue (fig. S12A–N).
Figure 6:
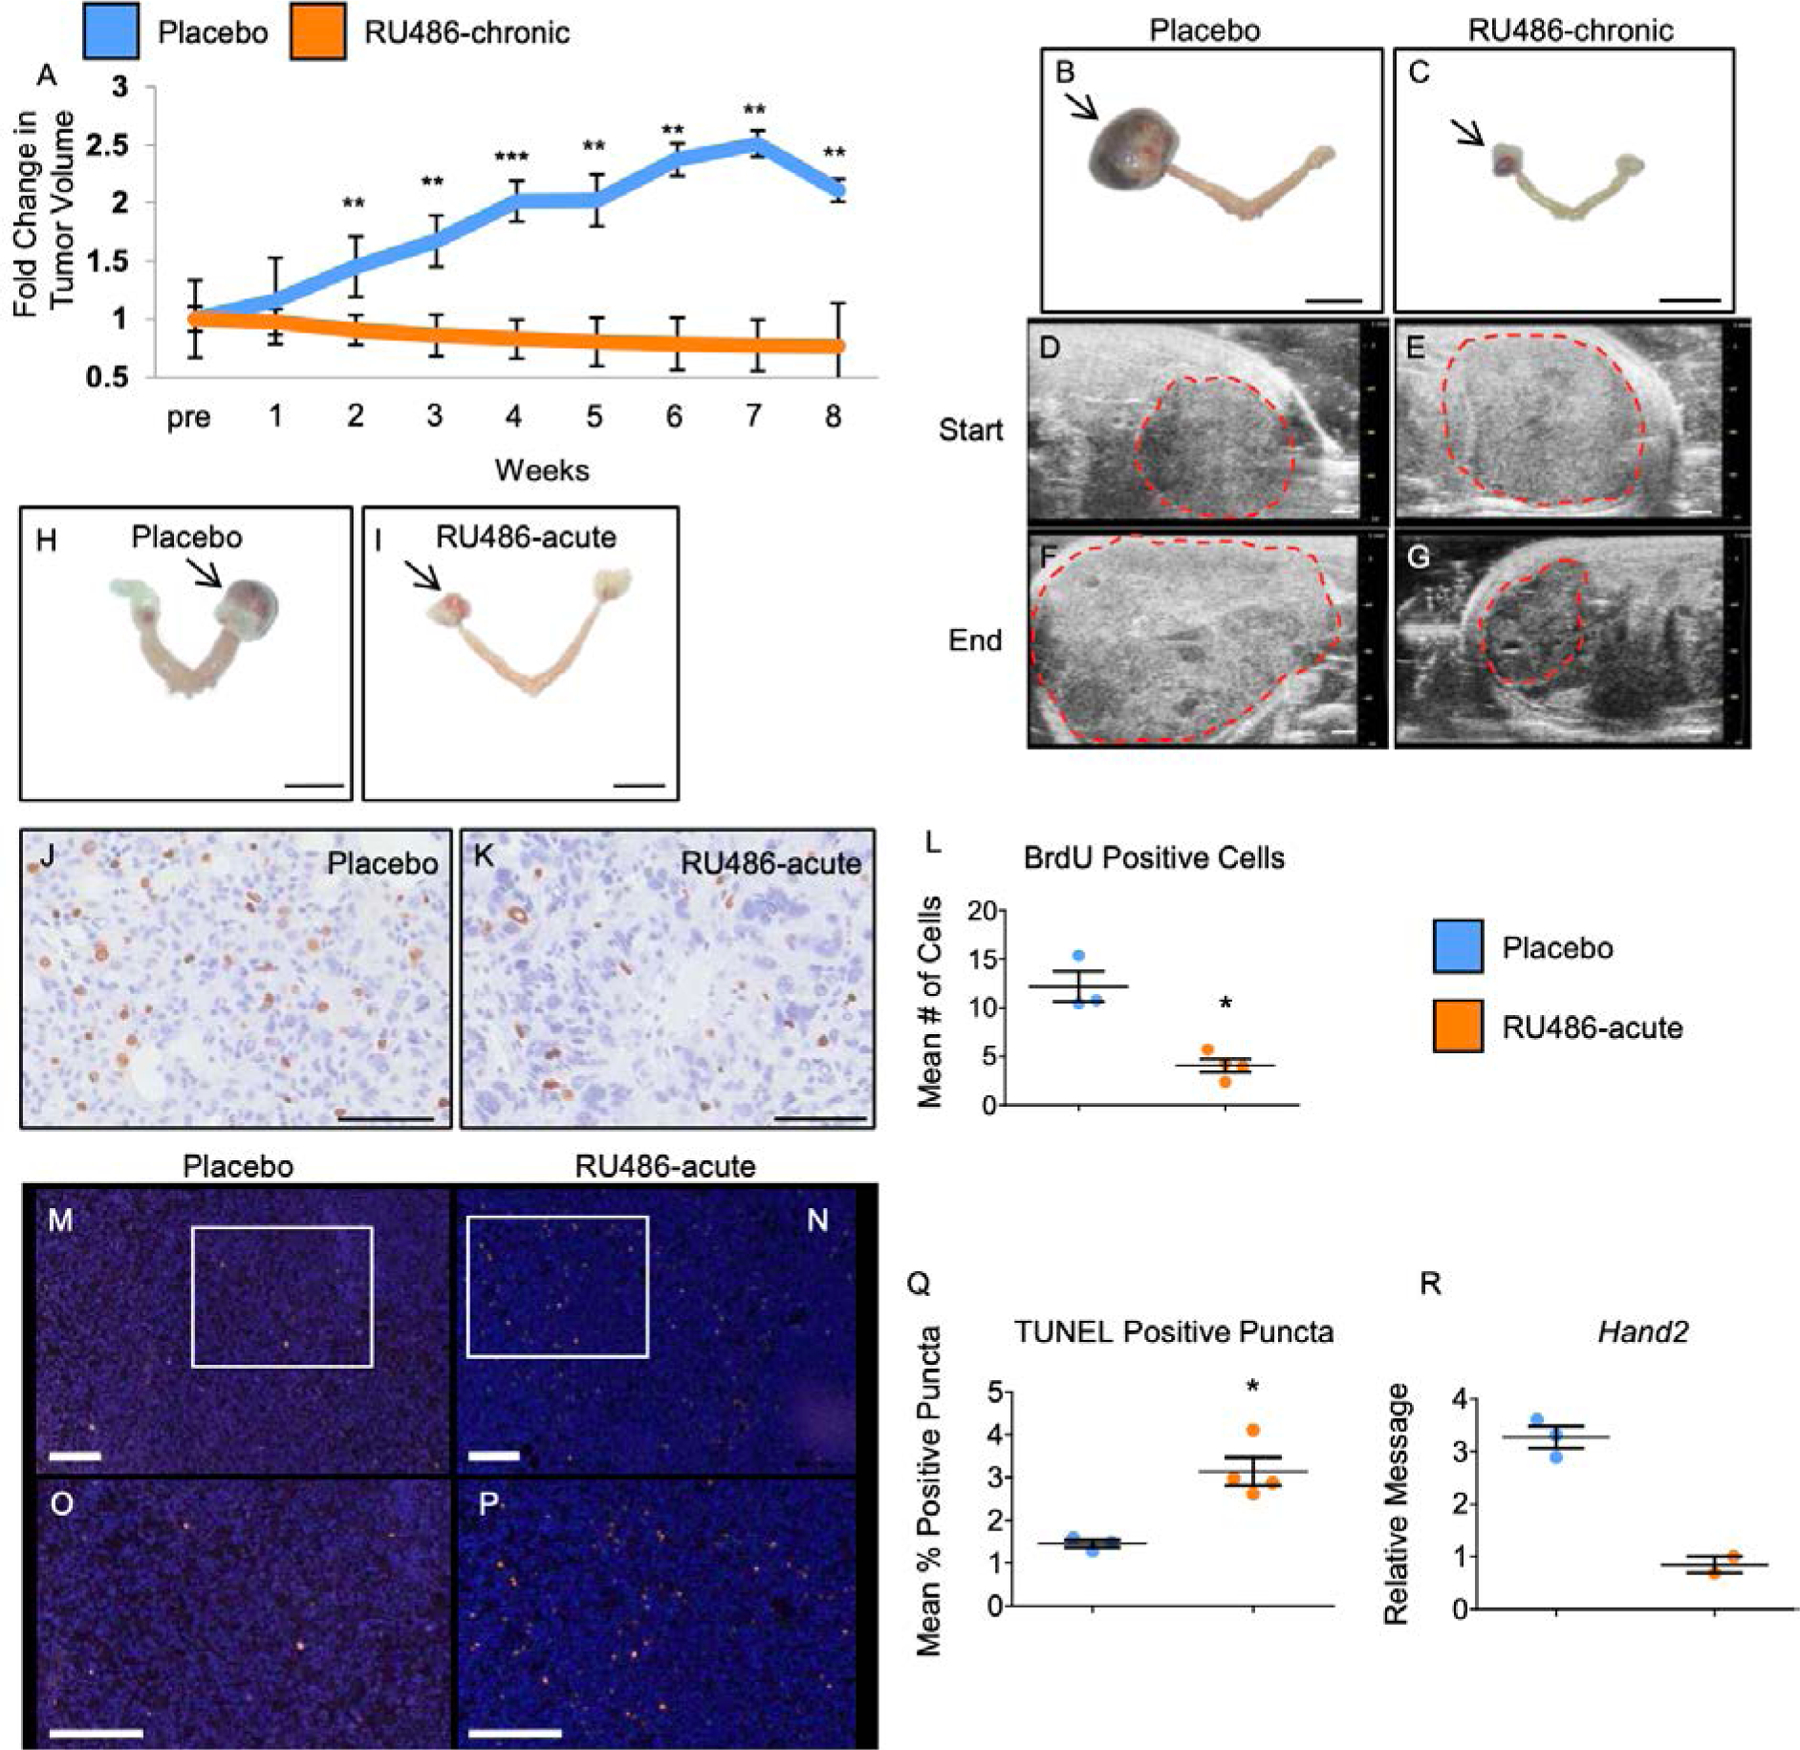
Treatment of Pgrcre/+mPgrBLsL/+ mice with RU486 abrogates tumor growth. (A) Graphical description of fold change in tumor volume over time for Pgrcre/+mPgrBLsL/+ tumor burdened mice treated with placebo versus the progesterone receptor antagonist, RU486. The x-axis describes the length of treatment (weeks) before sacrifice. “Pre” denotes the time before start of treatment. Fold tumor volume change for tumors was calculated as the average fold change (log10(tumor volume) normalized to one) for each treatment with One-Way ANOVA and Student’s t-test used to determine significance at timepoints between the groups. n=6 mice.(B-C) Gross morphological images of placebo treated (B) and RU486 chronically treated (C) uterus. Arrows indicate the ovarian tumors. 1 cm scale bar for B-C. (D-G) Ultrasound images of Pgrcre/+mPgrBLsL/+ ovarian tumors with demarcated tumor boundaries before the start of treatment (“Start”) (D-E) and after 8 weeks of treatment (“End”) (F-G) for placebo treated (D,F) versus RU486 treated tumors (E,G). 1 mm scale bar for D-G. (H-I) Gross morphological images of placebo (H) and RU486 (I) 24-hour treated uteri exhibiting ovarian tumors. Ovarian tumors indicated by arrows. (J-K) BrdU incorporation in tumor tissue from acute treated tumors. (L) Quantification of BrdU positive cells from acute treated Pgrcre/+mPgrBLsL/+ tumor tissue. (M-N) TUNEL staining from 24 hour treated Pgrcre/+mPgrBLsL/+ tumor tissue. (O-P) inset of TUNEL staining from (M-N). (Q) Quantification of positive TUNEL staining in vehicle versus RU486 24 hour treated Pgrcre/+mPgrBLsL/+ tumors. *, P<0.05, **, P<0.01, ***, P<0.001. Error bars represent ±SEM. n=3 mice. 1 cm scale bar for H-I. 100 μm scale bar for J-K. 200 μm scale bar for M-P. (R) Relative mRNA level for PGR target, Hand2 with n=2–3 data points. Student’s t-test was utilized to assess for significance for BrdU and Tunel analyses.
Acute RU486 treatment sufficiently reduces proliferation in Pgrcre/+mPgrBLsL/+ mouse ovarian tumors.
Pgrcre/+mPgrBLsL/+ mice exhibiting a tumor size between 0.5–1 cm in diameter were administered RU486 or placebo for 24 hours. Mice were euthanized and the tumor was harvested for nucleic acid extraction and histological fixation. Examples of gross tumor morphologies for Pgrcre/+mPgrBLsL/+ mice treated with RU486 or placebo for 24 hours are displayed (Fig. 6H–I). To assess the effects of inhibition of progesterone signaling on tumor growth and cell survival, cellular proliferation and cell death number were evaluated. Within 24 hours of RU486 treatment, cell proliferation measured by BrdU incorporation was significantly attenuated compared to placebo (Fig. 6J–L). Furthermore, TUNEL analysis reported a higher level of fractionated DNA fragments in the RU486 treated group compared to the placebo group (Fig. 6M–Q). Additionally, the 24-hour treatment of RU486 also reduced the expression of the PGR target gene, Hand2 (Fig. 6R). Therefore, a 24-hour treatment of RU486 is sufficient to reduce cellular proliferation and increase cell death in tumors from Pgrcre/+mPgrBLsL/+ mice.
PGRB transcriptionally regulates genes involved in cell cycle, DNA recombination, and cancer.
To further understand how progesterone signaling drives tumor progression within the ovary, RNA was isolated from placebo and RU486 treated Pgrcre/+mPgrBLsL/+ ovarian tumors and a microarray was performed. The number of significantly changed genes totaled 995 with 383 and 612 genes increased and decreased, respectively (Fig. 7A, red circle). The list of genes is reported in the Data File S1.4. Ingenuity Pathway Analysis reported the top changed pathways to include cell cycle related pathways along with breast and pancreatic cancer signaling (table S3). This focused list of oncogenic pathways provides a robust indication of the tumorigenic agenda of the progesterone-driven neoplasia arising in the Pgrcre/+mPgrBLsL/+ mice.
Figure 7:
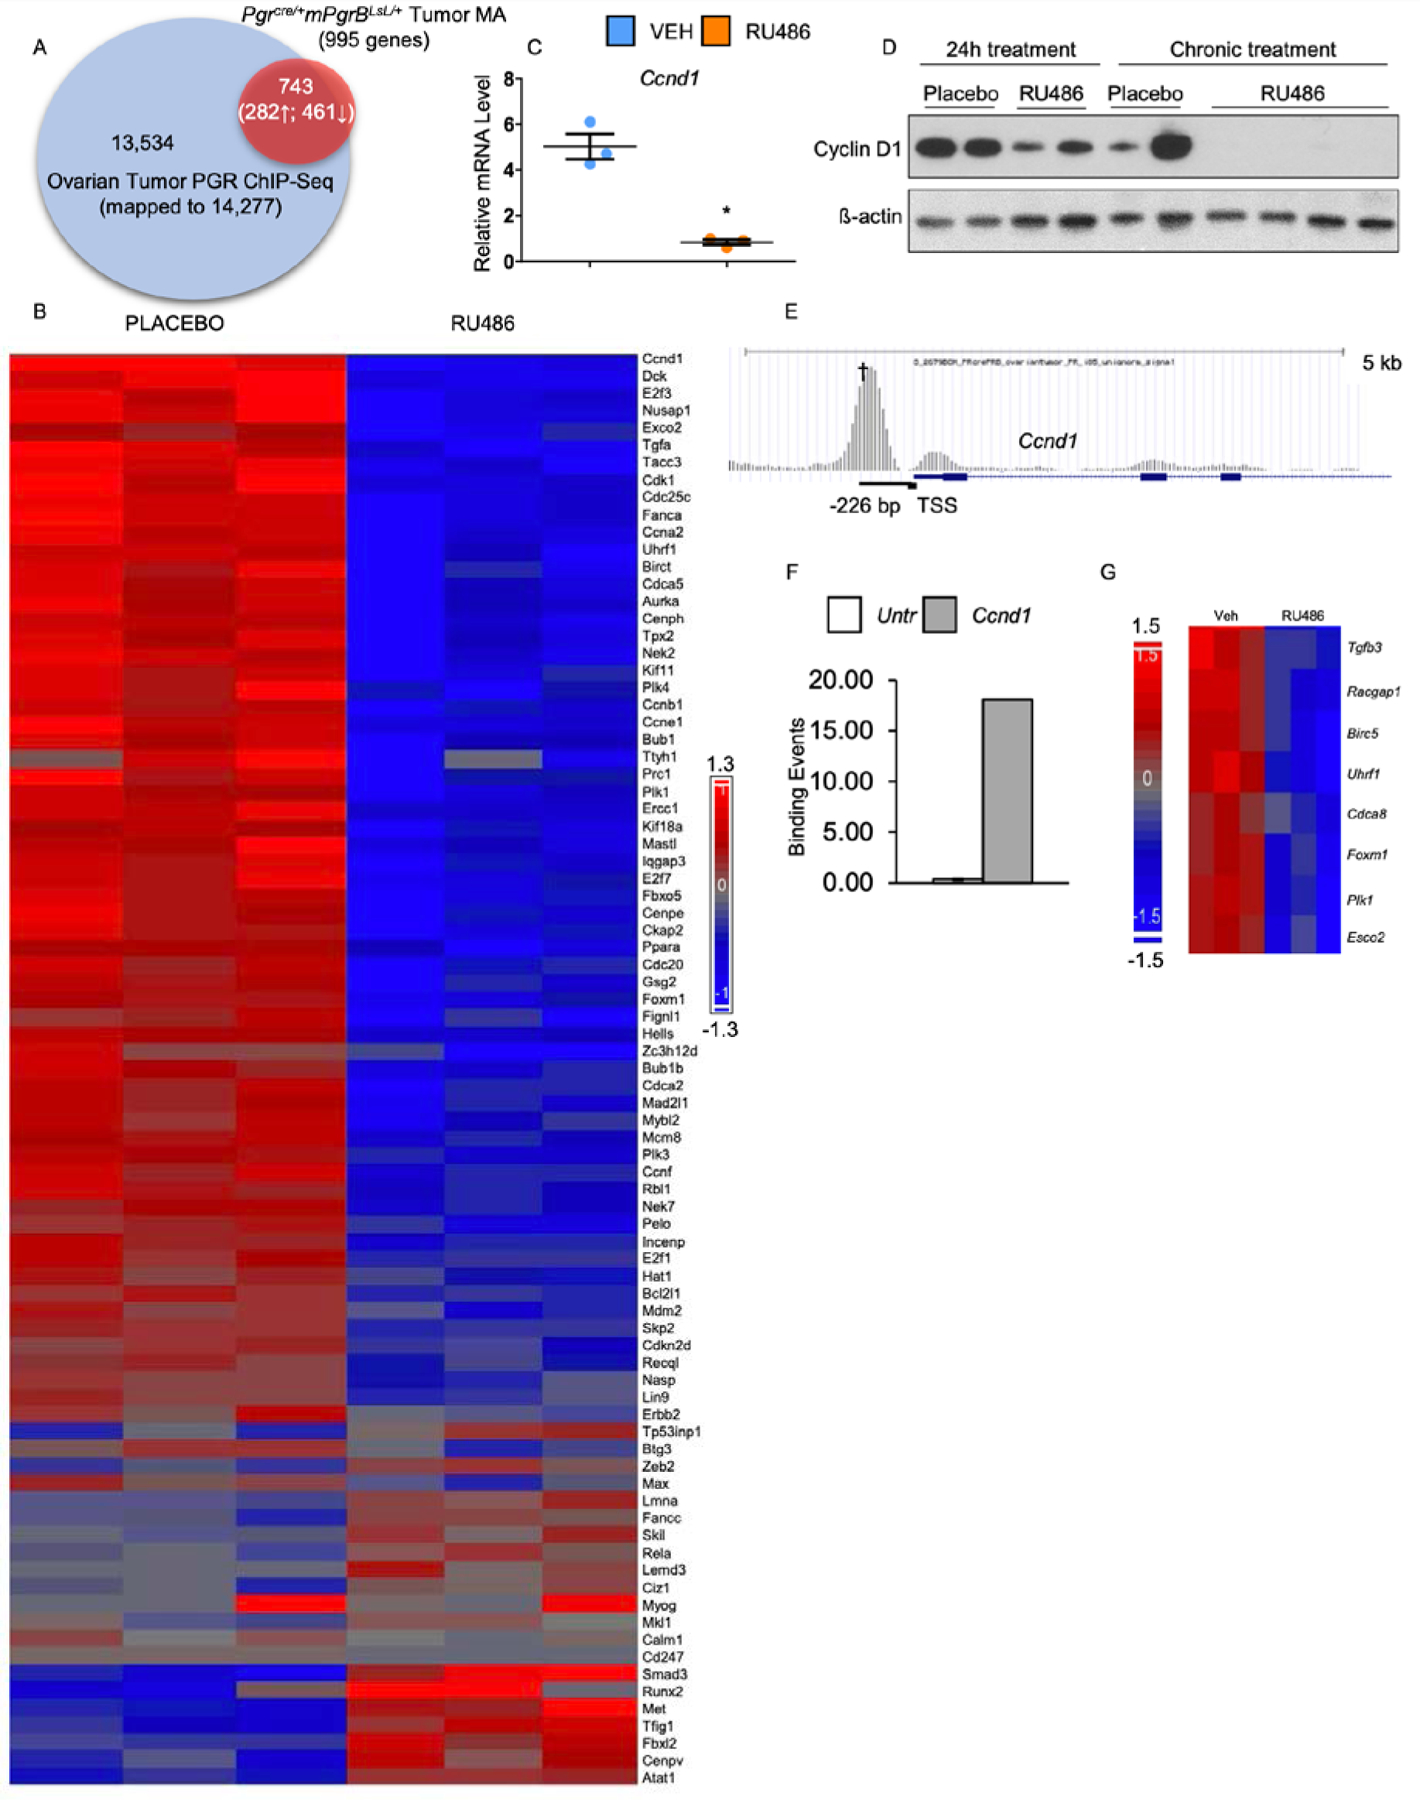
Transcriptomic and cistromic analyses define a subset of genes significantly increased and decreased and directly bound by PGRB in the Pgrcre/+mPgrBLsL/+ ovarian neoplasia tissue. (A) PGR ChIP-Seq data is represented by the blue circle describing the total genes bound by PGR in the enhanced promoter region of the ovarian tumor (14,277 total genes). The red circle signifies RNA microarray data displaying gene transcripts in the vehicle versus RU486 tumor tissue with fold changes above 1.14 or below 0.714 with a p-value of ≤ 0.05 (995 total genes). The overlapping region of both circles describes the significant genes observed in the RNA microarray and the positively bound genes identified in the ChIP-Seq (743 genes total, 282 upregulated, 461 downregulated). (B) Heat map describing the increased and decreased cell cycle genes identified via pathway analysis. (C) Relative mRNA levels for Ccnd1 after acute RU486 or placebo treatment of Pgrcre/+mPgrBLsL/+ ovarian tumors. Student’s t-test with was utilized to assess for significance. Error bars represent ±SEM. (D) Western blot analysis of Pgrcre/+mPgrBLsL/+ tumors treated with RU486 or placebo for 24 hours or 8 weeks (chronic). Total CCND1 and β-actin protein are displayed. (E) Graphical description of the PGRB binding event on the loci of Ccnd1. † indicates the binding interval validated in (F).(F) ChIP-qPCR validation of the PGRB binding event 226 bp upstream of the transcription start site (TSS) at the Ccnd1 locus. Y-axis indicates the amount of binding events per 1000 cells in the untranslated region versus interval of interest. (G) Heat map describing the differentially regulated Ccnd1 gene targets identified via pathway analysis. *, P≤ 0.05.
In order to further confirm the direct regulation of these top pathways by PGRB, a PGR ChIP-Seq analysis was performed on Pgrcre/+mPgrBLsL/+ tumor tissue harvested from >7.5 month old virgin mice. Using the Cistrome Analysis Pipeline, the ChIP-Seq exhibited robust binding enrichment in the promoter and 5’ UTR regions of genes (fig. S13A), with preferential localization at nuclear receptor, ATF/JUN, GATA, and CEBP motifs (fig. S13B).
Comparative analysis was performed using the PGR bound genes from the ovarian tumor ChIP-Seq and the RU486 versus placebo treated tumor microarray. Of the 995 significantly changed genes, 743 were directly bound by PGR within 5kb of the transcription start site (Fig. 7A). Ingenuity Pathway Analysis of the 743 genes revealed PGR directly regulates genes involved in cell cycle, cell development, DNA recombination, and cancer pathways (table S4). Due to the abundant changes in cell cycle in RU486 versus placebo treated tumor tissue, a heatmap was generated to report normalized individual tumor sample values for cell cycle related genes (Fig. 7B). This heatmap depicts over 80 cell cycle associated genes, many of which exhibit downregulation upon treatment with RU486. Thus, PGRB promotes the upregulation of many genes involved in the cell cycle, a function that is attenuated upon treatment with RU486.
PGRB directly promotes cell cycle progression through activation of CCND1.
Upon acute treatment with RU486, Pgrcre/+mPgrBLsL/+ ovarian tumors exhibited decreased transcript levels of Ccnd1 (Fig. 7C), the critical cyclin necessary for entry into S phase of the cell cycle (28). To confirm this potential change in CCND1 protein expression, western blot analysis was performed on Pgrcre/+mPgrBLsL/+ ovarian tumors acutely and chronically treated with RU486 or placebo. Western blot results depicted slightly attenuated levels of CCND1 upon acute treatment with RU486 (Fig. 7D). However, chronic RU486 treatment resulted in a decrease of CCND1 protein levels compared to placebo (Fig. 7D). Furthermore, the PGRB ChIP-Seq analysis confirms the presence of a strong PGR binding event on the murine Ccnd1 locus (Fig. 7E). ChIP-qPCR at this region 226 bp upstream of the transcription start site confirmed efficient PGR binding (Fig. 7F). Additionally, Ingenuity Pathway Analysis of the tumor microarray revealed multiple downstream targets of CCND1 also exhibiting attenuation upon treatment with RU486 (Fig. 7G).
Of these target genes, FOXM1 and PLK1 are both critical proteins necessary for the initiation of mitosis or M phase (29, 30). Due to their strong role in mitotic entry, both are found increased in many cancers (31, 32). To identify the role of PGRB in the promotion of mitosis, RNA transcript levels of known mitotic-initiating proteins were evaluated. Acute RU486 treatment of Pgrcre/+mPgrBLsL/+ ovarian tumors results in the attenuation of multiple genes involved in M phase entry including Foxm1, Plk1, Cdc25c, Ccnb1, and Cdk1 (fig. S14A–E), providing further explanation for the decreased proliferation observed in these tumors. Additionally, PGR ChIP-Seq analysis confirmed PGR binding events at the loci of Foxm1, Plk1, Cdc25c, and Cdk1 (fig. S14F–I), which were confirmed by ChIP-qPCR analysis (fig. S14J–M). Therefore, PGRB strongly regulates CCND1 and proteins involved in the progression of mitosis, resulting in an increase of cell division.
Discussion
Through the utilization of mice expressing high levels of PGRB, we have provided evidence for the PGRB specific promotion of a cell cycle gene signature resulting in increased cellular proliferation and uncontrolled growth. The PGRB isoform binds directly to the Ccnd1 promoter and also promotes the AKT/MAPK1/ERK pathway, resulting in rapid transition states during M and G1 phases, causing persistent cell growth. This work describes a unique role for the PGR isoforms in the initiation and progression of ovarian neoplasia, with a molecular signature correlative to that of ovarian and endometrial cancer. Therefore, this article describes a robust, in vivo role for the PGRB isoform in the promotion of cellular proliferation in endocrine tissues and development of ovarian neoplasia.
Although ovarian PGR expression in wildtype mice is limited to granulosa cells of the pre-ovulatory follicle (33), we observed expression of the PGRB knock-in allele in corpora lutea, clearly observed in ovaries from Pgrcre/+RosamT/mg mice. Activated expression of PGRB by Cre recombinase in the follicle likely maintained expression in the corpora lutea post differentiation (34), as PGR is not normally expressed in the corpora lutea of the rodent (35, 36). The unexpected expression pattern of PGR in the ovary was likely a foreshadowing of future events, as mice developed abnormal cells at the pre-neoplastic stage that progressed to tumors at 28 weeks of age in the neoplastic stage. These abnormal growths were not only positive for PGR, but also exhibited high levels of the proliferative marker, Ki67, with a decreased amount of the apoptotic marker, CASP3. Therefore, appropriate expression levels of the PGRB isoform are important for maintenance of normal ovarian tissue.
The majority of ovarian cancers in humans are derived from the ovarian surface epithelium or from the oviduct (37), yet the tumors observed within the Pgrcre/+mPgrBLsL/+ mice appear to arise from granulosa cells that might have failed to undergo terminal differentiation during the process of luteinization. Granulosa cell tumors are known to be focally positive for PGR (38) and often arise from proliferating granulosa cells from pre-antral follicles before folliculogenesis (39) but may also result from genetic predisposition and aberrant growth factor and hormone levels (40). Tumors may also form in stem cell niches in transitional zones between the ovarian surface epithelium and oviduct, providing another theory for tumor origin (41). However, in regards to granulosa cell tumors, this ovarian neoplasia from overexpression of PGRB was identified to exhibit a marked decrease of granulosa cell markers. Additionally, the PGRB tumor transcriptome correlates strongly with human tumor transcriptomes with endometrial and ovarian epithelial origins. This indicates that independent of the cell of origin, the PGRB regulates similar pathways that promote tumor development.
The tumors identified in the Pgrcre/+mPgrBLsL/+ mice expressed high levels of AKT, ERK, and COX signaling. Accordingly, high AKT levels may be a result of impaired ARID1A levels, a member of the SWI/SNF family with a proposed role in protecting against progesterone resistance (42). Also, murine knockouts of AKT pathway inhibitors result in the formation of granulosa cell tumors (21). Thus, PGRB-driven upregulation of the AKT pathway in these mice may be an initial trigger to promote carcinogenesis in the ovarian tissue, suggesting the PGRB isoform is preferentially driving tumorigenesis. However, this model exhibits limitations as the PGRB isoform is expressed at abundantly and abnormally high levels. The high levels of PGRB can modulate the balance of progesterone and estrogen hormonal signaling in the mouse potentially resulting in deleterious outcomes. However, we did not observe abnormal changes in hormone levels or their cognate receptors in the Pgrcre/+mPgrBLsL/+ mice.
Although PGRA and PGRB protein were expressed at similar levels in the Pgrcre/+mPgrALsL/+ and Pgrcre/+mPgrBLsL/+ ovaries of 13 week old mice, the frequency of ovarian tumors was increased in the Pgrcre/+mPgrBLsL/+ mice compared to the Pgrcre/+mPgrALsL/+ mice. The PGR isoforms have consistently exhibited different functions within the endocrine organs (43). Notably, PGRB has often been associated with proliferation in the mammary gland while PGRA exhibits anti-proliferative and anti-inflammatory functions in the uterus. Furthermore, the PGR isoforms can function by “fast” extra-nuclear signaling and “slow” traditional nuclear signaling. PGRB functions by the “fast” method by binding to the c-src domain of EGFR to elicit activation of the downstream signaling pathway causing increased proliferation (44). PGR was also identified to independently promote the MAPK1/ERK pathway in human breast cancer cells also by an extra-nuclear mechanism (45), providing further evidence of PGRB as a driver of tumorigenesis by multiple signaling mechanisms. In addition, PGRB in breast cancer cells, preferentially controls the levels of VEGF, which can promote angiogenesis in tumor tissues (46). Indeed, PGRB has been shown to have a unique role in the promotion of cellular proliferation which is consistent with these studies (reviewed in (47)). Additionally, PGRB was shown to directly interact with CCND1 to transcriptionally activate pro-proliferative genes (48). In our study, we further indicated that pAKT and pERK were increased by PGRB but not PGRA in the tumor cells of ovaries, confirming the distinct tumorigenesis pathways. Based on the PGR ChIP-seq in the Pgrcre/+mPgrBLsL/+ ovarian tumor, we identified that PGR binding at several cell cycle genes such as Ccnd1 and Foxm1 may account for the pro-proliferative capability of PGRB. Due to the rare occurrence of Pgrcre/+mPgrALsL/+ ovarian tumors, we were unable to collect enough Pgrcre/+mPgrALsL/+ tumor tissues for PGR ChIP-seq analysis comparison. But it has been observed that PGRA and PGRB exhibit different transcription activities (49). Therefore, we speculate that the binding activities of PGRA and PGRB at Ccnd1 and Foxm1 may also be discrete. Thus, our data accurately reflect the published literature describing the importance of PGR isoform specific control of the transcriptional program and how PGRB exhibits a strong, multi-faceted role in potentiating tumorigenic profiles in endocrine organs.
Contrastingly, our data also contradict published data on human ovarian cancer which state that PGRB expression is positively correlated with improved prognosis and increased patient survival (50). This may be due to differences in the cell of origin of the tumors or the level of expression of PGRB. The limitation of this current model is that the transgene is expressed at a non-physiological level and may not be similar to that observed in human cancers. However, the value in this model is that it identifies PGR stimulated pathways that may enhance tumor progression in clinical cases. Thus, this study provides a new perspective on progesterone-driven proliferation in ovarian cancer.
Despite what is already known regarding the role of progesterone in proliferation, further speculation is warranted to understand how elevated PGR expression can drive ovarian tumorigenesis in this animal model. In rodents, the corpus luteum is maintained throughout the duration of pregnancy and produces high levels of progesterone hormone and a small amount of estrogen to preserve the pregnancy (51). The presence of this progesterone promotes its own production (36) and simultaneously inhibits cellular apoptosis within corpora lutea (52), making it a pro-survival factor. Indeed, progesterone in the corpora lutea was identified to dose-dependently prevent Fas cell surface death receptor (FAS)-mediated apoptosis in corpus luteum regression (53). Regression of corpora lutea occurs first by a decrease in active progesterone and then an activation of the FAS pathway, resulting in cellular apoptosis. Thus, active progesterone signaling is responsible for maintaining the life of the corpus luteum. In normal states, nuclear PGR is not expressed in normal corpora lutea, yet progesterone may be signaling by the membrane PGR family in rodents (54). However, in the Pgrcre/+mPgrBLsL/+ mice, with the addition of nuclear PGR in the corpora lutea, luteal regression may be delayed due to the progesterone-driven survival mechanism. Although virgin Pgrcre/+mPgrBLsL/+ mice only maintain corpora lutea for two days each estrous cycle (51), the presence of nuclear PGR and large amounts of progesterone ligand after 20 weeks of age may create the suitable environment for uncontrolled cellular growth in the ovarian stroma. This hypothesis also correlates with the observed decrease in the apoptotic marker, CASP3, and increased expression of proliferation markers in advanced stages in the ovary from Pgrcre/+mPgrBLsL/+ mice. Therefore, further work is required to investigate whether expression of nuclear PGR in the corpora lutea causes delayed luteal regression and maintained cellular growth.
The PGRB has previously exhibited a role for increased proliferation in the uterus (8) and in the mammary gland (7). The regulation of the S-phase entry cyclin, Ccnd1, by the PGR has been exhaustively investigated using in vitro immortalized breast cancer cells (55–59) and has been confirmed in murine mammary epithelial tissue (60). However, positive correlation between PGR and CCND1 expression patterns has been variable and sometimes contradictory in human breast carcinoma (61–63). Our data provide a clear role for efficient binding of PGRB on the murine Ccnd1 promoter region. Furthermore, treatment with RU486 results in decreased CCND1 protein expression over time, suggesting PGRB is prevented from promoting transcription of the Ccnd1 locus. Therefore, PGRB directly regulates the progression of the cell cycle through transcriptional activation of Ccnd1.
Additionally, CCND1 downstream targets, Plk1 and Foxm1, also exhibited attenuation upon acute treatment with RU486. Active PLK1 plays an integral role in cell division through preparing the cell for mitosis by phosphorylating CDC25C, which subsequently activates the CDK1-CCNB1 complex (30, 64, 65). PLK1 is also indispensable for spindle assembly chromosome separation, progression of anaphase, and cellular cytokinesis. Previous data have described an additional role for FOXM1 in the activation of PLK1 for mitotic entry, through the identification of forkhead binding sites on the PLK1 promoter (66). Indeed, it was concluded that FOXM1 not only regulates PLK1, but both are involved in a positive feedback loop to promote mitosis (29). This work provided further detailed analysis of PGR binding directly at the loci of mitosis-promoting genes: Foxm1, Plk1, Cdc25c, and Cdk1. Since PLK1 and FOXM1 are necessary for cell cycle progression (29), they have consistently been identified to be expressed in a variety of cancers (31, 32). PLK1 alone is found increased in human ovarian cancer (67, 68), endometrial carcinoma (69), ectopic endometriosis (70), and breast cancer (71), often correlating with increased proliferation and severity. Further work is required to understand the function of PGRB-driven epithelial proliferation within the uterus and whether PLK1 mediates this unique function of PGRB in the normal reproductive tract. Therefore, the regulation of mitosis by the PGRB isoform provides an interesting mechanism to explain the growth of ovarian neoplasia and additional non-invasive, PGR-positive, solid tumors arising in endocrine organs.
Within this study, we have generated a unique PGRB expressing mouse model exhibiting the development of ovarian neoplasms at 23 weeks of age. In these mice, PGRB promoted cellular proliferation through the control of many cell cycle regulatory genes in the ovarian environment. Specifically, S phase initiator, CCND1, and critical regulators of the G2/M transition, FOXM1, PLK1, CDC25C, CCNB1, and CDK1, were all evidenced to be strongly induced by PGRB expression (model depicted in Fig. 8). Additionally, these progesterone-driven ovarian growths exhibited a strong correlative gene expression signature with ovarian and endometrial cancer driven by aberrant AKT/MAPK1/ERK signaling. AKT signaling is a potent promoter of S-phase entry and has the potential to be induced by a non-canonical method of PGR signaling (72) (Fig. 8). In conclusion, these data describe a novel mechanism for the direct regulation of cellular proliferation by PGRB, providing valuable insight into the uncontrolled growth of PGRB-positive neoplasia occurring in women today.
Figure 8:
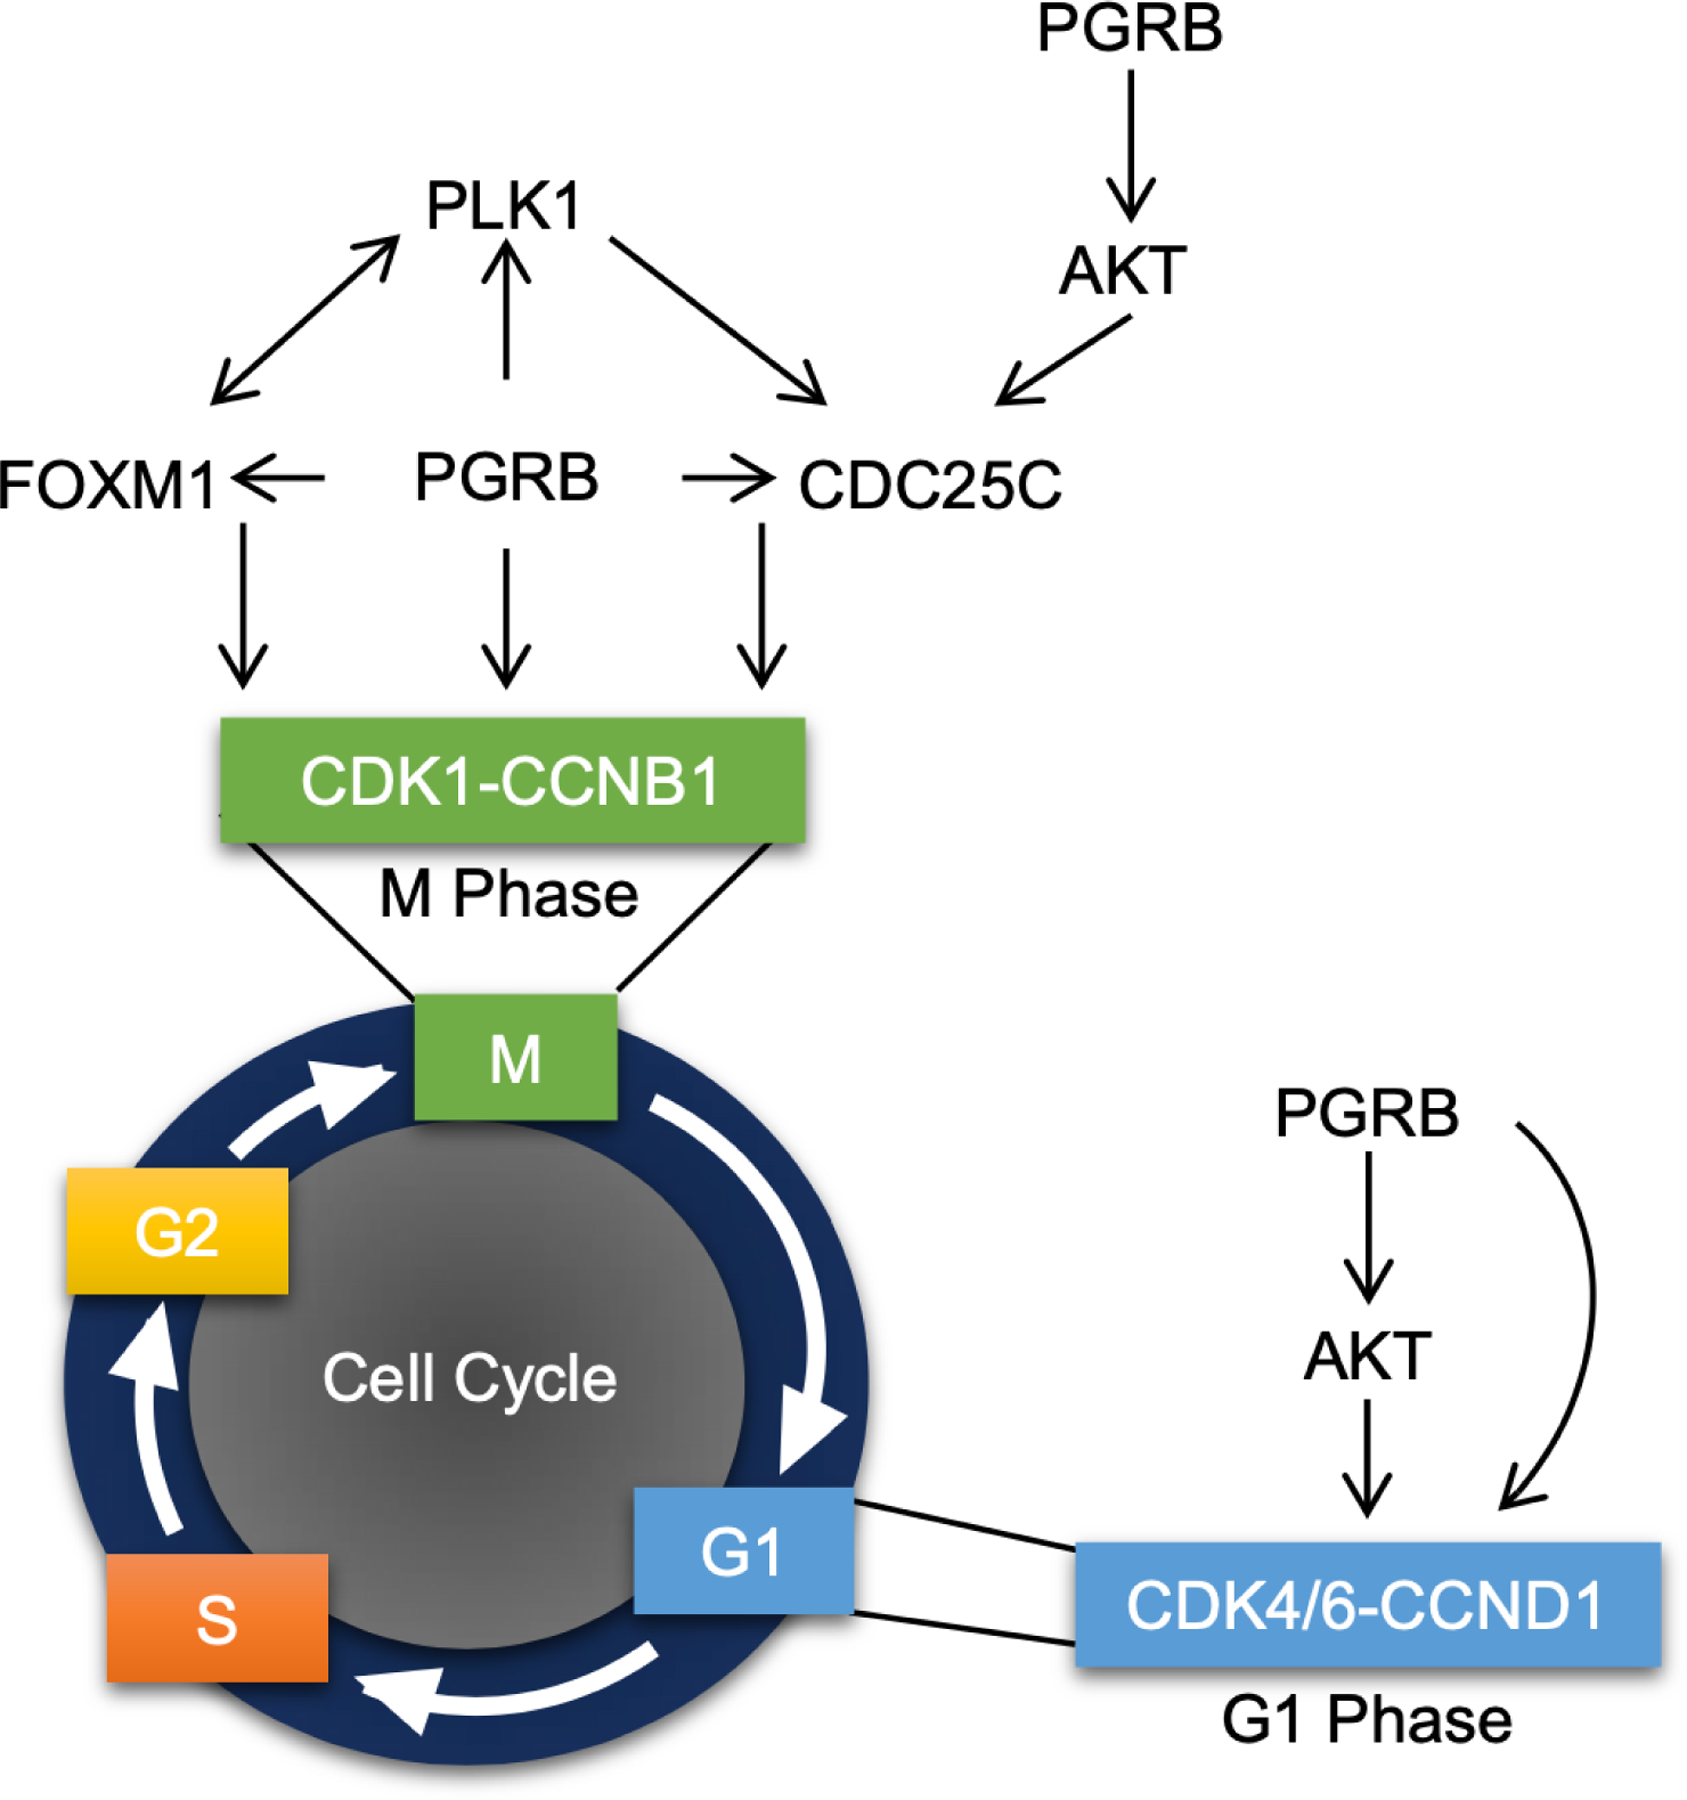
PGRB promotes growth through regulation of the cell cycle pathway. Graphical model portraying the role of PGRB in the initiation of M and G1 phases via regulation of multiple genes responsible for mitotic entry.
Materials and Methods
Generation of the PGRB Overexpression Mouse Model
Mice were cared for according to protocol within the Institution of Animal Care and Use Committee (IACUC) at Baylor College of Medicine and the Animal Care and Use Committee at the National Institute of Environmental Health Sciences. Mice exhibiting the conditional overexpression allele for murine PGRB were described previously (mPgrBLsL/+) (13) and crossed with Pgrcre/+ mice to generate Pgrcre/+mPgrBLsL/+ mice. Pgrcre/+mPgrALsL/+ mice were utilized and described previously (12). All experimental mice were performed on female mice, as pregnancy only occurs in females.
Ovarian Tissue Collection
Pgrcre/+ and Pgrcre/+mPgrBLsL/+ mice at 13, 23, 28, and 33 weeks of age and Pgrcre/+mPgrALsL/+ mice at 33 weeks of age were euthanized at diestrous stage. The estrus stage was determined by vaginal cytology (73). Ovarian tissue was either frozen and utilized for RNA isolation or fixed in 4% PFA at 4°C overnight and stored in 70% ethanol at 4°C for subsequent tissue processing.
Assessment of Ovulation
For the Pgrcre/+mPgrBLsL/+ mice, 8–12 week old females were naturally mated and fertilized embryos with polar bodies were flushed from oviducts and counted with blinding towards the treatment groups on Day 1.5 of pregnancy. For the Pgrcre/+mPgrALsL/+ mice, 6 week old females were super-ovulated and mated and fertilized embryos were flushed from oviducts and counted using previous blinded measures described previously.
Identifying Cre Recombinase Expression Using the RosamT/mG Model
RosamT/mG mice (Jackson Laboratory) were crossed with Pgrcre/+ mice to generate Pgrcre/+RosamT/mG mice. Female Pgrcre/+RosamT/mG mice were euthanized during diestrus, as established by vaginal cytology. The ovaries were embedded in the optimal cutting temperature (O.C.T.) compound (Tissue-Tek, VWR 102094-104) and immediately frozen on dry ice. Frozen sections (10µm) were sectioned using the cryostat (Leica), then incubated at 65°C for 10 minutes. The endogenous Tdtomato and GFP fluorescence were visualized by Epifluorescence microscopy (Zeiss).
Ultrasound Imaging and Tumor Volume
Ultrasound was performed using the VisualSonics 2100 System at the Mouse Phenotyping Core located at Baylor College of Medicine to identify the presence of abnormal masses within the reproductive tract. For each mass, images were processed according to VisualSonics software instructions to determine tumor volumes. Tumor volume was calculated through serial contouring of the tumor cross sections according to the VisualSonics 2100 3D tumor imaging software. The volumes were measured in an unbiased manner with blinding of the administered treatment.
RU486 Inhibition of Tumor Growth
After identification of tumor presence using ultrasound imaging, mice exhibiting a tumor with at least a 50mm3 tumor volume were administered a chronic release pellet of RU486 (30mg/pellet, 60-day release) or placebo pellet from Innovative Research of America by subcutaneous placement at the nape. The mice were imaged weekly for 9 weeks by ultrasound 3D video imaging to track the tumor size. ImageJ was used to assess area, cell signal, and integrative density measurements for the middle region of each tumor at the final week of treatment (measurement analysis on ImageJ 1.49 software, U.S. National Institute of Health). Mice were sacrificed 8 weeks after pellet surgery or until the tumor size reached 10% of the mouse body weight. Fold tumor volume change for vehicle and RU486 treated tumors was calculated as the average fold change (log10(tumor volume) normalized to one) for each treatment.
Histology and Immunohistochemistry
Tissues were fixed in 4% PFA and embedded in paraffin wax. Embedded tissues were sectioned at 5µm and incubated for 20 minutes at 60°C. After 10 minutes of cooling, the slides were dewaxed in xylenes and a decreasing gradient of pure ethanol. For hematoxylin and eosin (H&E) staining, tissues were adequately stained with H&E and were then dehydrated before coverslips were applied. Ovarian histopathology of H&E stained sections was evaluated by two board-certified veterinary pathologists.
For immunohistochemistry, antigen retrieval was performed according to manufacturer’s instructions (Vector Labs Antigen Unmasking Solution H-3300). Endogenous peroxide was blocked using 3% hydrogen peroxide diluted in methanol. The tissue was blocked before application of primary antibody overnight (PGR: Dako A0098 (1:400), Myc-tag: Cell Signal 71D10 (1:150), BrdU: BD Pharmingen Cat# 551321 (1:50), AKT: Cell Signal 4691 (1:400), pAKT: Cell Signal 4060 (1:100), Ki67: Abcam ab15580 (1:1000), cleaved CASP3: Cell Signal 9661 (1:400), CCND1: NeoMarkers RB-9041-P0 (1:400), mTORC1 Cell Signaling 2983 (1:100), pmTORC1 Cell Signaling 2971 (1:100), ERK Cell Signaling 9102 (1:250), pERK Cell Signaling 4370 (1:400)). Secondary antibody was diluted in 1% BSA at a concentration of 1:200. The ABC reagent was applied to tissues according to manufacturer’s instructions (Vector Labs ABC PK-6100). Signal was developed using Vector Labs DAB Immpact staining according to manufacturer’s instructions (Vector Labs SK-4105). Tissue was counterstained with hematoxylin and dehydrated before applying coverslips. All immunostaining was performed in an unbiased manner with the treatments and genotypes blinded during experimentation.
TUNEL Staining
Tissues were fixed in 4% PFA and embedded in paraffin wax. Embedded tissues were sectioned at 5µm and incubated for 20 mins at 60°C. After 10 minutes of cooling, the slides were dewaxed in xylenes and a decreasing gradient of pure ethanol. Tissues were incubated at 37°C for 1 hour with a 20mg/mL proteinase K solution diluted in 10mM Tris/HCl pH 7.4–8. Tissues were washed in PBS and labeled using the Roche In Situ Cell Death TMR Red kit (Roche Diagnostics) according to manufacturer’s instructions with the incorporation of arbitrary samples names to limit bias. Slides were cover-slipped with Vectashield+DAPI (Vector Labs) and sealed with clear nail polish.
BrdU and TUNEL Quantification
BrdU labeling reagent was i.p. injected two hours before euthanasia (GE Healthcare). Regions of the 40x (BrdU) and 20x (TUNEL) images were marked and quantified for total cells and total positive DAB stained cells (BrdU) or total positive rhodamine red puncta (TUNEL). Percent positive cells were quantified for each sample and averages were quantified to represent the mean percent positive cells for BrdU nuclei or TUNEL positive puncta. Quantifications were measured from blinded samples to prevent bias towards specific treatment groups.
Western blots
Isolated protein was applied to a Bis-Tris NuPAGE 4%−12% gel (Novex by Life Technologies) for protein separation. Protein was wet transferred to a polyvinylidene difluoride membrane and blocked in 5% blotting grade nonfat milk diluted in phosphate-buffered saline (PBS) with 0.1% Tween for at least one hour. Membranes were incubated with primary antibody (PGR Santa Cruz H-190 (1:400), ACTIN Santa Cruz I-19 (1:10,000), myc-tag Origene TA100010 (1:1000), CCND1 Thermo Fisher RB-9041-P0 (1:200), mTORC1 Cell Signaling 2983 (1:1000), pmTORC1 Cell Signaling 2971 (1:1000), COX1 Cayman Chemical 160110 (1:200), COX2 Cell Signaling 12282 (1:1000), ERK Cell Signaling 9102 (1:1000), pERK Cell Signaling 4370 (1:1000)) overnight. Membranes were washed and incubated with secondary antibody (anti-rabbit peroxidase (1:4000), anti-mouse peroxidase (1:5000), and anti-goat peroxidase (1:4000) according to primary antibody requirements) in 5% milk diluted in PBS with Tween. The Amersham ECL Western blotting system was utilized to develop peroxidase labeled protein according to manufacturer’s instructions (GE Healthcare).
RNA Isolation
Frozen tissue was homogenized in TRIzol reagent (Thermo Fisher). RNA was isolated using chloroform and precipitated using isopropanol with resuspension in water. For RNA prepared for microarray, TRIzol reagent was utilized followed by the aqueous phase isolation using 1-Bromo-3-chloropropane and a second aqueous phase isolation using chloroform. The aqueous layer was then mixed with 100% ethanol and applied to the column from the Qiagen RNEasy RNA mini prep kit. The column was washed, and RNA was isolated using manufacturer’s instructions (Qiagen).
Reverse Transcriptase PCR and Quantitative Real Time PCR
RNA was reverse transcribed into cDNA using M-MLV reverse transcriptase (Thermo Fisher) according to manufacturer’s instructions. Quantitative real time PCR was performed using Taqman Master Mix (Life Technologies) or SYBR Green Master Mix (Roche Diagnostics). Taqman primers and probes were acquired from Life Technologies and SYBR primers were designed based on Primer Bank predictions using Sigma-Aldrich synthesized oligonucleotides (table S5). Delta Ct values were calculated using 18S control amplification to acquire relative mRNA levels per sample.
RNA Microarray
RNA quality was assessed using the Agilent 2100 Bioanalyzer (Agilent Technologies). Microarrays were performed by the Genomic and RNA Profiling Core at Baylor College of Medicine and the Epigenomic Core Laboratory at the National Institute of Environmental Health Sciences. For microarrays, sample libraries were amplified and labeled, and individual cDNA samples were hybridized to either the Agilent G3 Mouse GE 8×60k array or the Affymetrix GeneChip Mouse Genome 430 2.0 array according to manufacturer’s instructions (Agilent, Affymetrix). Array data was analyzed using Bioconductor for quantile normalization. Significantly changed genes were identified using a p-value ≤ 0.05 with a variable fold change region, identified specifically in each figure legend. All raw microarray data are available on NCBI-GEO database with accession number GSE137433.
T Score Analysis
The differentially expressed genes in 33 week old Pgrcre/+mPgrBLsL/+ mouse ovarian tumor tissue was stratified into induced or suppressed lists. Pgrcre/+mPgrBLsL/+ mouse ovarian tumor gene lists were compared using a T score metric to known published datasets of: mouse granulosa ovarian tumor with Smad1/5 knockout and Smad8 heterozygous allele (GSE8156) (20), mouse granulosa tumor with Foxo1/3/Pten knockout (GSE67662) (21), mouse ovarian endometrioid adenocarcinoma with Pten/Apc knockout (GSE5987) (22), human ovarian Sertoli-Leydig cell tumor (GSE71160) (23), human granulosa tumor (E-MTAB-483) (24), human ovarian clear cell, serous, mucinous tumor (GSE6008) (26), and human endometrial cancer (GSE17025) (25). The T score is a gene signature score calculated for each published dataset by performing a comparison against gene expression levels from increased and decreased Pgrcre/+mPgrBLsL/+ mouse ovarian tumor genes using a two-sided t-statistic test. A positive T score reflects a positive correlation between the Pgrcre/+mPgrBLsL/+ mouse ovarian tumor dataset and the published dataset. Negative T scores represent a negative correlation.
Chromatin Immunoprecipitation and Sequencing
Tissue was flash frozen and sent to Active Motif for Factor Path chromatin immunoprecipitation and sequencing analysis. Tissue was fixed, then sheared into small fragments before immunoprecipitation with the Active Motif PGR antibody. Bound DNA was isolated to generate a purified and amplified library of PGR bound sequence regions and sequenced using the Illumina sequencing platform. PGR bound intervals were identified using MACS analysis and mapped to genes by the Active Motif Company. The Active Motif Company also performed validation of the PGR binding events using ChIP-qPCR through measurement of the amount of binding events per cell compared to binding events occurring in an untranslated region. ChIP-Seq data is available on the NCBI-GEO database with accession number GSE137433.
Data Analysis
Pathway analysis performed on microarray data was analyzed using Ingenuity Pathway Analysis software and the public Database for Annotation, Visualization, and Integrated Discovery (DAVID) with default settings applied. ChIP-Seq data quality, binding enrichment, and motif analysis was assessed using the Cistrome Analysis Pipeline software (http://cistrome.org/ap/). GraphPad Prism software was utilized to perform one-way ANOVA, multiple comparison test, and Student’s t-Test analyses for qRT-PCR, TUNEL quantification, and BrdU quantification data. Hormone response elements were identified using HOMER de novo motif analysis (http://homer.salk.edu/homer/). Hierarchal clustering heatmaps were generated using Partek Genomics Suite 6.6 software. NextBio (Illumina) analysis was performed on significantly changed genes using a p-value ≤ 0.05 and an absolute fold change of >1.3 before comparison to other published studies. For Gene Set Enrichment Analysis (GSEA) at the Broad Institute MSigDB, all genes were ranked based on fold changes and analyses were performed against C6 (oncogenic signatures). Top significantly enriched gene sets were selected on the basis of false discovery rate (FDR) q-value < 0.05.
Statistical Analysis
The normality of the data was tested by Kolmogorov–Smirnov test. The frequency of ovarian tumor was analyzed by Fisher’s exact test. The number of ovulated oocytes, the serum levels of estradiol, messenger RNA expression levels, the fold changes in tumor development after RU486 or vehicle treatment, and the percentage of cells with TUNEL or BrdU positive staining were examined by Student’s t-test. The H-score of immunohistochemistry staining, the normalized signal intensity of western blots, the serum levels of progesterone, LH and FSH, and the T score of the 33-week-old Pgrcre/+mPgrBLsL/+ ovarian tumor microarray comparison with other datasets were analyzed by One-Way ANOVA with post-hoc Tukey’s test. p<0.05 is defined as significant.
Supplementary Material
Data File S1.1 Total List of Differentially Expressed Genes in Pre-Neoplastic Tissue
Data File S1.2 Total List of Differentially Expressed Genes in Neoplastic Tissue (23 weeks)
Data File S1.3 Total List of Differentially Expressed Genes in Neoplastic Tissue (33 weeks)
Data File S1.4 Total List of Differentially Expressed Genes after 24 hour RU486 Treatment
Fig. S1. Levels of the conditional overexpression allele for mPgrB in uterine and ovarian tissue.
Fig. S2. PGR transgene levels are comparable in both Pgrcre/+mPgrALsL/+ and Pgrcre/+mPgrBLsL/+ mice at 13 weeks of age.
Fig. S3. PGR positive ovarian neoplasia from Pgrcre/+mPgrBLsL/+ mice consume the entire ovarian bursa and exhibit robust StAR expression levels.
Fig. S4. Lineage tracing using the Pgrcre/+RosamT/mG model demonstrates localized Cre recombination to the corpus luteum at 8 weeks of age.
Fig. S5. PGRA or PGRB expression does not impair ovarian function.
Fig. S6. Increased ovarian PGR expression does not impair endogenous hormone levels
Fig. S7. Phosphorylated mTORC1 protein levels are slightly reduced in neoplasia of the Pgrcre/+mPgrBLsL/+ ovary.
Fig. S8. pAKT and pERK expression in the Pgrcre/+mPgrALsL/+ ovaries were comparable to the corpus luteum of Pgrcre+mPgrBLsL/+ ovary, but much lower than the tumor tissues of Pgrcre/+mPgrBLsL/+ ovary at 23 weeks neoplastic.
Fig. S9. pAKT and pERK were not activated in the Pgrcre/+mPgrALsL/+ ovaries with neoplasia.
Fig. S10. Message levels of estrogen and progesterone receptors and granulosa cell markers decrease in advanced PGR-driven neoplasia.
Fig. S11. Pgrcre/+mPgrBLsL/+ tumors exhibit decreased density and size after acute RU486 treatment.
Fig. S12. Chronic RU486 treatment suppresses pAKT and pERK levels in the Pgrcre/+mPgrBLsL/+ ovarian tumor tissue.
Fig. S13. PGR ChIP-seq is enriched at promoter regions and binds to hormone receptor binding sequences.
Fig. S14. PGRB promotes the cell cycle through direct regulation of genes necessary for the G2/M transition.
Table S1. Bilateral and unilateral tumors occur in Pgrcre/+mPgrBLsL/+ mice.
Table S2. Canonical pathways are altered in 23-week-old neoplastic Pgrcre/+mPgrBLsL/+ mouse ovaries.
Table S3. PGR causes many changes in multiple canonical pathways involved in cell proliferation and cancer.
Table S4. PGR transcriptionally controls multiple canonical pathways involved in cell proliferation and cancer.
Table S5. Complete list of SYBR primer sequences and Applied Biosystems Taqman probe catalog numbers.
Acknowledgements:
The authors thank Sungnam Cho, Jie Yang, Yiqun Zhang, Elise Mangin, Arturo Garza, and Janet DeMayo at Baylor College of Medicine for technical assistance. This work was impossible without the support of the Core resources at the NIEHS and Baylor College of Medicine. These include the Integrative Bioinformatic Support Group, Knockout Mouse Core, Comparative Medicine Branch Epigenomic and DNA Sequencing Core, Molecular Genomic Core, Clinical Pathology Group, and the Pathology Support Group. Also the Embryonic Stem Cell Core, the Genetically Engineered Mouse Core, Mouse Phenotyping Core, and the Genomic and RNA Profiling Core at Baylor College of Medicine.
Funding:
This work was supported by NIH Grants: Z1AES103311-01, R01HD042311, CA125123 (to CJC), 5U54HD007495 (to FJD) and R01HD042311 (to JPL) and NURSA grant: U19DK62434 (to FJD) and CIHR grant 125936 (to BDM).
Footnotes
Competing Interests: The authors declare that they have no competing interests.
Data and Materials Availability: All raw microarray and ChIP-Seq data are available on the NCBI-GEO database with accession number GSE137433. Mouse lines are available with a material transfer agreement submission to Baylor College of Medicine, Houston, TX, USA.
References and Notes:
- 1.Wang H, Dey SK, Roadmap to embryo implantation: clues from mouse models. Nat Rev Genet 7, 185–199 (2006). [DOI] [PubMed] [Google Scholar]
- 2.Diep CH, Daniel AR, Mauro LJ, Knutson TP, Lange CA, Progesterone action in breast, uterine, and ovarian cancers. J Mol Endocrinol 54, R31–53 (2015). [DOI] [PMC free article] [PubMed] [Google Scholar]
- 3.Howlader NNA, Krapcho, Miller D, Bishop K, Altekruse SF, Kosary CL, Yu M, Ruhl J, Tatalovich Z, Mariotto A, Lewis DR, Chen HS, Feuer EJ, Cronin KA(eds). (National Cancer Institute Bethesda, MD, http://seer.cancer.gov/csr/1975_2013/, 2013), vol. based on November 2015 SEER data submission. [Google Scholar]
- 4.Robker RL et al. , Progesterone-regulated genes in the ovulation process: ADAMTS-1 and cathepsin L proteases. Proc Natl Acad Sci U S A 97, 4689–4694 (2000). [DOI] [PMC free article] [PubMed] [Google Scholar]
- 5.Conneely OM, Kettelberger DM, Tsai MJ, Schrader WT, O’Malley BW, The chicken progesterone receptor A and B isoforms are products of an alternate translation initiation event. J Biol Chem 264, 14062–14064 (1989). [PubMed] [Google Scholar]
- 6.Kastner P et al. , Two distinct estrogen-regulated promoters generate transcripts encoding the two functionally different human progesterone receptor forms A and B. EMBO J 9, 1603–1614 (1990). [DOI] [PMC free article] [PubMed] [Google Scholar]
- 7.Mulac-Jericevic B, Lydon JP, DeMayo FJ, Conneely OM, Defective mammary gland morphogenesis in mice lacking the progesterone receptor B isoform. Proc Natl Acad Sci U S A 100, 9744–9749 (2003). [DOI] [PMC free article] [PubMed] [Google Scholar]
- 8.Mulac-Jericevic B, Mullinax RA, DeMayo FJ, Lydon JP, Conneely OM, Subgroup of reproductive functions of progesterone mediated by progesterone receptor-B isoform. Science 289, 1751–1754 (2000). [DOI] [PubMed] [Google Scholar]
- 9.Lange CA, Richer JK, Horwitz KB, Hypothesis: Progesterone primes breast cancer cells for cross-talk with proliferative or antiproliferative signals. Mol Endocrinol 13, 829–836 (1999). [DOI] [PubMed] [Google Scholar]
- 10.Graham JD, Clarke CL, Physiological action of progesterone in target tissues. Endocr Rev 18, 502–519 (1997). [DOI] [PubMed] [Google Scholar]
- 11.Arnett-Mansfield RL et al. , Relative expression of progesterone receptors A and B in endometrioid cancers of the endometrium. Cancer Res 61, 4576–4582 (2001). [PubMed] [Google Scholar]
- 12.Wetendorf M et al. , Decreased epithelial progesterone receptor A at the window of receptivity is required for preparation of the endometrium for embryo attachment. Biol Reprod 96, 313–326 (2017). [DOI] [PMC free article] [PubMed] [Google Scholar]
- 13.Hai L et al. , A mouse model engineered to conditionally express the progesterone receptor-B isoform. Genesis 56, e23223 (2018). [DOI] [PMC free article] [PubMed] [Google Scholar]
- 14.Soyal SM et al. , Cre-mediated recombination in cell lineages that express the progesterone receptor. Genesis 41, 58–66 (2005). [DOI] [PubMed] [Google Scholar]
- 15.Daikoku T et al. , Cyclooxygenase-1 is overexpressed in multiple genetically engineered mouse models of epithelial ovarian cancer. Cancer Res 66, 2527–2531 (2006). [DOI] [PubMed] [Google Scholar]
- 16.Gupta RA et al. , Cyclooxygenase-1 is overexpressed and promotes angiogenic growth factor production in ovarian cancer. Cancer Res 63, 906–911 (2003). [PubMed] [Google Scholar]
- 17.Zhang X et al. , Cyclooxygenase 2 promotes proliferation and invasion in ovarian cancer cells via the PGE2/NF-kappaB pathway. Cell Transplant, 963689719890597 (2019). [DOI] [PMC free article] [PubMed] [Google Scholar]
- 18.Muzumdar MD, Tasic B, Miyamichi K, Li L, Luo L, A global double-fluorescent Cre reporter mouse. Genesis 45, 593–605 (2007). [DOI] [PubMed] [Google Scholar]
- 19.Martini M, De Santis MC, Braccini L, Gulluni F, Hirsch E, PI3K/AKT signaling pathway and cancer: an updated review. Ann Med 46, 372–383 (2014). [DOI] [PubMed] [Google Scholar]
- 20.Pangas SA et al. , Conditional deletion of Smad1 and Smad5 in somatic cells of male and female gonads leads to metastatic tumor development in mice. Mol Cell Biol 28, 248–257 (2008). [DOI] [PMC free article] [PubMed] [Google Scholar]
- 21.Liu Z et al. , FOXO1/3 and PTEN Depletion in Granulosa Cells Promotes Ovarian Granulosa Cell Tumor Development. Mol Endocrinol 29, 1006–1024 (2015). [DOI] [PMC free article] [PubMed] [Google Scholar]
- 22.Wu R et al. , Mouse model of human ovarian endometrioid adenocarcinoma based on somatic defects in the Wnt/beta-catenin and PI3K/Pten signaling pathways. Cancer Cell 11, 321–333 (2007). [DOI] [PubMed] [Google Scholar]
- 23.Wang Y et al. , The oncogenic roles of DICER1 RNase IIIb domain mutations in ovarian Sertoli-Leydig cell tumors. Neoplasia 17, 650–660 (2015). [DOI] [PMC free article] [PubMed] [Google Scholar]
- 24.Benayoun BA et al. , Adult ovarian granulosa cell tumor transcriptomics: prevalence of FOXL2 target genes misregulation gives insights into the pathogenic mechanism of the p.Cys134Trp somatic mutation. Oncogene 32, 2739–2746 (2013). [DOI] [PubMed] [Google Scholar]
- 25.Day RS et al. , Identifier mapping performance for integrating transcriptomics and proteomics experimental results. Bmc Bioinformatics 12, (2011). [DOI] [PMC free article] [PubMed] [Google Scholar]
- 26.Hendrix ND et al. , Fibroblast growth factor 9 has oncogenic activity and is a downstream target of Wnt signaling in ovarian endometrioid adenocarcinomas. Cancer Res 66, 1354–1362 (2006). [DOI] [PubMed] [Google Scholar]
- 27.Chan KKL et al. , Differential expression of estrogen receptor subtypes and variants in ovarian cancer: effects on cell invasion, proliferation and prognosis. Bmc Cancer 17, (2017). [DOI] [PMC free article] [PubMed] [Google Scholar]
- 28.Santo L, Siu KT, Raje N, Targeting Cyclin-Dependent Kinases and Cell Cycle Progression in Human Cancers. Semin Oncol 42, 788–800 (2015). [DOI] [PubMed] [Google Scholar]
- 29.Fu Z et al. , Plk1-dependent phosphorylation of FoxM1 regulates a transcriptional programme required for mitotic progression. Nat Cell Biol 10, 1076–1082 (2008). [DOI] [PMC free article] [PubMed] [Google Scholar]
- 30.Barr FA, Sillje HH, Nigg EA, Polo-like kinases and the orchestration of cell division. Nat Rev Mol Cell Biol 5, 429–440 (2004). [DOI] [PubMed] [Google Scholar]
- 31.Laoukili J, Stahl M, Medema RH, FoxM1: at the crossroads of ageing and cancer. Biochim Biophys Acta 1775, 92–102 (2007). [DOI] [PubMed] [Google Scholar]
- 32.Weng Ng WT, Shin JS, Roberts TL, Wang B, Lee CS, Molecular interactions of polo-like kinase 1 in human cancers. J Clin Pathol, (2016). [DOI] [PubMed] [Google Scholar]
- 33.Ismail PM, Li J, DeMayo FJ, O’Malley BW, Lydon JP, A novel LacZ reporter mouse reveals complex regulation of the progesterone receptor promoter during mammary gland development. Mol Endocrinol 16, 2475–2489 (2002). [DOI] [PubMed] [Google Scholar]
- 34.Stocco C, Telleria C, Gibori G, The molecular control of corpus luteum formation, function, and regression. Endocr Rev 28, 117–149 (2007). [DOI] [PubMed] [Google Scholar]
- 35.Park-Sarge OK, Parmer TG, Gu Y, Gibori G, Does the rat corpus luteum express the progesterone receptor gene? Endocrinology 136, 1537–1543 (1995). [DOI] [PubMed] [Google Scholar]
- 36.Telleria CM, Stocco CO, Stati AO, Deis RP, Progesterone receptor is not required for progesterone action in the rat corpus luteum of pregnancy. Steroids 64, 760–766 (1999). [DOI] [PubMed] [Google Scholar]
- 37.Auersperg N, The origin of ovarian carcinomas: a unifying hypothesis. Int J Gynecol Pathol 30, 12–21 (2011). [DOI] [PubMed] [Google Scholar]
- 38.Farinola MA et al. , Estrogen receptor alpha and progesterone receptor expression in ovarian adult granulosa cell tumors and Sertoli-Leydig cell tumors. Int J Gynecol Pathol 26, 375–382 (2007). [DOI] [PubMed] [Google Scholar]
- 39.Kim SY et al. , Constitutive Activation of PI3K in Oocyte Induces Ovarian Granulosa Cell Tumors. Cancer Res 76, 3851–3861 (2016). [DOI] [PMC free article] [PubMed] [Google Scholar]
- 40.Owens GE, Keri RA, Nilson JH, Ovulatory surges of human CG prevent hormone-induced granulosa cell tumor formation leading to the identification of tumor-associated changes in the transcriptome. Mol Endocrinol 16, 1230–1242 (2002). [DOI] [PubMed] [Google Scholar]
- 41.Flesken-Nikitin A et al. , Ovarian surface epithelium at the junction area contains a cancer-prone stem cell niche. Nature 495, 241–245 (2013). [DOI] [PMC free article] [PubMed] [Google Scholar]
- 42.Wang H et al. , CRISPR/Cas9-mediated gene knockout of ARID1A promotes primary progesterone resistance by downregulating progesterone receptor B in endometrial cancer cells. Oncol Res, (2019). [DOI] [PMC free article] [PubMed] [Google Scholar]
- 43.Wetendorf M, DeMayo FJ, Progesterone receptor signaling in the initiation of pregnancy and preservation of a healthy uterus. Int J Dev Biol 58, 95–106 (2014). [DOI] [PMC free article] [PubMed] [Google Scholar]
- 44.Boonyaratanakornkit V et al. , Progesterone receptor contains a proline-rich motif that directly interacts with SH3 domains and activates c-Src family tyrosine kinases. Molecular cell 8, 269–280 (2001). [DOI] [PubMed] [Google Scholar]
- 45.Faivre EJ, Lange CA, Progesterone receptors upregulate Wnt-1 to induce epidermal growth factor receptor transactivation and c-Src-dependent sustained activation of Erk1/2 mitogen-activated protein kinase in breast cancer cells. Mol Cell Biol 27, 466–480 (2007). [DOI] [PMC free article] [PubMed] [Google Scholar]
- 46.Wu J, Richer J, Horwitz KB, Hyder SM, Progestin-dependent induction of vascular endothelial growth factor in human breast cancer cells: preferential regulation by progesterone receptor B. Cancer Res 64, 2238–2244 (2004). [DOI] [PubMed] [Google Scholar]
- 47.Grimm SL, Hartig SM, Edwards DP, Progesterone Receptor Signaling Mechanisms. J Mol Biol 428, 3831–3849 (2016). [DOI] [PubMed] [Google Scholar]
- 48.Dressing GE et al. , Progesterone receptor-cyclin D1 complexes induce cell cycle-dependent transcriptional programs in breast cancer cells. Mol Endocrinol 28, 442–457 (2014). [DOI] [PMC free article] [PubMed] [Google Scholar]
- 49.Mcdonnell DP, Unraveling the Human Progesterone-Receptor Signal-Transduction Pathway - Insights into Antiprogestin Action. Trends Endocrin Met 6, 133–138 (1995). [DOI] [PubMed] [Google Scholar]
- 50.Lenhard M et al. , Steroid hormone receptor expression in ovarian cancer: progesterone receptor B as prognostic marker for patient survival. BMC Cancer 12, 553 (2012). [DOI] [PMC free article] [PubMed] [Google Scholar]
- 51.Bachelot A, Binart N, Corpus luteum development: lessons from genetic models in mice. Curr Top Dev Biol 68, 49–84 (2005). [DOI] [PubMed] [Google Scholar]
- 52.Goyeneche AA, Deis RP, Gibori G, Telleria CM, Progesterone promotes survival of the rat corpus luteum in the absence of cognate receptors. Biol Reprod 68, 151–158 (2003). [DOI] [PubMed] [Google Scholar]
- 53.Kuranaga E et al. , Progesterone is a cell death suppressor that downregulates Fas expression in rat corpus luteum. FEBS Lett 466, 279–282 (2000). [DOI] [PubMed] [Google Scholar]
- 54.Cai Z, Stocco C, Expression and regulation of progestin membrane receptors in the rat corpus luteum. Endocrinology 146, 5522–5532 (2005). [DOI] [PubMed] [Google Scholar]
- 55.Wargon V et al. , Progestin and antiprogestin responsiveness in breast cancer is driven by the PRA/PRB ratio via AIB1 or SMRT recruitment to the CCND1 and MYC promoters. Int J Cancer 136, 2680–2692 (2015). [DOI] [PMC free article] [PubMed] [Google Scholar]
- 56.Quiles I et al. , Mutational analysis of progesterone receptor functional domains in stable cell lines delineates sets of genes regulated by different mechanisms. Mol Endocrinol 23, 809–826 (2009). [DOI] [PMC free article] [PubMed] [Google Scholar]
- 57.Diaz Flaque MC et al. , Progesterone receptor assembly of a transcriptional complex along with activator protein 1, signal transducer and activator of transcription 3 and ErbB-2 governs breast cancer growth and predicts response to endocrine therapy. Breast Cancer Res 15, R118 (2013). [DOI] [PMC free article] [PubMed] [Google Scholar] [Retracted]
- 58.Cicatiello L et al. , Estrogens and progesterone promote persistent CCND1 gene activation during G1 by inducing transcriptional derepression via c-Jun/c-Fos/estrogen receptor (progesterone receptor) complex assembly to a distal regulatory element and recruitment of cyclin D1 to its own gene promoter. Mol Cell Biol 24, 7260–7274 (2004). [DOI] [PMC free article] [PubMed] [Google Scholar]
- 59.Giulianelli S et al. , Estrogen receptor alpha mediates progestin-induced mammary tumor growth by interacting with progesterone receptors at the cyclin D1/MYC promoters. Cancer Res 72, 2416–2427 (2012). [DOI] [PubMed] [Google Scholar]
- 60.Said TK, Conneely OM, Medina D, O’Malley BW, Lydon JP, Progesterone, in addition to estrogen, induces cyclin D1 expression in the murine mammary epithelial cell, in vivo. Endocrinology 138, 3933–3939 (1997). [DOI] [PubMed] [Google Scholar]
- 61.El-Hafez AA, El Aaty Shawky A, Hasan B, Cyclin D1 overexpression associates with favourable prognostic factors in invasive breast carcinoma. Cancer Biomark 12, 149–154 (2012). [DOI] [PubMed] [Google Scholar]
- 62.Mohammadizadeh F, Hani M, Ranaee M, Bagheri M, Role of cyclin D1 in breast carcinoma. J Res Med Sci 18, 1021–1025 (2013). [PMC free article] [PubMed] [Google Scholar]
- 63.Peurala E, Koivunen P, Haapasaari KM, Bloigu R, Jukkola-Vuorinen A, The prognostic significance and value of cyclin D1, CDK4 and p16 in human breast cancer. Breast Cancer Res 15, R5 (2013). [DOI] [PMC free article] [PubMed] [Google Scholar]
- 64.Nigg EA, Mitotic kinases as regulators of cell division and its checkpoints. Nat Rev Mol Cell Biol 2, 21–32 (2001). [DOI] [PubMed] [Google Scholar]
- 65.Kumar S, Sharma AR, Sharma G, Chakraborty C, Kim J, PLK-1: Angel or devil for cell cycle progression. Biochim Biophys Acta 1865, 190–203 (2016). [DOI] [PubMed] [Google Scholar]
- 66.Alvarez B, Martinez AC, Burgering BM, Carrera AC, Forkhead transcription factors contribute to execution of the mitotic programme in mammals. Nature 413, 744–747 (2001). [DOI] [PubMed] [Google Scholar]
- 67.Takai N et al. , Expression of polo-like kinase in ovarian cancer is associated with histological grade and clinical stage. Cancer Lett 164, 41–49 (2001). [DOI] [PubMed] [Google Scholar]
- 68.Zhang R et al. , Misregulation of polo-like protein kinase 1, P53 and P21WAF1 in epithelial ovarian cancer suggests poor prognosis. Oncol Rep 33, 1235–1242 (2015). [DOI] [PubMed] [Google Scholar]
- 69.Takai N et al. , Polo-like kinase (PLK) expression in endometrial carcinoma. Cancer Lett 169, 41–49 (2001). [DOI] [PubMed] [Google Scholar]
- 70.Tang L, Wang TT, Wu YT, Zhou CY, Huang HF, High expression levels of cyclin B1 and Polo-like kinase 1 in ectopic endometrial cells associated with abnormal cell cycle regulation of endometriosis. Fertil Steril 91, 979–987 (2009). [DOI] [PubMed] [Google Scholar]
- 71.Weichert W et al. , Polo-like kinase isoforms in breast cancer: expression patterns and prognostic implications. Virchows Arch 446, 442–450 (2005). [DOI] [PubMed] [Google Scholar]
- 72.Wang HC, Lee WS, Progesterone-induced migration inhibition in male rat aortic smooth muscle cells through the cSrc/AKT/ERK 2/p38 pathway-mediated up-regulation of p27. Endocrinology 155, 1428–1435 (2014). [DOI] [PubMed] [Google Scholar]
- 73.Cora MC, Kooistra L, Travlos G, Vaginal Cytology of the Laboratory Rat and Mouse: Review and Criteria for the Staging of the Estrous Cycle Using Stained Vaginal Smears. Toxicol Pathol 43, 776–793 (2015). [DOI] [PMC free article] [PubMed] [Google Scholar]
Associated Data
This section collects any data citations, data availability statements, or supplementary materials included in this article.
Supplementary Materials
Data File S1.1 Total List of Differentially Expressed Genes in Pre-Neoplastic Tissue
Data File S1.2 Total List of Differentially Expressed Genes in Neoplastic Tissue (23 weeks)
Data File S1.3 Total List of Differentially Expressed Genes in Neoplastic Tissue (33 weeks)
Data File S1.4 Total List of Differentially Expressed Genes after 24 hour RU486 Treatment
Fig. S1. Levels of the conditional overexpression allele for mPgrB in uterine and ovarian tissue.
Fig. S2. PGR transgene levels are comparable in both Pgrcre/+mPgrALsL/+ and Pgrcre/+mPgrBLsL/+ mice at 13 weeks of age.
Fig. S3. PGR positive ovarian neoplasia from Pgrcre/+mPgrBLsL/+ mice consume the entire ovarian bursa and exhibit robust StAR expression levels.
Fig. S4. Lineage tracing using the Pgrcre/+RosamT/mG model demonstrates localized Cre recombination to the corpus luteum at 8 weeks of age.
Fig. S5. PGRA or PGRB expression does not impair ovarian function.
Fig. S6. Increased ovarian PGR expression does not impair endogenous hormone levels
Fig. S7. Phosphorylated mTORC1 protein levels are slightly reduced in neoplasia of the Pgrcre/+mPgrBLsL/+ ovary.
Fig. S8. pAKT and pERK expression in the Pgrcre/+mPgrALsL/+ ovaries were comparable to the corpus luteum of Pgrcre+mPgrBLsL/+ ovary, but much lower than the tumor tissues of Pgrcre/+mPgrBLsL/+ ovary at 23 weeks neoplastic.
Fig. S9. pAKT and pERK were not activated in the Pgrcre/+mPgrALsL/+ ovaries with neoplasia.
Fig. S10. Message levels of estrogen and progesterone receptors and granulosa cell markers decrease in advanced PGR-driven neoplasia.
Fig. S11. Pgrcre/+mPgrBLsL/+ tumors exhibit decreased density and size after acute RU486 treatment.
Fig. S12. Chronic RU486 treatment suppresses pAKT and pERK levels in the Pgrcre/+mPgrBLsL/+ ovarian tumor tissue.
Fig. S13. PGR ChIP-seq is enriched at promoter regions and binds to hormone receptor binding sequences.
Fig. S14. PGRB promotes the cell cycle through direct regulation of genes necessary for the G2/M transition.
Table S1. Bilateral and unilateral tumors occur in Pgrcre/+mPgrBLsL/+ mice.
Table S2. Canonical pathways are altered in 23-week-old neoplastic Pgrcre/+mPgrBLsL/+ mouse ovaries.
Table S3. PGR causes many changes in multiple canonical pathways involved in cell proliferation and cancer.
Table S4. PGR transcriptionally controls multiple canonical pathways involved in cell proliferation and cancer.
Table S5. Complete list of SYBR primer sequences and Applied Biosystems Taqman probe catalog numbers.