

This diagnostic/prognostic study uses data and color fundus photographs from a randomized clinical trial involving patients undergoing treatment of diabetic macular edema to enable artificial intelligence systems to estimate best-corrected visual acuity and to evaluate the accuracy of those estimates.
Key Points
Question
Can artificial intelligence (AI) systems estimate best-corrected visual acuity (BCVA) from color fundus photographs of study participants undergoing treatment of diabetic macular edema?
Findings
This diagnostic/prognostic study found that the mean absolute error of AI-estimated BCVA from macular fundus photographs across all study visits and all treatment groups was within 10 letters of actual BCVA.
Meaning
Regression techniques applied to estimating BCVA from fundus photographs using deep learning may allow the use of AI-determined BCVA from remotely obtained fundus photographs for evaluating and monitoring diabetic macular edema.
Abstract
Importance
Best-corrected visual acuity (BCVA) is a measure used to manage diabetic macular edema (DME), sometimes suggesting development of DME or consideration of initiating, repeating, withholding, or resuming treatment with anti–vascular endothelial growth factor. Using artificial intelligence (AI) to estimate BCVA from fundus images could help clinicians manage DME by reducing the personnel needed for refraction, the time presently required for assessing BCVA, or even the number of office visits if imaged remotely.
Objective
To evaluate the potential application of AI techniques for estimating BCVA from fundus photographs with and without ancillary information.
Design, Setting, and Participants
Deidentified color fundus images taken after dilation were used post hoc to train AI systems to perform regression from image to BCVA and to evaluate resultant estimation errors. Participants were patients enrolled in the VISTA randomized clinical trial through 148 weeks wherein the study eye was treated with aflibercept or laser. The data from study participants included macular images, clinical information, and BCVA scores by trained examiners following protocol refraction and VA measurement on Early Treatment Diabetic Retinopathy Study (ETDRS) charts.
Main Outcomes
Primary outcome was regression evaluated by mean absolute error (MAE); the secondary outcome included percentage of predictions within 10 letters, computed over the entire cohort as well as over subsets categorized by baseline BCVA, determined from baseline through the 148-week visit.
Results
Analysis included 7185 macular color fundus images of the study and fellow eyes from 459 participants. Overall, the mean (SD) age was 62.2 (9.8) years, and 250 (54.5%) were male. The baseline BCVA score for the study eyes ranged from 73 to 24 letters (approximate Snellen equivalent 20/40 to 20/320). Using ResNet50 architecture, the MAE for the testing set (n = 641 images) was 9.66 (95% CI, 9.05-10.28); 33% of the values (95% CI, 30%-37%) were within 0 to 5 letters and 28% (95% CI, 25%-32%) within 6 to 10 letters. For BCVA of 100 letters or less but more than 80 letters (20/10 to 20/25, n = 161) and 80 letters or less but more than 55 letters (20/32 to 20/80, n = 309), the MAE was 8.84 letters (95% CI, 7.88-9.81) and 7.91 letters (95% CI, 7.28-8.53), respectively.
Conclusions and Relevance
This investigation suggests AI can estimate BCVA directly from fundus photographs in patients with DME, without refraction or subjective visual acuity measurements, often within 1 to 2 lines on an ETDRS chart, supporting this AI concept if additional improvements in estimates can be achieved.
Introduction
In 2014, approximately 19.8 million individuals in the United States 40 years or older had diabetes.1 Among these individuals, about 14.3 million had diabetes without diabetic retinopathy (including absence of diabetic macular edema [DME]), 4.7 million had diabetic retinopathy without DME, and approximately 746 000 had DME.1 Extrapolating these numbers to the estimated 396 million individuals 40 years or older with diabetes worldwide in 20192 suggests that 381.8 million have diabetic retinopathy without DME and 14.2 million have DME.
The management of DME, including as-needed or treat-and-extend-treatment algorithms, typically requires frequent monitoring of both visual acuity and central subfield thickness (CST) on optical coherence tomography (OCT). Eligibility criteria for randomized clinical trials (RCTs) of anti–vascular endothelial growth factor (anti-VEGF) agents in DME are based on best-corrected visual acuity (BCVA) and OCT CST. Subsequently, algorithms for as-needed treatment or decisions to treat and extend in follow-up also use criteria based on BCVA.3,4,5,6 In clinical trials, BCVA is determined by obtaining a protocol refraction, followed by visual acuity measurements by trained visual acuity examiners using a standardized eye chart. While obtaining CST in the clinic typically is quick and accurate (albeit requiring the use of relatively expensive devices), obtaining BCVA by trained examiners using protocol refraction and protocol visual acuity can take up to 20 minutes with each patient. As a result, many ophthalmologists, optometrists, and assisting technicians might obtain VA using habitual correction, eg, whatever distance correction the patient is wearing at the time of the examination, rather than BCVA, and possibly forgo use of an Early Treatment Diabetic Retinopathy Study (ETDRS) eye chart. Visual acuity values using habitual correction may be 1 to 2 lines worse than that obtained by a protocol BCVA,7,8 especially if BCVA is worse than 20/25.7 While most patients with DME likely are assessed and monitored with habitual VA and OCT CST, having a BCVA following protocol refraction and standardized VA assessment may better enable physicians to manage DME using guidelines based on RCTs.
These challenges have motivated this investigation to determine BCVA based on artificial intelligence (AI) analysis of macular images. Use of deep learning systems has been investigated widely for medical AI tasks.9,10,11,12,13,14,15,16,17,18 If deep learning systems could estimate BCVA accurately from a fundus photograph in an eye with DME, they might obviate need for protocol refractions and protocol VA measurements by trained examiners, especially if these images could be obtained using phone cameras (eFigure 1 in Supplement 1).19,20
Thus, the purpose of this investigation was to evaluate the ability of deep learning systems to estimate BCVA from a macular photograph among a cohort of participants receiving fixed-dose anti-VEGF treatment for DME in VISTA, a multicenter RCT.5 All study participants had a protocol refraction, protocol VA measurement, and color macular photographs obtained when BCVA was determined. This estimation of fundus-photo-to-BCVA is a regression task, analogous to other investigations in medical AI,21 and pursued recently in ophthalmology specifically for VA estimation from OCT angiography22 or fundus images.23 However, to our knowledge, BCVA estimation has not been investigated in the setting of DME wherein both protocol refraction and protocol VA measurements, as the gold standard, were obtained by trained personnel as primary outcome measurements for a regulatory agency; fundus photographs were obtained at the same visit as BCVA; and participants were followed up longitudinally.
Methods
Study Participants
In brief, study participants were patients enrolled into the VISTA trial5 after providing written informed consent that included use of deidentified data for post hoc analyses such as this investigation. Formal review and waiver of consent for this post hoc investigation was approved by the Johns Hopkins University School of Medicine institutional review board on March 29, 2021. Eligible participants had a protocol BCVA following a protocol refraction by trained VA examiners across 54 sites (see the trial protocol in Supplement 2). At baseline, BCVA letter score (approximate Snellen equivalent) in the study eye had to be between 73 (20/40) and 24 (20/320). Other principal eligibility and exclusion criteria are listed in eTable 1 in Supplement 1.5 In this post hoc analysis, data on how race, ethnicity, and sex were reported were not recorded.
Eligible participants were randomized to receive aflibercept, 2.0 mg (as a 0.05-mL injection), either every 4 weeks or every 8 weeks after 5 initial doses every 4 weeks or macular laser photocoagulation for DME in the study eye. Rescue aflibercept or laser was permitted starting from week 24. Participants had study visits every 4 weeks through 148 weeks. ETDRS 7-field stereoscopic color fundus photographs (ranging from 30° to 60° images) were obtained at baseline and every 24 weeks by trained fundus photographers.
To be eligible for this post hoc analysis, participants had to have at least 1 macular photograph of acceptable quality of the study eye following dilation (eMethods in Supplement 1). Data and color fundus photographs were transferred in a deidentified manner from Regeneron Pharmaceuticals Inc to Johns Hopkins University using a download site compliant with Health Insurance Portability and Accountability Act regulations. The Transparent Reporting of a Multivariable Prediction Model for Individual Prognosis or Diagnosis (TRIPOD) reporting guideline was used in the development and revision of this report.
Preprocessing of Data and Fundus Photographs
In addition to BCVA with matching fundus photographs across 148 weeks for the primary outcome measures, selected baseline characteristics (eTable 2 in Supplement 1), baseline and follow-up fundus photographs, and data about the time elapsed between baseline and follow-up fundus photographs were provided for training, validation, and testing to estimate BCVA for other secondary and exploratory outcomes. No other metadata accompanying the images, such as whether the fundus image was the right vs left eye, which of the 7 stereoscopic fields of view was the fundus image (eg, field 1 centered on the optic nerve or field 2 centered on the macula), or the quality or any other information about the fundus image, were provided. When fundus photographs were obtained, approximately 24 images for each participant were collected, although this number was inconsistent and varied with each visit. The field of view typically spanned 30° to 45°. The field of view was fixed at each study location from baseline through follow-up visits. Several images of varying quality typically existed for each study visit. To create a final database of images for each study participant at each visit to be matched to the BCVA at that visit, several classifiers were developed to perform preliminary data analysis and verification (eMethods in Supplement 1).
Deep Learning Architectures and Outcome Measures
Ten different architectures were used for primary outcome measures (eTable 3 in Supplement 1). The number of participants by visits along with the total number of images used for training, validation, and testing, with and without baseline images added to the algorithm input, are shown in eTable 4 in Supplement 1. The prespecified primary outcome measure was mean absolute error (MAE), comparing the AI-estimated BCVA from macular photographs across all study visits and all treatment groups to actual BCVA, without adjustment for images from different visits that were from the same participant. Mean absolute error was used for comparing model performance, determining how far the prediction of the algorithm was from the actual BCVA; eg, an MAE of 9 letters indicates an algorithm’s predictions are 9 letters away from the true value. A value to indicate accuracy, eg, the percentage within 10 letters, was provided as potentially more relevant from a clinician’s perspective. Both study eyes and fellow eyes were used for training, validation, and testing sets. Prespecified secondary outcomes included the coefficient of determination (R2) and correlation coefficients between actual and estimated BCVA (eTable 9 in Supplement 1). These outcomes were based on AI evaluation only of macular photographs. Subsequently, the algorithm providing the best estimation (MAE) was used for additional prespecified exploratory analyses.
Exploratory analyses included (1) percentage of predictions within 0 to 5 letters, 6 to 10 letters, or more than 10 letters; (2) AI evaluation of follow-up macular photographs, adding the baseline BCVA to the algorithm input; and (3) AI evaluation of follow-up macular photographs adding baseline information as listed in eTable 2 in Supplement 1 as well as weeks since randomization to the algorithm input. Estimated BCVA was considered an outlier if it was greater than 2 SD outside actual BCVA on Bland-Altman plots. Outliers were reviewed in a masked fashion by retina experts determining any reasons accounting for such discrepancies (eMethods in Supplement 1).
Results
From May 2011 to January 2012, 466 participants were randomized to receive aflibercept every 4 weeks (n = 156), aflibercept every 8 weeks (n = 154), or macular laser photocoagulation (n = 156). From this cohort, 459 participants (aflibercept every 4 weeks, n = 154, and every 8 weeks, n = 151, and macular laser photocoagulation, n = 154) were included in the full analyses set (participants with baseline BCVA and ≥1 postbaseline BCVA available) with 7185 macular photographs of the study and fellow eyes available through November 2014, when the 3-year visit was completed (Figure 1). Baseline characteristics for these 459 participants by randomly assigned treatment group are shown in eTable 2 in Supplement 1. Mean (SD) age was 62.2 (9.8) years, 250 (54.5%) were male, and 209 (45.5%) were female. Excluding patients who died, completion rates at 1, 2, and 3 years were 95.4% (435 of 456 eyes), 86.9% (385 of 443 eyes), and 81.9% (357 of 436 eyes), respectively.
Figure 1. Participant Flow From Randomization to Final 3-Year Visit.
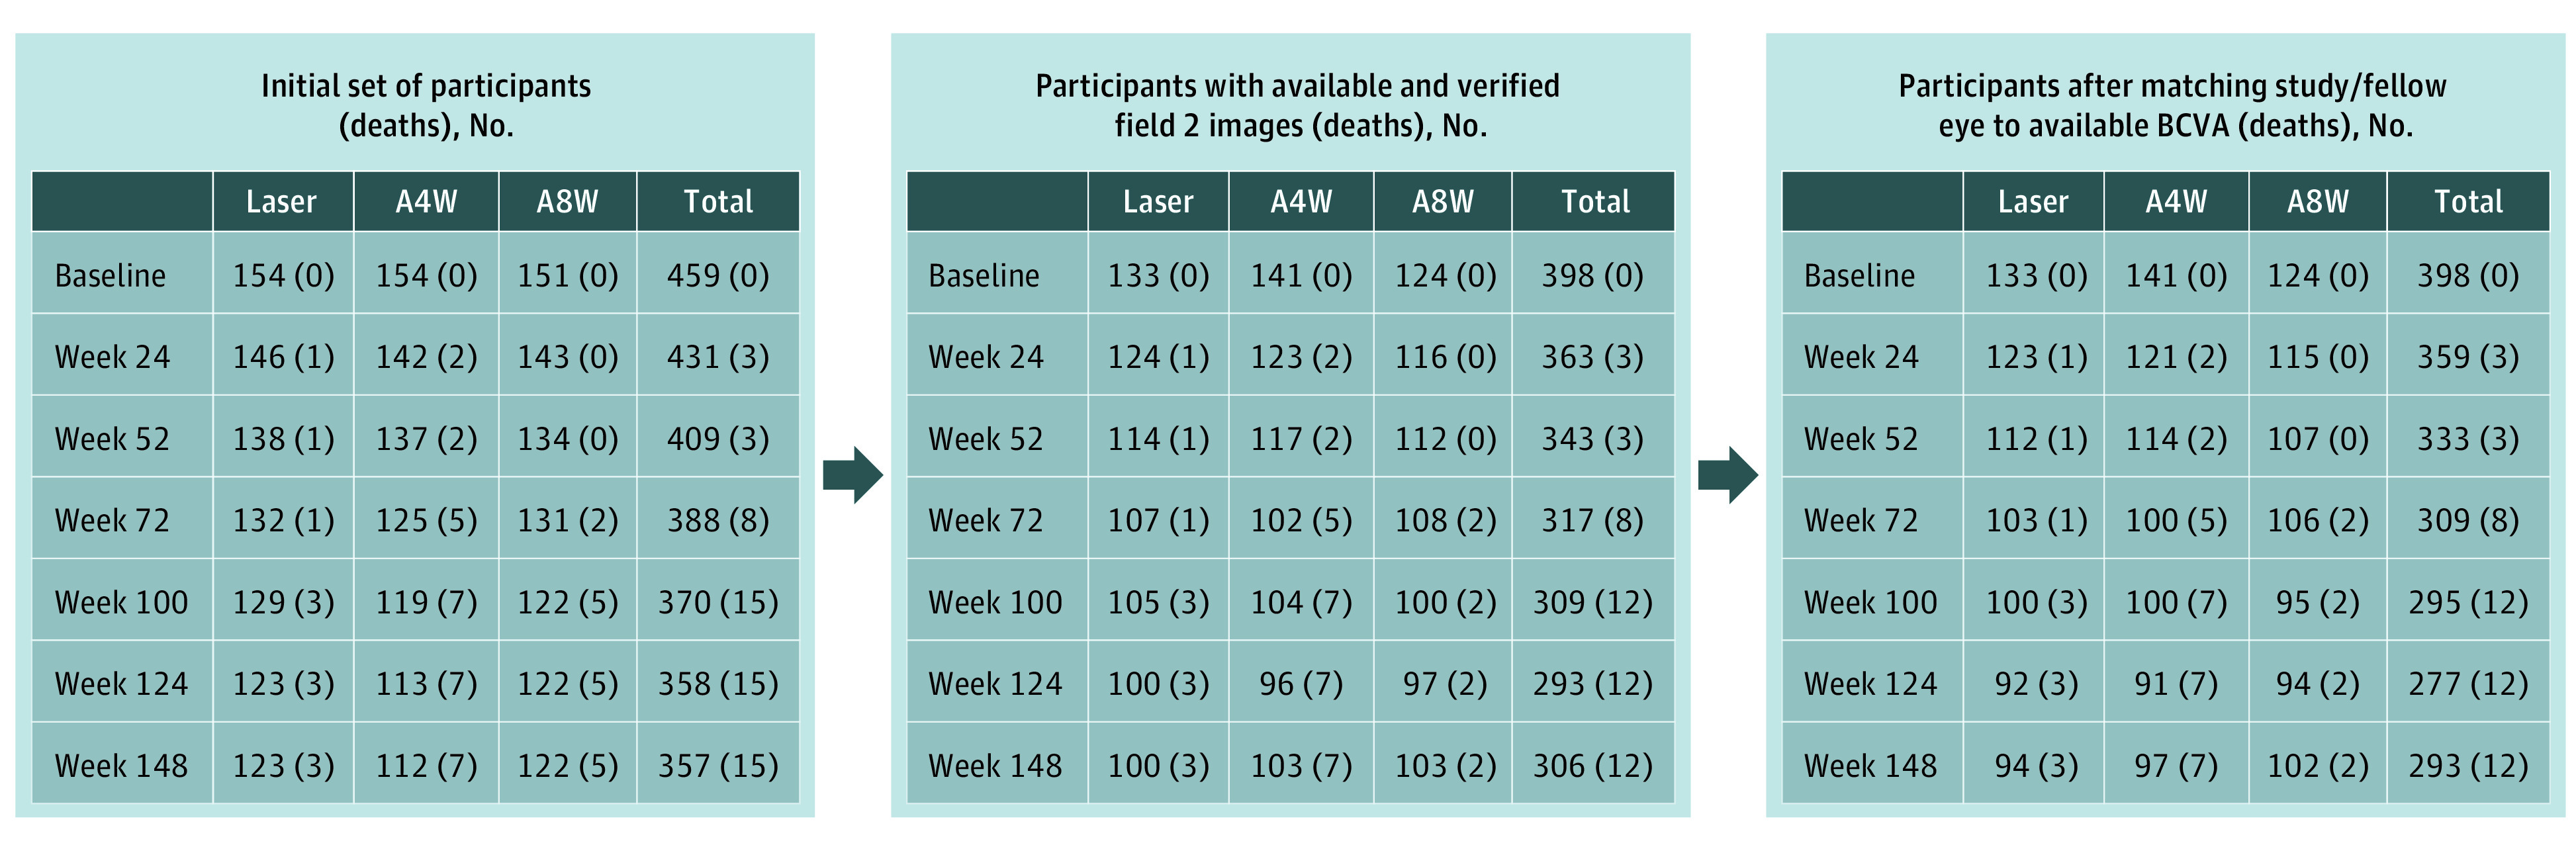
Down-selection of images from baseline participants by treatment group showing the number of participants at each subsequent 6-month visit with images that were used to estimate visual acuity. Deaths are shown in each group for participants who completed a visit in this window but died before completing the designated 3-year study visit. A4W indicates the group who received aflibercept every 4 weeks; A8W, those receiving the same dose of aflibercept every 4 weeks for 5 doses and then every 8 weeks; BCVA, best-corrected visual acuity; laser, participants who received macular laser photocoagulation.
Mean (SD) baseline VA letter score was 59.3 (10.9) letters, with an approximate Snellen equivalent of 20/63; mean (SD) CST was 483 (154) μm (eTable 2 in Supplement 1). Mean (SD) follow-up BCVA letter score at the 1-, 2-, and 3-year visits was 67.1 (14.9), 67.2 (16.5), and 66.8 (17.0), respectively, with approximate Snellen equivalents of 20/50, 20/50, and 20/50, respectively (eTable 2 in Supplement 1).
The median number of visits over 3 years when fundus photographs were taken, including the baseline visit, was 7, 7, and 7 in each of the aflibercept and macular laser photocoagulation groups, respectively. The median number of macular images across visits ranged from 826 to 1373 (eTable 5 in Supplement 1). The median number of aflibercept injections in the study eye over 3 years was 34 (IQR, 28-36) in the every–4-weeks group and 20 (IQR, 18-21) in the every–8-weeks group. Laser photocoagulation was performed in 23 of 305 aflibercept-group study eyes (7.5%). In the macular laser photocoagulation group, 48 study eyes (31.2%) received aflibercept between 6 months and 1 year, 63 (40.9%) between 6 months and 2 years, and 134 (87%) between 6 months and 3 years.
AI-Based Estimation of BCVA at a Specific Baseline or Follow-up Visit
The estimated BCVA at specific baseline or follow-up visits by various architectures are shown in Table 1, regardless of treatment group. Best estimation performance as ranked by the MAE appeared to be with ResNet50 architecture on the testing set (n = 641) wherein the MAE was 9.66 letters (95% CI, 9.05-10.28). Within subgroups by BCVA, for 84% of the testing set (538 of 641) wherein BCVA letter score was 100 or less but more than 80 (20/10 to 20/25, n = 161) or 80 or less but more than 55 (20/32 to 20/80, n = 309), the MAE was 8.84 letters (95% CI, 7.88-9.81) and 7.91 letters (95% CI, 7.28-8.53), respectively (Table 2). The percentage of AI-predicted BCVA within 5, 6 to 10, and more than 10 letters of actual BCVA was approximately 30%, 30%, and 40%, respectively, across various architectures (Table 1).
Table 1. Differences Between Artificial Intelligence Predictions and Actual Best-Corrected Visual Acuitya.
| Feature used | Architecture | Prediction difference from actual BCVA, % (95% CI) | Mean absolute error (primary outcome), No. of letters | ||
|---|---|---|---|---|---|
| ≤5 Letters | 6-10 Letters | >10 Letters | |||
| Evaluated at baseline and follow-up (n = 641) | |||||
| Photos only | ResNet50 | 33 (30-37) | 28 (25-32) | 39 (35-42) | 9.66 (9.05-10.28) |
| Photos only | ResNet50 (zoom ×3) | 33 (30-37) | 27 (23-30) | 40 (36-44) | 10.24 (9.50-10.97) |
| Photos only | ResNet50 (zoom ×5) | 30 (27-34) | 23 (20-26) | 47 (43-51) | 11.05 (10.32-11.79) |
| Photos only | ConvNeXt | 26 (22-29) | 30 (26-33) | 44 (41-48) | 11.26 (10.51-12.00) |
| Photos only | EfficientNetV2 | 32 (29-36) | 28 (25-32) | 39 (36-43) | 9.65 (9.04-10.27) |
| Photos only | Swin Transformer | 28 (25-32) | 29 (26-33) | 42 (39-46) | 11.03 (10.28-11.79) |
| Evaluated at follow-up only (n = 488) | |||||
| Photo only | ResNet50 | 34 (30-39) | 29 (25-33) | 37 (33-41) | 9.35 (8.69-10.02) |
| Baseline characteristics only | LightGBM | 30 (26-34) | 29 (25-33) | 41 (37-45) | 10.17 (9.41-10.93) |
| Photos and baseline BCVA | ResNet50 | 37 (33-41) | 26 (22-30) | 37 (33-42) | 8.85 (8.26-9.44) |
| Photos and baseline characteristics | ResNet50 | 32 (28-36) | 34 (30-38) | 34 (29-38) | 8.93 (8.31-9.54) |
Abbreviations: BCVA, best-corrected visual acuity; photos, macular color fundus photographs.
See the eReferences in Supplement 1 for each model.
Table 2. Distributions of Error by Baseline Best-Corrected Visual Acuity Subgroup in the Testing Seta.
| Features used | Architecture | Distribution of error by BCVA letter score (Snellen equivalent), % (95% CI) | |||||||||||
|---|---|---|---|---|---|---|---|---|---|---|---|---|---|
| ≤100 to >80 (∼20/10 to 20/25)b | ≤80 to >55 (∼20/32 to 20/80)c | ≤55 to >35 (∼20/80 to 20/160)d | ≤35 to 0 (∼20/200 to 20/800)e | ||||||||||
| ≤5 Letters | 6-10 Letters | >10 Letters | ≤5 Letters | 6-10 Letters | >10 Letters | ≤5 Letters | 6-10 Letters | >10 Letters | ≤5 Letters | 6-10 Letters | >10 Letters | ||
| Evaluated at baseline and follow-up | |||||||||||||
| Photos only | ResNet50 | 33 (26 to 40) | 32 (24 to 39) | 35 (28 to 43) | 40 (35 to 44) | 31 (26 to 35) | 30 (25 to 34) | 13 (6 to 20) | 15 (8 to 23) | 71 (62 to 81) | 5 (−5 to 15) | 0 (0 to 0) | 95 (85 to 105) |
| Photos only (study)f | ResNet50 | 35 (28 to 43) | 29 (22 to 36) | 35 (28 to 43) | 41 (36 to 46) | 31 (26 to 35) | 28 (23 to 32) | 1 (−1 to 4) | 10 (3 to 16) | 89 (83 to 96) | 0 (0 to 0) | 0 (0 to 0) | 100 (100 to 100) |
| Photos only | ResNet50 (zoom ×3) | 24 (18 to 31) | 26 (19 to 33) | 50 (42 to 57) | 40 (35 to 45) | 26 (22 to 31) | 34 (29 to 38) | 6 (1 to 11) | 6 (1 to 11) | 88 (81 to 95) | 0 (0 to 0) | 0 (0 to 0) | 100 (100 to 100) |
| Photos only | ResNet50 (zoom ×5) | 0 (0 to 0) | 38 (30 to 45) | 62 (55 to 70) | 44 (38 to 49) | 35 (30 to 40) | 22 (18 to 26) | 0 (0 to 0) | 0 (0 to 0) | 100 (100 to 100) | 0 (0 to 0) | 0 (0 to 0) | 100 (100 to 100) |
| Photos only | ConvNeXt | 21 (15 to 27) | 33 (26 to 40) | 46 (38 to 54) | 45 (40 to 50) | 31 (26 to 35) | 25 (21 to 29) | 5 (0 to 9) | 17 (9 to 25) | 79 (70 to 87) | 0 (0 to 0) | 0 (0 to 0) | 100 (100 to 100) |
| Photos only | EfficientNetV2 | 0 (0 to 0) | 47 (39 to 55) | 53 (45 to 61) | 48 (43 to 53) | 30 (25 to 35) | 22 (18 to 26) | 0 (0 to 0) | 0 (0 to 0) | 100 (100 to 100) | 0 (0 to 0) | 0 (0 to 0) | 100 (100 to 100) |
| Photos only | Swin Transformer | 33 (25 to 40) | 33 (26 to 41) | 34 (26 to 42) | 41 (35 to 47) | 31 (25 to 36) | 28 (23 to 33) | 12 (4 to 21) | 11 (3 to 19) | 77 (66 to 88) | 0 (0 to 0) | 0 (0 to 0) | 100 (100 to 100) |
| Evaluated at follow-up only | |||||||||||||
| Photos only | ResNet50 | 25 (18 to 32) | 28 (21 to 35) | 47 (39 to 55) | 39 (34 to 45) | 36 (31 to 42) | 24 (19 to 29) | 0 (0 to 0) | 4 (−1 to 8) | 96 (92 to 101) | 0 (0 to 0) | 0 (0 to 0) | 100 (100 to 100) |
| Baseline characteristics only | LightGBM | 40 (32 to 48) | 29 (21 to 36) | 31 (24 to 39) | 41 (35 to 47) | 28 (23 to 33) | 31 (25 to 36) | 14 (5 to 23) | 12 (4 to 21) | 73 (62 to 85) | 0 (0 to 0) | 0 (0 to 0) | 100 (100 to 100) |
| Photos and baseline BCVA | ResNet50 | 23 (17 to 30) | 37 (30 to 45) | 39 (32 to 47) | 43 (37 to 49) | 37 (31 to 42) | 20 (15 to 25) | 7 (0 to 14) | 20 (9 to 30) | 73 (62 to 85) | 0 (0 to 0) | 0 (0 to 0) | 100 (100 to 100) |
| Photos and baseline characteristics | ResNet50 | 33 (26 to 40) | 32 (24 to 39) | 35 (28 to 43) | 40 (35 to 44) | 31 (26 to 35) | 30 (25 to 34) | 13 (6 to 20) | 15 (8 to 23) | 71 (62 to 81) | 5 (−5 to 15) | 0 (0 to 0) | 95 (85 to 105) |
Abbreviations: BCVA, best-corrected visual acuity; photos, macular color fundus photographs.
See the eReferences in Supplement 1 for each model.
The number in the testing set evaluated with photographs only, n = 161; evaluated with all other features, n = 150.
The number in the testing set evaluated with photographs only, n = 377; evaluated with all other features, n = 272.
The number in the testing set evaluated with photographs only, n = 84; evaluated with all other features, n = 56.
The number in the testing set evaluated with photographs only, n = 19; evaluated with all other features, n = 10.
The number of data points evaluated on study-only photos is, for scores ≤100 to >80, 57 images; for scores ≤80 to >55, 197 images; for scores ≤55 to >35, 46 images; and for scores ≤35 to 0, 5 images.
Using ResNet50 architecture and adding baseline information did not appear to improve estimates substantially (Table 1). Providing baseline BCVA or previous BCVA from 6 months earlier did not appear to improve estimates substantially (Table 1), nor did restricting image analysis to the central macula (eFigure 2 in Supplement 1). Distributions of error by baseline BCVA in the testing set also appeared similar to the overall results (Table 2). Distributions of error (Table 3) for study eye fundus images and by treatment group assignment (macular laser or a combined aflibercept group, both frequencies) showed similar results to overall results when BCVA was better than 20/100, as did distributions of error for baseline and follow-up images (eTable 6 in Supplement 1) or amount of bias in predictions, with typical amounts of underestimated or overestimated BCVA in eTable 7 in Supplement 1.
Table 3. Distributions of Error in Best-Corrected Visual Acuity Letter Score by Treatment Group Assignmenta.
| Feature used | Architecture | Study-only images, % (95% CI)b | Macular laser group, % (95% CI)c | Combined aflibercept group, % (95% CI)d | ||||||
|---|---|---|---|---|---|---|---|---|---|---|
| ≤5 Letters | 6-10 Letters | >10 Letters | ≤5 Letters | 6-10 Letters | >10 Letters | ≤5 Letters | 6-10 Letters | >10 Letters | ||
| Evaluated at baseline and follow-up | ||||||||||
| Photos only | ResNet50 | 35 (30-40) | 29 (24-34) | 36 (31-41) | 38 (30-46) | 29 (22-37) | 33 (25-40) | 32 (28-36) | 28 (24-32) | 40 (36-45) |
| Photos only | ResNet50 (zoom ×3) | 31 (26-37) | 30 (24-35) | 39 (34-44) | 37 (29-44) | 27 (20-34) | 37 (29-44) | 32 (28-37) | 27 (23-31) | 41 (37-45) |
| Photos only | ResNet50 (zoom ×5) | 35 (29-40) | 24 (19-29) | 41 (35-47) | 43 (35-51) | 25 (18-32) | 32 (25-39) | 27 (23-31) | 22 (18-26) | 51 (47-56) |
| Photos only | ConvNeXt | 26 (21-31) | 31 (26-37) | 42 (37-48) | 39 (31-46) | 26 (19-33) | 35 (28-43) | 22 (18-25) | 31 (27-35) | 47 (43-52) |
| Photos only | EfficientNetV2 | 38 (32-43) | 29 (24-34) | 33 (28-39) | 45 (37-53) | 19 (13-26) | 36 (28-44) | 28 (24-32) | 31 (27-35) | 41 (36-45) |
| Photos only | Swin Transformer | 29 (23-34) | 33 (28-38) | 39 (33-44) | 40 (32-48) | 23 (17-30) | 37 (29-44) | 24 (21-28) | 31 (27-35) | 44 (40-49) |
| Evaluated at follow-up only | ||||||||||
| Photos only | ResNet50 | 36 (30-42) | 29 (23-35) | 35 (29-41) | 38 (29-47) | 31 (22-39) | 31 (23-40) | 33 (28-38) | 28 (23-33) | 39 (34-44) |
| Baseline characteristics only | LightGBM | 31 (25-37) | 31 (25-37) | 38 (32-45) | 21 (13-28) | 31 (23-40) | 48 (39-57) | 33 (28-37) | 29 (24-33) | 39 (34-44) |
| Photos and baseline BCVA | ResNet50 | 38 (32-44) | 30 (24-35) | 32 (27-38) | 38 (29-47) | 25 (17-32) | 37 (29-46) | 37 (32-41) | 26 (22-31) | 37 (32-42) |
| Photos and baseline characteristics | ResNet50 | 35 (29-41) | 34 (28-40) | 31 (25-37) | 31 (22-39) | 43 (34-52) | 26 (19-34) | 33 (28-37) | 31 (27-36) | 36 (31-41) |
Abbreviations: BCVA, best-corrected visual acuity; photos, macular color fundus photographs.
See the eReferences in Supplement 1 for each model.
The number whose scores were evaluated at baseline and follow-up was n = 305; evaluated at follow-up only, n = 237.
The number whose scores were evaluated at baseline and follow-up was n = 150; evaluated at follow-up only, n = 121.
This group combines participants who received aflibercept, 2.0 mg/0.05 mL, every 4 weeks and those receiving the same dose every 4 weeks for 5 doses and every 8 weeks thereafter. The number whose scores were evaluated at baseline and follow-up was n = 491; evaluated at follow-up only, n = 367.
Figure 2 shows scatterplots of all data comparing estimated BCVA with actual BCVA. Most results were within 10 letters of the actual BCVA, and many were within 5 letters as shown on density plots (eFigures 3-6 in Supplement 1), with no substantial improvement apparent when adding baseline BCVA or other characteristics to the model.
Figure 2. Scatterplots of Predicted vs Actual Best-Corrected Visual Acuity (BCVA).
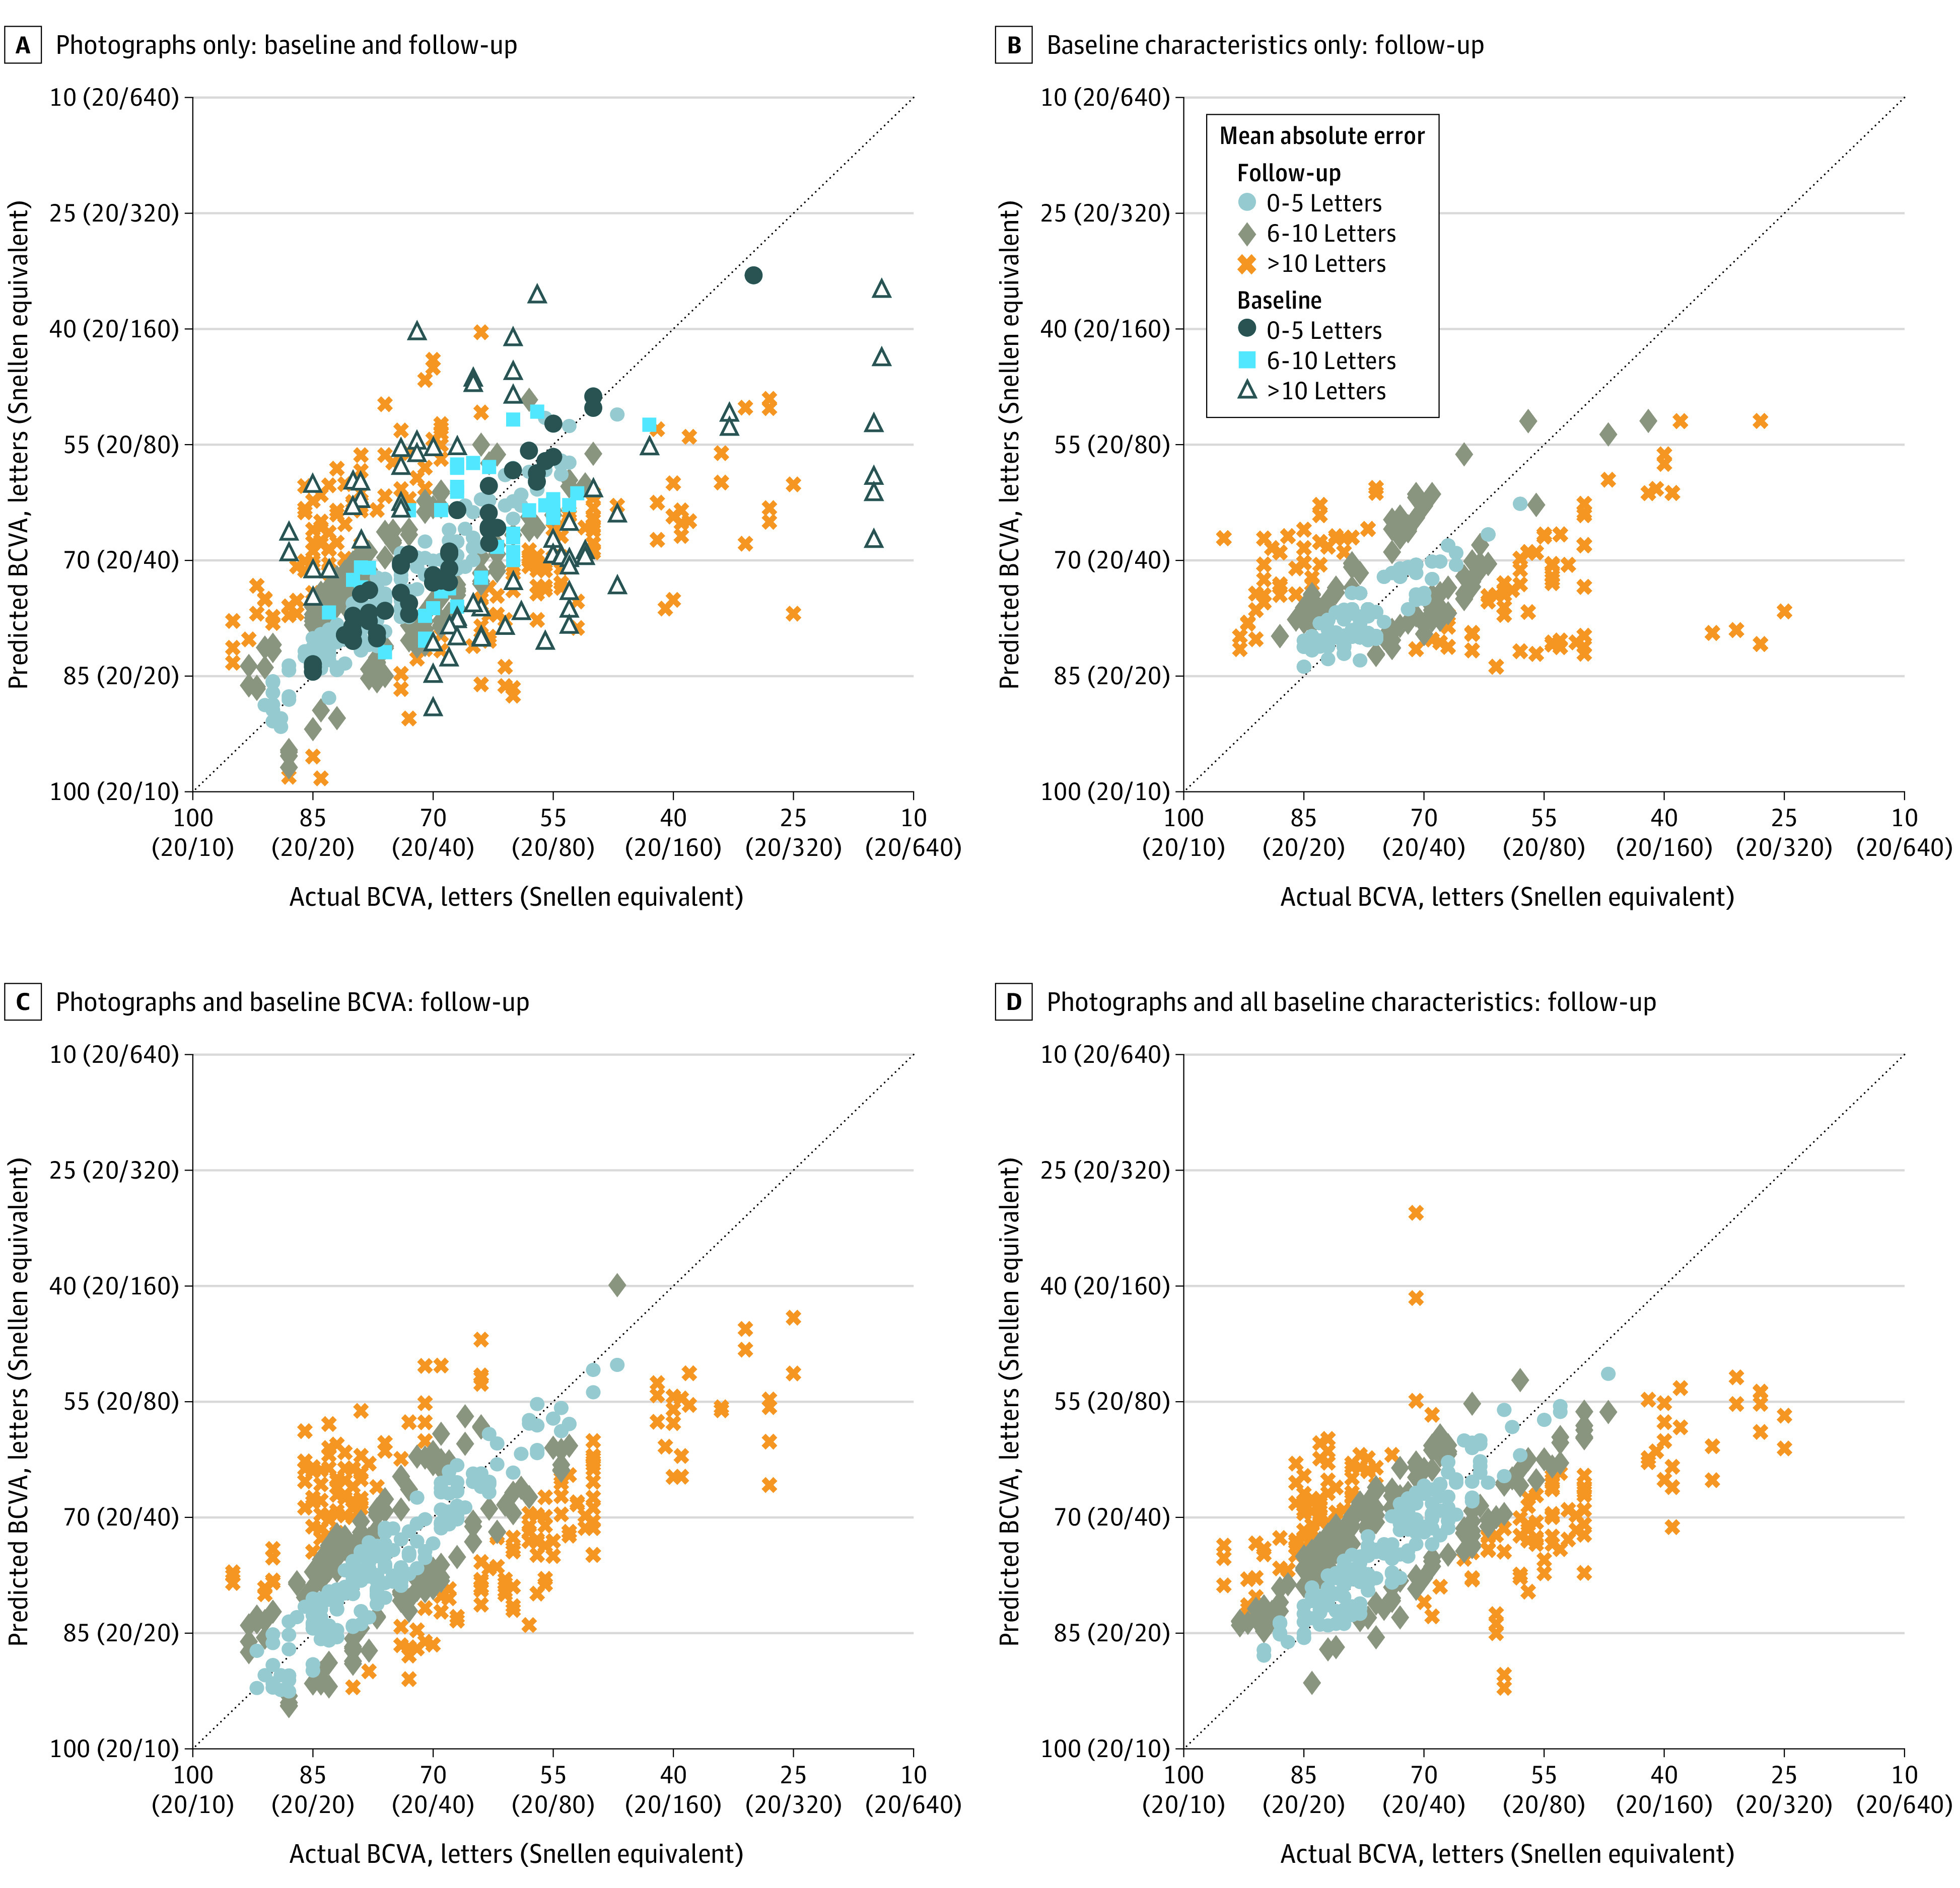
Scatterplots from deep learning models that used only macular photographs (A) and only baseline characteristics (B) and models that added to the photographs other patient information typically available at a clinic visit, such as baseline BCVA (C) and all baseline characteristics (D). Each marker corresponds to a data point from the testing data set; the dotted line indicates perfect agreement between predicted and actual BCVA. The machine-learning architectures used for the plots were ResNet50 (A, C, and D) and LightGBM (B).
Evaluation of Outliers
Bland-Altman scatterplots show 29 images from 15 participants wherein estimated VA was greater than 2 SD outside of BCVA (eFigure 7 in Supplement 1). When evaluated manually in a masked fashion, obvious pathology other than DME on these fundus images was judged likely to account for 27 (93%) with obvious pathologies detailed in eTable 8 in Supplement 1. Post hoc exploratory outcomes excluding the 27 outliers showed no substantial differences from overall results nor for MAE within BCVA subgroups (eTables 10 and 11 in Supplement 1).
Discussion
This investigation found that AI can estimate BCVA directly from color fundus photographs of patients with DME, often within 1 to 2 lines on an ETDRS chart. These findings support use of AI systems to estimate BCVA using this method for patients undergoing anti-VEGF treatment of DME without refraction or subjective VA measurements. Using the deep learning architecture ResNet50, estimated BCVA from fundus images was within 10 letters of protocol-refracted BCVA on ETDRS charts when BCVA was better than 20/100, a range often noted with DME, although worse than the expected range of repeat testing for most eyes.24 Greater accuracy among eyes with BCVA 20/80 or better could be related, in part, to having fewer eyes with BCVA worse than 20/80 available for training and validation.
Algorithms other than ResNet50 did not appear to provide substantial improvement for estimating BCVA. Outcomes also did not show substantial improvement when including baseline information (eTable 4 in Supplement 1), baseline BCVA, or previous BCVA from 6 months ago, when previous fundus photographs were obtained (Table 2). This latter finding suggests knowing the previous BCVA may not be essential to estimating BCVA from macular photographs at a particular visit.
Exploratory outcomes were undertaken to evaluate ways of potentially improving estimation. Given the exploratory nature of these outcomes, results and trends should be viewed with caution. Restricting image analysis to the central macula (eFigure 2 in Supplement 1) did not appear to improve estimates. One hypothesis that might account for this is that information outside the central macula across the 30° field may have contributed to the algorithm’s estimation of the BCVA.
Adding other information typically available at a clinic visit for patients with DME (Figure 2D) to the models using only photographs (Figure 2A) may provide improvements for low (below 20/160) BCVA data points as well as generally tighten the overall distribution to the perfect agreement line. In contrast, including both photographs and baseline characteristics in the model, rather than only baseline characteristics (Figure 2B), was associated with better predictions across a wider range of BCVA, particularly improving predictions for BCVA of 20/80 or better or potentially reducing the number of outliers in the range 20/160 to 20/320.
Using the full suite of demographic data with macular photographs rarely predicted BCVAs better than 20/20. Furthermore, restricting demographic data only to the baseline BCVA (Figure 2C) appeared to improve prediction for BCVA better than 20/20. When outliers were removed from the analysis for primary and principal secondary outcomes, there may have been a slight improvement in the results (eTable 6 in Supplement 1 vs Table 1 and eTable 7 in Supplement 1 vs Table 2), but there were only a small number of outliers. Further studies would be needed to determine if these estimates should be avoided when there is macular pathology other than DME affecting fundus images. Anomaly detectors17 might be used to screen for such possibilities. Macular pathology other than DME was to be excluded at baseline; hence, this was uncommon in this data set.
The clinical relevance of using AI to estimate BCVA is severalfold. When extrapolating from clinical trials to the clinical practice setting, ideally the decision to initiate treatment in DME can depend on BCVA. However, most practices do not obtain a BCVA following a protocol refraction and protocol VA measurement using an ETDRS or electronic ETDRS chart at most visits, if not all. Deep learning analysis of macular images might circumvent this problem. To our knowledge, other home tests for measuring VA have not been compared with same-day BCVA obtained following a protocol refraction and standardized VA measurement on an ETDRS chart in the setting of patients with DME undergoing anti-VEGF therapy over several years.
Furthermore, the time involved to take fundus photographs and estimate BCVA could be less than the time needed to obtain protocol refractions and protocol VA measurements and might be faster than measuring VA with habitual correction if similar outcomes can be obtained from digital images of the macula captured without dilation. Using AI algorithms to estimate BCVA also may facilitate determining follow-up intervals or retreatment. Ideally, this AI estimate of BCVA should be combined with OCT CST measurements over time.
Additional analyses are needed to determine whether these findings can be generalized to patients prospectively, outside of the clinical trial setting, as well as across other retinal diseases, such as neovascular age-related macular degeneration. Further analyses also seem warranted to determine if even more precise estimates of BCVA can be obtained by improving algorithms, incorporating additional patient information that is readily available at the time of obtaining the fundus photograph, or adding estimates of OCT CST from these photographs.
Limitations
Several limitations should be considered. Images included in this investigation were from patients participating in an RCT, where eligibility criteria included study eyes with DME but without substantial media opacity that could contribute to VA loss. Additional studies would be needed to determine whether these algorithms work for patients with different racial and ethnic backgrounds, different media opacities, fewer visits, or broader ranges of BCVA. In addition, there were too few eyes with BCVA worse than 20/80 to determine if the algorithm performed similarly at these worse levels of BCVA. Furthermore, multiple macular images from the same participant were analyzed at different study visits. Therefore, there were only approximately 400 unique study participants. This limitation may require more sophisticated techniques, eg, based on recurrent neural networks,25 attention-based models,26 or transformers,27 a relatively new paradigm in deep neural networks to better estimate and predict future BCVA.
Conclusions
This investigation shows that BCVA can be estimated from a fundus photograph without a protocol refraction or protocol ETDRS VA measurement within 1 to 2 ETDRS lines for many participants with central-involved DME receiving laser photocoagulation or aflibercept in the VISTA RCT. These findings open up possibilities of using AI in the clinic or with home monitoring to obtain BCVA efficiently and economically, decreasing the time and expense related to the trained personnel involved in managing DME around the world.
eMethods
eTable 1. Principal Eligibility and Exclusion Criteria in VISTA Randomized Clinical Trial
eTable 2. Baseline Participant and Study Eye Ocular Characteristics and Study Eye BCVA at Follow-up Visits
eTable 3. Deep Learning Architectures Employed
eTable 4. Participant Visits Used for Training, Validation and Testing
eTable 5. Median Number of Macular Images by Treatment Group at Visits Where Fundus Photographs Were to Be Obtained in All Study Participants
eTable 6. Distributions of Error for Baseline and Follow-up Images
eTable 7. Amount of Bias in Predictions, Typical Amount Under-/Over-estimated, Percentage Over-/Under-estimated
eTable 8. Evaluation of Outliers
eTable 9. Primary and Secondary Outcome Measures Removing Identified (Verified) Outliers
eTable 10. MAE by BCVA Subgroup in the Testing Removing Identified (Verified) Outliers
eFigure 1. Concept for Obtaining BCVA or OCT CST From Hand-Held Device That Obtains Image and Determines These Parameters Through AI Deep Learning
eFigure 2. Zooming in On Image at 3 Times or 5 Times
eFigure 3. Density Plots: Photo Only ResNet50
eFigure 4. Density Plots: Photo With Baseline BCVA
eFigure 5. Density Plots: ResNet 50 With Baseline Characteristics
eFigure 6. Density Plots: Baseline Characteristics without Photo
eFigure 7. Bland-Altman Plots to Identify Outliers
eReferences
Trial protocol
Data sharing statement
References
- 1.Varma R, Bressler NM, Doan QV, et al. Prevalence of and risk factors for diabetic macular edema in the United States. JAMA Ophthalmol. 2014;132(11):1334-1340. doi: 10.1001/jamaophthalmol.2014.2854 [DOI] [PMC free article] [PubMed] [Google Scholar]
- 2.Institute for Health Metrics and Evaluation, Global Burden of Disease Collaborative Network . Global Burden of Disease Study 2019 (GBD 2019) results. Accessed January 5, 2023. https://vizhub.healthdata.org/gbd-results/
- 3.Diabetic Retinopathy Clinical Research Network; Writing Committee. Aiello LP, Beck RW, Bressler NM, et al. Rationale for the Diabetic Retinopathy Clinical Research Network treatment protocol for center-involved diabetic macular edema. Ophthalmology. 2011;118(12):e5-e14. doi: 10.1016/j.ophtha.2011.09.058 [DOI] [PMC free article] [PubMed] [Google Scholar]
- 4.Nguyen QD, Brown DM, Marcus DM, et al. ; RISE and RIDE Research Group . Ranibizumab for diabetic macular edema: results from 2 phase III randomized trials: RISE and RIDE. Ophthalmology. 2012;119(4):789-801. doi: 10.1016/j.ophtha.2011.12.039 [DOI] [PubMed] [Google Scholar]
- 5.Brown DM, Schmidt-Erfurth U, Do DV, et al. Intravitreal aflibercept for diabetic macular edema: 100-week results from the VISTA and VIVID studies. Ophthalmology. 2015;122(10):2044-2052. doi: 10.1016/j.ophtha.2015.06.017 [DOI] [PubMed] [Google Scholar]
- 6.Wykoff CC, Abreu F, Adamis AP, et al. ; YOSEMITE and RHINE Investigators . Efficacy, durability, and safety of intravitreal faricimab with extended dosing up to every 16 weeks in patients with diabetic macular oedema (YOSEMITE and RHINE): two randomised, double-masked, phase 3 trials. Lancet. 2022;399(10326):741-755. doi: 10.1016/S0140-6736(22)00018-6 [DOI] [PubMed] [Google Scholar]
- 7.Tsou B, Kong J, Bressler SB, et al. Visual acuity with habitual correction on an ETDRS chart vs protocol refraction on an electronic ETDRS chart in diabetic macular edema [abstract]. Invest Ophthalmol Vis Sci. 2019;60:2612. https://iovs.arvojournals.org/article.aspx?articleid=274267831219535 [Google Scholar]
- 8.Baker CW, Josic K, Maguire MG, et al. ; DRCR Retina Network . Comparison of Snellen visual acuity measurements in retinal clinical practice to electronic ETDRS protocol visual acuity assessment. Ophthalmology. 2022;S0161-6420(22)00976-9. doi: 10.1016/j.ophtha.2022.12.008 [DOI] [PMC free article] [PubMed] [Google Scholar]
- 9.Gulshan V, Peng L, Coram M, et al. Development and validation of a deep learning algorithm for detection of diabetic retinopathy in retinal fundus photographs. JAMA. 2016;316(22):2402-2410. doi: 10.1001/jama.2016.17216 [DOI] [PubMed] [Google Scholar]
- 10.Ting DSW, Liu Y, Burlina P, Xu X, Bressler NM, Wong TY. AI for medical imaging goes deep. Nat Med. 2018;24(5):539-540. doi: 10.1038/s41591-018-0029-3 [DOI] [PubMed] [Google Scholar]
- 11.Burlina PM, Joshi N, Pekala M, Pacheco KD, Freund DE, Bressler NM. Automated grading of age-related macular degeneration from color fundus images using deep convolutional neural networks. JAMA Ophthalmol. 2017;135(11):1170-1176. <year?>. doi: 10.1001/jamaophthalmol.2017.3782 [DOI] [PMC free article] [PubMed] [Google Scholar]
- 12.Burlina P, Joshi N, Pacheco KD, Freund DE, Kong J, Bressler NM. Utility of deep learning methods for referability classification of age-related macular degeneration. JAMA Ophthalmol. 2018;136(11):1305-1307. doi: 10.1001/jamaophthalmol.2018.3799 [DOI] [PMC free article] [PubMed] [Google Scholar]
- 13.Burlina P, Freund DE, Dupas B, Bressler N. Automatic screening of age-related macular degeneration and retinal abnormalities. Annu Int Conf IEEE Eng Med Biol Soc. 2011;2011:3962-3966. doi: 10.1109/IEMBS.2011.6090984 [DOI] [PubMed] [Google Scholar]
- 14.Burlina PM, Joshi N, Pacheco KD, Liu TYA, Bressler NM. Assessment of deep generative models for high-resolution synthetic retinal image generation of age-related macular degeneration. JAMA Ophthalmol. 2019;137(3):258-264. doi: 10.1001/jamaophthalmol.2018.6156 [DOI] [PMC free article] [PubMed] [Google Scholar]
- 15.Pekala M, Joshi N, Liu TYA, Bressler NM, DeBuc DC, Burlina P. Deep learning based retinal OCT segmentation. Comput Biol Med. 2019;114:103445. doi: 10.1016/j.compbiomed.2019.103445 [DOI] [PubMed] [Google Scholar]
- 16.Burlina P, Paul W, Mathew P, Joshi N, Pacheco KD, Bressler NM. Low-shot deep learning of diabetic retinopathy with potential applications to address artificial intelligence bias in retinal diagnostics and rare ophthalmic diseases. JAMA Ophthalmol. 2020;138(10):1070–1077. doi: 10.1001//jamaophthalmol.2020.3269 [DOI] [PMC free article] [PubMed] [Google Scholar]
- 17.Burlina P, Paul W, Liu TYA, Bressler NM. Detecting anomalies in retinal diseases using generative, discriminative, and self-supervised deep learning. JAMA Ophthalmol. 2022;140(2):185-189. doi: 10.1001/jamaophthalmol.2021.5557 [DOI] [PMC free article] [PubMed] [Google Scholar]
- 18.Burlina PM, Joshi N, Pacheco KD, Freund DE, Kong J, Bressler NM. Use of deep learning for detailed severity characterization and estimation of 5-year risk among patients with age-related macular degeneration. JAMA Ophthalmol. 2018;136(12):1359-1366. doi: 10.1001/jamaophthalmol.2018.4118 [DOI] [PMC free article] [PubMed] [Google Scholar]
- 19.Gunasekera CD, Thomas P. High-resolution direct ophthalmoscopy with an unmodified iPhone X. JAMA Ophthalmol. 2019;137(2):212-213. doi: 10.1001/jamaophthalmol.2018.5806 [DOI] [PubMed] [Google Scholar]
- 20.Malerbi FK, Mendes G, Barboza N, Morales PH, Montargil R, Andrade RE. Diabetic macular edema screened by handheld smartphone-based retinal camera and artificial intelligence. J Med Syst. 2021;46(1):8. doi: 10.1007/s10916-021-01795-8 [DOI] [PMC free article] [PubMed] [Google Scholar]
- 21.Vyas S, Banerjee A, Burlina P. Estimating physiological skin parameters from hyperspectral signatures. J Biomed Opt. 2013;18(5):57008. doi: 10.1117/1.JBO.18.5.057008 [DOI] [PubMed] [Google Scholar]
- 22.Díaz M, Díez-Sotelo M, Gómez-Ulla F, Novo J, Penedo MFG, Ortega M. Automatic visual acuity estimation by means of computational vascularity biomarkers using OCT angiographies. Sensors (Basel). 2019;19(21):4732. doi: 10.3390/s19214732 [DOI] [PMC free article] [PubMed] [Google Scholar]
- 23.Kim JH, Jo E, Ryu S, et al. A deep learning ensemble method to visual acuity measurement using fundus images. Appl Sci. 2022;12(6):3190. doi: 10.3390/app12063190 [DOI] [Google Scholar]
- 24.Beck RW, Moke PS, Turpin AH, et al. A computerized method of visual acuity testing: adaptation of the early treatment of diabetic retinopathy study testing protocol. Am J Ophthalmol. 2003;135(2):194-205. doi: 10.1016/S0002-9394(02)01825-1 [DOI] [PubMed] [Google Scholar]
- 25.Mandic D, Chambers J. Recurrent Neural Networks for Prediction: Learning Algorithms, Architectures and Stability. Wiley; 2001. doi: 10.1002/047084535X [DOI] [Google Scholar]
- 26.Niu Z, Zhong G, Yu H. A review on the attention mechanism of deep learning. Neurocomputing. 2021;452:48-62. doi: 10.1016/j.neucom.2021.03.091 [DOI] [Google Scholar]
- 27.Dosovitskiy A, Beyer L, Kolesnikov A, et al. An image is worth 16x16 words: transformers for image recognition at scale. arXiv. Preprint posted online October 22, 2020. doi: 10.48550/arXiv.2010.11929 [DOI]
Associated Data
This section collects any data citations, data availability statements, or supplementary materials included in this article.
Supplementary Materials
eMethods
eTable 1. Principal Eligibility and Exclusion Criteria in VISTA Randomized Clinical Trial
eTable 2. Baseline Participant and Study Eye Ocular Characteristics and Study Eye BCVA at Follow-up Visits
eTable 3. Deep Learning Architectures Employed
eTable 4. Participant Visits Used for Training, Validation and Testing
eTable 5. Median Number of Macular Images by Treatment Group at Visits Where Fundus Photographs Were to Be Obtained in All Study Participants
eTable 6. Distributions of Error for Baseline and Follow-up Images
eTable 7. Amount of Bias in Predictions, Typical Amount Under-/Over-estimated, Percentage Over-/Under-estimated
eTable 8. Evaluation of Outliers
eTable 9. Primary and Secondary Outcome Measures Removing Identified (Verified) Outliers
eTable 10. MAE by BCVA Subgroup in the Testing Removing Identified (Verified) Outliers
eFigure 1. Concept for Obtaining BCVA or OCT CST From Hand-Held Device That Obtains Image and Determines These Parameters Through AI Deep Learning
eFigure 2. Zooming in On Image at 3 Times or 5 Times
eFigure 3. Density Plots: Photo Only ResNet50
eFigure 4. Density Plots: Photo With Baseline BCVA
eFigure 5. Density Plots: ResNet 50 With Baseline Characteristics
eFigure 6. Density Plots: Baseline Characteristics without Photo
eFigure 7. Bland-Altman Plots to Identify Outliers
eReferences
Trial protocol
Data sharing statement