

Abstract
Our understanding of the molecular mechanisms underlying postsurgical recurrence of non–small cell lung cancer (NSCLC) is rudimentary. Molecular and T cell repertoire intratumor heterogeneity (ITH) have been reported to be associated with postsurgical relapse; however, how ITH at the cellular level impacts survival is largely unknown. Here we report the analysis of 2880 multispectral images representing 14.2% to 27% of tumor areas from 33 patients with stage I NSCLC, including 17 cases (relapsed within 3 years after surgery) and 16 controls (without recurrence ≥5 years after surgery) using multiplex immunofluorescence. Spatial analysis was conducted to quantify the minimum distance between different cell types and immune cell infiltration around malignant cells. Immune ITH was defined as the variance of immune cells from 3 intratumor regions. We found that tumors from patients having relapsed display different immune biology compared with nonrecurrent tumors, with a higher percentage of tumor cells and macrophages expressing PD-L1 (P =.031 and P =.024, respectively), along with an increase in regulatory T cells (Treg) (P =.018), antigen-experienced T cells P =.025), and effector-memory T cells (P =.041). Spatial analysis revealed that a higher level of infiltration of PD-L1+ macrophages (CD68+PD-L1+) or antigen-experienced cytotoxic T cells (CD3+CD8+PD-1+) in the tumor was associated with poor overall survival (P =.021 and P =.006, respectively). A higher degree of Treg ITH was associated with inferior recurrence-free survival regardless of tumor mutational burden (P =.022), neoantigen burden (P =.021), genomic ITH (P =.012) and T cell repertoire ITH (P =.001). Using multiregion multiplex immunofluorescence, we characterized ITH at the immune cell level along with whole exome and T cell repertoire sequencing from the same tumor regions. This approach highlights the role of immunoregulatory and coinhibitory signals as well as their spatial distribution and ITH that define the hallmarks of tumor relapse of stage I NSCLC.
Keywords: immune intratumor heterogeneity, multiplex immunofluorescence, PD-L1, regulatory T cells, spatial cellular analysis, stage I lung cancer
Introduction
Lung cancer remains the leading cause of cancer mortality.1 Although early-stage lung cancers are potentially curable, a significant proportion of patients with early-stage lung cancers will relapse and succumb to this disease. Stage I disease accounts for 15% to 25% of all non–small cell lung cancers (NSCLC),2–5 and the prevalence has been increasing with the implementation of computed tomography (CT)-guided screening.6–8 However, despite complete surgical resection, ~30% of stage I NSCLC will recur.2,3,9 Adjuvant therapy has failed to show a survival benefit in stage I patients with tumors ≤4 cm without other high-risk features; thus, the standard of care remains observation after surgery. There are currently no reliable biomarkers to identify patients who are at high risk of relapse and may benefit from adjuvant therapy, which is largely due to our rudimentary understanding of the molecular mechanisms underlying postsurgical relapse.
Cancers are composed of cells with distinct molecular and phenotypic features within the same tumor, a phenomenon termed intratumor heterogeneity (ITH). Complex molecular ITH has been suggested as a critical feature that is linked to tumor aggressiveness,10 higher risk of relapse,11–13 lack of response to different therapies, and the emergence of drug resistance.10,14 In addition to ITH of cancer cells, ITH can also be present in the tumor microenvironment (TME), particularly in the cancer-immune contexture, which may exert a significant impact on cancer biology and clinical outcome. Indeed, we and others have shown that T cell receptor (TCR) ITH is related to postsurgical recurrence of early-stage lung cancers.15,16 Several pioneering studies have defined the molecular and TCR ITH of early-stage lung cancers and their impact on survival.11–13,15,17 However, the role of immune cell ITH and its impact on clinical outcomes is not fully understood. Furthermore, no previous study has controlled for stage, histology, age, smoking status, treatment, etc, all of which may have a profound impact on immunogenomic features and clinical outcomes. To fill this void, we performed a case-control study focusing on patients with stage I NSCLC with a tumor size ≤4 cm who received upfront surgery with no treatment before or after surgery. The cases (defined as patients who had recurrence within 3 years after surgery) and controls (defined as patients who had a minimum of 5 years of postsurgical follow-up and were alive with no evidence of recurrence) were matched for age, sex, tumor size, smoking status, histology, etc. (Table). We characterized ITH at the phenotypic level, spatial distribution, and association with survival. We found that specific immune cell subsets (PD-1/PD-L1+ T cells, macrophages, and regulatory T cells [Treg]) are highly heterogeneous within these early-stage NSCLC and that their spatial distribution identifies a population at high risk for relapse within stage I NSCLC.
Table 1.
Clinicopathologic information of the patients included in the study
| Characteristics | Nonrecurrence |
Recurrence |
P valuea | |||
|---|---|---|---|---|---|---|
|
n
|
% |
n
|
% |
|||
| 16 | 48% | 17 | 52% | |||
|
| ||||||
| Histology | Adenocarcinoma | 12 | 36% | 11 | 33% | .708 |
| Squamous cell carcinoma | 4 | 12% | 6 | 18% | ||
| Age (y) | Mean | 70 (53–84) | 69 (48–80) | .742b | ||
| Sex | Female | 8 | 24% | 8 | 24% | >.999 |
| Male | 8 | 24% | 9 | 27% | ||
| Race or ethnicity | African American | 1 | 3% | 1 | 3% | .615 |
| Asian | 0 | 0% | 1 | 3% | ||
| White | 15 | 45% | 15 | 45% | ||
| Smoking history | Current | 2 | 6% | 4 | 12% | .616 |
| Former | 12 | 36% | 12 | 36% | ||
| Never | 2 | 6% | 1 | 3% | ||
| Pack/y | Mean | 39 (0–120) | 41 (0–90) | .6244b | ||
| Tumor size (cm) | Mean | 2.43 (1.5–3.5) | 2.65 (1.5–4) | >.999 | ||
| <3 cm | 11 | 33% | 11 | 33% | ||
| ≥3 cm | 5 | 15% | 6 | 18% | ||
| Pleural involvement | No | 10 | 30% | 11 | 33% | >.999 |
| Yes | 6 | 18% | 6 | 18% | ||
| Pathologic stage | IA | 8 | 24% | 8 | 24% | >.999 |
| IB | 8 | 24% | 9 | 27% | ||
| Pathologic T | T1a | 4 | 12% | 3 | 9% | .834 |
| T1b | 5 | 15% | 5 | 15% | ||
| T2a | 7 | 21% | 9 | 27% | ||
| Pathologic N | N0 | 16 | 48% | 17 | 52% | >.999 |
| N1-N3 | 0 | 0% | 0 | 0% | ||
| Resection margin status | R0 | 16 | 48% | 17 | 52% | >.999 |
| R1-R2 | 0 | 0% | 0 | 0% | ||
Fisher exact test.
For continuous variables, the Mann—Whitney test was used.
Materials and Methods
Patient Samples
A total of 33 treatment-naïve patients with stage I NSCLC who underwent surgical resection at The University of Texas MD Anderson Cancer Center were included in this case-control study. Cases (n = 17) were defined as patients diagnosed with stage I NSCLC who had recurrence within 3 years after surgery, with biopsy-proven cancer that had the same cell histology as the previously resected specimen. Controls (n = 16) were defined as patients with at least 5 years of postsurgical follow-up who were alive with no evidence of recurrence. Patient demographic information is presented in the Table. The study was approved by the Institutional Review Board at MD Anderson Cancer Center. Informed consent was obtained from all study participants. An overall overview of the study design, methodology, and analysis strategy is shown in Supplementary Figure S1.
Multiregion Tumor Sampling
Spatially separated regions from the primary tumor were selected from each case. Three intratumoral regions of interest (ROI) of 9 mm2 per tumor were selected following the tissue multiregion sampling or ‘grid’ method, based on the identification of ROIs with coordinates ‘x’ (ordinal number scale) and ‘y’ axes (ordinal alphabet scale), as illustrated in Figure 1A–C. Previous work from our group found that at minimum, an area of 1.65 mm2 is representative of the entire tumor in NSCLC using mIF.18 The selection criteria of intratumoral ROIs were based on the separation of 3 mm between each area; areas with necrosis, fibrosis, or hemorrhage were avoided and/or excluded to maximize the viable tumor cellularity (at least 80% of tumor area per ROI) by hematoxylin and eosin slides and standard light microscopy evaluation. A total of 98 ROIs were obtained, and 2 ROIs were excluded for the limited number of tumor cells available. Ninety-six ROIs (882 mm2) were successfully gridded and scanned. The whole tumor tissue section per slide was scanned at low magnification (×4), and approximately 30 individual fields of view or multispectral images (1 image [.im3] = 0.334 mm2; 1.57 μm/pixel [×20] resolution) per ROI were selected using Phenochart v1.0.4 software A total of 2880 multispectral images were obtained, each image containing 7 images/spectrum, which represents 20,160 images data per panel (8.8–9 cm2 total intratumoral area stained per study) and 40,320 images data per study for immunoprofiling, from the same coordinates for whole exome sequencing (WES) and TCR sequencing sampling. Of note, to avoid underrepresentation of nontumoral tissue that could impact tumor genomic analysis, invasive margin areas were not included.
Figure 1.

Multiregion analysis of early-stage nonesmall cell lung cancer tumors. (A-C) Schema and grid pattern were utilized to dissect tumors and identify regions of interest for further genomic, T cell repertoire, and multiplex immunofluorescent analysis. (D) Representative multiplex immunofluorescence images, cell populations, and markers were utilized in the study.
Multiplex Immunofluorescence
Detailed methodology and validation for the 2 multiplex immunofluorescence (mIF) panels were previously published by our group.19–22 Briefly, automated mIF staining was performed in 4-μm sequential histologic tumor sections obtained from representative formalin-fixed paraffin-embedded tumor blocks using the Opal 7-Color fIHC Kit. The immunofluorescence (IF) markers used were grouped into 2 6-antibody panels: panel 1 consisted of CD3, CD8, PD-1, PD-L1, CD68, and cytokeratin (CK). Panel 2 consisted of CD3, CD8, FOXP3, granzyme B, CD45RO, and CK. Additional information regarding the staining protocol and antibody dilution is available in Supplementary Table S1. After mIF staining, data were extracted to infer cell phenotypes, which was reported using percentages across the 3 intratumor regions (Supplementary Table S2). As expected, a higher correlation was observed between common markers within the 2 panels (rho = 0.92, P <.0001, Supplementary Fig. 2) along with the reproducibility of the immune phenotypes in control tonsil tissues (rho > 0.99, P <.0001, Supplementary Fig. S2A and S3B).
Spatial Analysis and Intratumoral Heterogeneity
Image analysis included the spatial location of cells in a single cell data collection containing information regarding the x- and y-coordinates for identification of each cell phenotype. The spatial analysis of immune cells included proximity by median distance and level of infiltration, as measured by the cross-type distance distribution function (G-function). Proximity was defined as the median distance in micrometer (μm) from malignant cells (MCs, CK+) to T cells (CD3+) or macrophages (CD68+). The cross-type distance distribution function was considered as a surrogate for immune cell infiltration: it computes the nearest-neighbor distribution function for cells in subset A within the radial distance r concerning cells in subset B.23 Individual curves were generated for each region per patient and quantified by the area under the curve for the specific intervals of distances r = 0 to 10 μm, r = 0 to 20 μm, and r = 0 to 40 μm. The resulting values reflect the probability of finding at least 1 immune cell of a specific phenotypic subtype within a specific radius of a malignant cell. For the predictive models, the cell density and distance measures were averaged over the 3 areas to obtain a single predictor value per case.
ITH was defined as the variance of immune cell phenotypes from the 3 ROIs (each 9 mm2). For predominant immune-cell subsets, the inter-ROI variability was quantified by IQR, defined as the difference between the lower and upper quartiles (Q1 and Q3).24 The IQR, therefore, defines boundaries for the middle 50% of the data.
Whole-Exome and T Cell Receptor Sequencing
The detailed methodology was previously published by our group elsewhere.11,15 Briefly, WES was performed on tumor tissues to determine the tumor mutational landscape. Exome capture was performed on 500 ng of genomic DNA per sample based on KAPA library prep using the Agilent SureSelect Human All Exon V4 kit according to the manufacturer’s instructions, and paired-end multiplex sequencing of samples was performed on the Illumina HiSeq 2000 sequencing platform. Preprocessed BAM files were then analyzed to detect single nucleotide variants and small insertions and deletions (indels) using MuTect and Pindel algorithms, respectively, using data from germline DNA controls from the same patients. Immunosequencing of the CDR3 regions of human TCRβ chains was performed using the ImmunoSEQ Assay. Sequences were collapsed and filtered to identify and quantitate the absolute abundance of each unique TCRβ CDR3 region for further analysis.
Statistical Analysis
Statistical analysis was conducted using GraphPad Prism, Matlab 2017a, and R version 3.63, including the spatstat package for spatial analysis. Continuous variables were compared between groups using a 2-sample t test, and categorical variables were compared using Fisher exact test. Correlations between continuous variables (rho) were computed using the Pearson correlation coefficient. Recurrence-free survival (RFS) was defined as the time from surgery to recurrence or death and overall survival (OS) as the time from surgery to death from any cause. Continuous variables were associated with RFS and OS using a log-rank test with the median predictor value used to define the cutoff point between low vs high. For key predictors of interest, multivariate Cox regression was applied to assess the association between the continuous predictor values and survival, adjusting for important clinical covariates (age, tumor size, pack-years smoked, histology, and cell densities). We used analysis of deviance to compare 2 nested Cox models. The P value reflects the reduction in the log partial likelihood for the larger vs smaller model, and a significant P value means that the inclusion of the additional term significantly improved model fit.
Results
Heterogenous T Cell and Macrophage Infiltration in Stage I Non–Small Cell Lung Cancers
A total of 33 patients with resected stage I NSCLC were included, of whom 17 patients relapsed within 36 months after surgery (cases) and 16 were free of relapse for a minimum of 5 years after surgery (controls). Cases and controls were matched for clinicopathologic characteristics, including sex, age, race, smoking history, tumor size, stage, and histology. Overall, 70% of the tumors included were adenocarcinomas, and previous smoking history was reported in 30/33 patients (91%) (Table).
Two mIF panels were used to characterize the TME of these patients. The first was designed to evaluate the expression of PD-1/PD-L1 across T cells (CD3+), cytotoxic T cells (CTLs, CD3+CD8+), macrophages (CD68+), and MCs (CK+). The second mIF panel was design-focused on T cell functional states such as regulatory (FoxP3+), effector (Granzyme B+), and memory (CD45RO+) within the TME (Fig. 1D and Supplementary Fig. S3). Multiplex analysis allowed the direct identification and quantification of 16 cell phenotypes within the TME (Fig. 1D), unveiling the predominance of MCs (CK+) (approximately 32.20%–33.74% of all cells in each ROI) over other phenotypes, followed by the presence of non-cytotoxic T cells (CD3+CD8−) (9.6%–11.19%), CTLs (CD3+CD8+) (3.97%–5.27%) and macrophages (CD68+) (3.45%), with all other immune phenotypes representing a small proportion of the total cell population (less than 3%–4%) (Supplementary Table S2 and Supplementary Fig. S4). We found substantial variability in T lymphocyte (CD3+) (458–2430 cells/mm2, SD = 583.2) and macrophage (CD68+) (175–1375 cells/mm2, SD = 264.2) infiltration across patients, suggesting strong interpatient variability even in a clinically homogeneous stage I NSCLC population (Supplementary Fig. 5A, B). Of note, T lymphocyte (CD3+) and macrophage (CD68+) cell densities were positively correlated (rho = 0.4, P =.021) (Supplementary Fig. 5C).
Coinhibitory (PD-1/PD-L1) and Regulatory (FoxP3) Signals, as well as T Cell/Macrophage Ratio, Characterize Relapsed Stage I Non-Small Cell Lung Cancers
We next sought to investigate whether a certain immune cell contexture is associated with disease recurrence. Of note, recurrent NSCLCs demonstrated a higher proportion of PD-L1-positive MCs (CK+PD-L1+), PD-L1 positive macrophages (CD68+PD-L1+) (P =.031 and P =.024, respectively), and higher percentage of Tregs (CD3+CD8−FoxP3+), antigen-experienced T cells (CD3+PD-1+), and effector-memory T cells (CD3+CD8+Granzyme B+ CD45RO+) compared with their nonrecurrent counterparts (P =.018, P =.025 and, P =.041, respectively) (Fig. 2A, B), suggesting a distinct immune microenvironment, with higher coinhibitory (PD-1/PD-L1) and regulatory (FoxP3) signals in relapsed stage I NSCLC. In contrast, tumor-infiltrating lymphocyte (CD3+) / macrophage (CD68+) ratio (TIL/TAM ratio), which has been reported to play an important role in antitumor immune response,25 was significantly higher in nonrecurrent NSCLCs (P =.014), predominantly driven by an increase in T helper cells (CD3+CD8−FoxP3−) (Fig. 2C and Supplementary Fig. S6A). Furthermore, a higher TIL/TAM ratio (favoring an infiltration by T cells within the TME) was associated with longer RFS (P =.037; Supplementary Fig. S6B).
Figure 2.
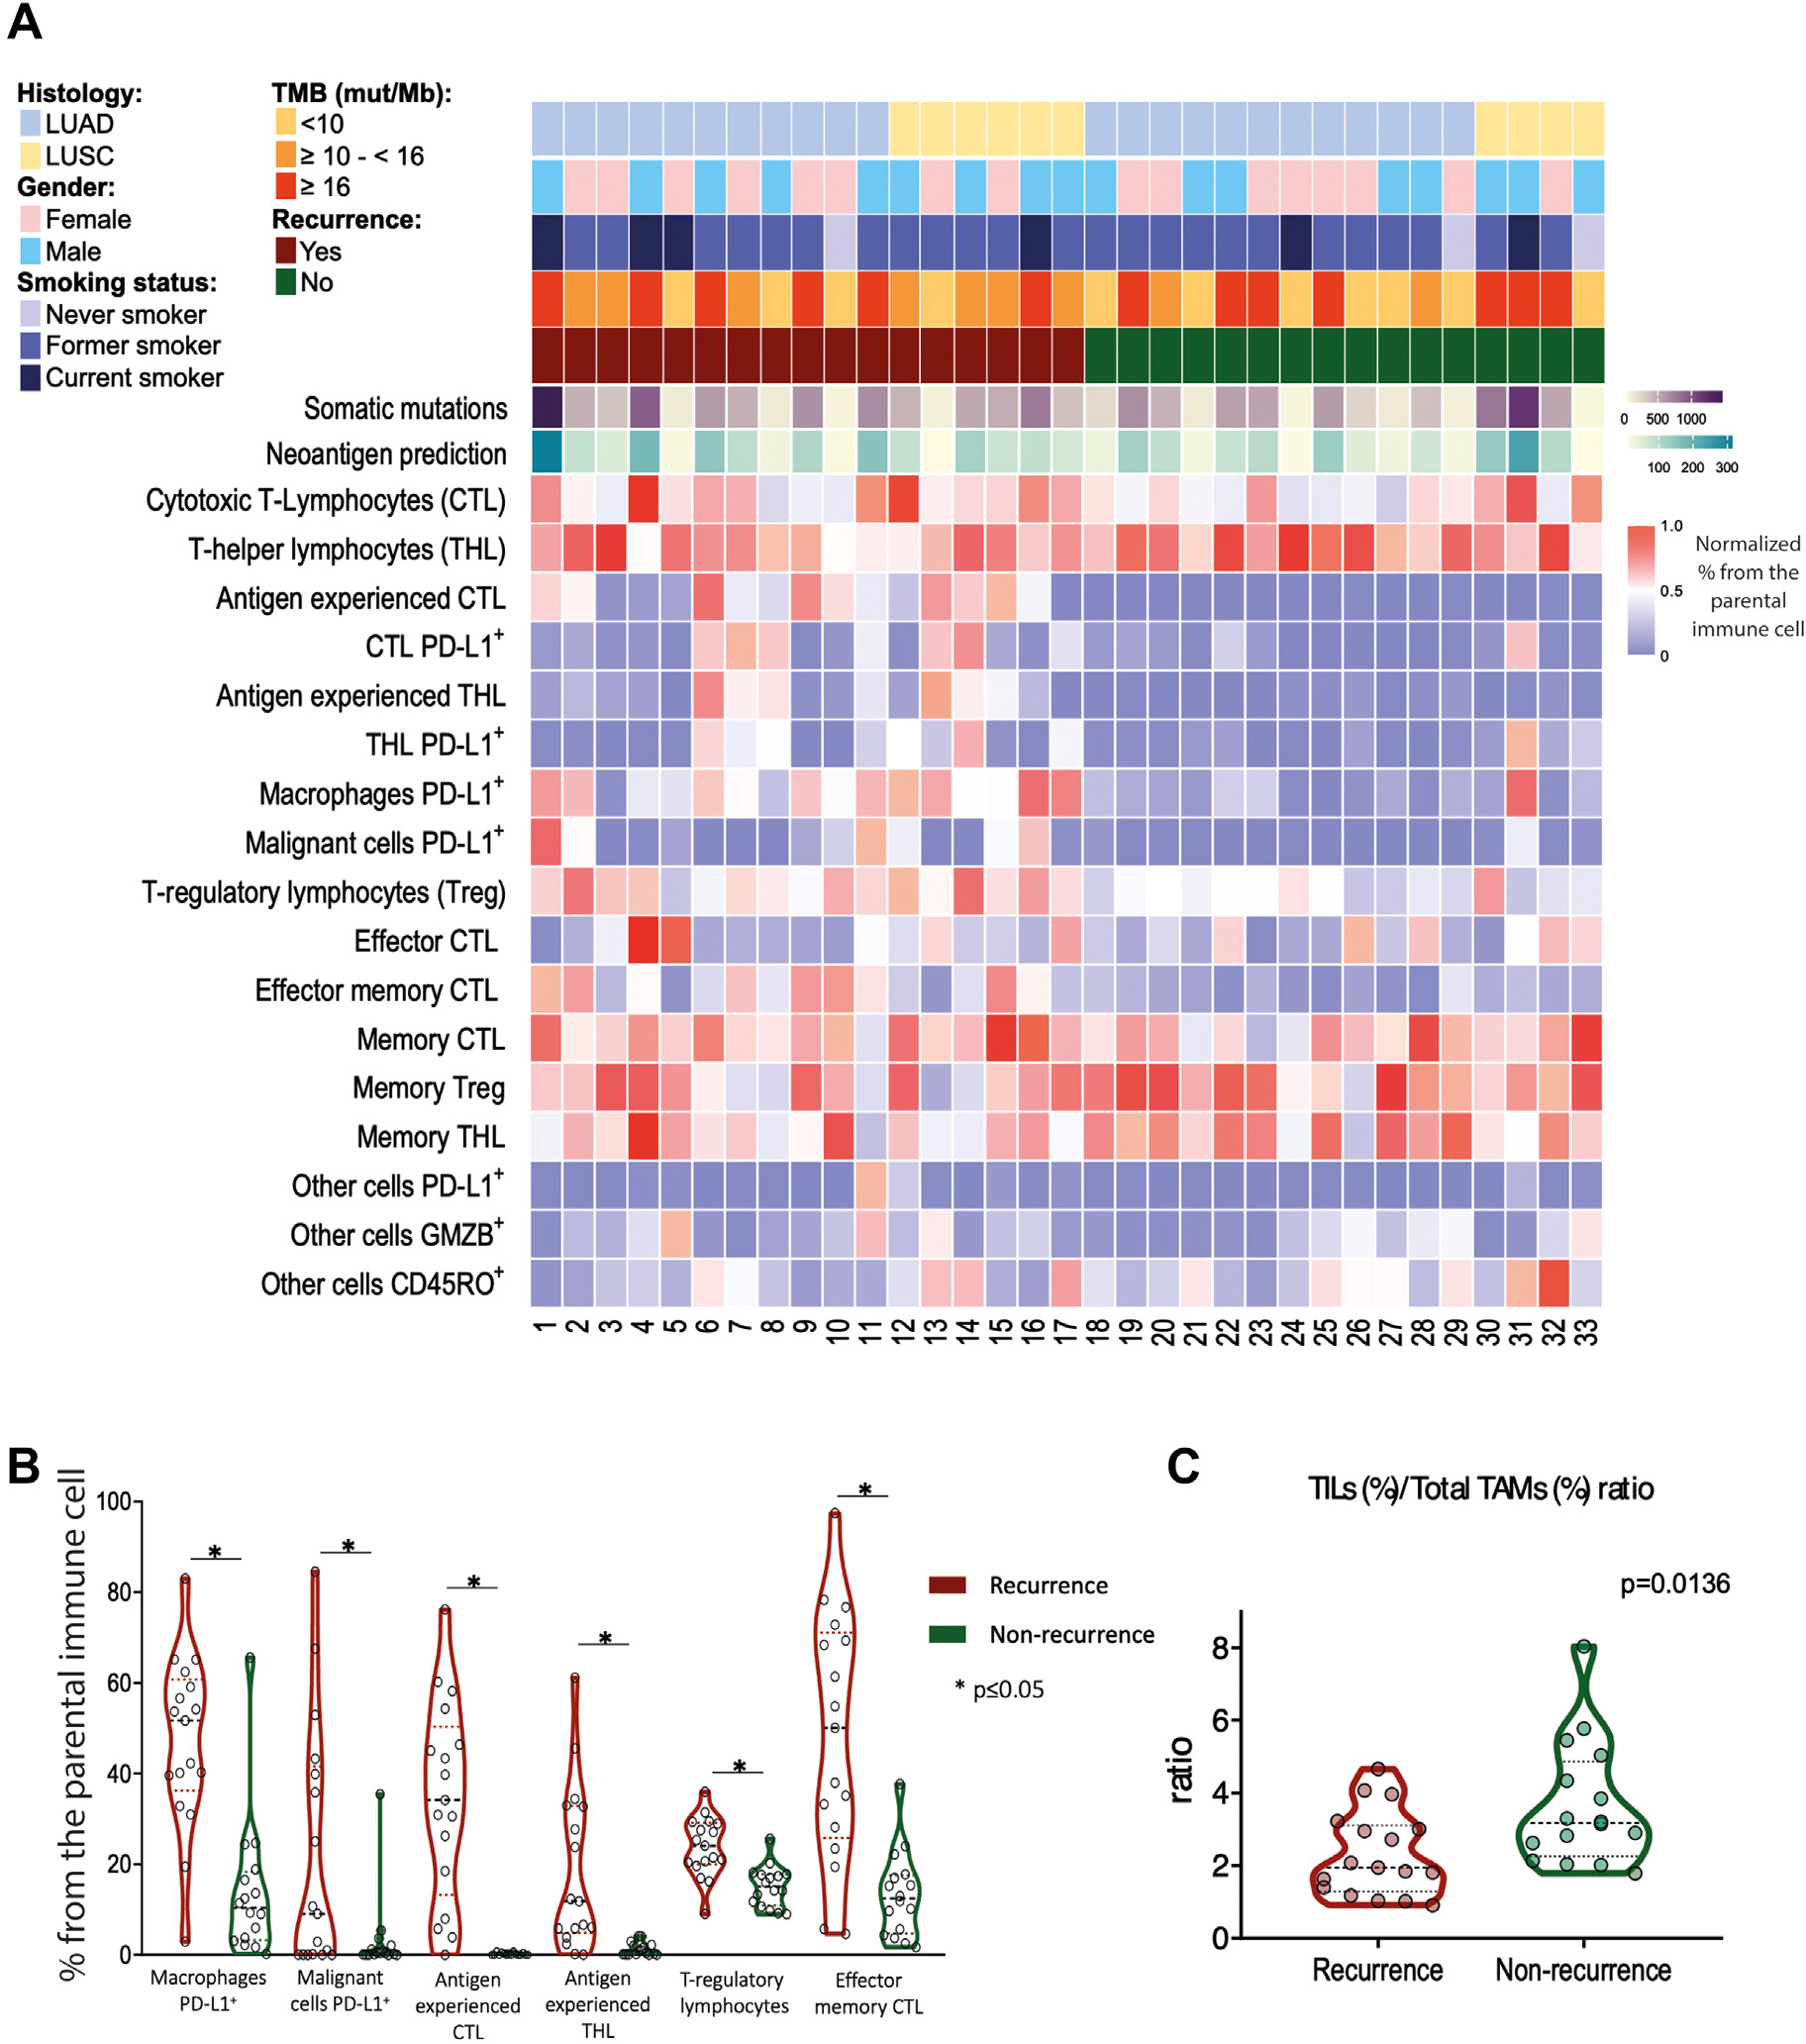
Patients with NSCLC experiencing recurrence exhibit a lower TIL/TAM ratio. (A) Overview of clinicopathologic, genomic, immunofluorescence, and recurrence data in patients with stage I NSCLC. (B) The proportion of immune cell types in patients who recurred (red) versus those who did not (green). (C) TIL (CD3)/TAM (CD68) ratio in patients who recurred versus those who did not. NSCLC, non–small cell lung cancer; TAM, tumor-infiltrating macrophage; TIL, tumor-infiltrating lymphocyte.
Spatial Distribution of PD-1/PD-L1 Immune Cells Predicts Recurrence in Localized Non -Small Cell Lung Cancer
Given the recently recognized importance of distance between different cell subtypes,26,27 we performed spatial analysis between tumor cells and immune cells by nearest-neighbor distance analysis, measuring the distance of immune cells to the nearest tumor cell, and cross G-function analysis to estimate immune cell infiltration within a certain radius of tumor cells (Fig. 3A). Nearest-neighbor distance analysis showed that CTLs expressing PD-1 (CD3+CD8+PD-1+) and PD-L1-positive macrophages (CD68+PD-L1+) were in closer proximity to MCs (CK+) in recurrent NSCLCs (Fig. 3A). Furthermore, a shorter distance (<36 μm) between cancer cells and PD-L1-positive macrophages (CD68+PD-L1+) was associated with shorter RFS and OS, and the difference remained significant in a multivariate analysis adjusting for age, sex, histology, tumor size, and smoking history (P =.002 for RFS and P =.003 for OS, respectively; Supplementary Fig. S7).
Figure 3.

Spatial analysis of immune and tumor cells predicts recurrence in patients with NSCLC. (A) Overview of spatial distances between malignant and immune cells in resected NSCLC tumors by nearest-neighbor analysis and area under the curve in patients who recurred versus those who did not. (B) Schematic of radii used for the analysis of spatial distribution between PD-L1+ TAMs and MCs. (C) The area under the curve when comparing PD-L1 TAMs and MCs at different radii in patients who recurred and those who did not. (D) Recurrence-free and overall survival in patients with a high and low grade of PD-L1+ TAMs infiltration. (E) Schematic of radii used for the analysis of spatial distribution between PD-1+ CTLs and MCs. (F) The area under the curve when comparing PD-1 CTLs and MCs at different radii in patients who recurred and those who did not. (G) Recurrence-free and overall survival in patients with a high and low grade of PD-1+ CTLs infiltration. (H-J) Representative images showing the spatial distribution of immune and tumor cells by multiplex immunofluorescence. CTL, cytotoxic T cell; NSCLC, non–small cell lung cancer; TAM, tumor-infiltrating macrophage.
Using the cross-type distance distribution function, we interrogated the grade of infiltration within a radius of 10, 20, and 40 μm from these tumor cells. Consistent with the nearest-neighbor analysis, relapsed tumors showed a higher-grade infiltration of PD-L1-positive macrophages (CD68+PD-L1+) (Fig. 3B, C) and PD-1-positive CTLs (CD3+CD8+PD-1+) (Fig. 3E, F), as illustrated in Figure 3H–J. The median area under the curve for a radius of 20 μm (physiologically plausible distance for direct cell-cell interactions) was applied to stratify our cohort into low and high levels of infiltration. Patients with higher infiltration by PD-L1-positive macrophages (CD68+PD-L1+) or antigen-experienced CTLs (CD3+CD8+PD-1+) had significantly shorter RFS and OS (PD-L1-positive macrophages with RFS: P =.0028, PD-L1-positive macrophages with OS: P =.021, antigen-experienced CTLs with RFS: P <.01 and OS P <.01). All P values underwent multivariate adjustment for age, sex, histology, tumor size, pack-years, and cell density (CD68+PD-L1+ and CD3+CD8+PD-1+), and representative images are displayed in Figure 3D, G. Of note, we observed a high correlation between cell density and grade of infiltration (r Pearson = 0.9 and 0.89 for CD68+PD-L1+ and CD3+CD8+PD-1+, respectively). Using analysis of deviance, we confirmed that spatial information for the corresponding cell phenotypes did improve model fit by comparing the model including cell densities, which resulted in significant P values (for RFS: P =.0004 and P =.0001, and for OS: P =.0004, and P =.02, respectively).
Regulatory T Cell Intratumor Heterogeneity Is Associated With a Higher Risk of Relapse
Interestingly, we observed different distribution patterns of Tregs (CD3+CD8−FoxP3+) within nonrecurrent versus recurrent tumors (Fig. 4A), whereas recurrent tumors tended to have Tregs clustering together and nonrecurrent tumors displayed a more diffuse pattern (Fig. 4B). We interrogated 3 spatially separated tumor regions (ROIs) within each tumor to determine the complexity of Treg ITH. Using IQR, a method that can be applied to the proportion of each cell immune subtype, we observed a significantly higher proportion (P <.0001) as well as a higher degree of ITH (IQR = 9.0 vs 3.4; P <.0001; Fig. 4C, D) of Treg (CD3+CD8−FoxP3+) in recurrent versus nonrecurrent tumors. Furthermore, increased Treg ITH (CD3+CD8−FoxP3+) was associated with significantly inferior RFS in multivariate analysis adjusting for age, tumor size, smoking history, histology, and Treg (CD3+CD8−FoxP3+) density (P =.0013; Fig. 4E). Finally, analysis of deviance showed that the inclusion of Treg ITH significantly improved fit compared with the model including the density variable and previous clinical covariates (P =.01).
Figure 4.

Treg intratumor heterogeneity (ITH) is associated with shorter recurrence-free survival (RFS) in patients with stage I NSCLC. (A) Immunofluorescence images in 3 patients exhibiting different immune cell infiltration patterns associated with high, intermedium, and low Treg ITH (from left to right). (B) Schematic representation of Treg cell distribution patterns. (C) Cell density of TILs, TAMs and malignant and other cells in each NSCLC tumor. (D) Proportion (red bars – bottom P value) and intratumor heterogeneity (blue bars – top P value) of Tregs in patients with stage I NSCLC. (E) RFS in patients with high versus low Treg ITH. (F-I) RFS in patients with high versus low somatic mutations (F), neoantigen burden (G), trunk/branch ratio (H), and TCR repertoire ITH (I) combined with Treg ITH in patients with stage I NSCLC. NSCLC, non–small cell lung cancer; TAM, tumor-infiltrating macrophage; TCR, T cell repertoire; TIL, tumor-infiltrating lymphocyte.
In this homogenous stage I NSCLC cohort, tumor mutation burden, predicted neoantigen burden, genomic ITH (using percent trunk mutation as a surrogate), or TCR ITH (quantified using Morisita Index) did not correlate with RFS (Supplementary Fig. S8). Interestingly, high Treg ITH (CD3+CD8−FoxP3+) was strongly associated with poor RFS regardless of tumor mutational burden (P =.001), neoantigen burden (P =.002), mutational trunk/branch ratio (P =.005), and TCR ITH (P =.001) after a multivariate analysis adjusting for age, sex, smoking history, histology, and tumor size (Fig. 4F–I).
Discussion
Advances in the treatment of NSCLCs in recent years have mainly focused on advanced stages, leading to a clear need to translate these improvements to early stages where tumor relapse and cancer-related death still account for a substantial proportion of lung cancer death.9 More recently, adjuvant28 and neoadjuvant immune checkpoint inhibitors with or without chemotherapy29,30 have changed the standard of care for early-stage NSCLC. However, the success of these approaches will depend on our ability to better select the patients who would benefit the most from these treatments. This is particularly relevant for stage I NSCLC, where no adjuvant or neoadjuvant treatment has been proven beneficial in addition to surgery, even though 30% of patients relapse.
The molecular mechanisms underlying postsurgical relapse are not understood. As most patients with stage I lung cancer, particularly those with tumors <4 cm, do not receive adjuvant chemotherapy or radiation therapy, the host immune system is solely responsible for eradicating micrometastases that account for postsurgical relapse.31 Previous studies have demonstrated the potential implications of TILs and other markers such as PD-1 and PD-L1 on the survival of localized NSCLC.32–35 Specifically, in stage I NSCLC, an increase in CD3+ and CD8+ T cells was reported to correlate with better OS and RFS, whereas no association of FoxP3+ cells with survival was observed.36,37 However, most of these studies used immunohistochemistry to assess different immune markers, which offer a limited capability to colocalize multiple markers. Our study showed the feasibility of mIF for the identification and quantification of 16 cell phenotypes, allowing us to address the complex and distinct biological features between recurrent and nonrecurrent tumors at an immune cell level. We demonstrated that in stage I NSCLC, particular immune cell phenotypes (PD-1/PD-L1 T cells and macrophages and Treg [CD3+CD8−FoxP3+]) were associated with an increased risk of tumor relapse, highlighting the relevance of classifying immune cell subsets within the TME.
We also observed that the spatial distribution of these immune cells follows different patterns that correlate with distinct clinical outcomes. Spatial analysis revealed that closer proximity of PD-L1-positive macrophages (CD68+PD-L1+) and antigen-experienced CTLs (CD3+CD8+PD-1+) to tumor cells define a specific and distinct pattern between recurrent and nonrecurrent tumors. Our results suggest that tumor cells promote the expression of inhibitory signals on immune cells that mitigate the host immune response against tumor cells. In this regard, previous reports in classical Hodgkin lymphoma showed similar findings, suggesting that the expression of PD-L1 in macrophages can block T cells and protect the tumor cells from the cytotoxic effects of lymphocytes.38,39 In this scenario, one possible explanation is that the local cytokine microenvironment induces PD-L1 expression on TAMs, which will mitigate the action of CTLs protecting tumor cells from the host antitumor immune response, creating a barrier by the TAMs expressing PD-L1 between the tumor cells and CTLs. This particular feature of the TME generates a perfect niche for tumor cells to evolve. These observations suggest that the interaction of PD-1 and PD-L1 is a hallmark that enables tumor cells to evade antitumor immunity and confers a higher risk for relapse. Taken together, it is reasonable to hypothesize that patients with stage I lung cancer exhibiting these features associated with a high risk of postsurgical relapse should be considered for additional therapy with the aim of reverting these coinhibitory signals within the TME.
ITH is a fundamental feature of cancer biology with potential clinical impact. We and others previously demonstrated that higher levels of genomic as well as TCR repertoire ITH correlated with increased risks of postsurgical survival in patients with localized NSCLC.11,12,15,40 However, one obvious caveat of all previous studies was that NSCLCs of stages I to III (with different tumor sizes, lymph node staging, different surgical approaches as well as adjuvant treatments) were included. Given the profoundly heterogeneous nature of NSCLCs, any difference in one or more of these important prognostic factors could confound the associations with survival. In the present study, we specifically focused on a homogeneous patient population: patients with stage I NSCLC with a tumor size of ≤4 cm who had lobectomy with R0 margins and lymph node dissection and no adjuvant chemotherapy. Furthermore, mIF allowed us to assess ITH at an immune phenotype level. The comprehensive evaluation of different regions within each tumor offers a unique opportunity to study the immune ITH. We observed that an increase of Treg (CD3+CD8−FoxP3+) ITH characterized the immunobiology of tumors at a high risk of relapse, suggesting that these specific immune cell populations could perform a pertinent role analogous to autoimmune tolerance under physiological conditions and immunosuppression in the TME.41,42 Interestingly, our results demonstrated that in stage I NSCLC, even when stratified by tumor mutational burden, neoantigen burden, mutational trunk/branch ratio, and TCR ITH, Treg (CD3+CD8−FoxP3+) ITH remained a risk factor for tumor relapse, highlighting the relevance of ITH at the cellular level.
To the best of our knowledge, our work provides the first evidence of ITH at the immune cell level using a multiregional approach focusing on a homogeneous stage I NSCLC cohort. We have demonstrated the role of immunoregulatory and coinhibitory signals along with their spatial distribution and ITH as the hallmarks of tumor relapse in stage I NSCLC. However, our study has several important technical and scientific limitations. First, the strict case-control design on patients with stage I NSCLC leading to the small sample size limited our ability to appropriately investigate the differences between relevant clinicopathologic features previously reported, such as the predominance of specific immune cells within different NSCLC histology,32,43 sex,35 and previously described features of genomic and TCR ITH.11,15 On the other hand, the rigorous inclusion criteria allowed us to interrogate a homogeneous population, removing potential confounding factors such as stage, tumor size, age, smoking history, sex, and adjuvant therapies, which could impact the immune contexture of TME and postsurgical RFS. As the main goal of our study was to characterize the immune ITH at the immune cell level and integrate this unexplored metric with genomic and TCR heterogeneity, we performed WES, TCR sequencing, and mIF in consecutive sections from the same tumor regions. To minimize possible variations regarding the tissue sampling across consecutive tissue sections, we only included intratumor regions but not the immune contexture in tumor margins, which could provide additional information regarding host antitumor immune response.44 Second, although our mIF panels were able to assess more than 16 immune cell subtypes, wavelength overlap from different fluorescence markers limited us from assessing many other immune cell phenotypes that could play important roles in the modulation of the TME and patient outcomes, such as B cells and NK cells. Future studies applying more advanced technologies that combine larger numbers of markers with higher resolutions (ie, imaging mass cytometry45) are warranted to assess immune cells at a more granular level to further our understanding of the impact of immune repertoire and its ITH on cancer biology and clinical outcomes.
Supplementary Material
Funding
This study was supported by the MD Anderson Lung Cancer Moon Shot Program, the Cancer Prevention and Research Institute of Texas Multi-Investigator Research Award grant (RP160668), the National Cancer Institute of the National Institute of Health Research Project Grant (R01CA234629-01), the UT Lung Specialized Programs of Research Excellence Grant (P50CA70907), the MD Anderson Cancer Center Support Grant (CA016672), and the National Cancer Institute (NCI) Cooperative Agreement U24CA224285 (to The University of Texas MD Anderson Cancer Center CIMAC). P.R. was supported by Sociedad Española de Oncología Médica and European Society for Medical Oncology. S.N.K., S.B., and A.R. were supported by NCI R37CA214955-01A1, a gift from Agilent technologies, institutional startup funds from the University of Michigan, and a Research Scholar Grant from the American Cancer Society (RSG-16-005-01).
Abbreviations:
- MCs
Malignant cells
- PD-L1
Programmed death ligand-1
- mIF
Multiplex immunofluorescence
- PD-1
Programmed eath 1d
- NSCLC
Non-small cell lung cancer
- ITH
Intratumor heterogeneity
- CT
Computed tomography
- TCR
T cell receptor
- Treg
Regulatory T cells
- WES
Whole exome sequencing
- TMB
Tumor mutational burden
- ROI
Regions of interest
- CK
Cytokeratin
- CTLs
Cytotoxic T cells
- TIL
Tumor-infiltrating lymphocyte
- TAM
Tumor-infiltrating macrophage
Footnotes
Declaration of Competing Interest
Dr Wistuba reports personal fees from Genentech/Roche, Bristol-Myers Squibb, Medscape, Astra Zeneca/Medimmune, Pfizer, Ariad, HTG Molecular, Asuragen, Merck, GlaxoSmithKline, MSD, and grants from Genentech, Oncoplex, HTG Molecular, DepArray, Merck, Bristol-Myers Squibb, Medimmune, Adaptive, Adaptimmune, EMD Serono, Pfizer, Takeda, Amgen, Karus, Johnson & Johnson, Bayer, 4D, Novartis, and Perkin-Elmer (Akoya) outside the submitted work. Dr Zhang reports personal fees from BMS, AstraZeneca, Geneplus, OrigMed, Innovent, a grant from Merck, outside the submitted work. Dr Kadara reports research funding from Johnson and Johnson outside the scope of the work. Dr Rao serves as a member of Voxel Analytics, LCC. Dr Reuben serves on the scientific advisory board and has received honoraria from Adaptive Biotechnologies. The remaining authors declare no competing interests.
Ethics Approval and Consent to Participate
The study was approved by the Institutional Review Board at MD Anderson Cancer Center. Informed consent was obtained from all study participants.
Supplementary Material
The online version contains supplementary material available at https://doi.org/10.1016/j.modpat.2022.100028.
Data Availability
The datasets used and analyzed during the current study are available from the corresponding author upon reasonable request.
References
- 1.Siegel RL, Miller KD, Fuchs HE, Jemal A. Cancer statistics, 2022. CA Cancer J Clin. 2022;72(1):7–33. [DOI] [PubMed] [Google Scholar]
- 2.Fry WA, Menck HR, Winchester DP. The National Cancer Data Base report on lung cancer. Cancer. 1996;77(9):1947–1955. [DOI] [PubMed] [Google Scholar]
- 3.Mountain CF. The international system for staging lung cancer. Semin Surg Oncol. 2000;18(2):106–115. [DOI] [PubMed] [Google Scholar]
- 4.Cancer Research UK. Lung cancer incidence statistics. Cancer Research UK; 2020. [Google Scholar]
- 5.National Cancer Institute. SEER Cancer Stat Facts: Lung and Bronchus Cancer. National Cancer Institute; 2020. [Google Scholar]
- 6.Bülzebruck H, Bopp R, Drings P, et al. New aspects in the staging of lung cancer. Prospective validation of the International Union Against Cancer TNM classification. Cancer. 1992;70(5):1102–1110. [DOI] [PubMed] [Google Scholar]
- 7.Mahadevia PJ, Fleisher LA, Frick KD, Eng J, Goodman SN, Powe NR. Lung cancer screening with helical computed tomography in older adult smokers: a decision and cost-effectiveness analysis. JAMA. 2003;289(3):313–322. [DOI] [PubMed] [Google Scholar]
- 8.National Lung Screening Trial Research Team, Church TR, Black WC, et al. Results of initial low-dose computed tomographic screening for lung cancer. N Engl J Med. 2013;368(21):1980–1991. [DOI] [PMC free article] [PubMed] [Google Scholar]
- 9.Goldstraw P, Chansky K, Crowley J, et al. The IASLC Lung Cancer Staging Project: Proposals for revision of the TNM stage groupings in the forthcoming (eighth) edition of the TNM classification for lung cancer. J Thorac Oncol. 2016;11(1):39–51. [DOI] [PubMed] [Google Scholar]
- 10.Stewart CA, Gay CM, Xi Y, et al. Single-cell analyses reveal increased intratumoral heterogeneity after the onset of therapy resistance in small-cell lung cancer. Nat Cancer. 2020;1(4):423–436. [DOI] [PMC free article] [PubMed] [Google Scholar]
- 11.Zhang J, Fujimoto J, Zhang J, et al. Intratumor heterogeneity in localized lung adenocarcinomas delineated by multiregion sequencing. Science. 2014;346(6206):256–259. [DOI] [PMC free article] [PubMed] [Google Scholar]
- 12.Jamal-Hanjani M, Wilson GA, McGranahan N, al let. Tracking the evolution of non-small-cell lung cancer. N Engl J Med. 2017;376(22):2109–2121. [DOI] [PubMed] [Google Scholar]
- 13.Quek K, Li J, Estecio M, et al. DNA methylation intratumor heterogeneity in localized lung adenocarcinomas. Oncotarget. 2017;8(13):21994. [DOI] [PMC free article] [PubMed] [Google Scholar]
- 14.McGranahan N, Furness AJS, Rosenthal R, et al. Clonal neoantigens elicit T cell immunoreactivity and sensitivity to immune checkpoint blockade. Science. 2016;351(6280):1463–1469. [DOI] [PMC free article] [PubMed] [Google Scholar]
- 15.Reuben A, Gittelman R, Gao J, et al. TCR repertoire intratumor heterogeneity in localized lung adenocarcinomas: an association with predicted neoantigen heterogeneity and postsurgical recurrence. Cancer Discov. 2017;7(10): 1088–1097. [DOI] [PMC free article] [PubMed] [Google Scholar]
- 16.Joshi K, de Massy MR, Ismail M, et al. Spatial heterogeneity of the T cell receptor repertoire reflects the mutational landscape in lung cancer. Nat Med. 2019;25(10):1549–1559. [DOI] [PMC free article] [PubMed] [Google Scholar]
- 17.Lee W-C, Diao L, Wang J, et al. Multiregion gene expression profiling reveals heterogeneity in molecular subtypes and immunotherapy response signatures in lung cancer. Mod Pathol. 2018;31(6):947–955. [DOI] [PubMed] [Google Scholar]
- 18.Sun B, Laberiano-Fernández C, Salazar-Alejo R, et al. Impact of region-of-interest size on immune profiling using multiplex immunofluorescence tyramide signal amplification for paraffin-embedded tumor tissues. Pathobiology. 2022:1–12. [DOI] [PMC free article] [PubMed] [Google Scholar]
- 19.Parra ER, Uraoka N, Jiang M, et al. Validation of multiplex immunofluorescence panels using multispectral microscopy for immune-profiling of formalin-fixed and paraffin-embedded human tumor tissues. Sci Rep. 2017;7(1):13380. [DOI] [PMC free article] [PubMed] [Google Scholar]
- 20.Parra ER, Jiang M, Solis L, et al. Procedural requirements and recommendations for multiplex immunofluorescence tyramide signal amplification assays to support translational oncology studies. Cancers. 2020;12(2). [DOI] [PMC free article] [PubMed] [Google Scholar]
- 21.Parra ER, Ferrufino-Schmidt MC, Tamegnon A, et al. Immuno-profiling and cellular spatial analysis using five immune oncology multiplex immunofluorescence panels for paraffin tumor tissue. Sci Rep. 2021;11(1):8511. http://www.nature.com/articles/s41598-021-88156-0 [DOI] [PMC free article] [PubMed] [Google Scholar]
- 22.Taube JM, Roman K, Engle EL, et al. Multi-institutional TSA-amplified multiplexed immunofluorescence reproducibility evaluation (MITRE) study. J Immunother Cancer. 2021;9(7):e002197. [DOI] [PMC free article] [PubMed] [Google Scholar]
- 23.Barua S, Fang P, Sharma A, et al. Spatial interaction of tumor cells and regulatory T cells correlates with survival in non-small cell lung cancer. Lung Cancer. 2018;117:73–79. [DOI] [PMC free article] [PubMed] [Google Scholar]
- 24.Wu F, Fan J, He Y, et al. Single-cell profiling of tumor heterogeneity and the microenvironment in advanced non-small cell lung cancer. Nat Commun. 2021;12(1):2540. [DOI] [PMC free article] [PubMed] [Google Scholar]
- 25.Zhu Y, Li M, Bo C, et al. Prognostic significance of the lymphocyte-to-monocyte ratio and the tumor-infiltrating lymphocyte to tumor-associated macrophage ratio in patients with stage T3N0M0 esophageal squamous cell carcinoma. Cancer Immunol Immunother. 2017;66(3):343–354. [DOI] [PMC free article] [PubMed] [Google Scholar]
- 26.Chen P-L, Roh W, Reuben A, et al. Analysis of immune signatures in longitudinal tumor samples yields insight into biomarkers of response and mechanisms of resistance to immune checkpoint blockade. Cancer Discov. 2016;6(8):827–837. [DOI] [PMC free article] [PubMed] [Google Scholar]
- 27.Carstens JL, Correa de Sampaio P, Yang D, et al. Spatial computation of intratumoral T cells correlates with survival of patients with pancreatic cancer. Nat Commun. 2017;8:15095. [DOI] [PMC free article] [PubMed] [Google Scholar]
- 28.Felip E, Altorki N, Zhou C, et al. Adjuvant atezolizumab after adjuvant chemotherapy in resected stage IB-IIIA non-small-cell lung cancer (IMpower010): a randomised, multicentre, open-label, phase 3 trial. Lancet. 2021;398(10308):1344–1357. [DOI] [PubMed] [Google Scholar]
- 29.Forde PM, Chaft JE, Smith KN, et al. Neoadjuvant PD-1 blockade in resectable lung cancer. N Engl J Med. 2018;378(21):1976–1986. [DOI] [PMC free article] [PubMed] [Google Scholar]
- 30.Forde PM, Spicer J, Lu S, et al. Neoadjuvant nivolumab plus chemotherapy in resectable lung cancer. N Engl J Med. 2022;386(21):1973–1985. [DOI] [PMC free article] [PubMed] [Google Scholar]
- 31.Tian Y, Lai Q, Zheng Y, et al. Oncogenic alterations in histologically negative lymph nodes are associated with prognosis of patients with stage I lung adenocarcinoma. Cancers. 2022;14(3):824. [DOI] [PMC free article] [PubMed] [Google Scholar]
- 32.Kinoshita T, Muramatsu R, Fujita T, et al. Prognostic value of tumor-infiltrating lymphocytes differs depending on histological type and smoking habit in completely resected non-small-cell lung cancer. Ann Oncol. 2016;27(11):2117e2123. [DOI] [PubMed] [Google Scholar]
- 33.Ganesan A-P, Clarke J, Wood O, et al. Tissue-resident memory features are linked to the magnitude of cytotoxic T cell responses in human lung cancer. Nat Immunol. 2017;18(8):940–950. [DOI] [PMC free article] [PubMed] [Google Scholar]
- 34.Mazzaschi G, Madeddu D, Falco A, et al. Low PD-1 expression in cytotoxic CD8+ tumor-infiltrating lymphocytes confers an immune-privileged tissue microenvironment in NSCLC with a prognostic and predictive value. Clin Cancer Res. 2018;24(2):407–419. [DOI] [PubMed] [Google Scholar]
- 35.Behrens C, Rocha P, Parra ER, et al. Female gender predicts augmented immune infiltration in lung adenocarcinoma. Clin Lung Cancer. 2020;22(3):e415–e424. [DOI] [PubMed] [Google Scholar]
- 36.Petersen RP, Campa MJ, Sperlazza J, et al. Tumor infiltrating Foxp3+ regulatory T-cells are associated with recurrence in pathologic stage I NSCLC patients. Cancer. 2006;107(12):2866–2872. [DOI] [PubMed] [Google Scholar]
- 37.Schulze AB, Evers G, Görlich D, et al. Tumor infiltrating T cells influence prognosis in stage I-III non-small cell lung cancer. J Thorac Dis. 2020;12(5): 1824–1842. [DOI] [PMC free article] [PubMed] [Google Scholar]
- 38.Carey CD, Gusenleitner D, Lipschitz M, et al. Topological analysis reveals a PD-L1-associated microenvironmental niche for Reed-Sternberg cells in Hodgkin lymphoma. Blood. 2017;130(22):2420–2430. [DOI] [PMC free article] [PubMed] [Google Scholar]
- 39.Patel SS, Weirather JL, Lipschitz M, et al. The microenvironmental niche in classic Hodgkin lymphoma is enriched for CTLA-4-positive T cells that are PD-1-negative. Blood. 2019;134(23):2059–2069. [DOI] [PMC free article] [PubMed] [Google Scholar]
- 40.Reuben A, Zhang J, Chiou S-H, et al. Comprehensive T cell repertoire characterization of non-small cell lung cancer. Nat Commun. 2020;11(1):603. [DOI] [PMC free article] [PubMed] [Google Scholar]
- 41.Jiang Y, Li Y, Zhu B. T-cell exhaustion in the tumor microenvironment. Cell Death Dis. 2015;6:e1792. [DOI] [PMC free article] [PubMed] [Google Scholar]
- 42.Lu L, Barbi J, Pan F. The regulation of immune tolerance by FOXP3. Nat Rev Immunol. 2017;17(11):703–717. [DOI] [PMC free article] [PubMed] [Google Scholar]
- 43.Parra ER, Behrens C, Rodriguez-Canales J, et al. Image analysis-based assessment of PD-L1 and tumor-associated immune cells density supports distinct intratumoral microenvironment groups in non-small cell lung carcinoma patients. Clin Cancer Res. 2016;22(24):6278–6289. [DOI] [PMC free article] [PubMed] [Google Scholar]
- 44.Rocha P, Zhang J, Laza-Briviesca R, et al. Distinct immune gene programs associated with host tumor immunity, neoadjuvant chemotherapy and chemoimmunotherapy in resectable NSCLC. Clin Cancer Res. 2022;28(11): 2461–2473. [DOI] [PMC free article] [PubMed] [Google Scholar]
- 45.Keren L, Bosse M, Thompson S, et al. MIBI-TOF: A multiplexed imaging platform relates cellular phenotypes and tissue structure. Sci Adv. 2019;5(10):eaax5851. [DOI] [PMC free article] [PubMed] [Google Scholar]
Associated Data
This section collects any data citations, data availability statements, or supplementary materials included in this article.
Supplementary Materials
Data Availability Statement
The datasets used and analyzed during the current study are available from the corresponding author upon reasonable request.