

Abstract

Solid-state magic angle spinning 31P NMR spectroscopy is used to identify and quantify phosphorus-containing species in pet foods. The measurement is challenging due to the long spin–lattice relaxation times (T1s). Data acquisition times are shortened by acquiring data with a tip angle smaller than 90° and shortening the repetition time. However, the spin–lattice relaxation times (T1s) of the different 31P compounds are quite different, necessitating a separate measurement for each compound in the pet food. Knowledge of T1 is used to calculate the relative amount of 31P in the samples. Samples of known concentration are also measured, enabling the quantitative measurement of total phosphorus content.
Keywords: 31P NMR spectroscopy, phosphorus-containing species, pet food, impurities
1. Introduction
Phosphorus is an essential nutrient and is ubiquitous in foods as a naturally occurring element in the molecular formula of various chemical components of food ingredients.1−5 Phosphorus is also a common food additive, and phosphorus-containing compounds are used in foods to enhance flavor, thicken mixtures, control texture, and act as a preservative.6,7
Combined with other elements like calcium, phosphorus supports and maintains healthy bones in animals. It also acts as a catalyst for various bodily functions. On the other hand, excess consumption of some forms of phosphorus can have adverse effects on health. For example, excessive dietary phosphorus can lead to hyperphosphatemia, which can have an adverse impact on kidney function.6 Thus, there is a safe range for the phosphorus content of food within which health is supported and promoted.
Pet food is regulated animal feed,8,9 and most pet foods are complete and balanced, which means each portion must meet the complete nutritional requirements of the animal consumer. Complete and balanced nutrition encompasses macro- and micronutrients, including phosphorus, which plays a key role in maintaining the systemic health of pets.
Whether derived from raw materials or added as a functional ingredient, phosphorus in pet food must be balanced and within the regulated range; however, not all forms of phosphorus are equal. Phosphorus derived from animal and plant-based food ingredients such as hydroxyapatite in bones and phytate in plants may be less bioavailable than some soluble phosphorus-containing salts, which have been shown to acutely affect calcium and bone metabolism in humans1,2 and cause dose-dependent increases in postprandial serum phosphate in feline and canine models.3−5
A recent study demonstrated that soluble P in foods, determined using an in vitro digestion assay and modified to take into account gastric and small intestine conditions in felines, was able to estimate in vivo P digestibility for wet-format, commercially formulated feline diets.10 However, Ca/P ratios in diets and other factors, such as the solubility of different P-containing compounds, were found to impact the strength of the association between the in vitro and in vivo data.10 Inductively-coupled plasma atomic emission and optical emission techniques have been developed using sample ashing preparation followed by acid reconstitution and analysis to yield total phosphorus content.11,12 Ion chromatographic methods speciate some low molecular weight n-mers and can be coupled to an electron light scattering detector or ICP–MS. Organic phosphorus compounds, like ADP and ATP, can be analyzed by HPLC and an electrochemical detector.13 These methods are limited in their ability to differentiate between phosphorus species. Although it is important to be able to determine the total phosphorus concentration in foods, an analytical determination of the proportion of different forms of phosphorus in foods would be much more valuable for predicting health benefits and food safety. The challenge is to identify different forms of phosphorus in a food. Those different forms of phosphorus must be resolved by sample preparation, analytical method, or both.
Both liquid and solid states 31P nuclear magnetic resonance (NMR) has been used to study phosphorus in foods as well as other organic matter. Thomsen et al. (1995) studied native casein micelles using magic angle spinning (MAS) 31P NMR.14 Their studies revealed that the micellar inorganic calcium phosphates exhibit structural similarities to hydroxyapatite and hence resemble mineralized bone tissue. Hydroxyapatite was readily identified in human mineralized bone tissue by 31P NMR analysis.15,16 Frolich et al. (1988) used 31P NMR to follow the breakdown of phytate in oats and wheat.17 Spyros and Dais (2000) determined that 31P NMR spectroscopy is a facile quantitative technique for the analysis of mono- and diglyceride content in virgin olive oils.18 Spyros and Dais (2009) utilized 31P NMR to obtain information on the composition of phospholipid membranes, lipid headgroup orientation relative to the bilayer normal, and the phase state of phospholipid systems.1931P NMR T1 relaxation studies were performed on muscle cells in various animals and human being.2031P solid-state NMR was also applied to studies of natural organic materials. Mathew and co-workers (2011) studied orthophosphate structural environments in biomimetic amorphous calcium phosphate and hydroxyapatite grown in vitro at the surface of a mesoporous bioactive glass.21
One of the significant advantages of NMR spectroscopy is its capacity to provide quantitative information for systems from molecular to macroscopic scales. Quantitative solid-state NMR allows measuring the populations of different sites and thus the relative concentrations of the components in a solid sample without dissolving them into solution. Thus, chemical analysis can be performed nondestructively. These experiments can be performed using a single pulse MAS scheme with either an adequate repetition time (TR > 5 × T1) to measure relative concentrations directly or knowledge of the T1 of each component to calculate the concentrations. In this study, the latter method is used to measure the composition (speciation and quantification) of phosphorus compounds in pet food.
2. Experiments
2.1. Sample Preparation
2.1.1. Wet Pet Food Samples
Commercially available wet pet food was directly obtained from the foil tray pack in wet “loaf” form and was lyophilized for 5 days to remove water from the sample. The dried chunks were ground into a fine powder and mixed well so that the sample was homogeneous for solid-state NMR. This step is necessary for stable MAS spinning. The weight loss due to lyophilization was 78.5%, leaving dry components to constitute 21.5% of the pet food from the original container.
2.1.2. Dry Pet Food Samples
Dry pet food samples consisted of kibbles of multiple shapes and colors. Each type of kibble was ground into fine particles with an agate mortar and pestle set and then mixed according to the weight fractions of the whole pellets. The fine particles were ground into fine powders and loaded into a 4 mm zirconia rotor for solids MAS NMR.
2.1.3. Standards
Inorganic phosphorus-containing compounds that might be present in the pet food were prepared as standards for comparison of the NMR spectra of these standards to those of pet food samples. Detailed information is summarized in Table 1.
Table 1. Standards for 31P NMR Measurement and Spiking Experiments.
| symbol | formula | name | F.W. (g) | CAS # | purity | manufacturer/vendor | catalogue # | country |
|---|---|---|---|---|---|---|---|---|
| bone meal | unknown | bone meal powder | N/A | N/A | N/A | KAL | 21245 556299 | USA |
| MCP | Ca[H2PO4]2 | calcium phosphate monobasic, calcium bis(dihydrogen phosphate) | 234.05 | N/A | 95% | Aldrich | C8017-100G | Japan |
| MSP | Na[H2PO4] | sodium phosphate monobasic, sodium dihydrogen phosphate | 119.88 | 7558-80-7 | N/A | Sigma-Aldrich | S2554-100G | Switzerland |
| MKP | K[H2PO4] | potassium phosphate monobasic, potassium dihydrogen phosphate | 136.09 | 7778-77-0 | 99% | SIGMA | P5655-100G | USA |
| STPP | Na5[P3O10] | sodium triphosphate pentabasic | 367.86 | 7758-29-4 | 98% | Sigma-Aldrich | 72061-100G | Germany |
| KTPP | K5[P3O10] | potassium triphosphate pentabasic | 448.41 | 13845-36-8 | N/A | Spectrum Chemical MFG. Corp. | P1669-500G | USA |
| TSPP | Na4[P2O7] | sodium pyrophosphate tetrabasic | 265.9 | 7722-88-5 | 95% | Aldrich | P8010-500G | USA |
| TKPP | K4[P2O7] | potassium pyrophosphate tetrabasic | 330.34 | 7320-45-5 | 97% | Aldrich | 322431-500G | USA |
The original bottle containing each standard was opened in a plastic glove bag filled with flowing dry nitrogen. The dry powder was ground with an agate mortar and pestle and packed in a 4 mm zirconia rotor and Kel-F cap. All sample handling is performed inside the glove bag filled with flowing dry nitrogen to prevent from possible hydration by the moisture in the air. After taking out appropriate amount of the sample the original sample containers were tightly caped and sealed with paraffin film.
2.1.4. Spiked Samples
Spiked samples were prepared by adding known amounts of standards at various levels to pet food samples for quantitative studies. This was done in a blind manner, i.e., the amounts added were not known to the person analyzing the data. Dry products were ground, and the spiked compounds were added to aliquots. Wet products were first homogenized/lyophilized and then ground and spiked in the same manner. In this study, we labeled the spiked samples as A, B, C, D, E, and F and the un-spiked sample as the control (also called lyophilized wet food in Section 2.1.1).
2.2. Solid-State NMR Measurements
31P solid-state NMR spectra were collected with a Bruker Avance 500 MHz NMR spectrometer equipped with an 11.7 tesla wide-bore magnet and a 4 mm triple resonance Bruker MAS probe. The 31P Larmor frequency was 202.445 MHz. 31P direct polarization (DP) and proton-decoupled pulse sequences with a 60° tip angle were used. The recycle delay time was 300 s. Weights were measured before and after a sample was loaded into a 4 mm NMR rotor. The number of scans was in the range of 8–96, as needed for signal averaging. 4 dummy scans were used before data acquisition. The total spectral acquisition for each sample ran from 1 to 8.3 h. All data were recorded with a 16,384-time domain size and processed with an 8192 block size and 20 Hz of exponential line broadening. The signal-to-noise ratio values for the standards were in the range of 200–250. For the pet food samples, the signal-to-noise ratio values were in the range of 65–90. The MAS speed was 15 kHz. The 31P chemical shifts were externally referenced to 85% H3PO4. Na2HPO4·7H2O was used as the secondary standard for 31P MAS NMR measurements, and its chemical shift is 4.875 ppm.
Proton-decoupled 31P MAS NMR data were collected with a single 31P pulse and a two-pulse-phase-modulated (TPPM) decoupling pulse sequence. 31P–1H cross-polarization(CP) MAS NMR data were acquired for lyophilized wet sample, the contact time was 2 ms, and the recycle delay time was 5 s.
The spin lattice relaxation time (T1) was measured using the saturation recovery method. A pulse train of eight 90-degree pulses with 5 ms of inter-pulse delay was used for saturation, and a delay time (TD) between saturation and inspection was varied. The integral (M(TD)) over each recognizable peak was determined at each delay time, and the integrals were fit to the equation
| 1 |
The fit yields both T1 and the equilibrium magnetization, M0. Note that in samples with well-separated peaks, there is a T1 relaxation time for each peak due to differential relaxation phenomena. In some samples, the NMR signals are heavily overlapped; therefore, it is very difficult to separate these peaks and to measure the T1 relaxation time for each component. In this case, the integrals over the entire overlapped range were used to fit eq 1 to determine a largely averaged T1 relaxation time. We denote this value as bulk T1.
3. Results
3.1. 31P MAS NMR Data of Standards
All 31P NMR spectra of the standards have isotropic signals in the 10 to −20 ppm range with spinning side bands out to 158 ppm away from the isotropic peaks. The isotropic peaks constitute 65% ≤ x ≤ 96% of the total intensity. The intensity fraction [(the integral of the isotropic region)/(the total integral)] of the isotropic peak varied depending on these compounds’ composition and structure. For example, the isotropic peak constitutes about 96.25% in MKP (Figure 1) and 65.65% in STPP (Figure 2). This is because the sideband distribution is related to the chemical shift tensor, which is dependent on the coordination environment of the phosphorus atom. We performed solid NMR line shape analysis with Bruker’s Topspin software and obtained the isotropic chemical shift, chemical shift anisotropy, asymmetry parameter, and fraction for each component for the standards.
Figure 1.
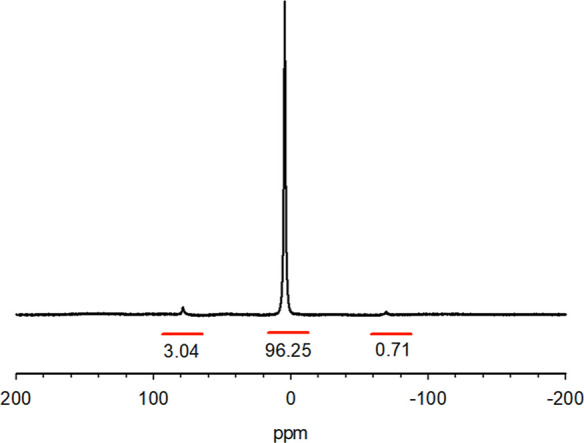
31P MAS NMR spectrum of MKP (H2KPO4). The spinning sidebands are very small in this case, but not in every case. This necessitates including the side bands in the integrals. Compare with Figure 2 where the spinning side bands are much larger relative to isotropic peaks.
Figure 2.

31P MAS NMR spectrum of STPP. (a) full spectrum, (b) isotropic region. The spinning sidebands are much larger relative to the isotropic peaks than in Figure 1.
We included all the spinning sidebands in the total NMR signal intensity when performing quantitative analysis. Ideally, the samples can be spun fast enough to eliminate the spinning sidebands by placing the sidebands outside of the extent of the chemical shift tensor and thus eliminating this complication, but that was not possible here. Furthermore, the 31P T1 relaxation times are different in different structural environments, even within the same compound. Therefore, it is necessary to back-calculate the real NMR signal intensity (M0 in eq 1) from the experimentally observed integrals.
The 31P MAS NMR spectral line shape of all the standards was analyzed with Bruker’s Topspin 4.1.4. and is presented in Table 2. The deconvolution results, including isotropic chemical shift, chemical shift anisotropy, asymmetry parameter, and fraction of each individual peak, reflect the structural features of these phosphates. Without other complementary structural characterization, e.g., XRD, we fitted the spectra with the apparent number of peaks. Repeated acquisition of a given sample indicates an error of 1.5%. All other sources of errors are significantly less than 1.5%. Thus, we conservatively estimate the error of the integral at 2% or less. Table 2 also lists the T1 relaxation times of the isotropic peaks. The T1 relaxation times are quite long compared to the experimental repetition time (TR = 300 s). When performing quantitative analysis based on 31P NMR signal intensities, it is necessary to calculate the T1 relaxation back-calculation factor (vide infra, Discussion, eq 3)
Table 2. 31P MAS NMR Isotropic Chemical Shift, Chemical Shift Anisotropy, Asymmetry Parameter, Composition, Fitting Quality, T1 Relaxation Times, and Back-Calculation Factors of Phosphate Standards.
| sample | formula | δ(iso)a | δ(CSA)b | η(CSA)c | fractiond | best overlap (%)e | T1 (s)f | T1 back-calculation factorg |
|---|---|---|---|---|---|---|---|---|
| MCP | Ca[H2PO4]2 | 0.69 | –84.8 | 0.05 | 0.49 | 69.2% | 877 | 2.57 |
| –3.77 | –96.9 | 0.14 | 0.51 | 1099 | 2.99 | |||
| MSP | Na[H2PO4] | 3.37 | –93.7 | 0.46 | 0.46 | 93.1% | 1388 | 3.55 |
| 2.11 | –64.7 | 0.00 | 0.54 | 1492 | 3.75 | |||
| MKP | K[H2PO4] | 4.93 | –46.4 | 0.07 | 1.00 | 88.0% | 546 | 1.94 |
| STPP | Na5[P3O10] | 5.85 | 109.8 | 0.08 | 0.38 | 90.0% | 1031 | 2.86 |
| 2.21 | 97.7 | 0.10 | 0.30 | 631 | 2.10 | |||
| –4.93 | –123.1 | 0.11 | 0.18 | 1408 | 3.59 | |||
| –6.54 | –127.8 | 0.10 | 0.14 | 1036 | 2.87 | |||
| KTPP | K5[P3O10] | 0.11 | 101.3 | 0.06 | 0.36 | 89.9% | 801 | 2.43 |
| –2.83 | 104.8 | 0.06 | 0.31 | 1009 | 2.82 | |||
| –15.68 | –117.0 | 0.08 | 0.029 | 271 | 1.44 | |||
| –18.0 | –134.9 | 0.08 | 0.30 | 1543 | 3.84 | |||
| TSPP | Na4[P2O7] | 3.95 | 107.4 | 0.11 | 0.15 | 73.9% | 753 | 2.33 |
| 3.47 | 83.1 | 0.02 | 0.44 | |||||
| 3.04 | 83.3 | 0.03 | 0.28 | |||||
| 2.65 | 98.1 | 0.02 | 0.13 | |||||
| TKPP | K4[P2O7] | 2.04 | 94.0 | 0.10 | 0.15 | 93.2% | 523 | 1.90 |
| 1.61 | 91.8 | 0.10 | 0.072 | 605 | 2.05 | |||
| 1.24 | 88.3 | 0.08 | 0.15 | 536 | 1.92 | |||
| 0.58 | 79.8 | 0.09 | 0.093 | 612 | 2.07 | |||
| –0.07 | 86.1 | 0.10 | 0.24 | 408 | 1.69 | |||
| –1.85 | 83.9 | 0.11 | 0.082 | 644 | 2.13 | |||
| –3.11 | 86.4 | 0.12 | 0.19 | 608 | 2.06 | |||
| –3.67 | 89.0 | 0.11 | 0.027 | 537 | 1.93 | |||
| bone meal | unknown | 3.56 | –60.5 | 0.06 | 0.03 | 95.1% | 23 | 1.15 |
| 1.68 | –62.2 | 0.01 | 0.12 | 25 | 1.15 | |||
| 0.16 | –52.2 | 0.00 | 0.28 | 27 | 1.15 | |||
| –1.08 | –64.3 | 0.00 | 0.57 | 27 | 1.15 |
Isotropic chemical shift in ppm.
Chemical shift anisotropy in ppm.
Asymmetry parameter.
Fraction = (integral of one component)/(total integral from all components). The relative uncertainties (standard deviation/mean) from repeated iterations of deconvolution are less than 0.3%.
Best overlap (%): the simplex iteration minimizes the least squares difference between the experimental spectrum and the superimposed simulated spectra. overlap (%) > 70–90, good agreement. A single Lorentzian–Gaussian line width was used for all the peaks.
T1 relaxation time (fitted with eq 1) for each individual isotropic peak. The components for TSPP are overlapped; therefore, a bulk T1 relaxation time is measured from the entire isotropic chemical shift region (5.2–1.7 ppm). The relative uncertainties (standard deviation/mean) from multiple measurements of T1 for each signal are less than 0.8%.
T1 relaxation back-calculation factor is defined in eq 3 in the Discussion session (vide infra, Discussion, eq 3).
Most of the standards contain multiple peaks in the isotropic chemical shift region. This is due to multiple 31P atoms’ different local structural environments. For example, there are multiple phosphorus sites with different P–O bond distances and different local symmetries (bond angles) in P–O–P linkage (the bridging oxygens) in polymeric tri-phosphate. This leads to varying next nearest neighbor distances. Figure 3 displays the isotropic regions of the 31P MAS NMR spectra of all the standards. These patterns are the signatures for identifying the phosphorus speciation in the pet food samples.
Figure 3.

Isotropic regions of the 31P MAS NMR spectra of all the standards. Each compound has its own signature pattern. Note that there are small impurities in KTPP and STPP that are on the order of 5%.
The T1 relaxation times of phosphorus compounds can be quite long. Thus, waiting 5 × T1s can be impractical—especially when signal averaging is necessary. Data acquisition time can be decreased by shortening the repetition time (TR) and S/N maximized by lowering the tip angle to the Ernst angle.22 However, the Ernst angle depends on the ratio TR/T1, and there is a large spread of T1’s in our samples. For our T1’s the Ernst angle ranged from about 45–65°. Fortunately, the S/N vs tip angle is relatively flat with respect to tip angle. We used 60° tip angle and 300 s of recycle delay time. This combination approximately maximizes acquisition of signal to noise per unit time. However, this requires a knowledge of the spin lattice relaxation time (T1) of each peak and the tip angle to correct the integrals and thus obtain quantitative data. T1s were measured via saturation recovery and T1 values for each peak and bulk T1 values for overlapped peaks are listed in Table 2. To estimate the uncertainties of T1 calculation, we used the manual integral of a signal and repeated the measurement multiple times with slightly different integration regions. An example of a T1 measurement for MCP is displayed in Figure 4.
Figure 4.

Saturation recovery T1 measurement of MCP. Stacked spectra with variable inter-pulse delay times. T1 relaxation time of the peak at −3.77 ppm is 1099 ± 2 s, the T1 relaxation time of the peak at 0.69 ppm is 877 ± 2 s.
3.2. 31P MAS NMR Spectrum of Bone Meal
The 31P NMR spectrum of bone meal is displayed in Figure 5. It has four overlapping components with isotropic signals at −1.08, 0.16, 1.68, and 3.56 ppm. The deconvolution of the peaks and their fractions is shown in Figure 5 and summarized in Table 2. The individual peak patterns were calculated using the line fitting program DMFIT (http://nmr.cemhti.cnrs-orleans.fr/dmfit/help/models/default.aspx). Comparing the 31P MAS NMR spectrum of bone meal with Table 2 shows no match. Thus, bone meal does not contain any of the phosphate species listed in Table 2. Other phosphates, for example, organic or bio-phosphorus species, must be present in this sample.
Figure 5.

31P MAS NMR spectrum of bone meal. The spectrum can be fitted with four Gaussian–Lorentzian lines.
3.3. 31P MAS NMR Spectra of Dry Pet Food
The 31P MAS NMR spectra for a dry pet food are displayed in Figure 6. Figure 6a,b presents the single pulse DP spectrum and the zoomed in isotropic region, respectively. Figure 6c is the DP 31P NMR data acquired with 1H TPPM decoupling. Proton decoupling narrows the 31P lines, and thus, they are better resolved. This suggests that the phosphate species in the dry pellet mixture are either protonated or hydrated.
Figure 6.

31P MAS NMR spectra of dry pet food. (a) DP 31P MAS NMR full spectrum, including spinning sidebands. (b) Magnification of the isotropic peaks. (c) 1H-decoupled 31P MAS NMR spectrum. Proton decoupling removes the dipolar coupling between protons and phosphorus atoms, thus narrowing the 31P lines. (d) Deconvolution results of the 1H-decoupled 31P MAS NMR spectrum. The solid line is the sum of all six components (dash lines).
Spectral deconvolution of the 1H-decoupled 31P data (see Figure 6d) (without cross polarization) shows five narrow components and one broad signal with a linewidth of 1500 Hz. The presence of multiple narrow peaks indicates that there are crystalline phases in the dry pellet mixture. For simplicity, only one Gaussian/Lorentzian line is used to simulate the broad signal centered at 2.41 ppm. However, the fitted broad component is probably from a distribution of multiple wide lines. This distribution may be due to amorphous organic or biological phosphorus-containing species.
Just as quantitative measurement of single pulse 31P is affected by the NMR repetition time when TR is not long enough, 1H-decoupled 31P spectrum is also affected for quantitative 31P NMR measurements because of insufficient relaxation delay time. However, deconvolution of these spectra does yield speciation. The deconvolution result is given in Table 3. Thus, the integrals of the lines in Figure 6d and listed in Table 3 do not necessarily represent the accurate populations of different types of phosphorus in the structure. Never-the-less, 31P NMR distinguishes different species of phosphorus, which is beneficial to the study of phosphorus content in foods.
Table 3. 1H-Decoupled 31P MAS NMR Spectral Deconvolution of the Dry Pellet Mixture.
| SITES |
||||||
|---|---|---|---|---|---|---|
| 1 | 2 | 3 | 4 | 5 | 6 | |
| δ(iso) (ppm) | 7.06 | 6.54 | 4.95 | 4.44 | 3.84 | 2.41 |
| δ(CSA) (ppm) | 62.33 | 80.54 | 59.06 | 62.28 | 23.65 | 67.84 |
| η(CSA) | 0.121 | 0.122 | 0.086 | 0.109 | 0.1 | 0.136 |
| width (Hz) | 104 | 156 | 114 | 125 | 187 | 1500 |
| integrala | 1.02 × 10⁹ | 1.12 × 10⁹ | 5.36 × 10⁹ | 4.41 × 10⁹ | 6.00 × 10⁹ | 2.72 × 10⁹ |
| fraction | 0.049 | 0.054 | 0.260 | 0.214 | 0.291 | 0.132 |
Best overlap 91.65%.
3.4. 31P MAS NMR Data of the Lyophilized Canned Sample
31P DP with 1H decoupling and CP MAS spectra of lyophilized canned wet sample are shown in Figure 7. A broad signal centered at about 3.9 ppm and a shoulder at about 0 ppm are present. Cross polarization is highly dependent on 31P–1H inter-nuclear distance. The signal at 0 ppm becomes a greater fraction of the total signal (CP vs DP), indicating that those 31P atoms are more tightly dipolar-coupled to proton atoms than the signal at 3.9 ppm. The preferential enhancement occurs because there are more protons near the 0 ppm phosphorus atoms. This, in turn, indicates that lyophilization does not remove all the water molecules from the original wet pet food sample. The degree of lyophilization determines the residual water content and mass normalized 31P NMR signal intensity (see Discussion).
Figure 7.

31P DP with 1H decoupling (red) and cross polarization (blue) MAS NMR spectra of lyophilized wet food. The DP signal in red and the cross-polarization signal in blue are deconvoluted into two Lorentzian lines at 3.9 and 0 ppm. Cross polarization conditions preferentially polarize the 31P atoms at 0 ppm. This indicates that these 31P atoms are relatively closer to protons.
3.5. 31P MAS NMR Data of Spiked Samples
Shop bought commercially available pet food samples were spiked with varying amounts of standards in Table 1 and packed into MAS rotors. The weight of each rotor with and without the sample was recorded so that 31P MAS NMR signal intensity could be scaled to determine phosphorus content. The relative uncertainties of weight measurement are less than 0.1%. The spiking matrix is available in Supporting Information section.
The 31P MAS NMR spectra for the spiked samples (A–F) are displayed in Figures 8 and 9. The 31P NMR signals from spiked standards are more obvious in samples D, E, and F when compared with samples A, B, and C. Obviously, samples D, E, and F contain added STPP, MKP, and bone meal, respectively. The quantity of these recognizable standards can be determined by spectral fitting and deconvolution. The spectra of the pure compounds (in Figure 3) are used for quantification of the components in the mixture.
Figure 8.

31P MAS NMR spectra of spiked samples A, B, C, and un-spiked Control and known added standards MSP, TSPP, BTKPP, and MCP. The spiking matrix is available in the Supporting Information section.
Figure 9.

31P MAS NMR spectra of spiked samples D, E, F, and un-spiked Control. The 31P MAS NMR spectra for spiked standards MKP, STPP, and bone meal is displayed at the bottom. Spiking matrix is available in Supporting Information section.
In samples A, B, and C, the spiked MSP, MCP, TKPP, and TSPP standards cannot be easily identified from the 31P NMR spectra (Figure 8). Spectral deconvolution is not possible because of the broad signal from the un-spiked control sample dominates the spectrum.
4. Discussion
31P NMR spectroscopy
is a powerful tool to analyze the
local structural environments of phosphorus atoms, and as such, inorganic
phosphates have been extensively studied by 31P NMR spectroscopy.
The fundamental building block of phosphates is the PO4 tetrahedron. The nomenclature used here is that orthophosphate,
a single PO4 tetrahedron not linked to another PO4, is Q0. Two PO4 tetrahedra linked together
by a bridging oxygen to form a P2O7 dimer (pyro-phosphate)
is defined as Q1. A linear tripoly-phosphate, P3O10 (three PO4 tetrahedra linked together by
two bridging oxygens), forms a three-membered chain. The two end members
are similar to the Q1 in a dimer. The middle 31P has two bridging oxygens and is termed Q2.
Typical 31P NMR data for common ortho-phosphates, pyro-phosphates, and tripoly-phosphates are summarized in Table 4. Table 4 exhibits the general trend of 31P NMR peaks shifting towards higher fields (becoming more shielded due to higher electron density) when:
-
(1)
PO4 tetrahedra are polymerized. Q2 and Q1 have more negative chemical shifts than Q0, e.g., Na5P3O10, (Q2 middle site, −8.9 ppm and Q1 end site, −0.2 ppm) vs Na3PO4 (13 ppm),
-
(2)
cations are stronger, e.g., Ca3(PO4)2 (3 ppm) a vs Na3PO4, (13 ppm).
-
(3)
PO4 is protonated (forming HPO4 linkage) when molecular water (or structural water) is present in the structure.
Table 4. 31P NMR Chemical Shift of Common Phosphorus-Containing Materials.
| compound | chemical Shift (ppm) | reference |
|---|---|---|
| ortho-Phosphate (Q0) | ||
| 85% H3PO4 | 0.0 | universal |
| Na3PO4 | 13, 14.1, 14 | Dupree et al. (1988),25 Ducel et al. (1994),26 Hayashi and Hayamizu (1989)33 |
| Na3PO4·10H2O | 7.8 | Hayashi and Hayamizu (1989)33 |
| Na3PO4·12H2O | 7.8 | Turner et al. (1986a)24 |
| Na2HPO4 | 6.6 | Turner et al. (1986a)24 |
| Na2HPO4·7H2O | 4.58 | this study |
| Na[H2PO4] | 3.37, 2.11 | this study |
| NaH2PO4·H2O | 2.3 | Turner et al. (1986a)24 |
| K3PO4 | 11.7, 12,5 | Grimmer and Haubenreisser (1983),32 Hayashi and Hayamizu (1989)33 |
| K3PO4·3H2O | 11.3 | Hayashi and Hayamizu (1989)33 |
| K[H2PO4] | 4.93 | this study |
| KH2PO4 | 4.3 | Turner et al. (1986a)24 |
| K2HPO4·3H2O | 2.1 | Turner et al. (1986a)24 |
| Ca3(PO4)2 | 3.0 | Turner et al. (1986a)24 |
| CaH(PO4) | –0.6 | Turner et al. (1986a)24 |
| CaH(PO4) | –1.6, −0.4, 1.4 | Louati et al. (2005)27 |
| CaH(PO4)·2H2O | 1.6 | Cheetham et al. (1986)23 |
| CaH(PO4)·2H2O | 1.35 | Bak et al. (2001)29 |
| Ca(H2PO4)2, site 1 | –0.9 | Cheetham et al. (1986)23 |
| Ca(H2PO4)2, site 2 | 0.8 | Cheetham et al. (1986)23 |
| Ca[H2PO4]2 | 0.69, −3.77 | this study |
| Ca(H2PO4)2·H2O, site 1 | –5.3 | Cheetham et al. (1986)23 |
| Ca(H2PO4)2·H2O, site 2 | –0.6 | Cheetham et al. (1986)23 |
| Pyro-Phosphate (Q1) | ||
| Na4P2O7, site 1 | 1.6, 1.3 | Cheetham et al. (1986),23 Ducel et al. (1994)26 |
| Na4P2O7, site 2 | 2.5 | Cheetham et al. (1986)23 |
| Na4[P2O7] | 3.95, 3.47, 3.04, 2.65 | this study |
| K4P2O7 | 0.9 | Dupree et al. (1988)25 |
| K4[P2O7] | 2.04, 1.61, 1.24, 0.58, −0.07, −1.85, −3.11, −3.67 | this study |
| a-Ca2P2O7, site 1 | –7.8 | Cheetham et al. (1986)23 |
| a-Ca2P2O7, site 2 | –10.7 | Cheetham et al. (1986)23 |
| b-Ca2P2O7, site 1 | –6.3 | Cheetham et al. (1986)23 |
| b-Ca2P2O7, site 2 | –7.8 | Cheetham et al. (1986)23 |
| b-Ca2P2O7, site 3 | –9.1 | Cheetham et al. (1986)23 |
| b-Ca2P2O7, site 4 | –10.0 | Cheetham et al. (1986)23 |
| Tripoly-Phosphate (Q1, Q2) | ||
| Na5P3O10, middle unit (Q2) | –8.9 | Ducel et al. (1994)26 |
| Na5P3O10, end unit (Q1) | –0.2 | Ducel et al. (1994)26 |
| Na5[P3O10] (Q1, Q2) | 5.85, 2.21, −4.93, −6.54 | this study |
| K5[P3O10] (Q1, Q2) | 0.11, −2.83, −15.68, −18.0 | this study |
| P3O8, middle unit (Q2) | ∼−19 | Maki et al. (2013)31 |
| P3O8, end unit (Q1) | ∼−6 | Maki et al. (2013)31 |
| Organic/Bio-Phosphorus | ||
| hydroxyapatite (Q1) | ∼3.1 (broad signal) | Thomsen et al. (1995)14 |
| Ca hydroxyapatite (Q1) | 2.81 | Bak et al. (2001)29 |
| phytates | 4.4, 5.6 | Frolich et al. (1988)17 |
| bovine bone | 2.57, 3.13 | Bak et al. (2001)29 |
| sugar phosphate | 5.5 | Belton et al. (1987)30 |
| orthophosphate | 4 | Belton et al. (1987)30 |
| creatine phosphate | 0 | Belton et al. (1987)30 |
| g-phosphates of ATP | –3 | Belton et al. (1987)30 |
| a-phosphates of ATP | –7.5 | Belton et al. (1987)30 |
| b-phosphates of ATP | –17 | Belton et al. (1987)30 |
| organic phosphorus compounds | wide range | Lara and Barron (2019)35 |
This is a very important factor that changes the 31P chemical shifts. The spectra discrepancy of our Ca[H2PO4]2, with signals at 0.69 and −3.77 ppm compared with Cheetham et al. (1986)23 results at 0.8 and −0.9 ppm, could be due to different hydration states during sample handling and NMR measurement.
The 31P NMR spectrum for bone meal (Figure 5) contains signals at 3.56, 1.68, 0.16, and −1.08 ppm with chemical shift anisotropy values of −60 to −65 ppm (Table 2), which suggests the presence of CaHPO4 type of structural sites.27 It is also possible that some bio-orthophosphates, including hydroxyapatite and brushite, are present in the bone meal sample. Hydroxyapatite [Ca10(OH)2(PO4)6] and brushite [CaHPO4·2H2O] are common minerals found in nature in bones and are well studied by NMR.14,29,34 Orthophosphates are also commonly seen in ATP of animal muscle cells.30
A unique feature of bone meal is its short T1 relaxation time (longest being 27 s) compared with that of the inorganic standards (600–1800 s), see Table 2. Cohen and Burt (1977) studied 31P NMR T1 relaxation behavior of phosphocreatine in intact muscle, and they reported a T1 value of 5 s in solution state NMR.36 The mobility of the phosphocreatine in intact muscle and the 31P coupling to 1H and 13C facilitate the faster T1 relaxation time compared with inorganic crystalline phosphates. In vivo measurements of T1 relaxation times of 31P-metabolites in human skeletal muscle are also in the range of 3–5 s.20
The 31P NMR spectrum for dry pet food (Figure 6) has peaks at 7.06, 6.54, 4.95, 4.44, and 3.84 ppm. Based on the references in Table 4, we can identify the presence of sodium ortho-phosphates with various protonation and hydration states and probably hydroxyapatite. The broad component ranging from 10 to −5 ppm could be due to the presence of organo-phosphorus species (e.g., sugar phosphates and nucleotides).
The broad feature of the 31P NMR spectrum of lyophilized wet sample (Figure 7) makes it difficult to identify any specific inorganic standards. But, the signals centered at 3.9 and 0 ppm strongly suggest the presence of hydroxyapatite and protonated/hydrated calcium orthophosphates.28 The fact that the signal at 0 ppm becomes relatively stronger in the CP-NMR spectrum compared with DP NMR spectrum indicates stronger 31P–1H dipolar coupling. The preferential polarization of the 31P NMR signal at 0 ppm can be ascribed to the presence of protonated HPO4 sites in the structure.29 We observed that some compounds become unrecognizable after being mixed with the pet food, as in the spiked samples A, B, and C (Figure 8).
Usually, when performing quantitative NMR measurements, the repetition time of the experiment is set to 5 × T1 to ensure the integration of the peaks is proportional to the content. The 31P relaxation times measured here, however, are very long. The experiment can be shortened with knowledge of the T1 relaxation times of both the standard compounds and the pet food samples and still determine the relative content. In general, an experiment with multiple scans is running at a steady state. The steady-state magnetization is given by the equation (see ref (22), page 125)22
| 2 |
where θ is the excitation flip angle, Mss is the detected NMR signal intensity from the sample, and M0 is the thermal equilibrium magnetization–proportional to the total number of phosphorus atoms (31P content). E1 = exp(−TR/T1), where TR is the NMR repetition time, and T1 has been measured. A back-calculation factor, C, is needed to obtain information about the actual 31P content from experimental 31P NMR signal intensity. C is defined by
| 3 |
In this study, the back-calculation factor, C, derived from eq 3 was used to calculate the measured P content against the actual P content. Different structural sites within a pure compound have different T1 values, for example MCP in Figure 4 the T1 values are 877 s for the peak at 0.69 ppm and 1099 s for the peak at −3.77 ppm. If we use the longest T1 relaxation time to calibrate the signal intensity with eq 2 the signal intensities will not be reflected according to the true scale due to differential relaxation. Therefore, it is necessary to compute a composite back-calculation factor, which includes all the individual peaks (for example Table 2 for bone meal) and their T1 relaxation times. The composite back-calculation factor Ca is defined by
| 4 |
where Fc is the fraction of a peak relative to total 31P NMR intensity, and
| 5 |
and
| 6 |
and T1c is the T1 relaxation time of a component peak, and TR is the repetition time of the experiment. In cases where the individual peaks could not be distinguished, the Bulk T1 was used. This worked surprisingly well. Both procedures were performed for MCP and KTPP, and the error introduced was less than 5%. The error estimation is based on the possible sources of errors that are related to the 31P NMR signal quantitation. The relative uncertainty from sample weight measurement is less than 0.1%; the 31P NMR signal integral from repeated acquisition on a given sample indicates an error of 1.5%; repeated fitting of T1 relaxation time reveals a relative uncertainty of less than 0.8%; the relative uncertainties of spectral deconvolution for multiple components (either completely separated or partially overlapped) are all under 0.4%.
Figure 10 displays a linear relationship between the 31P NMR signal intensity (after T1 back calculation) and the formula-predicted 31P content for the known standard samples with above 90% of confidence band. The deviation from the linear regression could be from the presence of impurities (see Figure 3), moisture adsorption on the sample surface, and uncertainties during NMR data acquisition and processing (for example phase correction, baseline correction, and integration) and curve-fitting. The chemical formulas of the anhydrous compounds listed in Table 1 were used. However, the standards contain up to 5% of impurities. Without other structural characterization, e.g., XRD analysis, we had no information about the phase composition. On the other hand, all the standards have been exposed to air and, inevitably, hygroscopic compounds. For example, KH2PO4 (https://www.sigmaaldrich.com/US/en/sds/sigald/p0662) will adsorb some moisture on the surface. The actual structure formula would have contained some amount of water, which increases the formula weight and decreases the 31P content. Uncertainties during NMR measurement, including sample weight measurement, NMR data processing, and deconvolution, also populate errors in the final calculation.
Figure 10.

31P NMR signal intensity (calibrated relative to weight, number of scans, and T1 back-calculation factor) vs P content (based on the formula weight in Table 1). The 31P content (wt %) of lyophilized wet food samples is calculated based on the linear regression from the standards. The legend is on the right. Int = a × x + y0; where x = 31P content based on the formula; R = 0.871; R2 = 0.758.
From this linear regression, we can measure the 31P content of pet food samples. For the lyophilized wet food, the 31P content is 1.85% by weight. With a 78.5% of lyophilization rate, the 31P content in the original wet food is 0.40% (1.85% × [1 – 0.785] = 0.40%) by weight.
The back-calculated 31P MAS NMR signal intensities of the spiked standards are linear with respect to the total added amount (Figure 11, red squares, R2 ∼ 0.99). It is evident that with both STPP (top) and bone meal, without the back calculation, there would be a systematic deviation of the measured phosphorus content from the actual phosphorus content. This is because the observed NMR signal intensities are affected by the experimental polarization tip angle and the ratio of repetition time to T1 relaxation times (TR/T1) of each standard. This is a direct result of the need to use TRs on the order of the long phosphorus T1s as a practical matter to collect data in a timely fashion.
Figure 11.

Fraction of 31P MAS NMR signal intensity of the spiked standard vs the actual spiked quantity, top: STPP; bottom: bone meal. Black circles represent experimentally measured NMR intensity; the fraction of 31P from a standard is defined by the integral of the signal from the standard against the entire NMR signal intensity from the spiked samples. It reflects the portion of 31P from that specific standard in the spiked sample. Because the observed NMR signal intensities are affected by the experimental polarization tip angle and the ratio of repetition time to T1 relaxation times (TR/T1) of each standard, it is necessary to calibrate and re-normalize these 31P NMR intensities. The red squares are 31P NMR signal intensities after T1 relaxation calibration and re-normalization. A linear regression is performed and yields R2 ∼ 0.99.
Using the linear relationship given in Figure 10, we can correlate the NMR-measured 31P quantity with the actual spiked standards, and the 31P NMR results agree with the spike experiments. As shown in Figure 12, the fitted linear correlation equation, Y = 0.972 × X + 14.9 and R2 = 0.901, clearly indicates that 31P MAS NMR measurement with T1 back calculation agrees with the true P content. We also note that the intercept is not 0. This reflects the fact that the control sample contains some phosphorus at the chemical shifts of the target compound. MKP has a broad peak that substantially overlaps with the control (see Figure 9), which makes it difficult to measure the integral of MKP, much like the data in Figure 8 and thus the linear fit fails for MKP.
Figure 12.

Phosphorus content measured by 31P NMR signal intensity vs actual spiked known amount of phosphorus. Red circle, spiked bone meal, blue triangle, spiked STPP, green triangle, and spiked MKP. The amounts of 31P calculated from the NMR signal are calibrated by a number of scans and the T1 back-calculation factor. Linear regression yields the relationship Y = 0.972 × X + 14.91, R = 0.949, and R2 = 0.901.
5. Conclusions
Phosphorus content in pet foods can be determined with 31P NMR. In some cases, specific phosphorus containing compounds can be identified. Systematic acquisition of 31P NMR spectra and measurement of T1 relaxation times of 31P standards are necessary. Knowledge of 31P T1 permits the acquisition of quantitative solid-state NMR data despite long spin–lattice relaxation times and thus determines phosphorus content within the 90% confidence level. These results demonstrate that when impurities are in sufficient quantity such that the unique chemical shift peaks are evident, 31P content can be determined. Thus, the 31P NMR-MAS technique shows promise for quantitative phosphorus measurement in foods. This method works for dry pet food and for lyophilized wet pet food.
Supporting Information Available
The Supporting Information is available free of charge at https://pubs.acs.org/doi/10.1021/acs.jafc.2c07339.
Phosphate compounds spiking matrix, 31P MAS NMR spectra of phosphate standards, and deconvolution components with Bruker’s Topspin software (PDF)
The authors declare the following competing financial interest(s): This work was funded by Mars Petcare. J.W.M. and P.S. were employees of Mars at the time that the study was conducted.
Supplementary Material
References
- Kemi V. E.; Kärkkäinen M. U. M.; Lamberg-Allardt C. J. E. High phosphorus intakes acutely and negatively affect Ca and bone metabolism in a dose-dependent manner in healthy young females. Br. J. Nutr. 2006, 96, 545–552. [PubMed] [Google Scholar]
- Karp H. J.; Vaihia K. P.; Kärkkäinen M. U. M.; Niemistö M. J.; Lamberg-Allardt C. J. E. Acute effects of different phosphorus sources on calcium and bone metabolism in young women: A whole foods approach. Calcif. Tissue Int. 2007, 80, 251–258. 10.1007/s00223-007-9011-7. [DOI] [PubMed] [Google Scholar]
- Finco D. R.; Barsanti J. A.; Brown S. A. Influence of dietary source of phosphorus on fecal and urinary excretion of phosphorus and other minerals by male cats. Am. J. Vet. Res. 1989, 50, 263–266. [PubMed] [Google Scholar]
- Coltherd J. C.; Staunton R. H.; Colyer A.; Thomas G.; Gilham M.; Logan D. W.; Butterwick R.; Watson P. Not all forms of dietary phosphorus are equal: an evaluation of postprandial phosphorus concentrations in the plasma of the cat. Br. J. Nutr. 2019, 121, 270–284. 10.1017/s0007114518003379. [DOI] [PMC free article] [PubMed] [Google Scholar]
- Dobenecker B.; Reese S.; Herbst S. Effects of dietary phosphates from organic and inorganic sources on parameters of phosphorus homeostasis in healthy adult dogs. PLoS One 2021, 16, e0246950 10.1371/journal.pone.0246950. [DOI] [PMC free article] [PubMed] [Google Scholar]
- Lampila L. E. Applications and functions of food-grade phosphates. Ann. N. Y. Acad. Sci. 2013, 1301, 37–44. 10.1111/nyas.12230. [DOI] [PubMed] [Google Scholar]
- Tuominen M.; Karp H. J.; Itkonen S. T. Phosphorus-Containing Food Additives in the Food Supply—An Audit of Products on Supermarket Shelves. J. Renal Nutr. 2022, 32, 30–38. 10.1053/j.jrn.2021.07.010. [DOI] [PubMed] [Google Scholar]
- Pet Food Regulation; US Food and Drug Administration, Pet Food, 2022.
- Pet Food Regulation; Pet Food Institute, 2022.
- Soutar L.; Coltherd J. C.; Steele V. R.; Staunton R.; Carvell-Miller L.; Hughes K. R.; Bakke A. M.; Marshall J. W. Comparisons of In Vitro and In Vivo Digestibility Assays for Phosphorus in Feline Diets and Associations with Dietary Nutrient Content. J. Agric. Food Chem. 2021, 69, 10688–10699. 10.1021/acs.jafc.1c03308. [DOI] [PubMed] [Google Scholar]
- United States Environmental Protection Agency . Method 365.1 Revision 2.0: Determination of Phosphorus by Semi-Automated Colorimetry, 1993.
- Bartos J. M.; Boggs B. L.; Falls J. H.; Siegel S. A. Determination of phosphorus and potassium in commercial inorganic fertilizers by inductively coupled plasma-optical emission spectrometry: single-laboratory validation. J. AOAC Int. 2014, 97, 687–699. 10.5740/jaoacint.12-399. [DOI] [PubMed] [Google Scholar]
- Chen Z.; He W.; Beer M.; Megharaj M.; Naidu R. Speciation of glyphosate, phosphate and aminomethylphosphonic acid in soil extracts by ion chromatography with inductively coupled plasma mass spectrometry with an octopole reaction system. Talanta 2009, 78, 852–856. 10.1016/j.talanta.2008.12.052. [DOI] [PubMed] [Google Scholar]
- Thomsen J. K.; Jakobsen H. J.; Nielsen N. C.; Petersen T. E.; Rasmussen L. K. Solid-state magic angle spinning 31P-NMR studies of native casein micelles. Eur. J. Biochem. 1995, 230, 454–459. 10.1111/j.1432-1033.1995.0454h.x. [DOI] [PubMed] [Google Scholar]
- Kolmas J.; Ślósarczyk A.; Wojtowicz A.; Kolodziejski W. Estimation of the specific surface area of apatites in human mineralized tissues using 31P MAS NMR. Solid State Nucl. Magn. Reson. 2007, 32, 53–58. 10.1016/j.ssnmr.2007.08.001. [DOI] [PubMed] [Google Scholar]
- Lin K. S. K.; Tseng Y.-H.; Mou Y.; Hsu Y.-C.; Yang C.-M.; Chan J. C. C. Mechanistic Study of Apatite Formation on Bioactive Glass Surface Using 31P Solid-State NMR Spectroscopy. Chem. Mater. 2005, 17, 4493–4501. 10.1021/cm050654c. [DOI] [Google Scholar]
- Frolich W.; Wahlgren M.; Drakenberg T. Studies on phytase activity in oats and wheat using 31P-NMR spectroscopy. J. Cereal Sci. 1988, 8, 47–53. 10.1016/s0733-5210(88)80048-1. [DOI] [Google Scholar]
- Spyros A.; Dais P. Application of 31P NMR Spectroscopy in Food Analysis. 1. Quantitative Determination of the Mono- and Diglyceride Composition of Olive Oils. J. Agric. Food Chem. 2000, 48, 802–805. 10.1021/jf9910990. [DOI] [PubMed] [Google Scholar]
- Spyros A.; Dais P. 31P NMR spectroscopy in food analysis. Prog. Nucl. Magn. Reson. Spectrosc. 2009, 54, 195–207. 10.1016/j.pnmrs.2008.09.002. [DOI] [Google Scholar]
- Thomsen C.; Jensen K. E.; Henriksen O. In vivo measurements of T1 relaxation times of 31P-metabolites in human skeletal muscle. Magn. Reson. Imaging 1989, 7, 231–234. 10.1016/0730-725x(89)90709-1. [DOI] [PubMed] [Google Scholar]
- Mathew R.; Gunawidjaja P. N.; Izquierdo-Barba I.; Jansson K.; Garcia A.; Arcos D.; Vallet-Regí M.; Eden M. Solid-State 31P and 1H NMR Investigations of Amorphous and Crystalline Calcium Phosphates Grown Biomimetically From a Mesoporous Bioactive Glass. J. Phys. Chem. C 2011, 115, 20572–20582. 10.1021/jp206237n. [DOI] [PMC free article] [PubMed] [Google Scholar]
- a Ernst R. R.; Bodenhausen G.; Wokaun A.. Principles of Magnetic Resonance in One and Two Dimensions; Oxford Press, 1991. [Google Scholar]; b Ernst R. R.; Anderson W. A. Application of Fourier Transform Spectroscopy to Magnetic Resonance. Rev. Sci. Instrum. 1966, 37, 93–102. 10.1063/1.1719961. [DOI] [Google Scholar]
- Cheetham A. K.; Clayden N. J.; Dobson C. M.; Jakeman R. J. B. Correlations between 31P n.m.r. chemical shifts and structural parameters in crystalline inorganic phosphates. J. Chem. Soc., Chem. Commun. 1986, 195–197. 10.1039/c39860000195. [DOI] [Google Scholar]
- Turner G. L.; Smith K. A.; Kirkpatrick R. J.; Oldfieldt E. Structure and cation effects on phosphorus-31 NMR chemical shifts and chemical shift anisotropies of orthophosphates. J. Magn. Reson. 1986a, 70, 408–415. 10.1016/0022-2364(86)90129-0. [DOI] [Google Scholar]
- Dupree R.; Holland D.; Mortuza M. G. The role of small amounts of P2O5 in the structure of alkali disilicate glasses. Phys. Chem. Glasses 1988, 29, 18–21. [Google Scholar]
- Ducel J. F.; Videau J. J.; Suh K. S.; Senegas J. 31 P MAS and 11 B NMR study of sodium rich borophosphate glasses. Phys. Chem. Glasses 1994, 35, 10. [Google Scholar]
- Louati B.; Hlel F.; Guidara K.; Gargouri M. Analysis of the effects of thermal treatments on CaHPO4 by 31P NMR spectroscopy. J. Alloys Compd. 2005, 394, 13–18. 10.1016/j.jallcom.2004.10.025. [DOI] [Google Scholar]
- Hlel F.; Kamoun S.; Guidara K. Investigation of Phosphorus Site Condensation in CaHPO4 by Analysis of 31P MAS-NMR Tensor and X-Ray Powder Patterns. Z. Naturforsch. 2006, 61, 375–382. 10.1515/zna-2006-7-811. [DOI] [Google Scholar]
- Bak M.; Rasmussen L.; Petersen T. E.; Nielsen N. C. Colloidal Calcium Phosphates in Casein Micelles Studied by Slow-speed-spinning 31P Magic Angle Spinning Solid-State Nuclear Magnetic Resonance. J. Dairy Sci. 2001, 84, 1310–1319. 10.3168/jds.s0022-0302(01)70160-9. [DOI] [PubMed] [Google Scholar]
- Belton P. S.; Packer K. J.; Southon T. E. 31P NMR studies of the hydrolysis of added phosphates in chicken meat. J. Sci. Food Agric. 1987, 40, 283–291. 10.1002/jsfa.2740400311. [DOI] [Google Scholar]
- Maki H.; Tsujito M.; Yamada T. Intrinsic 31P NMR Chemical Shifts and the Basicities of Phosphate Groups in a Short-Chain Imino Polyphosphate. J. Solution Chem. 2013, 42, 1063–1074. 10.1007/s10953-013-0011-0. [DOI] [PMC free article] [PubMed] [Google Scholar]
- Grimmer A.-R.; Haubenreisser U. High-field static and MAS31P NMR: Chemical shift tensors of polycrystalline potassium phosphates P2O5·xK2O (O ≤x ≤ 3). Chem. Phys. Lett. 1983, 99, 487–490. 10.1016/0009-2614(83)80180-8. [DOI] [Google Scholar]
- Hayashi S.; Hayamizu K. High-Resolution Solid-State 31P NMR of Alkali Phosphates. Bull. Chem. Soc. Jpn. 1989, 62, 3061–3068. 10.1246/bcsj.62.3061. [DOI] [Google Scholar]
- Cho G.; Wu Y.; Ackerman J. L. Detection of Hydroxyl Ions in Bone Mineral by Solid-State NMR Spectroscopy. Science 2003, 300, 1123–1127. 10.1126/science.1078470. [DOI] [PubMed] [Google Scholar]
- Lara N.; Barron A. R.. P-31 NMR Spectroscopy. Physical Method in Chemistry and Nano Science; OpenStax-CNX, 2019. [Google Scholar]
- Cohen S. M.; Burt C. T. 31P nuclear magnetic relaxation studies of phosphocreatine in intact muscle: Determination of intracellular free magnesium. Proc. Natl. Acad. Sci. U.S.A. 1977, 74, 4271–4275. 10.1073/pnas.74.10.4271. [DOI] [PMC free article] [PubMed] [Google Scholar]
Associated Data
This section collects any data citations, data availability statements, or supplementary materials included in this article.