


Abstract
In this study, phylogenetically conserved structural features of the Ro RNP associated Y RNAs were investigated. The human, iguana, and frog Y3 and Y4 RNA sequences have been determined previously and the respective RNAs were subjected to enzymatic and chemical probing to obtain structural information. For all of the analyzed RNAs, the probing data were used to compose secondary structures, which partly deviate from previously predicted structures. Our results confirm the existence of two stem structures, which are also found at similar positions in hY1 and hY5 RNA. For the remaining parts of hY3 and hY4 RNA the secondary structures differ from those previously proposed based upon computer predictions. What might be more important is that certain parts of the RNAs appear to be flexible, i.e., to adopt several conformations. Another striking feature is that a characteristic pyrimidine-rich region, present in every Y RNA known, is single-stranded in all secondary structures. This may suggest that this region is readily available for base pairing interactions with other cellular nucleic acids, which might be important for the as yet unknown function of the RNAs.
INTRODUCTION
Ro ribonucleoprotein particles (Ro RNPs) are evolutionarily conserved RNAs which are associated with the Ro60 and La proteins (1). In humans, the RNA component of a Ro RNP can be one of four different Y RNAs: hY1, hY3, hY4 and hY5. Although the existence of Ro RNPs was discovered almost two decades ago and the Y RNAs as well as the Ro60 and La proteins seem to be well conserved during evolution, no function for these RNP complexes has as yet been found (reviewed in 1). Recently, however, a synergistic role for the Ro60 and La proteins in regulating the translation of L4 ribosomal protein mRNA has been suggested in Xenopus laevis (2). Most interestingly, a yet unidentified RNA was found to be associated with this complex, suggesting that the whole Ro RNP could be involved (2).
Several Y RNA sequences from a variety of organisms have been described (1,3–9). The small RNA molecules are predicted to fold into a conserved secondary structure containing at least three stem structures (Fig. 1A). A small internal loop separates stems 1 and 2, while a larger pyrimidine-rich internal loop is positioned between stems 2 and 3 (10). Stem 1 contains the most highly conserved sequences, corresponding to the Ro60 binding site (11,12). Sequence variations in Y RNAs of different organisms occur mostly in the large internal loop and the third stem structure (1,10).
Figure 1.


Secondary structure of the human Y RNAs and sequence alignment of Y3 and Y4 sequences. (A) Proposed secondary structure of the four different human Y RNAs, adapted from (13). The conserved lower stem structures are boxed. The stem–loop structures are indicated by their abbreviations (stem 1, S1; loop 2, L2; etc.). (B) Sequence alignment of the known Y3 RNA sequences. The conserved regions are boxed. The nucleotide numbering is according to the human sequence. For the pig, dog, cow and duck sequences, the dashed lines mark regions for which no sequence information is available yet. The flanking sequences are missing in these RNAs, because of the use of oligonucleotide primers in their characterization (1). Above the alignment, base pairing occurring in the previously proposed secondary structure of the human Y3 RNA is schematically indicated (S1, S2 and S3). Below the alignment, the base pairing of the hY3 RNA secondary structure derived from the data described in this study is indicated. The dotted lines mark base pairing occurring in only one of the alternative secondary structures (see Fig. 3A). (C) Sequence alignment of the known Y4 RNA sequences. The conserved regions are boxed. The nucleotide numbering is according to the human sequence. For the monkey, cow and dog sequences, the dashed lines at the 5′- and 3′-ends of the sequence (1–16 and 76–93) mark regions for which no sequence information is available yet (1). Above the alignment, base pairing occurring in the previously proposed secondary structure of the human Y4 RNA is schematically indicated (S1, S2 and S3). Below the alignment, the base pairing of the hY4 RNA secondary structure derived from the data described in this study is indicated.
The structures of hY1 and hY5 RNA have been studied most extensively by both enzymatic and chemical probing experiments (13). Hardly any experimental data are available on the structures of hY3 and hY4 RNA, although, as is the case for the hY1 and hY5 RNAs, phylogenetic data (4,5,13), as well as a recently described algorithm (10), support the predicted secondary structures. In order to obtain more knowledge on their structures and possibly more insight into the conservation of structural elements, we set out to determine experimentally the (secondary) structures of Y3 and Y4 RNA from human, frog and iguana via enzymatic and chemical probing experiments. The probing results are compared with computer predictions and combined with phylogenetic data.
MATERIALS AND METHODS
GenBank accession numbers
The Y RNA sequences can be accessed through the following codes: human Y3 K01563; frog Y3 L15431; mouse Y3 U34827; iguana Y3 L27532; cow Y3 U84671; duck Y3 U82125; pig Y3 U84674; dog Y3 U84672; human Y4 L32608; frog Y4 L15432; iguana Y4 L27537; dog Y4 U84669; cow Y4 U84668; monkey Y4 U84670.
In vitro transcription of RNA
The hY RNAs are cloned in the pUC19 vector, containing a DraI site. Linearization with DraI, followed by T7 transcription (14), results in RNA molecules without any additional vector derived nucleotides (as shown in Fig. 1). The frog Y3 and Y4 constructs were a kind gift from Dr S. Wolin. The frog and iguana Y RNA encoding sequences were isolated in a PCR reaction using oligonucleotides containing a T7 promoter site and a DraI site. The constructs were subcloned in pUC19, sequenced and, after DraI digestion, used for transcription.
5′- and 3′-end labeling
Three different methods of end labeling were used in the experiments. 3′-End labeling was achieved via ligating [32P]pCp using T4 RNA ligase (Amersham Pharmacia Biotech) for 1 h at 37°C. 5′-End labeling was either performed as described (14), or during the in vitro transcription using 50 µCi [γ-32P]GTP. The reaction mixture contained 1 µg DNA template, 0.01 µg BSA, 0.01 mM DTE, [γ-32P]GTP and T7 RNA polymerase in a total volume of 50 µl. After a 5 min incubation at 37°C, 0.1 mM of each (unlabeled) nucleotide was added and incubated for 1 h. Each of the labeled products was isolated from a 10% PAA/8 M urea gel.
RNA structure probing
The RNA molecules were subjected to enzymatic cleavage by RNase V1 (dsN, 7 × 10⁻⁴ U/µl, Amersham Pharmacia Biotech), A (ssC and ssU, 1 × 10⁻⁶ U/µl, Amersham Pharmacia Biotech), T1 (ssG, 2 U/µl, Amersham Pharmacia Biotech), and T2 (ssN, 4 × 10⁻³ U/µl, Gibco BRL), under single hit conditions and at 20°C. In all experiments, parallel incubations in which the enzyme was omitted, served as a control for spontaneous RNA breaks. Reaction conditions are essentially as described by Teunissen et al. (14). Probing under denaturing conditions (8 M urea, 1 mM EDTA, 50°C) was performed in order to obtain a sequence ladder.
Chemical probing using DMS, followed by primer extension to determine sites of modification, was performed as described previously (14). The oligonucleotides used in the primer extension reactions were complementary to the following regions: 82–101 (hY3) and 76–94 (hY4).
Secondary structure predictions and sequence alignments
The secondary structure predictions were done with MFOLD version 3.0. The temperature for the predictions was set to 37°C and the percent suboptimality to 50 (no constraints) or 25 (with experimentally determined constraints). The sequence alignments were made using the CLUSTALW V1.7 program (15) and adjusted manually.
RESULTS
The secondary structure predictions and the available phylogenetic and experimental data for the Y RNAs revealed a number of conserved structural elements. Figure 1A shows the proposed secondary structures for the four human RNAs, which are based upon a combination of those data. A general feature of these structures are two highly conserved stem structures (Fig. 1A, stems 1 and 2), which are separated by a small internal loop 1. Loop 2, varying in size from 13 to 36 nt, contains a characteristic pyrimidine stretch (most prominent in Y1 and Y3 RNA). A third stem structure (stem 3) is associated with this internal loop in all Y RNAs (10).
Y3 RNA
The (partial) sequences of Y3 RNA homologs have been determined from eight different organisms so far. An alignment of these sequences (Fig. 1B) shows large clusters of conserved residues (indicated by boxes). The sequences are listed according to the degree of sequence similarity with the human sequence. The mouse sequence only differs by 5 nucleotides from the human sequence and was therefore not analyzed by chemical or enzymatic probing.
hY3 probing
First, in vitro transcribed, 5′-end radiolabeled hY3 RNA was subjected to enzymatic digestion under native conditions with RNase V1 (specific for dsRNA), RNase T2 (ssRNA), RNase T1 (ssG) and RNase A (ssU and ssC). During probing experiments, parallel incubations without RNases were used to detect any spontaneous RNA cleavage products. RNase T1 and/or RNase A digestions under denaturing conditions were included to pinpoint nucleotide positions.
Figure 2A shows the results for probing hY3 RNA with RNase A and RNase V1 under different concentrations of Mg2+. Lanes 6–10 show probing under native conditions (100 mM KCl, 2.5 mM MgCl2) at 20°C and the probing data for these conditions are summarized in Figure 3A. Of the stem structures, stems 1 and 2 are supported by the enzymatic probing data. Stem 2, as can be seen in Figure 2A (lanes 9 and 10), shows almost exclusively RNase V1 cleavages. However, most of the remaining part (nucleotides 21–62) including the stem 3 region is cleaved by both RNase A and RNase V1. The existence of a stable stem 3 under native conditions is therefore not evident.
Figure 2.
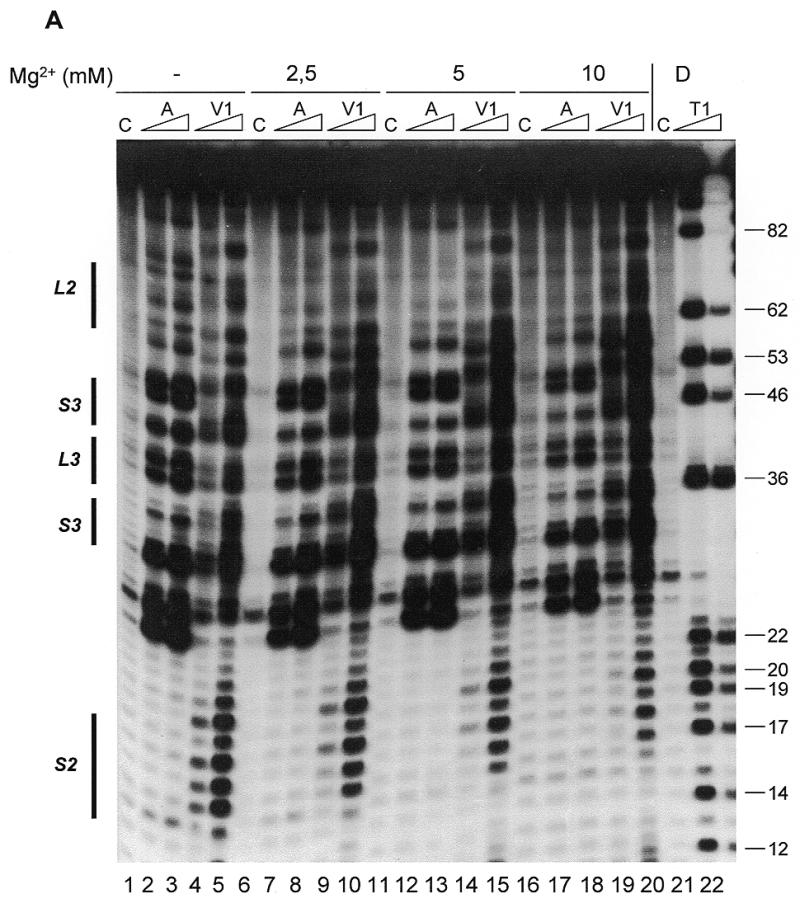
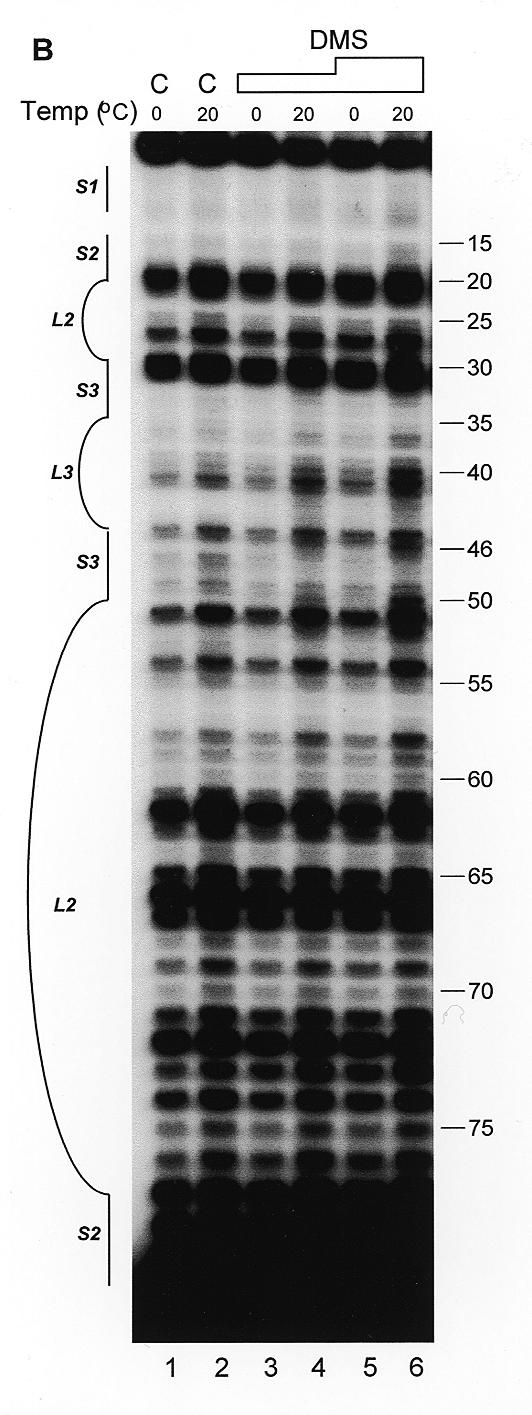
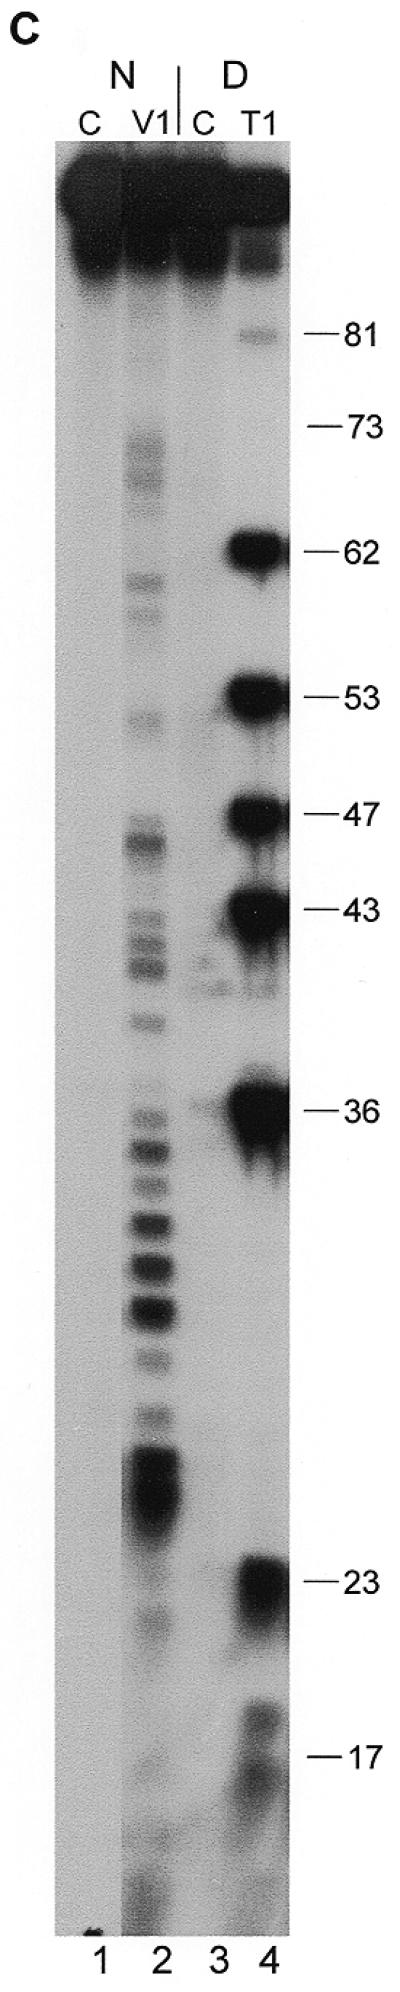
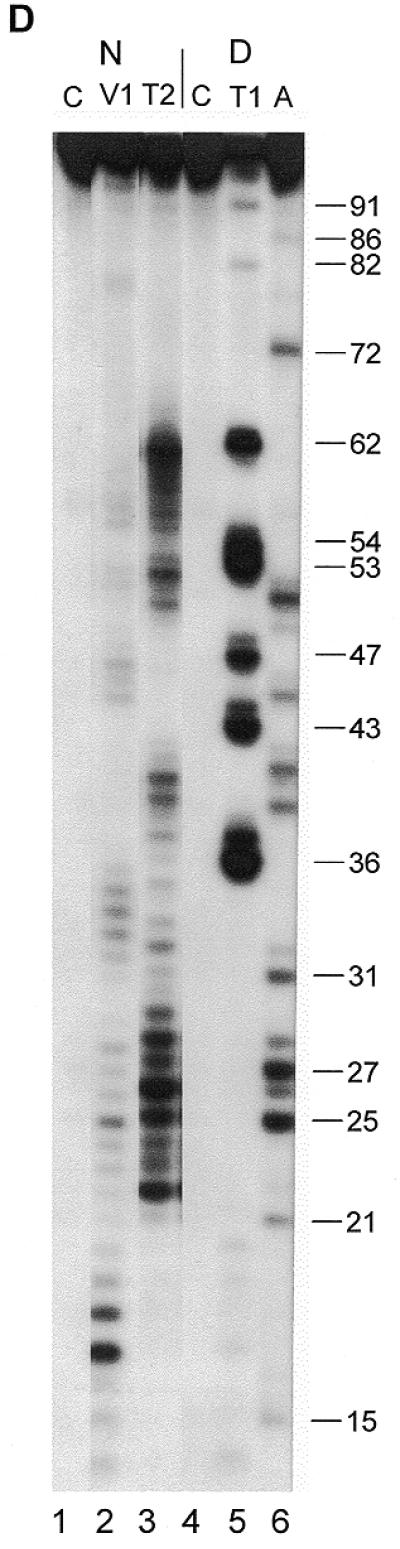
Secondary structure probing experiments on Y3 RNA. (A) Probing experiment on hY3 RNA, using RNase V1 and RNase A under different concentrations of Mg2+. Lanes 1–5 show probing without Mg2+, lanes 2 and 3 using RNase A, lanes 4 and 5 using RNase V1, and lane 1 is a control incubation in which the nuclease was omitted. Similarly, lanes 6–10 show probing under 2.5 mM Mg2+, lanes 11–15 under 5 mM Mg2+, and lanes 16–20 under 10 mM Mg2+ (indicated above the autoradiograph). Lanes 21 and 22 show a denaturing control incubation and an incubation with RNase T1, which are used to pinpoint nucleotide positions (indicated on the right). Note that the RNase V1 cleavage products lack the 3′ phosphate group and therefore migrate slightly slower through the gel. The positions corresponding to the various stem and loop structures as depicted in Figure 1A are shown on the left. Data for the overexposed regions were evaluated using shorter exposures. (B) Probing hY3 RNA with DMS at 0°C (lanes 1, 3 and 5) and 20°C (lanes 2, 4 and 6). Sites of modification were detected using primer extension. Parallel control incubations without DMS were used to detect stops of reverse transcriptase (lanes 1 and 2). The concentration of DMS is increased from lanes 3 and 4 to 5 and 6. Nucleotide positions are indicated on the right. Data for the overexposed regions were evaluated using shorter exposures. (C) Probing experiment on xY3 RNA, using RNase V1 (lane 2). Lane 1 is the control incubation in which the enzyme was omitted. Lanes 3 and 4 show a sequence ladder obtained using RNase T1 (lane 4), under denaturing conditions. Lane 3 is a control incubation. On the right the nucleotide numbering is indicated. (D) Probing experiment on iY3 RNA, using RNase V1 (lane 2) and RNase T2 (lane 3). Lane 1 is the control incubation in which the enzyme was omitted. Lanes 4–6 show a sequence ladder obtained using RNase T1 (lane 5) and RNase A (lane 6), under denaturing conditions. Lane 4 represents the corresponding control incubation. On the right the nucleotide numbering is indicated.
Figure 3.


Summary of Y3 RNA probing data. (A) Summarized results of enzymatic/chemical probing of hY3 RNA, depicted on two alternative secondary structures that were obtained by combining the experimental results with MFOLD predictions. For clarity the single-stranded (RNase T1 in blue, RNase T2 in red and RNase A in green) and double-stranded (RNase V1 in black) data are separately illustrated on the secondary structure drawn on the right, while the DMS data are omitted from the structure on the left. It should be emphasized that for the ‘upper’ part of the molecule additional alternative secondary structures are feasible. The experimental data suggest that at least some of these structures occur simultaneously. Dotted lines represent weak cleavages; open arrowheads indicate moderate cleavages; filled arrowheads indicate strong cleavages (see key). The DMS probing results (20°C) are indicated by circles (dotted line, weak reactivity; bold line, moderate reactivity; filled circle, strong reactivity). Asterisks indicate stops of reverse transcriptase occurring in the control incubations. The oligonucleotide used for reverse transcription is complementary to the region 82–101. (B) Summarized probing data for xY3 (left panel) and iY3 (right panel) depicted on the respective secondary structures that were obtained by combining the experimental results with MFOLD predictions. RNase T2 cleavages are indicated in red and RNase V1 cleavages are indicated in black. Dotted lines represent weak cleavages; moderate cleavages are indicated with open arrowheads; and strong cleavages are indicated by filled arrowheads (see key).
The pyrimidine-rich internal loop (loop 2, see Fig. 1A), is of particular interest in view of its potentially functional relevance. As was previously found by Van Gelder and co-workers (13) for the corresponding region in hY1 RNA, the loop 2 region in hY3 shows only a few, relatively weak RNase A cleavages. A possible explanation for the reduced RNase A sensitivity might be that these nucleotides are involved in the formation of a stable and compact tertiary interaction. Furthermore, hY1 probing experiments revealed that the accessibility of loop 2 was highly dependent on the Mg2+ concentration (S.W.M.Teunissen, unpublished observations). Probing experiments with hY3 RNA using different concentrations of Mg2+ demonstrated a similar behavior for the corresponding region of hY3 RNA (nucleotides 61–74; Fig. 2A). The nucleotides in this region show decreased reactivities with RNase A, especially at 5 and 10 mM Mg2+, while simultaneously the reactivity with RNase V1 is increased. This indeed suggests the formation of a Mg2+ dependent tertiary interaction, in which loop 2 is involved. Outside this region, the effect of Mg2+ is less obvious. Apart from a general stabilization of the RNA molecule in the presence of Mg2+, as shown by the increased RNase V1 cleavages, only C45 appeared to be less accessible for RNase A at higher magnesium concentrations. Unexpectedly, RNase V1 cleavages in stem 1 (nucleotides 1–12) were reduced at higher Mg2+ concentrations (data not shown). Together, these data indicate significant magnesium-dependent structural changes in loop 2 of hY3 RNA.
As described, the region of stem 3 shows both cleavages with ssRNA and dsRNA specific enzymes, which complicates the interpretation. To obtain less ambiguous data on this region we probed hY3 RNA using DMS, both at 0 and 20°C, the results of which are shown in Figure 2B. Residues modified by DMS were detected by reverse transcription using a primer complementary to the most 3′ region of the RNA. As frequently observed for this mode of detection, also in this case there are many spontaneous stops of the reverse transcriptase reaction, both after chemical modification at 0 and 20°C (Fig. 2B, lanes 1 and 2, respectively), which obscured the data for a number of nucleotides. Nevertheless, the results clearly show that at 20°C, many modifications by DMS occurred in predicted double-stranded regions (see Fig. 3A for a summary). The probing results at 0°C generally show a diminished intensity of bands corresponding to modifications, consistent with a general stabilization of base-paired structures, although it should be noted that this may also be caused by a diminished reactivity of DMS at 0°C. Nevertheless, relative differences in reactivities at 0°C were clearly observed. For example, in comparison with nucleotide A40 nucleotide A46 is less intensely modified at 0°C. This indicates that A40 is more likely to be single-stranded and that A46 is located in a double-stranded structure which is not very stable at 20°C, but which is stabilized at lower temperatures.
Since the probing data were not completely consistent with the proposed secondary structure, we decided to calculate a number of alternative secondary structures using MFOLD (16). This analysis was performed both with and without the introduction of constraints based on the experimental data. Only a single secondary structure was obtained when the experimental data were included in the analysis (Fig. 3A, left). However, it is clear that this structure cannot account for the RNase V1 cleavages observed in the ‘upper part’ of hY3 RNA. A variety of secondary structures was obtained when no constraints were included. One of these, which fitted best with the experimental data, in particular the RNase V1 data, is shown in Figure 3A (right). The structure of the conserved stems 1 and 2 including loop 1 is slightly different from the previously proposed structure (compare Figs 1A and 3A). This configuration for loop 1 (nucleotides A87–U90) was predicted in the majority of structures generated by MFOLD. The experimental data, however, do not allow a distinction between the positions of L1 as shown in Figures 1A and 3A, respectively. The existence of stems 1 and 2 is supported by the RNase V1 data. It should be noted that RNase V1 requires a region of at least 2 nucleotides on either side of the hydrolysis site adopting an approximately helical conformation (17). The major differences with the previously proposed structure occur in the loop 2 and stem–loop 3 region, where stable helices do not appear to exist and where probably various structures occur simultaneously in different molecules. It should be stressed that the structures shown in Figure 3A may be two of several conformations in view of the apparent flexibility/heterogeneity. An interesting observation in this respect is that base pairing between G22–U24 and C44–A42 also may occur, which in combination with additional base paired elements, e.g. some of the elements shown in the structure of Figure 3A (right), would lead to the formation of a pseudoknot in (some) hY3 RNA molecules. The existence of base pairing between these residues is further supported by phylogenetic data, as can be seen in Figure 1B.
xY3 probing
We subjected xY3 RNA to enzymatic probing experiments using RNase V1 and RNase T2 to globally assess its secondary structure. An example of probing with RNase V1 is shown in Figure 2C. The cleavages indicate a large number of double-stranded regions, spanning from G17 to U84. These data, together with RNase T2 probing data, are summarized in Figure 3B, left panel.
For xY3 RNA, the MFOLD program calculated several different structures using constraints based on the experimental data and on the evolutionary conservation of the stem 1–loop 1–stem 2 region. The structure that agreed best with all the data is shown in Figure 3B (left). The highly conserved sequence corresponding to stems 1 and 2 in the human structure also form a stem structure interrupted by a small internal loop in xY3 RNA. Interestingly, loop 1 is found at an equivalent position to that in hY3 RNA, but in this case is supported to some extent by the probing data (RNase V1 cleavages at 83–85). However, the remaining part of xY3 shows only a limited degree of similarity to its human counterpart. Nevertheless, in comparison with the secondary structure shown in Figure 3A (right) for hY3 RNA, also in the structure obtained for xY3 RNA a pyrimidine-rich internal loop (L2) and an interrupted stem 3 can be discerned. Moreover, in xY3 a region with ambiguous probing data is also present (nucleotides 25–40); although this phenomenon appears to be less pronounced than in hY3 RNA.
iY3 probing
To obtain more information on possibly conserved secondary structures, iY3 RNA was also subjected to probing with RNase T2 (Fig. 2D, lane 3) and RNase V1 (Fig. 2D, lane 2). The probing data for iY3 RNA are summarized in Figure 3B (right).
Also in this case a secondary structure was generated using MFOLD in combination with constraints based on the experimental data. The most optimal secondary structure of iY3 RNA, which is strongly supported by the probing data, is shown in Figure 3B. Again, an interrupted conserved stem (S1–L1–S2), a pyrimidine-rich internal loop and an interrupted stem 3 are evident. Although in iY3 RNA a region with ambiguous probing data is also observed (nucleotides 22–34), structural heterogeneity appears to be lower than in xY3 and hY3 RNA.
In general, the most conserved secondary structure elements among the Y3 RNAs are stems 1 and 2. These stems are very similar in all three Y3 RNAs probed. Although the experimental data on loop 1 are limited, MFOLD predicts also structural similarity for loop 1 when experimentally derived constraints are incorporated in the analyses. Furthermore, a relatively large pyrimidine-rich loop 2 and a stem–loop 3 of variable stability are found in all of these RNAs. The most striking feature, however, which is most prominent in hY3 RNA, is the presence of a region that is either rather dynamic or adopting several alternative structures.
Y4 RNA
Sequences of six Y4 RNAs have been described (Fig. 1C). Three of these are incomplete (1). The first 25 nucleotides and the 3′-region from 69 to 94 are most highly conserved. These two regions are predicted to form stems 1 and 2 (Fig. 1A) (13). Furthermore, there are two central regions displaying strong sequence conservation, nucleotides 41–45 and 47–53. The frog sequence is 5 nucleotides shorter than the human sequence, while the iguana sequence is 2 nucleotides longer (Fig. 1C). Three Y4 RNAs (from human, frog and iguana) were subjected to enzymatic probing and hY4 RNA was also analyzed by chemical probing using DMS.
hY4 probing
The secondary structure of hY4 RNA was first analyzed with RNases A, T2, T1 and V1. Figure 4A shows an example of enzymatic probing using RNase V1 (lanes 2–4) and RNase A (lanes 5–7). Most regions of hY4 RNA were either recognized by RNase V1, or by RNase A. The 5′ region (nucleotides 1–20) was mainly cleaved by RNase V1, as is the 3′ region between nucleotides 70 and 90. This supports the existence of stems 1 and 2 (Fig. 1A). Nevertheless, as was the case for hY3 RNA, also in hY4 cleavages by both single-strand and double-strand specific enzymes were found in the same regions of the molecule. The hY4 RNA probing data are summarized in Figure 5A.
Figure 4.
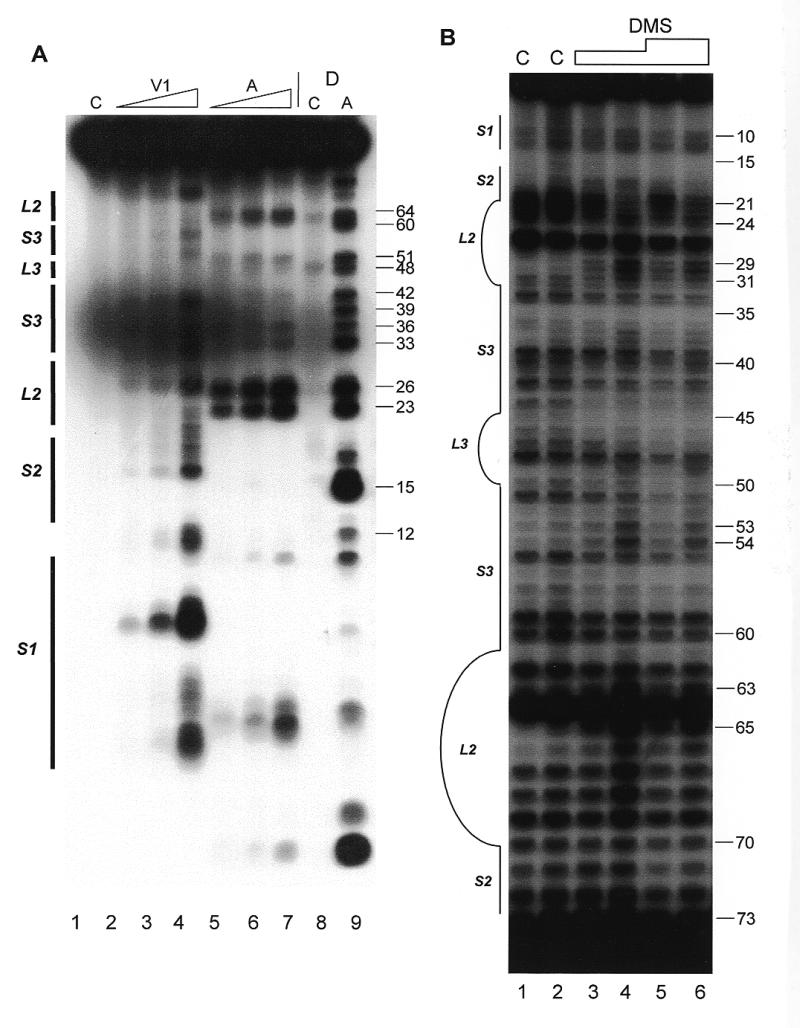
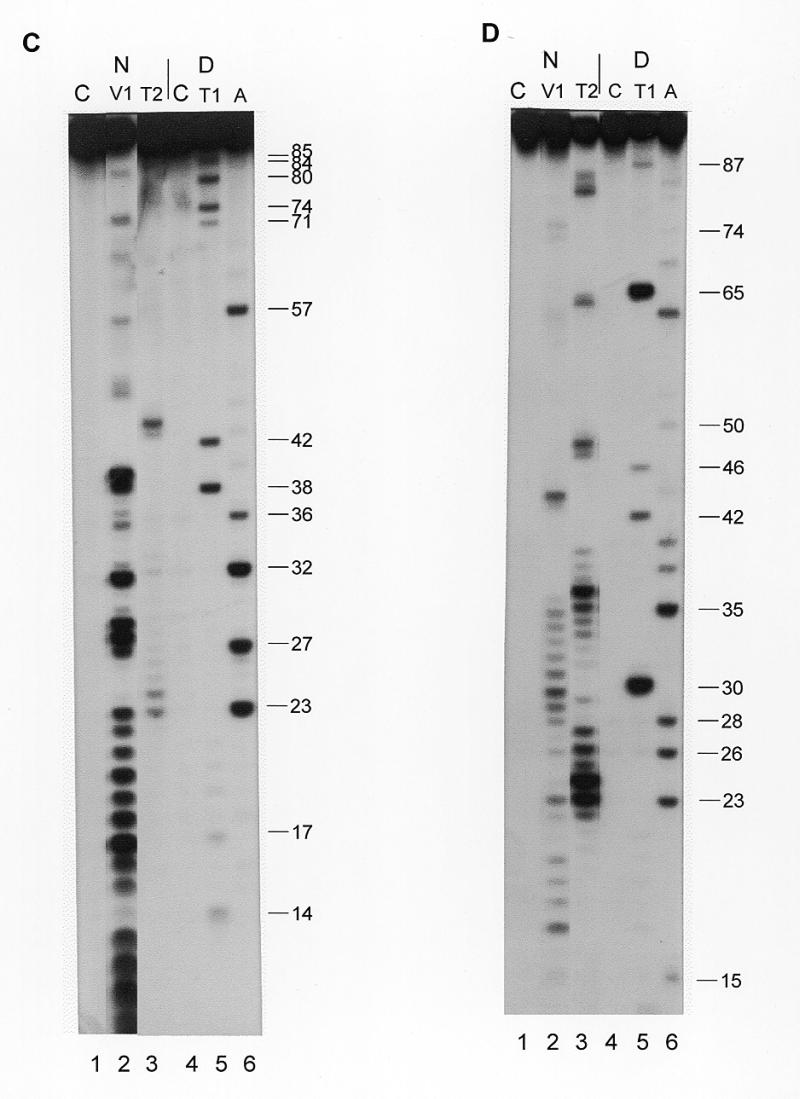
Secondary structure probing experiments on Y4 RNA. (A) Probing experiment on hY4 RNA, using RNase V1 (lanes 2–4, increasing amounts) and RNase A (lanes 5–7, increasing amounts). Lane 1 is a control incubation where RNases were omitted. Lane 8 is a control incubation and lane 9 is an RNase A incubation both under denaturing conditions to generate a sequence ladder. Nucleotide positions are indicated on the right. Note that the RNase V1 cleavage products lack the 3′ phosphate group and therefore migrate slightly slower through the gel. (B) Probing hY4 RNA with DMS at 0°C (lanes 1, 3 and 5) and 20°C (lanes 2, 4 and 6). Sites of modification were detected using primer extension. Parallel control incubations without DMS were used to detect stops of reverse transcriptase (lanes 1 and 2). The concentration of DMS is increased from lanes 3 and 4 to 5 and 6. Nucleotide positions are indicated on the right. (C) Probing experiment on xY4 RNA, using RNase V1 (lane 2) and RNase T2 (lane 3). Lane 1 is the control incubation in which the enzyme was omitted. Lanes 4–6 show a sequence ladder obtained using RNase T1 (lane 5) and RNase A (lane 6), under denaturing conditions. Lane 4 is a control incubation. On the right the nucleotide numbering is indicated. (D) Probing experiment on iY4 RNA, using RNase V1 (lane 2) and RNase T2 (lane 3). Lane 1 is the control incubation in which the enzyme was omitted. Lanes 4–6 show a sequence ladder obtained using RNase T1 (lane 5) and RNase A (lane 6), under denaturing conditions. Lane 4 is a control incubation. On the right the nucleotide numbering is indicated.
Figure 5.
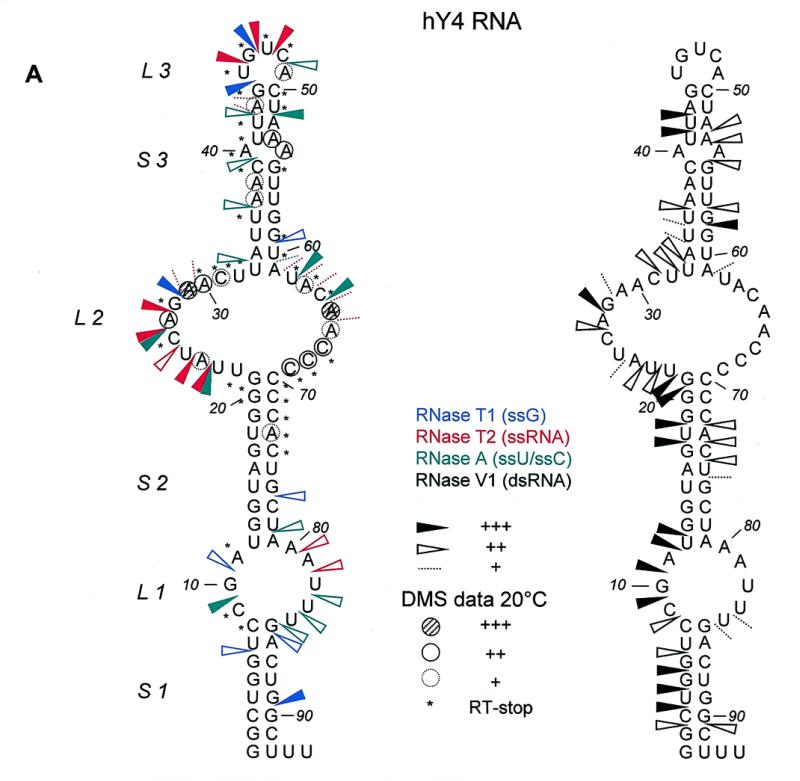
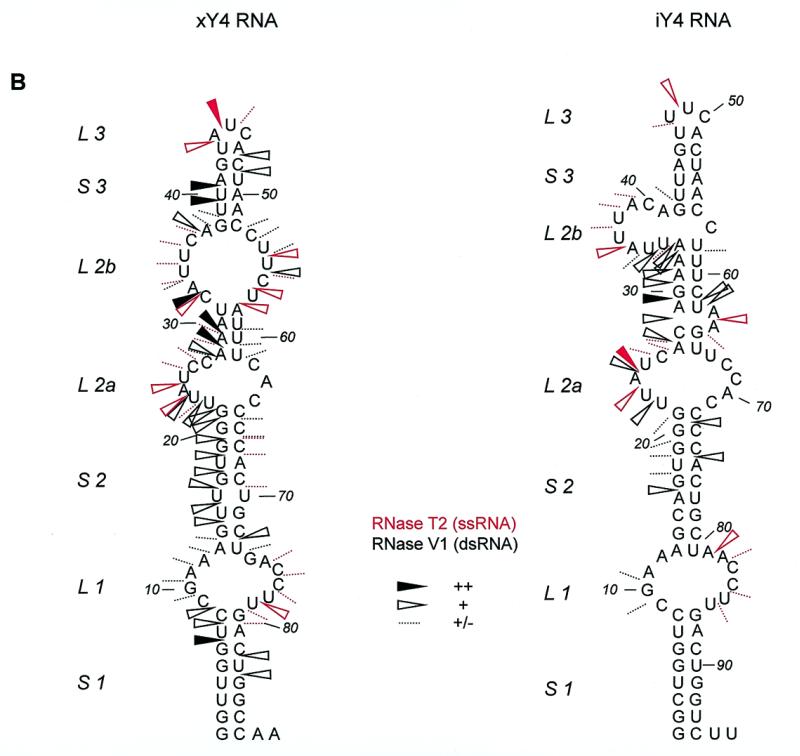
Summary of Y4 RNA probing data. (A) Summarized results of enzymatic/chemical probing on hY4 RNA, depicted on the secondary structure that was obtained by combining the experimental results with MFOLD predictions. For clarity the single-stranded (RNase T1 in blue, RNase T2 in red and RNase A in green) and double-stranded (RNase V1 in black) data are separately illustrated on the secondary structure. It should be emphasized that for large parts of the molecule, e.g. L1 and S3, alternative secondary structures are also feasible. Dotted lines represent weak cleavages, moderate cleavages are indicated by open arrowheads, while strong cleavages are indicated by filled arrowheads (see key). The DMS probing results are indicated by circles (dotted line, weak reactivity; bold line, moderate reactivity; filled circle, strong reactivity). Asterisks indicate stops of reverse transcriptase occurring in the control incubations. The oligonucleotide used for reverse transcription is complementary to the region 76–94. (B) Summarized probing data for xY4 (left panel) and iY4 (right panel) depicted on the respective secondary structures that were obtained by combining the experimental results with MFOLD predictions. RNase T2 cleavages are indicated in red and RNase V1 cleavages are indicated in black. Dotted lines represent weak cleavages; moderate cleavages are indicated with open arrowheads; and strong cleavages are indicated by filled arrowheads (see key).
Using constraints derived from the probing results the MFOLD program generated several secondary structures. The structure which fitted best with the experimental data also had the lowest calculated free energy and is shown in Figure 5A. There are minor changes in the structure shown in Figure 5A compared to the previously proposed structure (Fig. 1A). These changes concern mainly loop 1, which is slightly enlarged, while the bulged C9 residue has disappeared. The new structure is supported by the RNase T1, T2 and A cleavages, but it should be stressed that some of the RNase V1 cleavages are not consistent with this structure, which suggests that structural heterogeneity occurs in this region of hY4 RNA and that the structure shown in Figure 5A may be just one of several possibilities. Note that in stem 3 both single-strand and double-strand specific cleavages were observed, again suggesting that the ‘upper part’ of hY4 RNA also displays some structural heterogeneity/flexibility.
Human Y4 RNA was also subjected to chemical probing using DMS, both at 20 and at 0°C to minimize potential breathing of stem structures. Figure 4B shows the results of such an experiment. The first two lanes are control incubations to detect spontaneous stops of reverse transcriptase, which are also highly prominent for this RNA. Although these stops prevent the derivation of data for many positions, the remaining modifications support the proposed secondary structure. In stems 1 and 2 (nucleotides 1–21/70–92) a weak modification of nucleotide A73 was observed. The large internal loop was accessible to DMS, as illustrated by modification of almost all adenosines and cytosines in the loop. Stem 3 displayed weak modifications at some A-U base pairs. The mismatched A54 was accessible and seemed to open the helical structure, since A53 was also modified. The DMS data are summarized in Figure 5A. At 0°C, all nucleotides were less intensively modified compared to 20°C. A few modifications, however, were significantly diminished at the lower temperature. A24 was not modified at all, while A29–C31, A63 and A65 showed reduced modification efficiencies, suggesting that the accessibility of bases in the loop structure is reduced at the lower temperature, possibly due to base-pairing interactions.
xY4 probing
Figure 4C shows an example of probing xY4 RNA using RNase V1 (lane 2) and RNase T2 (lane 3). Strong RNase V1 cleavages were found in the region up to U23, supporting the formation of the conserved stem structure. Next, a small region shows single-stranded cleavages (nucleotides 24–30), in part overlapping with strong cleavages by RNase V1 (nucleotides 27–32). In the rest of the molecule, two more single-stranded regions are found: U43–U45 and U54–U58. The data are summarized in Figure 5B (left), which displays the MFOLD structure that agreed best with the probing data. In contrast to hY4 RNA the Xenopus Y4 structure contains two internal loops in the L2 region rather than one larger loop. As a consequence, S3 seems to be reduced in size.
iY4 probing
The iguana Y4 RNA was subjected to RNase T2 and RNase V1 probing, as shown in Figure 4D. Strong RNase T2 cleavages were found between 23 and 40, while the strongest RNase V1 cleavages were found between 27 and 34. The data are summarized in Figure 5B (right) using the structure generated by MFOLD by introduction of constraints based on the experimental data. Similar to the xY4 structure, in comparison with the human structure, the internal loop L2 in the iguana structure appears to be changed into two smaller internal loops concomitant with a size reduction of stem 3.
In spite of the differences described above, the three Y4 RNA molecules analyzed showed conserved structural features. Stems 1, 2 and 3 are formed in all three RNAs. The internal loop 1 is structurally very similar in all three RNAs, although as mentioned above, the probing data for this region are rather ambiguous. Finally, at many positions both single-strand and double-strand specific cleavages were observed in all Y4 RNA, in particular in the ‘upper regions’ of the RNAs, which strongly suggests that, like for Y3 RNAs, this region is structurally heterogeneous and/or dynamic.
DISCUSSION
In this study the secondary structures of three Y3 and three Y4 RNAs from different organisms were studied in order to gain insight in the conservation of structural elements. The Y3 and Y4 RNAs from human, iguana and frog were analyzed by enzymatic and chemical probing. As expected the data fully support the formation of the long stem (stem 1 + stem 2) by base pairing of the 5′- and 3′-ends of the RNA in all of these molecules. In this region containing the most highly conserved nucleotides (which are not only conserved among homologous Y RNAs from different species but also among different Y RNAs), the binding site for the Ro60 protein is located (12,18,19), as well as an element important for nuclear export of the Y RNAs (S.A.Rutjes, E.Lund, C.Grimm, W.J.van Venrooij and G.J.M.Pruijn, submitted for publication). More importantly, the present data demonstrate that the less well conserved central parts of the Y3 and Y4 RNAs do at least in part not fold into very stable structural elements under physiological conditions. This suggests that these parts of the molecules are rather dynamic and may transiently adopt various alternative secondary structures. Although both ‘breathing’ of unstable stems and folding into different conformations might occur simultaneously, the DMS probing results and the migration of the RNAs as a single species in native polyacrylamide gels (unpublished results) suggest that ‘breathing’ is the main cause for structural heterogeneity in the central part of the Y RNAs analyzed. Interestingly, this phenomenon does not seem to be restricted to the Y3 and, though to a lesser extent, Y4 RNAs, but is probably also a characteristic feature of the Y1 and Y5 RNAs, since ‘breathing’ of the central regions of the latter RNAs has been proposed previously based upon the results from similar probing experiments with the human Y1 and Y5 RNA (13). Therefore it is highly likely that the central region of all Y RNAs is dynamic in nature and thus is readily available for base pairing interactions with another nucleic acid, which might be important for its function. The stable base paired stem of hY3 RNA (stems 1 and 2) might serve as a ‘handle’ for proteins (e.g. Ro60), while the central part might function as a ‘fishing net’ to catch other molecules based upon its capacity to form (transient) intermolecular base pairs. An attractive, though still rather speculative, target for such an interaction is the family of 5′TOP mRNAs, a family of mRNAs encoding proteins, most, if not all of which play some role in the protein synthesis machinery, as for example ribosomal proteins. It has been established that these proteins are coordinately expressed and that the 5′UTRs of the respective mRNAs play an important role in the regulation of this process. Recently, two factors interacting with such 5′UTRs have been identified, CNBP and the La protein (20,21). In addition the Ro60 as well as a yet unidentified RNA have been demonstrated to be required for these interactions (2). Therefore it is tempting to speculate that a Ro60- (and La-) associated Y RNA is involved in the regulation of translation of 5′TOP mRNAs and that selectivity is in part introduced by a transient base pairing interaction between the central region of a Y RNA and the 5′UTR of the mRNA.
New secondary structure models for the Y3 and Y4 RNAs (Figs 3 and 5) were generated by a combination of the experimental probing results, computer algorithms (MFOLD) and phylogenetic data. Especially for hY3 RNA it appeared to be difficult to generate a structure with many base pairing interactions in the ‘upper part’ of the RNA. Therefore, in Figure 3A two of the most likely alternative structures are shown. Taken together the major differences between the most likely secondary structures of Y3 and Y4 RNAs from different species were found in the central parts of the molecules. This substantiates the idea that the flexibility rather than the structure of this region of Y RNAs is of functional importance and that there is no or only a very limited evolutionary selection pressure on the structural elements that are present in the central parts of the most likely secondary structures.
The probing results for xY3 RNA are in agreement with previously published chemical probing data (12). In this study strong reactivities with DMS and DEPC were observed at C9, C25, C27, C28, A29, A32, A33, A50, C51 and A52. All except one of these residues is positioned in a single-stranded region of the secondary structure shown in Figure 3B.
Recently, a novel RNA secondary structure comparison algorithm, the suboptimal RNA analysis program (SORA), has been developed and has been used in finding phylogenetically conserved secondary structure models for the Y1, Y3 and Y4 RNAs (10). Most interestingly, the SORA solution structures for the stem 1–stem 2 region of hY3 and hY4 RNA are almost completely identical to the experimentally derived structures described in the present study. In addition, SORA predicted the presence of a relatively large internal loop in both Y3 and Y4 RNA in the loop 2 region, which is in agreement with the absence of a very stable secondary structure element in this region of these molecules. Finally, the structure of the stem–loop 3 region predicted by SORA either does not or only poorly corresponds to that derived in the present study. However, we should stress that the experimental probing data for this region are rather ambiguous and, as noted above, might be the cumulative results for a number of several alternative structures that exist in solution under the conditions of the probing experiments.
Since all structure probing experiments were performed in vitro in the absence of the proteins that associate with the Y RNAs in cells, we cannot exclude that protein binding may have some effect on the structure of the Y RNAs. In fact, it has recently been shown that subtle structural changes may occur in stem 1–loop 1–stem 2 region of xY3 RNA upon binding of the Ro60 protein (12). In addition to structural changes caused by protein binding, a bound protein may also stabilize a particular structural element that, in the absence of protein, exists in equilibrium with an alternative structure. Whether such phenomena occur in the dynamic central region of Y RNAs awaits the identification and characterization of proteins binding to this region, which may not exist at all.
We have obtained experimental evidence for conserved structural features between Y RNAs of different organisms. It was shown that the most highly conserved sequences also form conserved structural elements. Furthermore, we found that a flexible part of the RNA is also a conserved feature (rather than a conserved structure). This might indicate which regions are important for the function of the molecule. Future studies at the three-dimensional level will ultimately give evidence for structurally conserved elements and show which nucleotides are important for structure formation and hence, for function.
Acknowledgments
ACKNOWLEDGEMENTS
We thank Dr S. Wolin (Yale University School of Medicine, New Haven, CT) for kindly providing Xenopus Y3 and Y4 RNA constructs. This work was supported in part by the Netherlands Foundation for Chemical Research (SON) with financial aid from the Netherlands Organization for Scientific Research (NWO).
REFERENCES
- 1.Pruijn G.J.M., Simons,F.H.M. and Van Venrooij,W.J. (1997) Eur. J. Cell Biol., 74, 123–132. [PubMed] [Google Scholar]
- 2.Pellizzoni L., Lotti,F., Rutjes,S.A. and Pierandrei-Amaldi,P. (1998) J. Mol. Biol., 281, 593–608. [DOI] [PubMed] [Google Scholar]
- 3.Van Horn D.J., Eisenberg,D., O’Brien,C.A. and Wolin,S.L. (1995) RNA, 1, 293–303. [PMC free article] [PubMed] [Google Scholar]
- 4.Farris A.D., O’Brien,C.A. and Harley,J.B. (1995) Gene, 154, 193–198. [DOI] [PubMed] [Google Scholar]
- 5.O’Brien C.A., Margelot,K. and Wolin,S.L. (1993) Proc. Natl Acad. Sci. USA, 90, 7250–7254. [DOI] [PMC free article] [PubMed] [Google Scholar]
- 6.Pruijn G.J., Wingens,P.A., Peters,S.L., Thijssen,J.P. and Van Venrooij,W.J. (1993) Biochim. Biophys. Acta, 1216, 395–401. [DOI] [PubMed] [Google Scholar]
- 7.Itoh Y., Kriet,J.D. and Reichlin,M. (1990) Arthritis Rheum., 33, 1815–1821. [DOI] [PubMed] [Google Scholar]
- 8.O’Brien C.A. and Harley,J.B. (1990) EMBO J., 9, 3683–3689. [DOI] [PMC free article] [PubMed] [Google Scholar]
- 9.Wolin S.L. and Steitz,J.A. (1983) Cell, 32, 744x. [Google Scholar]
- 10.Farris A.D., Koelsch,G., Pruijn,G.J.M., Van Venrooij,W.J. and Harley,J.B. (1999) Nucleic Acids Res., 27, 1070–1078. [DOI] [PMC free article] [PubMed] [Google Scholar]
- 11.Deutscher S.L., Harley,J.B. and Keene,J.D. (1988) Proc. Natl Acad. Sci. USA, 85, 9479–9483. [DOI] [PMC free article] [PubMed] [Google Scholar]
- 12.Green C.D., Long,K.S., Shi,H. and Wolin,S.L. (1998) RNA, 4, 750–765. [DOI] [PMC free article] [PubMed] [Google Scholar]
- 13.Van Gelder C.W., Thijssen,J.P., Klaassen,E.C., Sturchler,C., Krol,A., Van Venrooij,W.J. and Pruijn,G.J. (1994) Nucleic Acids Res., 22, 2498–2506. [DOI] [PMC free article] [PubMed] [Google Scholar]
- 14.Teunissen S.W.M., van Gelder,C.W.G. and Van Venrooij,W.J. (1997) Biochemistry, 36, 1782–1789. [DOI] [PubMed] [Google Scholar]
- 15.Thompson J.D., Higgins,D.G. and Gibson,T.J. (1994) Nucleic Acids Res., 22, 4673–4680. [DOI] [PMC free article] [PubMed] [Google Scholar]
- 16.Zuker M. (1989) Science, 244, 48–52. [DOI] [PubMed] [Google Scholar]
- 17.Lowman H.B. and Draper,D.E. (1986) J. Biol. Chem., 261, 5396–5403. [PubMed] [Google Scholar]
- 18.Wolin S.L. and Steitz,J.A. (1984) Proc. Natl Acad. Sci. USA, 81, 1996–2000. [DOI] [PMC free article] [PubMed] [Google Scholar]
- 19.Pruijn G.J., Slobbe,R.L. and Van Venrooij,W.J. (1991) Nucleic Acids Res., 19, 5173–5180. [DOI] [PMC free article] [PubMed] [Google Scholar]
- 20.Pellizzoni L., Cardinali,B., Lin Marq,N., Mercanti,D. and Pierandrei Amaldi,P. (1996) J. Mol. Biol., 259, 904–915. [DOI] [PubMed] [Google Scholar]
- 21.Pellizzoni L., Lotti,F., Maras,B. and Pierandrei Amaldi,P. (1997) J. Mol. Biol., 267, 264–275. [DOI] [PubMed] [Google Scholar]