

Abstract
We demonstrate here that replacing potassium chloride (KCl) with potassium acetate (KAc) or potassium glutamate (KGlu) routinely enhances the yield of RNA intermediates and products obtained from in vitro splicing reactions performed in HeLa cell nuclear extract. This effect was reproducibly observed with multiple splicing substrates. The enhanced yields are at least partially due to stabilization of splicing precursors and products in the KAc and KGlu reactions. This stabilization relative to KCl reactions was greatest with KGlu and was observed over an extended potassium concentration range. The RNA stability differences could not be attributed to heavy metal contamination of the KCl, since ultrapure preparations of this salt yielded similar results. After testing various methods for altering the salts, we found that substitution of KAc or KGlu for KCl and MgAc2 for MgCl2 in splicing reactions is the simplest and most effective. Since the conditions defined here more closely mimic in vivo ionic concentrations, they may permit the study of more weakly spliced substrates, as well as facilitate more detailed analyses of spliceosome structure and function.
INTRODUCTION
During development of in vitro splicing assays it was shown that the mammalian reactions were very dependent on the concentration of potassium chloride (KCl), with an optimum around 50 mM (1–4). Since that time, published splicing protocols have varied little, often calling for 40–60 mM KCl (5,6). Similar to other multicomponent systems such as in vitro replication (7), transcription (8–10) and translation (11), higher KCl concentrations generally lead to marked decreases in splicing activity (1–4). In the former systems it has been documented that the optimal potassium concentration is actually much higher than the optimal chloride concentration. For instance, for in vitro protein synthesis in HeLa and L cell extracts, the optimum potassium concentration was considerably lower with chloride as the counterion than with acetate; significantly more protein was produced at the potassium acetate (KAc) optimum (130 mM) than at the KCl optimum (75 mM) (11). Alteration of the potassium counterion can produce ionic concentrations more closely resembling those in vivo. In HeLa cells intracellular potassium reportedly ranges from ~130 to 210 mM and varies according to cell growth conditions (12–14), whereas chloride is much lower at ~5–70 mM (12–14). This difference between potassium and chloride concentrations is compensated for in vivo by the presence of other negatively charged species such as acetate, glutamate, phosphate and nucleic acids. In fact, the high salt inhibition observed in many multicomponent systems is generally attributed to chloride concentrations that exceed those found in vivo (7–11).
Even though it has been known for some time that the optimal potassium and chloride concentrations differ in other systems, to our knowledge no systematic analysis of the effects of salts other than KCl and magnesium chloride (MgCl2) have been reported for in vitro splicing in mammalian cell extracts. Although some alternatively spliced substrates have been shown to require modified ionic conditions (15–18), only one of those studies specifically looked at the effects of KCl. Black (18) noted that while neuron-specific c-src substrates were inefficiently spliced in KCl, substituting potassium glutamate (KGlu) resulted in strong splicing enhancement. This suggests that alternative salts should be examined for other in vitro splicing substrates.
We report here that substituting KAc or KGlu for KCl, and magnesium acetate (MgAc2) for MgCl2 significantly enhances product yields from bimolecular exon ligation reactions (19), as well as those of multiple full-length mammalian pre-mRNA substrates. Much of the apparent splicing enhancement is due to RNA stabilization by KAc and KGlu. Moreover, when KAc or KGlu were substituted for KCl, resulting in conditions more closely resembling in vivo ion concentrations, the optimum potassium concentration for splicing increased.
MATERIALS AND METHODS
Nuclear extract preparation
HeLa cells for nuclear extracts were purchased from the National Cell Culture Center at Cellex Biosciences, Minneapolis, MN, and received by overnight delivery as cell pellets on wet ice (generally from 20–40 liters of cells). Extract preparations followed the standard protocol (2,20) with modifications as described (21,22). These included an altered osmotic lysis protocol in which nuclei were gently resuspended in half the packed nuclei volume of Buffer C (20 mM Tris pH 7.9 at 4°C, 25% glycerol, 1.5 mM MgCl2, 0.2 mM PMSF, 0.5 mM DTT, 0.02 M KCl). This was then stirred gently at 4°C, as half the packed nuclei volume of nuclear extract Buffer D (same as Buffer C except 1.2 M KCl) was added dropwise, resulting in a final concentration of 0.3 M KCl. After this addition, nuclei were stirred for a further 30 min at 4°C and then spun at 10 000 r.p.m. in a Beckman JA20 rotor for 30 min. The supernatant was then dialyzed for 5 h at 4°C against 50 vol of Buffer E (20 mM Tris pH 7.9 at 4°C, 20% glycerol, 0.1 M KCl, 0.2 M EDTA, 0.5 M DTT), as described in previous protocols (20–22). In addition, to achieve 80–90% cell lysis by douncing, we generally use 150–200 strokes with the tight pestle, whereas standard protocols call for only 10–15 strokes. Nuclear extract protein concentrations were typically in the range of 20–25 mg/ml.
Secondary micro-dialyses were performed at 4°C for 5 h using a Spectrapor microdialyzer (Spectrum, Laguna Hills, CA) with a SpectraPor CE (500 Da MWCO) membrane against a 50-fold excess of Buffer E containing KAc, KGlu or KCl, as noted.
Plasmids and transcription
DNA templates for in vitro transcription of AdML derivatives were generated from plasmids pAdMLpar (pHMS81) and pAdMLΔAG (pHMS106) as described (19,23). pAdMLpar and pAdMLΔAG were linearized with BamHI and used as templates for the full-length substrate and for accumulation of splicing complexes, respectively. The 5′ and 3′ substrates for lariat formation and bimolecular exon ligation were created by PCR using primers complementary to either pAdMLpar (3′ substrate) or pAdMLΔAG (5′ substrate) as in Anderson and Moore (19). The 5′ primers contained T7 promoter sequences (24,25). Templates for the β-globin substrate were derived from EcoRI-digested pBSAL4 (26); α-tropomyosin substrates were derived from the pGC-DX plasmid linearized with BamHI (27). GpppG-capped RNA substrates were transcribed with T7, T3 or SP6 RNA polymerase, dependent on the promoter, and were internally labeled with [α-32P]UTP except where noted. Transcription reactions followed the standard protocol as described (28).
Splicing reactions
Except where noted, splicing reactions contained 40% (v/v) HeLa nuclear extract, 80 mM KCl, KAc or KGlu, 2 mM MgCl2 or MgAc2, 1 mM ATP, 5 mM creatine phosphate, 0.2 mg/ml tRNA and ~50 000 c.p.m. (~20 fmol) radiolabeled pre-mRNA substrate per reaction. Stock KAc and KGlu solutions were pH 7.5. Reactions were incubated at 30°C in 10 or 25 µl ali-quots. After incubation, reactions were quenched with 10 vol of a splicing stop buffer (100 mM Tris pH 7.5, 10 mM EDTA, 1% SDS, 150 mM NaCl, 300 mM NaAc), phenol/chloroform/isoamyl alcohol extracted and the RNAs ethanol precipitated. RNAs were separated by denaturing polyacrylamide gel electrophoresis (15% or 8%, 29:1 crosslinking) and visualized and quantified using a Molecular Dynamics PhosphorImager and the ImageQuant software package. For quantification, each species was first normalized by subtracting the local background and then dividing by the number of Us in that species (all substrates were internally labeled with [α-32P]UTP). The percentage of first step products was calculated by dividing the sum of all first and second step species by the total of all species in the lane. Similarly, the percentage of second step products was calculated by dividing second step species only (ligated exons and lariat product) by the total of all species in the lane.
Splicing complexes
Native gels were prepared as previously described (29) using a tris/glycine buffer system and 4% (80:1) polyacrylamide. Splicing reactions for native gels were carried out as above, except that reactions were quenched on ice, and then heparin added to a final concentration of 0.5 mg/ml followed by incubation at 30°C for an additional 5 min. Each aliquot was then centrifuged at 14 000 r.p.m. in an Eppendorf microcentrifuge for 1 min at 4°C before being loaded directly onto a pre-run native gel. Native gels were run at 250 V at room temperature for ~4 h.
RESULTS AND DISCUSSION
In our laboratory nuclear extracts are prepared according to the protocol of Dignam et al. (20), with modifications described by Abmayr et al. (21) and Abmayr and Workman (22). The final step is a 5 h dialysis against 50 vol of Buffer E (see Materials and Methods) containing 100 mM KCl. New extracts are routinely titrated to determine optimal KCl and MgCl2 concentrations and proportion of nuclear extract for in vitro splicing (generally 60–80 mM, 2 mM and 40%, respectively). The optimal conditions for the three extracts used here were 2 mM MgCl2 and 40% nuclear extract, with little difference in splicing efficiency between 50 and 80 mM KCl. At KCl concentrations >80 mM, however, splicing became increasingly less efficient. Since 80 mM KCl was at the boundary of admissible KCl concentrations, we chose this concentration for this study.
Substitution of acetate or glutamate for chloride improves bimolecular exon ligation efficiency
The bimolecular exon ligation assay developed in this laboratory (19) is a convenient system for studying the second step of splicing independent from the first (30). In this assay, spliceosome assembly and lariat formation occur on an RNA derived from AdML (the 5′ substrate) consisting of a 5′ exon and intron terminated downstream of the branch site and polypyrimidine tract. Exon ligation is initiated by subsequent addition of a second RNA (the 3′ substrate) containing the 3′ splice site YAG consensus (where Y denotes pyrimidine) and a downstream 3′ exon. A caveat of this assay however, is that lariat formation on the truncated 5′ substrate (see below) is relatively inefficient. We therefore wanted to identify conditions that would improve the splicing efficiency of our bimolecular reactions. This led us to test the effects of the alternate potassium counterions, acetate and glutamate.
To monitor bimolecular exon ligation, unlabeled 5′ substrate was pre-incubated under splicing conditions for 30 min to accumulate splicing complexes that had undergone the first step; exon ligation was initiated by subsequent addition of radiolabeled 3′ substrate and continued for 90 min thereafter (Fig. 1A). Initially we exchanged the potassium counterion by micro-dialysis of KCl-containing nuclear extracts against the final dialysis buffer (Buffer E; see Materials and Methods) in which KCl had been substituted with either KAc or KGlu. Dialyses were carried out at 4°C for 5 h against a 50-fold excess of buffer. Additionally, KAc or KGlu and MgAc2 were used to adjust ion concentrations to desired levels in the splicing reactions. Although it is unlikely that the chloride contributed by 2 mM MgCl2 significantly affects splicing efficiency, MgAc2 was substituted for the sake of consistency. Using these conditions, we observed significant improvement in exon ligation efficiency in acetate or glutamate reactions over chloride reactions (Fig. 1A). Furthermore, substitution of acetate or glutamate appeared to alleviate 3′ end degradation of both the 3′ substrate and ligated exon product, which results in ever increasing substrate and product mobility as the reaction proceeds (Fig. 1A, left).
Figure 1.

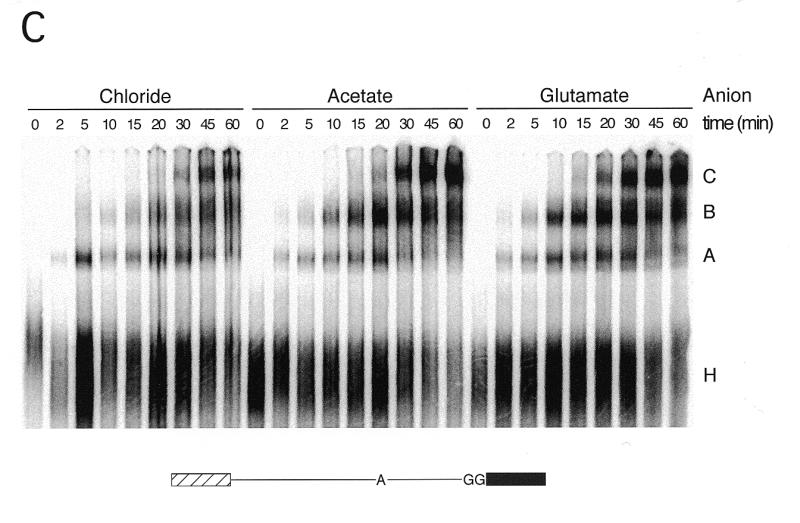
Comparison of first and second step product yields and splicing complexes in chloride, acetate and glutamate. (A) Splicing timecourses using the bimolecular exon ligation assay (19) to monitor the second step of splicing (exon ligation) independent of lariat formation (see text). The 5′ substrate (35 nM) was pre-incubated at 30°C for 30 min, and then bimolecular exon ligation initiated by addition of 3′ substrate (175 nM) and incubation continued for the times indicated. Splicing reactions followed standard conditions (80 mM potassium) using either an undialyzed, chloride extract or extracts dialyzed against KAc or KGlu Buffer E. KAc or KGlu and MgAc2 were substituted for KCl and MgCl2 where appropriate. 3′ substrate (lower; light exposure) and ligated exon product (upper; dark exposure) are indicated to the left of the gel. Percent ligated exon product versus time is shown graphically to the right. Calculations were performed as described in Materials and Methods. (B) Splicing timecourses using a truncated derivative of pAdMLΔAG that can only perform lariat formation (see text) (19). Splicing conditions were identical to those described for (A). Lariat product and 5′ substrate are indicated to the left of the gel. Percent lariat formation is shown graphically to the right. (C) Native gel showing splicing complex formation in reactions containing chloride, acetate or glutamate. Use of a modified full-length AdML substrate with a mutated 3′ splice site (bottom) allowed accumulation of intermediate-containing C complex spliceosomes. All splicing reactions were incubated under standard splicing conditions except that KAc or KGlu were substituted for KCl and MgAc2 for MgCl2 where indicated using the partial substitution conditions (see Results and Fig. 5).
To determine whether acetate or glutamate substitution had similar effects on lariat formation (first step) we used the 5′ substrate construct described above (Fig. 1B). Again, an improvement in first step efficiency was observed for both the acetate and glutamate reactions. Interestingly, substitution by KAc seemed to have a more pronounced effect on the first step of splicing (lariat formation; Fig. 1B, right), while substitution by KGlu more significantly enhanced the second step (exon ligation; Fig. 1A, right). Whereas the experiments in Figure 1 combined micro-dialyzed extracts with potassium counterion replacement in the splicing reactions, we later found that simply substituting KAc or KGlu and MgAc2 for KCl and MgCl2, resepectively, in splicing reactions containing chloride nuclear extract gave comparable results (see Fig. 5). All subsequent experiments used these partial substitution conditions.
Figure 5.

Partial substitution of chloride with acetate or glutamate yields levels of spliced product comparable to microdialysis. Using a full-length AdML substrate, splicing was compared under the following conditions: (I) chloride nuclear extract with additional KCl and MgCl2 in the splicing buffer; (II) chloride nuclear extract with KAc and MgAc2 in the splicing buffer; and (III) acetate nuclear extract with KAc and MgAc2 in the splicing buffer. The percentage of first step products shown to the right was calculated as described in Materials and Methods.
To further examine the apparent splicing enhancement, we used native gel electrophoresis (29) to compare splicing complex formation in splicing reactions in which the potassium concentration was adjusted with KCl, KAc or KGlu (Fig. 1C). Splicing complexes were assembled on a derivative of the AdML pre-mRNA (AdMLΔAG) in which the 3′ splice site had been mutated from AG to GG (19,23); this mutation results in accumulation of intermediate-containing C complex spliceosomes. Consistent with the results of the splicing assays in Figure 1A and B, significantly higher levels of B and C complexes were observed in reactions containing KAc or KGlu instead of KCl.
Some laboratories use 2.5–2.6% polyvinyl alcohol (PVA) for volume exclusion to increase the splicing efficiency of in vitro reactions (2,6). Therefore we also tested this additive in the presence of KCl, KAc or KGlu. In our hands, however, inclusion of 2.6% PVA (Sigma) in splicing reactions routinely lowered splicing efficiencies regardless of the potassium counterion used (data not shown).
Effects of glutamate versus chloride on RNA degradation
Throughout the course of this investigation it appeared that the splicing enhancement observed with KAc or KGlu was accompanied by a reduction in overall RNA degradation, particularly for KGlu (note Fig. 1A and B). To quantify this phenomenon, we averaged the data from several different splicing timecourses using the full-length AdML pre-mRNA substrate. For these quantifications, the amount of pre-mRNA present at the initial time point (0 min) was considered to reflect the total input RNA added to each aliquot. The percent of RNA remaining at later times was calculated by dividing the total of all bands representing the intact pre-mRNA, splicing intermediates and products by the amount of input RNA present at 0 min. In some reactions (as in Fig. 2A), a kinased DNA oligo was also added to the splicing stop buffer to allow normalization for any differences in pipetting.
Figure 2.

RNA degradation is reduced by substitution of KGlu for KCl. (A) A representative denaturing polyacrylamide gel used for determining RNA stability in chloride versus glutamate. Full-length AdML pre-mRNA was incubated according to standard splicing conditions, and KGlu and MgAc2 were substituted for KCl and MgCl2 using partial substitution. Reactions were incubated for the times shown and splicing products and intermediates are indicated to the left of the gel. The kinased DNA oligo indicated at the bottom of the gel was added to the splicing stop buffer to allow normalization for pipetting differences. (B) Data were averaged from three splicing timecourses of full-length AdML [as described in (A)]. The percent of input RNA (I) remaining at each time point was calculated as described in the text. Error bars represent standard deviations.
This analysis (Fig. 2B) clearly showed that whereas RNA degradation in the KGlu reactions was minimal, only ~30–40% of the input RNA remained in the KCl reactions after 90 min. It was possible that the increased degradation observed in the KCl reactions resulted from the trace heavy metals present in the KCl (from Fisher) used in the original experiments. To address this, we compared ultrapure KCl from two different companies (Aldrich and AlfaAesar) to the Fisher KCl (Fig. 3). Although the Aldrich KCl did yield somewhat higher levels of splicing intermediates and products (Fig. 3, right), increased degradation (particularly of the pre-mRNA) was still apparent with this preparation compared to KAc or KGlu. The AlfaAesar ultrapure KCl gave results roughly comparable to the Fisher KCl.
Figure 3.

Splicing timecourses comparing ultrapure KCl (Aldrich and AlfaAesar) to standard KCl (Fisher), KAc and KGlu. Full-length AdML substrate was incubated under standard splicing conditions (80 mM potassium) using partial substitution to add the various potassium counterions. Splicing time points were 0, 15, 30, 60 and 90 min. RNA species are indicated to the left of the gel. Observed amounts of ligated exon product versus time are shown to the right. Values for ligated exon product represent raw counts taken from the PhosphorImager volume report. The asterisk (*) indicates that this point was discounted because lane 4 was clearly overloaded.
The above results indicate that the lower RNA stability observed in the KCl reactions is unlikely due to heavy metal ion contamination. Rather, since chloride is a known inhibitor of protein/nucleic acid interactions (7–11), the differences between reactions containing KAc or KGlu versus 80 mM KCl are more likely attributable to increased binding of proteins (either spliceosomal or other; e.g. hnRNP proteins) to the RNA species in the KAc and KGlu reactions. This is consistent with the enhanced complex formation and complex stability observed in both KAc and KGlu reactions (Fig. 1C). Thus it is likely that increased RNA stability is a significant component of the apparent splicing enhancement.
Acetate or glutamate substitution increases product yields with multiple substrates
To test whether the increased yields of splicing intermediates and products observed with KAc and KGlu was specific to the AdML pre-mRNA or a more general effect, the same ionic conditions were tested for other full-length splicing substrates. The partial substitution conditions were used for splicing reactions containing either a derivative of the rabbit β-globin second intron (26) which, like AdML, splices quite efficiently under standard conditions, or a derivative of the second intron of human α-tropomyosin (27), a less efficient splicing substrate. As observed with AdML, reducing the amount of chloride by substituting KAc or KGlu for KCl in the splicing reaction significantly enhanced the stability of both β-globin and α-tropomyosin RNAs and improved their apparent splicing efficiencies (Fig. 4A and B). This suggests that especially for poorly spliced substrates, reduction of the chloride concentration in splicing reactions using acetate or glutamate might be highly advantageous.
Figure 4.

Substitution of KAc or KGlu for KCl improves spliced product yield for substrates other than AdML. Splicing timecourses with substrates containing derivatives of the (A) human α-tropomyosin intron 2 (27) or (B) rabbit β-globin intron 2 (26). For these experiments, the partial substitution conditions were used and standard splicing conditions were otherwise followed. Splicing time points for α-tropomyosin pre-mRNA (A) were 0, 15, 30, 60, 90, 120 and 180 min. Splicing time points for β-globin (B) were 0, 15, 30, 60, 90 and 150 min. RNA species were separated on 8% (29:1) polyacrylamide gels. Splicing intermediates and products are as indicated to the sides of the gels.
Partial substitution of chloride by acetate or glutamate is sufficient for splicing enhancement
Since microdialysis of nuclear extracts improved splicing efficiency and RNA stability, it seemed possible that substituting KAc or KGlu for KCl during the nuclear extract prep, thereby eliminating chloride altogether, might yield similar results. We therefore tried replacing KCl with KAc or KGlu in all of the buffers of the nuclear extract prep, or in the final dialysis buffer only. However, the extracts prepared with these buffers exhibited very little or no splicing activity (data not shown), clearly demonstrating that chloride is necessary for all steps of the nuclear extract prep including the dialysis. In addition, we found that extending the secondary dialysis against Buffer E containing KCl, KAc or KGlu from 5 h to overnight was not effective, because extracts tended to lose activity after extended incubations at 4°C (data not shown).
Although exchanging potassium counterions by secondary microdialysis of the nuclear extract was an effective way to improve splicing product yields (see Fig. 1A and B), it seemed likely that low chloride concentrations might be tolerated since intracellular chloride ranges from ~5 to 70 mM (12–14). We therefore tested whether simply decreasing the chloride concentration in splicing reactions might suffice. To do so, we compared three different splicing conditions (Fig. 5): an all-chloride reaction (I), using the undialyzed, KCl nuclear extract plus KCl and MgCl2 in the splicing buffer (84 mM final chloride concentration); a partial substitution reaction (II) using the undialyzed KCl nuclear extract and substituting KAc for KCl and MgAc2 for MgCl2 in the splicing buffer (40 mM final chloride concentration); and an all-acetate reaction (III) using a KAc-dialyzed nuclear extract plus KAc and MgAc2 in the splicing buffer [ca. 1 mM final chloride concentration (from residual KCl in the nuclear extract that had been dialyzed against 50 vol of KAc Buffer E)]. The partial substitution conditions (II) and the all-acetate reaction (III) gave comparable results, and both yielded significantly more spliced RNA than the all-chloride reaction (I). Similar results were obtained with KGlu (data not shown). Therefore, simply lowering the chloride concentration in splicing reactions (while maintaining the potassium concentration—see below) is apparently sufficient to enhance product yields.
Spliced product yields are further improved at even higher KAc or KGlu concentrations
The partial substitution conditions provided a means of analyzing the effects of increasing potassium concentrations while maintaining the chloride at 40 mM (from the 40% nuclear extract in the splicing reactions). In the above experiments, the potassium concentration was 80 mM, but intracellularly, potassium concentrations range from 130 to 230 mM (12–14). For in vitro protein synthesis assays in HeLa and L cell extracts the optimum potassium concentration is much lower in the presence of chloride (75 mM) than in the presence of acetate (130 mM) (11). Moreover, 20% more protein was produced at the KAc optimum than at the KCl optimum (11). To test whether this was also true for in vitro splicing assays, potassium concentrations were titrated in reactions containing the AdMLΔAG RNA (19,23). Although first step splicing efficiencies at the lowest potassium concentrations were comparable, splicing in the all-chloride reactions was nearly eliminated at 120 mM KCl, consistent with previous KCl titration results (1–4). In contrast the KAc- and KGlu-containing reactions spliced well at potassium concentrations as high as 120 mM (Fig. 6A). Interestingly, RNA stability remained relatively constant across the titration for all three salts. However, the average proportion of input RNA remaining after 60 min did differ: 46% in the all-chloride reactions, 50% in the KAc-containing reactions and 58% in the KGlu-containing reactions. Thus, in the presence of 40 mM chloride, high levels of spliced products can be obtained at potassium concentrations far exceeding the 40–60 mM generally considered to be the optimum (1–4). In fact, it appears that the splicing efficiency in the presence of KAc was still improving at the highest potassium concentration tested. The efficiencies observed in the KGlu reactions were somewhat lower than for the KAc reactions, but this may reflect a stronger effect of KAc on the first step of splicing (see Fig. 1).
Figure 6.

Relative first step product yields over a range of potassium concentrations with chloride, acetate or glutamate counterions. (A) AdMLΔAG was incubated under standard splicing conditions for 60 min, except that KAc or KGlu and MgAc2 were substituted for KCl and MgCl2 according to the partial substitution conditions. Potassium concentrations were 60, 70, 80, 90, 100, 110 and 120 mM; lanes 1, 9 and 17 contained 80 mM potassium but were incubated for 0 min [used as input (I) values to calculate RNA stability]. The doublet bands present in this gel are due to 3′ end heterogeneity of the T7 transcript (41,42). (B) Indicated splicing efficiencies represent first step product species (lariat intermediate and 5′ exon) and were calculated as described in Materials and Methods.
SUMMARY
Taken as a whole, the results presented here show that the splicing machinery will accept a wide range of ion concentrations provided that the chloride concentration is maintained at levels comparable to those found in vivo. In particular, our results indicate that substitution of acetate or glutamate for chloride results in increased RNA stability and higher yields of splicing intermediates and products. This is consistent with the known propensity of chloride to disrupt protein–nucleic acid interactions (7–11). It is thought that this inhibition arises as a result of rearrangements in local concentrations of anions and water during complex formation, and two possible mechanisms have been proposed (10). The first suggests that chloride binds positively charged nucleic acid binding sites in proteins more strongly than acetate or glutamate (reviewed in 31). Chloride inhibition may thus arise because bound chloride ions must be displaced during complex formation (10). A complementary possibility is based on evidence that glutamate is preferentially excluded from the surface of certain proteins (32,33). Such exclusion, which arises from relatively unfavorable interactions between the anion and the protein surface, would create a lower local concentration of glutamate at the protein surface (34). In this case, complex formation becomes a favorable process (entropy driven) because it reduces the solvent exposed surface area of the protein and in doing so gives rise to a more random distribution of anions (10). In either case, formation of protein–nucleic acid complexes is more favorable in the presence of glutamate and probably also acetate (which falls between glutamate and chloride in the Hofmeister series; see 7) than chloride.
Regardless of the mechanism, our results indicate that current standard conditions for pre-mRNA splicing in HeLa nuclear extract, which call for 40–60 mM KCl in the splicing reactions (1–4), may not be ideal for all substrates (see also 18). Therefore, if optimal splicing activity is desired for any particular pre-mRNA, the potassium and chloride concentrations should be titrated independently. This could facilitate future studies of inefficiently spliced substrates (35,36), spliceosome purification procedures (37–39) and biochemical analyses of late steps in the splicing pathway (19,40).
Acknowledgments
ACKNOWLEDGEMENTS
We thank J. Kranz, O. Mühlemann and A. Bar-Shalom for critical reading of the manuscript, and the Guthrie lab for the initial suggestion that led to this investigation. This work was supported by a grant from the National Institutes of Health (R01-GM53007) to M.J.M.
REFERENCES
- 1.Hardy S.F., Grabowski,P.J., Padgett,R.A. and Sharp,P.A. (1984) Nature, 308, 375–377. [DOI] [PubMed] [Google Scholar]
- 2.Krainer A.R., Maniatis,T., Ruskin,B. and Green,M.R. (1984) Cell, 36, 993–1005. [DOI] [PubMed] [Google Scholar]
- 3.Hernandez N. and Keller,W. (1983) Cell, 35, 89–99. [DOI] [PubMed] [Google Scholar]
- 4.Padgett R.A., Hardy,S.F. and Sharp,P.A. (1983) Proc. Natl Acad. Sci. USA, 80, 5230–5234. [DOI] [PMC free article] [PubMed] [Google Scholar]
- 5.Kramer A. and Keller,W. (1990) In Dahlberg,J.E. and Abelson,J.N. (eds), Methods in Enzymology— RNA Processing, Part B: Specific Methods, Vol. 181. Academic Press, San Diego, CA, pp. 3–11.
- 6.Eperon I.C. and Krainer,A.R. (1994) In Higgins,S.J. and Hames,B.D. (eds), RNA Processing—A Practical Approach, Vol. I. IRL Press, New York, NY, pp. 73–79.
- 7.Griep M.A. and McHenry,C.S. (1989) J. Biol. Chem., 264, 11294–11301. [PubMed] [Google Scholar]
- 8.Lue N.F. and Kornberg,R.D. (1987) Proc. Natl Acad. Sci. USA, 84, 8839–8843. [DOI] [PMC free article] [PubMed] [Google Scholar]
- 9.Zou L. and Richardson,J.P. (1991) J. Biol. Chem., 266, 10201–10209. [PubMed] [Google Scholar]
- 10.Leirmo S., Harrison,C., Cayley,D.S., Burgess,R.R., Record,J. and Thomas,M. (1987) Biochemistry, 26, 2095–2101. [DOI] [PubMed] [Google Scholar]
- 11.Weber L.A., Hickey,E.D., Maroney,P.A. and Baglioni,C. (1977) J. Biol. Chem., 252, 4007–4010. [PubMed] [Google Scholar]
- 12.Alberts B., Bray,D., Lewis,J., Raff,M., Roberts,K. and Watson,J.D. (1994) Molecular Biology of the Cell, 3rd Edn. Garland Publishing, New York, NY.
- 13.Bernstein R.E. (1954) Science, 120, 459–460. [DOI] [PubMed] [Google Scholar]
- 14.Wickson-Ginsburg M. and Solomon,A.K. (1963) J. Gen. Physiol., 46, 1303–1315. [DOI] [PMC free article] [PubMed] [Google Scholar]
- 15.Schmitt P., Gattoni,R., Keohavong,P. and Stevenin,J. (1987) Cell, 50, 31–39. [DOI] [PubMed] [Google Scholar]
- 16.Norton P.A. and Hynes,R.O. (1990) Nucleic Acids Res., 18, 4089–4097. [DOI] [PMC free article] [PubMed] [Google Scholar]
- 17.Ge H. and Manley,J.L. (1990) Cell, 62, 25–34. [DOI] [PubMed] [Google Scholar]
- 18.Black D.L. (1992) Cell, 69, 795–807. [DOI] [PubMed] [Google Scholar]
- 19.Anderson K. and Moore,M.J. (1997) Science, 276, 1712–1716. [DOI] [PubMed] [Google Scholar]
- 20.Dignam J.D., Lebovitz,R.M. and Roeder,R.G. (1983) Nucleic Acids Res., 11, 1475–1498. [DOI] [PMC free article] [PubMed] [Google Scholar]
- 21.Abmayr S.M., Workman,J.L. and Roeder,R.G. (1988) Genes Dev., 2, 542–553. [DOI] [PubMed] [Google Scholar]
- 22.Abmayr S.M. and Workman,J.L. (1993) In Ausubel,F.M., Brent,R., Kingston,R.E., Moore,D.D., Seidman,J.G., Smith,J.A. and Struhl,K. (eds), Current Protocols in Molecular Biology, Supplement 11 Ed, Vol. 2. John Wiley & Sons, New York, NY, pp. 12.1.1–12.1.9.
- 23.Gozani O., Patton,J.G. and Reed,R. (1994) EMBO J., 13, 3356–3367. [DOI] [PMC free article] [PubMed] [Google Scholar]
- 24.Chabot B. (1994) In Higgins,S.J. and Hanes,B.D. (eds), RNA Processing: A Practical Approach, Vol. I. IRL Press, Oxford, UK, p. 1.
- 25.Cunningham S.A., Else,A.J., Potter,B.V.L. and Eperon,I.C. (1991) J. Mol. Biol., 217, 265–281. [DOI] [PubMed] [Google Scholar]
- 26.Lamond A.I., Konarska,M.M. and Sharp,P.A. (1987) Genes Dev., 1, 532–543. [DOI] [PubMed] [Google Scholar]
- 27.Smith C.W.J. and Nadal-Ginard,B. (1989) Cell, 56, 749–758. [DOI] [PubMed] [Google Scholar]
- 28.Moore M.J. and Query,C.C. (1998) In Smith,C.W.J. (ed.), RNA:Protein Interactions. Oxford University Press, Oxford, UK.
- 29.Konarska M.M. and Sharp,P.A. (1987) Cell, 49, 763–774. [DOI] [PubMed] [Google Scholar]
- 30.Anderson K. and Moore,M.J. (2000) RNA, 6, 1–10. [DOI] [PMC free article] [PubMed] [Google Scholar]
- 31.Record M.T. Jr, Anderson,C.F. and Lohman,T.M. (1978) Q. Rev. Biophys., 11, 103–178. [DOI] [PubMed] [Google Scholar]
- 32.Arakawa T. and Timasheff,S.N. (1984) J. Biol. Chem., 259, 4979–4986. [PubMed] [Google Scholar]
- 33.Arakawa T. and Timasheff,S.N. (1982) Biochemistry, 21, 6545–6552. [DOI] [PubMed] [Google Scholar]
- 34.Arakawa T. and Timasheff,S.N. (1984) Biochemistry, 23, 5912–5923. [DOI] [PubMed] [Google Scholar]
- 35.Tarn W.-Y. and Steitz,J.A. (1996) Cell, 84, 801–811. [DOI] [PubMed] [Google Scholar]
- 36.Wu Q. and Krainer,A.R. (1996) Science, 274, 1005–1008. [DOI] [PubMed] [Google Scholar]
- 37.Neubauer G., King,A., Rappsilber,J., Calvio,C., Watson,M., Ajuh,P., Sleeman,J., Lamond,A. and Mann,M. (1998) Nature Genet., 20, 46–50. [DOI] [PubMed] [Google Scholar]
- 38.Reed R. (1990) Proc. Natl Acad. Sci. USA, 87, 8031–8035. [DOI] [PMC free article] [PubMed] [Google Scholar]
- 39.Bennett M., Michaud,S., Kingston,J. and Reed,R. (1992) Genes Dev., 6, 1986–2000. [DOI] [PubMed] [Google Scholar]
- 40.Wagner J.D.O., Jankowsky,E., Company,M., Pyle,A.M. and Abelson,J.N. (1998) EMBO J., 17, 2926–2937. [DOI] [PMC free article] [PubMed] [Google Scholar]
- 41.Draper D.E., White,S.A. and Kean,J.M. (1988) Methods Enzymol., 164, 221–237. [DOI] [PubMed] [Google Scholar]
- 42.Milligan J.F., Groebe,D.R., Witherell,G.W. and Uhlenbeck,O.C. (1987) Nucleic Acids Res., 15, 8783–8798. [DOI] [PMC free article] [PubMed] [Google Scholar]