


Abstract
Kinetically monitored, reverse transcriptase-initiated PCR (kinetic RT–PCR, kRT–PCR) is a novel application of kinetic PCR for high throughput transcript quantitation in total cellular RNA. The assay offers the simplicity and flexibility of an enzyme assay with distinct advantages over DNA microarray hybridization and SAGE technologies for certain applications. The reproducibility, sensitivity and accuracy of the kRT–PCR were assessed for yeast transcripts previously quantitated by a variety of methods including SAGE analysis. Changes in transcript levels between different genetic or physiological cell states were reproducibly quantitated with an accuracy of ±20%. The assay was sufficiently sensitive to quantitate yeast transcripts over a range of more than five orders of magnitude, including low abundance transcripts encoding cell cycle and transcriptional regulators.
INTRODUCTION
As the sequencing of more organism genomes reaches completion, methods for determining large scale gene expression maps have been developed to better understand the relationship of genotype and phenotype. Although gene expression is regulated at multiple points, transcription has emerged as a primary target for high throughput genomic analysis. Inasmuch as gene expression patterns change with developmental, genetic or physiological state, the number of cellular states to be investigated may readily exceed the number of cellular genes.
Cellular transcriptomes have been studied through the use of DNA sequence analysis of cDNA ‘tags’ (serial analysis of gene expression, SAGE) (1–3). Transcripts are quantitated by SAGE on the basis of their frequency in the population of cloned tags sequenced in proportion to the total number of mRNAs per cell. Cellular transcript profiling has also been accomplished by hybridization-based analyses of microarrays of cDNAs or oligonucleotides (4–8).
We evaluated kinetically monitored, reverse transcriptase-initiated PCR (kinetic RT–PCR, kRT–PCR) as a method for transcript level determinations in total unfractionated yeast cellular RNA. The sensitivity, accuracy and reproducibility of kRT–PCR are very high. The detection range of kRT–PCR readily spans the full range of physiological transcript levels, including low level transcripts corresponding to essential regulatory genes. A particularly attractive feature of the kRT–PCR assay is the ability to analyze any customized set of genes and/or cell states in a single set of assays. This latter feature together with the quantitative robustness of kRT–PCR can provide sufficiently accurate measurements to support interpretation of genetic interactions crucial to establishing regulatory networks.
MATERIALS AND METHODS
The kRT–PCR assay
Each kRT–PCR assay takes place in a single reaction tube (100 µl) containing: 50 mM Tricine buffer, pH 8.3, 110 mM potassium acetate, 13% glycerol, 0.3 mM dATP, dCTP and dGTP, 0.05 mM dTTP, 0.5 mM dUTP, 2.4 mM Mn(OAc)2, 2.5 µM ethidium bromide, 0.25 µM primers, 10 U rTth DNA polymerase, 2 U uracil N-glycosylase (UNG) and the indicated amount of total yeast cellular RNA template. Yeast strains S173-6B (GCR1) and TY11a (gcr1) were grown to early log phase in YP medium containing 2% glycerol and 2% lactate (9). Yeast strain S288C was grown in YP medium containing 2% glucose. Total cellular RNA was extracted from glass bead-disrupted cells (10) and was treated with RNase-free DNase I to eliminate residual genomic DNA.
Instrumentation
The kinetic thermal cycler (KTC) used in the experiments described here is similar to a previously described instrument used to quantitate DNA copy number in complex mixtures (11). The KTC described here uses a ‘folded’ optical path that makes it compact and self-contained. The instrument is built on a standard Perkin Elmer 9600 thermal cycler platform and consists of a light-tight enclosure fitted over the sample block of the thermal cycler (Fig. 1). To permit optical monitoring of the sample block, the thermal cycler’s heated sample lid was removed and reactions were overlaid with mineral oil to provide a vapor seal. The sample block is illuminated by a UV light source (mid range, 300 nm) through a dichroic mirror mounted at 45° directly above the sample block. Ethidium bromide fluorescence is reflected by the dichroic mirror through a large Fresnel lens (to correct for optical distortion) at the back of the enclosure and to an 8 bit CCD video camera. During the anneal/extend phase of each PCR cycle, a shutter opens to expose the sample block to UV excitation while the camera takes two exposures. The sample images are captured on a video frame grabber board and stored on a microcomputer as TIFF files. The software averages the two images and integrates the signal for each sample in the array. For each PCR cycle, the integrated signals for each sample are stored in spreadsheet format, providing the raw data for analysis. The camera, video frame grabber board, computer and controlling software are a modification of the IS1000 imaging system from Alpha Innotech (San Leandro, CA).
Figure 1.
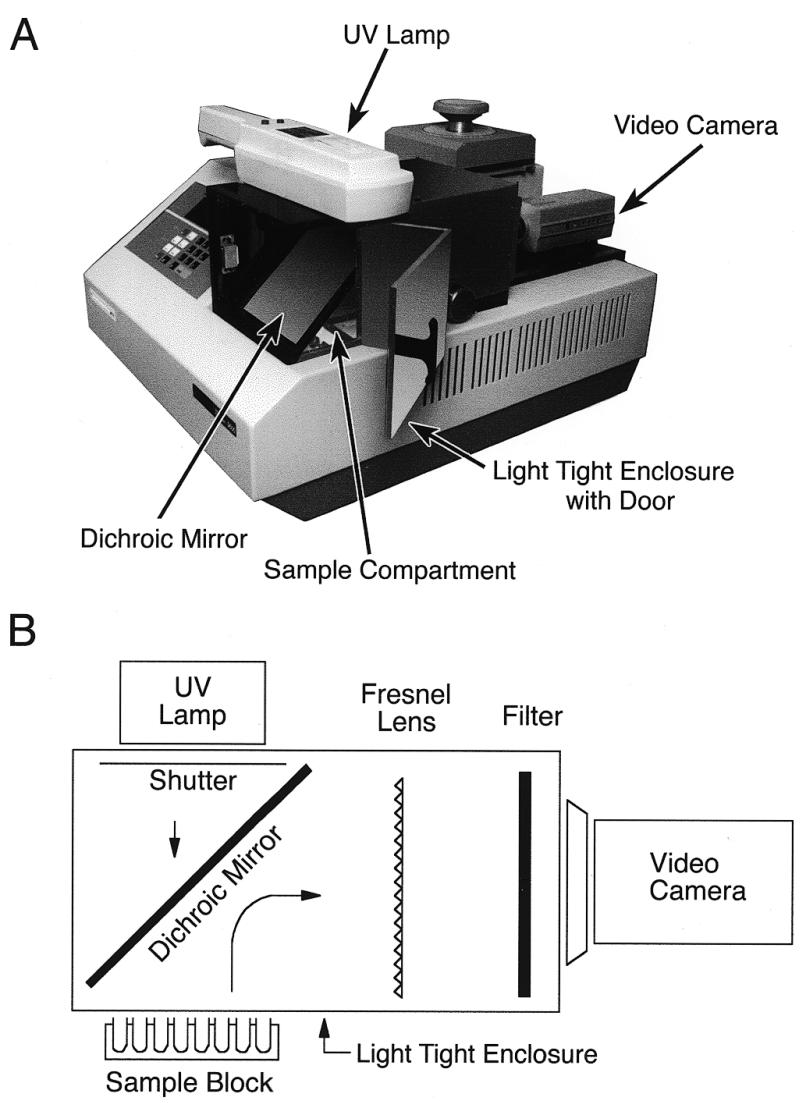
(A) Photograph of the kinetic thermal cycler (KTC). The optical components of the KTC are contained within a light-tight enclosure with a door (open) positioned over the sample compartment of a Perkin Elmer 9600 thermal cycler. A 300 nm UV lamp shines into the enclosure through a dichroic mirror onto the sample block. Fluorescence from the samples is reflected by the dichroic mirror to the rear of the enclosure, through a Fresnel lens and interference filter onto a CCD video camera. (B) Schematic of the arrangement of the KTC optical components.
Data analysis
At the conclusion of thermal cycling, the accumulated raw data are imported into a Microsoft Excel spreadsheet for a series of computational refinements. From the average fluorescence of six ‘external standards’ (tubes with ethidium bromide-containing reactions, inactivated by EDTA) placed at strategic positions in the array, a normalization factor is calculated for each PCR cycle and applied to the entire reaction array to eliminate cycle-to-cycle variation due to lamp variation or other system fluctuations. The normalized data are then plotted for each reaction as the relative, as opposed to absolute, increase in fluorescence versus cycle number for each reaction tube (11). Thus, for a typical 50 cycle run, each reaction generates 50 data points that constitute a kinetic growth curve of double-stranded DNA product accumulation during the PCR.
Primer design
Primer quality is an important consideration in obtaining highly reliable kRT–PCR data sets. The Oligo 5.0 software package (National Biosciences Inc.) was used to facilitate primer design. Primers were chosen to have closely matched Tm and to include one or more dA nucleotides homologous to the template at their 3′-termini. This common 3′-terminus has been observed to reduce the amount and delay the appearance of template-independent ‘primer dimer’ products (R.Saiki, personal communication). Primer pairs that produced template-independent products after PCR cycle 35 displayed high overall kRT–PCR efficiency and produced RNA template-directed double-stranded DNA products of the expected size, which were selected for analysis. Approximately 85% of the primer pairs tested met these specifications. The primer pairs used in this study are listed below by primer pair ID, with the upper primer sequence followed by the lower primer sequence: ABF1-A, CAATGATAATAACAATGGCAGTAATAA and CATCTTCAGTGTCGTTCTTGATAGTAA; ACT1-A, TGG-TCAAGTCATCACTATTGGTAACGAA and ACGGAGTA-CTTTCTTTCTGGAGGAGCAA; ACT1-B, TGGTCAAGTCATCACTATTGGTAACGAA and GTCAAAGAAGCCAAGATAGAACCACCAA; ACT1-C, CTGCCGGTATTGACC-AAACTACTTACAA and ACGGAGTACTTTCTTTCTGG-AGGAGCAA; ACT1-D, CTGCCGGTATTGACCAAACTA-CTTACAA and GTCAAAGAAGCCAAGATAGAACCA-CCAA; ADH1-A, GGGTATTGACGGTGGTGAAGGTAA and ACGACTTGGTTGAAGACATCAGAA. ADH2-A; GT-TTCCGTTTCCGAAGCCGCTATC and GGCAAACCAACCAAGACAACAGTA; CLB1-A, AATAGTAATGAAGAG-AAGGGGGTAAA and GCATTATTTGTGACATTACCGA-GAA; CLB2-A, ACAAGAGGAGAAAAGAACCCTGAA and CTTCGCTGAGGAGGATTCTTGTAA; CYC1-A, AGAAA-AACGTGTTGTGGGACGAAAATAA and TAAGTCGTTT-CTGTCTTTTTCCTTCTTCAA; ENO1-D, TGACTGTCACCAACCCAAAGAGAA and AGCGAAAACAGCGTTGTC-ACCTAA; ENO2-D, AAGTGGATGGGTAAGGGTGTTAT-GAA and GCGGTACCATCCAAAGACAACAAGAA; FBA1-A, TGTTAACAACGAAAACGCTGACAA and ACCGAAAGCAGCAGCAATGGAGAA; FBP1-A, GACAAGAAGAGC-CTCAACGGAAAA and CCTGAAGAACCCAACCAAATAGAA; GAL110, GCCGCACTGCTCCGAACAATAA and ATTACCCCAGAAATAAGGCTAAAA; GLK1-A, GTCTC-AGACTGCCCACCACTCCAA and TGAAACCGGGGTAGTATTCCACAA; GPD1-B, GTCGCTCAAGAACACTGGT-CTGAA and CGAAACCACAACCTAAGGCAACAA; GPD2-A, AAAGTCATTGCGGAAAACACAGAA and GTCAGCACCCTTGATGGAGTGTAA; GPM1-A, ACGCTTCTTCTCC-ATTCTCTCAAAA and CCAAGTGCTTAACCAAACCTC-TCAA; GUT1-A, TTTACTGTACAATACGGGGACCAA and TAGGCCACTAAATGCGGGGACGAA; HXK1-A, AA-ACGAGAAGGGCTTGATGTTGAA and TTGCGTCACCA-GTCCATCCATAGA; HXK2-A, ACATGTCGTTTTGCCA-AGAACTAA and TCTTCCTCGATTCTGGCTGGGTAA; PCK1-A, TATCTGCCGAAAAGGAGCCTGAAA and AAC-ATGGAATCTTGGCACTTGGAA; PDC1-A, CGGTTCTTT-CTCTTACTCTTACAA and AGGTACCGGTTTCAGCAA-TGACAA; PDC5-A, GAAGGTGATATTGTTATTGCTGAA and AGAGAACCGTCACCAATGAATAAA; PFK1-A, AG-AAAGCGTGAGGGTCGTAGACAA and CCGACAAGACCAACAATGGACAAA; PFK2-A, CCAACTCCACCACCA-GCACCAGAA and TCCATGACAACAAAGGCACGACAA; PGI1-A, CCTTGAAGGTTGTTGACCCAGAAA and CCAA-TAGCCGACCAGACAGAGTAA; PGK1-A, GGAAGATG-TTCAAAAGTTCAGACACGAA and TCTTGTCAGCAACCTTGGCACCACCTAA; PGK1-B, GGAAGATGTTCAAA-AGTTCAGACACGAA and AGTCTTGGTGTTGGCATCA-GCAGAGAAA; PGK1-C, TGGTGCCAAGGTTGCTGACA-AGATTCAA and AGTCTTGGTGTTGGCATCAGCAGAG-AAA; PGK1-D, ACCACATCGAAGAAGAAGGTTCCAG-AAA and TCTTGTCAGCAACCTTGGCACCACCTAA; PGK1-E, ACCACATCGAAGAAGAAGGTTCCAGAAA and AGTCTTGGTGTTGGCATCAGCAGAGAAA; PGK1-F, TG-GTGCCAAGGTTGCTGACAAGATTCAA and AGAGCTC-TTGACAACTTCGTCTAACAAA; PGK1-G, ACCACATCGAAGAAGAAGGTTCCAGAAA and AGAGCTCTTGAC-AACTTCGTCTAACAAA; PGK1-H, GGAAGATGTTCAA-AAGTTCAGACACGAA and AGAGCTCTTGACAACTTC-GTCTAACAAA; PYK1-A, GCTGAAACCGCTGTCATTG-CTGAA and CGGCCTTGAAACCTTGGATGGAAA; TDH1-A, CTGCTCCATCTTCTTCTGCTCCAA and CAGC-ACCGGTAGAGGATGGGATAA; TDH2-A, GTCGAAGT-TGTTGCTTTGAACGAT and AGTCAATGGCGATGTCA-ATGTTTA; TDH3-A, ACCACTGTCCACTCTTTGACTGCT and CAGTCAAGTCAACAACGGAGACAT; TDH3-B, AA-CGACCCATTCATCACCAACGAC and TGGAAGATGGA-GCAGTGATAACAA; TPI1-C, CACAAGTCACTGTCGGTGCTCAAA and GATGACACCGACACCTTGACCTAA.
RESULTS
The kRT–PCR assay
Kinetic RT–PCR is performed in three key phases. The first phase, a 2 min incubation at 50°C, allows the enzyme UNG to hydrolyze any dU-containing PCR product carryover contamination (12–14). The second phase of the reaction is the RT step (30 min at 60°C) utilizing the RT activity of the thermostable Tth DNA polymerase in the presence of Mn2+. At 60°C, UNG activity is severely reduced and the Tth DNA polymerase exhibits efficient, primer-dependent RT activity (15,16). The final phase of the reaction is DNA amplification by thermal cycling during which kinetic data is collected. Once a cDNA template has been created by reverse transcription, DNA polymerase-dependent product accumulation occurs as in conventional PCR. The inclusion of ethidium bromide in the reaction permits fluorescent detection of double-stranded DNA product as it accumulates with each thermal cycle (17). A similar technique has been used to quantitate several specific rat fibroblast transcripts in cDNA synthesized from poly(A)-selected mRNA (18).
An example of primary kRT–PCR data is shown in Figure 2. The PGK1-D primer pair was used to analyze PGK1 mRNA in total cellular RNA isolated from strain S173-6B grown in YPd medium. In the absence of added RNA template, detectable product formed only after 40 PCR cycles. This latter product corresponded electrophoretically to small primer dimer products. Kinetic curves are shown for three concentrations of RNA corresponding to 103, 104 and 105 cell equivalents of total yeast RNA. The kinetic curves were displaced from one another by ~3.3 PCR cycles, as expected for 10-fold differences in RNA template concentration. For each RNA template concentration, a single PCR product of the expected size for the PGK1-D primer pair (288 bp) was detected by gel electrophoresis. These data illustrate the quantitative relationship between the kinetics of the reaction and the concentration of initial template. Each kinetic curve was defined by a Ct value which is the crossover point between the kinetic curve and an arbitrary fluorescence level (AFL) which for all the experiments presented here is 1.5. Ct values are inversely proportional to the log of the initial RNA template concentration and thus are used to calculate transcript copy number.
Figure 2.

Kinetic RT–PCR curves for the PGK1-D primer pair and total yeast RNA template. Relative fluorescence output is plotted versus PCR cycle number. Kinetic curves are for 105 (triangles), 104 (diamonds) and 103 (squares) cell equivalents of total yeast cellular RNA template (23) and no added template (open circles).
Efficiency and reproducibility of the kRT–PCR assay
The overall efficiency of the kRT–PCR assay can be influenced by differences in RT and/or PCR cycle efficiency. Both parameters could be influenced by the size of the sequence interval between the primer pairs (amplicon size). To assess kRT–PCR efficiency, eight different PGK1 primer pairs with amplicon sizes ranging from 230 to 716 bases were analyzed utilizing total cellular RNA templates isolated from a wild-type strain and a gcr1 strain grown in YPgl medium. Previous studies showed that maximal expression of the yeast PGK1 gene requires the GCR1 gene product (9,19). As expected, the Ct values obtained with each primer pair increased with increasing size of the amplicon (Table 1), showing a loss in overall kRT–PCR efficiency. When each primer pair was used to assess the difference in PGK1 mRNA levels in the wild-type versus gcr1 strain, however, each primer pair yielded similar Ct differences with an average of 4.07 ± 0.19 PCR cycles (Table 1). These data show that primer pair-specific kRT–PCR efficiency is consistent and, therefore, introduces relatively small errors (±20%) to state comparisons.
Table 1. PGK1 mRNA level differences in a wild-type GCR1 strain versus a strain carrying a gcr1 null mutation using eight different PGK1 primer pairs.
| Primer pair | Amplicon size (bp) |
Ct at 1E5 |
|
ΔCt gcr1 – WT | Fold-down WT/gcr1 |
|---|---|---|---|---|---|
| WT | gcr1 | ||||
| PGK1-A | 230 | 20.59 | 24.47 | 3.88 | 14.7 |
| PGK1-C | 262 | 19.61 | 23.64 | 4.04 | 16.4 |
| PGK1-D | 288 | 20.24 | 24.13 | 3.89 | 14.8 |
| PGK1-F | 451 | 21.25 | 25.00 | 3.76 | 13.5 |
| PGK1-B | 469 | 21.29 | 25.59 | 4.30 | 19.7 |
| PGK1-E | 527 | 21.29 | 25.52 | 4.23 | 18.8 |
| PGK1-H | 658 | 23.12 | 27.37 | 4.25 | 19.0 |
| PGK1-G | 716 | 22.84 | 27.03 | 4.19 | 18.2 |
| Average | 4.07 | 16.9 | |||
| SD | 0.19 | 2.19 |
The amplicon sizes for primer pairs PGK1-A–PGK1-G are indicated. Kinetic RT–PCR assays were performed with 105 cell equivalents of total cellular RNA isolated from yeast cells grown in YPgl medium. Ct values were taken at AFL values proportionally adjusted for differences in fluorescence yield due to differences in amplicon size. The difference between Ct values in the two genetic states (ΔCt, gcr1 – WT) are tabulated. The ratio of relative transcript level in the wild-type strain (WT) to the gcr1 strain (gcr1) was tabulated for each primer pair tested (fold-down = 2ΔCt). The average values and standard deviations are indicated.
To access PCR cycle efficiency, kinetic PCR reactions were performed using yeast genomic DNA with initial DNA template concentrations ranging over four orders of magnitude. The observed PCR cycle efficiency was 98.5% for all eight PGK1 primer pairs, suggesting that the loss of overall kRT–PCR efficiency with increasing amplicon size is primarily confined to the RT phase of kRT–PCR.
The PGK1-A, PGK1-C and PGK1-D primer pairs, which define amplicons of <300 bases, displayed similar overall efficiencies (Table 1), as reflected in the similar Ct values using template from wild-type or gcr1 strains, respectively. Similarly, the observed average Ct value at an AFL of 1.5 for four ACT1 primer pairs with amplicon sizes ranging from 205 to 318 bases was 23.1 ± 0.6 PCR cycles. These data suggest that determination of transcript copy number using primer pairs with amplicon sizes below 300 bases varies by less than a factor of 2. This prediction is borne out by the experimental results described below.
With respect to reproducibility of the kRT–PCR assay, the Ct values obtained for 30 independent measurements using the ACT1-D primer pair, for example, differed by less than 0.2 PCR cycles. In a separate experiment, kRT–PCR assays were performed with primer pairs specific for 21 different yeast transcripts using total cellular RNA isolated from a strain grown in YPgl medium. Three independent kRT–PCR arrays were evaluated using two different KTC instruments. The average standard deviation of Ct values for the three analyses of all 21 primer pairs was 0.17 PCR cycles. These data confirm that primer pair-specific Ct values are highly reproducible. They further show that the PGK1 primer pair-dependent Ct variation observed for the state comparison shown in Table 1 is comparable to the error intrinsic in the kRT–PCR assay.
Quantitation of transcripts in different genetic states
Kinetic RT–PCR assays were performed to assess the effects of null mutations in the yeast GCR1 and GCR2 genes on expression of a set of yeast glycolytic and gluconeogenic genes. Previous studies showed that the GCR1 and GCR2 gene products are required for maximal expression of many glycolytic genes (19,20). GCR1 encodes a DNA-binding protein which interacts specifically with the enhancer elements of yeast glycolytic genes (21). The GCR2 gene product is thought to activate glycolytic gene expression through direct interaction with Gcr1p (22). Transcript levels determined by kRT–PCR assay in a gcr1 strain were 106- to 9-fold lower than in a wild-type strain for 10 glycolytic genes (Table 2). The magnitude of the effects of the gcr1 null mutation determined by kRT–PCR assay was in good quantitative agreement with northern blotting assays performed for seven glycolytic transcripts (9). Transcript level differences determined by kRT–PCR assay in gcr1 or gcr2 strains versus a wild-type strain in log phase cells were similar to published results based on glycolytic enzyme activity assays, even though these latter assays were performed with stationary phase cells (22). One notable exception was glyceraldehyde 3-phosphate dehydrogenase, where the difference measured by kRT–PCR (weighted average for TDH1, TDH2 and TDH3) in a gcr1 strain was 31-fold and the enzyme activity-based difference was only 3.8-fold (22). Independent in vitro translation and northern blotting assays for total glyceraldehyde 3-phosphate dehydrogenase mRNA in GCR1 versus gcr1 strains (20) revealed a 35-fold GCR1-dependence for glyceraldehyde 3-phosphate dehydrogenase gene expression, which is in close agreement with the 31-fold dependence observed by kRT–PCR assay.
Table 2. Analysis of transcriptional regulation of glycolytic and gluconeogenic genes by GCR1 and GCR2.
| Primer pair | Gene | Pathway | Fold-Down |
|
|
|
||
|---|---|---|---|---|---|---|---|---|
| KTC |
Northern | Enzyme | Enzyme | |||||
| WT/gcr1 | WT/gcr2 | WT/gcr1gcr2 | WT/gcr1 | WT/gcr1 | WT/gcr2 | |||
| GPM1-A | Phosphoglycerate mutase | G,Gn | 106 | 126 | 166 | >50 | 100 | 22 |
| ENO2-D | Enolase 2 | G,Gn | 70 | 28 | 75 | >50 | ||
| ENO1-D | Enolase 1 | G,Gn | 52 | 40 | 53 | >50 | ||
| ENO1+2 | Weighted average | 60 | 35 | 63 | 50 | 25 | ||
| TDH1-A | Triose phosphate dehydrogenase 1 | G,Gn | 3.1 | 4.3 | 4.6 | |||
| TDH2-A | Triose phosphate dehydrogenase 2 | G,Gn | 45 | 69 | 69 | |||
| TDH3-B | Triose phosphate dehydrogenase 3 | G,Gn | 36 | 10 | 44 | |||
| TDH1+2+3 | Weighted average | 31 | 18 | 40 | 35 | 3.8 | 8.3 | |
| PGK1-D | Phosphoglycerate kinase | G,Gn | 27 | 7.4 | 22 | 10 | 4.8 | 6.7 |
| TPI1-C | Triose phosphate isomerase | G,Gn | 24 | 7.3 | 26 | 12 | 25 | 29 |
| FBA1-A | Fructose bisphosphate aldolase | G,Gn | 23 | 6.3 | 22 | 13 | 7.4 | |
| PYK1-A | Pyruvate kinase | G | 14 | 22 | 22 | 12 | 7.7 | 29 |
| PGI1-A | Phosphoglucoisomerase | G,Gn | 8.9 | 7.1 | 15 | 11 | 17 | |
| PFK1-A | Phosphofructokinse subunit 1 | G | 1.6 | 1.0 | 1.6 | |||
| PFK2-A | Phosphofructokinse subunit 2 | G | 1.2 | 1.3 | 2.2 | |||
| PFK1+2 | Weighted average | 1.3 | 1.2 | 2.0 | 1.8 | 2.2 | ||
| GLK1-A | Glucokinase | G | 0.71 | 0.63 | 1.1 | 0.57 | 0.50 | |
| HXK1-A | Hexokinase 1 | G | 2.0 | 1.5 | 2.3 | |||
| HXK2-A | Hexokinase 2 | G | 0.44 | 1.0 | 1.0 | |||
| GLK1+HXK1+2 | Weighted average | 1.0 | 0.9 | 1.4 | 0.59 | 0.72 | ||
| FBP1-A | Fructose bisphosphatase | Gn | 1.0 | 1.8 | 0.65 | 1.4 | 1.6/0.44 | |
| PCK1-A | PEP carboxykinase | Gn | 0.87 | 0.95 | 0.49 | |||
| ACT1-D | Actin | 1.0 | 1.2 | 0.79 | ||||
| CYC1-A | Iso-1-cytochrome C | 0.71 | 0.67 | 0.31 | ||||
Kinetic RT–PCR assays were performed with primer pairs specific for a set of yeast glycolytic (G) and gluconeogenic (Gn) genes using total yeast cellular RNA isolated from congenic strains carrying gcr1 and/or gcr2 null mutations grown in YPgl medium. The ratios of transcript levels, WT/gcr1, WT/gcr2 and WT/gcr1gcr2, were computed from the difference in Ct values (2mutant Ct – WT Ct). Comparable ratios from published northern blot analyses (Northern) (9) and enzyme assays (Enzyme) (22) are tabulated for comparison. mRNAs assayed were for: GPM1-A, phosphoglycerate mutase; ENO2-D, enolase 2; ENO1-D, enolase 1; TDH1-A, triose phosphate dehydrogenase 1; TDH2-A, triose phosphate dehydrogenase 2; TDH3-B, triose phosphate dehydrogenase 3; PGK1-D, phosphoglycerate kinase; TPI1-C, triose phosphate isomerase; FBA1-A, fructose bisphosphate aldolase; PYK1-A, pyruvate kinase; PGI1-A, phosphoglucoisomerase; PFK1-A, phosphofructokinase subunit 1; PFK2-A, phosphofructokinase subunit 2; GLK1-A, glucokinase; HXK1-A, hexokinase 1; HXK2-A, hexokinase 2; FBP1-A, fructose bisphosphatase; PCK1-A, PEP carboxykinase; ACT1-D, actin; CYC1-A, iso-1-cytochrome C.
The results shown in Table 2 confirmed previous observations (22) that only those genes that are regulated by GCR1 were affected by the gcr2 null mutation. Finally, the effects of the gcr1 and gcr2 mutations together were similar to the effect of the most severe of the two single null mutations, suggesting that the GCR1 and GCR2 regulatory gene products function on the same regulatory pathway, as opposed to parallel pathways.
Quantitation of transcript copy number per cell
The accuracy of the kRT–PCR assay for determining transcript copy number per cell in a single state was evaluated by comparison to SAGE-based analysis of the yeast transcriptome (2,23). Conversion of Ct values obtained from kRT–PCR assays to transcript copy numbers per cell requires knowledge of the Ct values obtained using known amounts of starting RNA template. Experiments performed using HIV-specific primer pairs and accurately known concentrations of HIV transcript (24) showed that 105 HIV initial transcript templates generated a Ct value of 25.5 PCR cycles at an AFL of 1.5. Utilizing this calibration factor, transcript copy number per cell was calculated from Ct values at an AFL of 1.5 for 29 different yeast mRNAs derived from strain S288C grown in YPd medium. For comparison, transcript copy number per cell was calculated from the complete SAGE data set [provided by Dr Velculescu for poly(A) mRNA template isolated from log phase cultures of a derivative of strain S288C grown in YPd medium] for the same 29 yeast mRNAs.
Nine individual mRNAs as well as TDH2 plus TDH3 and ADH1 plus ADH2 could be compared (Table 3). Although SAGE and kRT–PCR are fundamentally different methodologies, the data obtained from the two methods agreed within a factor of 2. The variation between the methods was within the error expected for primer pair-specific differences in overall kRT–PCR efficiency. Two transcripts, ENO1 and TPI1, were undetectable (UD) by SAGE because these transcripts lack a cleavage site for the anchoring restriction endonuclease. Seven transcripts were not quantitated (NQ) from the SAGE data because <10 tags were detected. Finally, seven of the transcripts were not detected (ND) in the SAGE analysis. These latter transcripts were present at ≤4 copies/cell based on the kRT–PCR assay.
Table 3. Determination of yeast transcript copy number per cell from kRT–PCR assays.
| Primer pair | Copies/cell | SAGE/KTC | |
|---|---|---|---|
| KTC | SAGE | ||
| TDH2-A | 96 | ||
| TDH3-A | 367 | ||
| TDH2+3 | 464 | 473 | 102% |
| ADH1-A | 190 | ||
| ADH2-A | 0.042 | ||
| ADH1+2 | 190 | 260 | 137% |
| ENO2-D | 283 | 289 | 102% |
| PDC1-A | 248 | 201 | 81% |
| GPM1-A | 182 | 169 | 93% |
| FBA1-A | 172 | 184 | 107% |
| PYK1-A | 123 | 102 | 83% |
| PGK1-D | 66 | 166 | 249% |
| ACT1-D | 40 | 60 | 150% |
| ENO1-D | 36 | UD | |
| TPI1-C | 32 | UD | |
| PFK2-A | 17 | NQ | |
| PGI1-A | 17 | 19 | 113% |
| HXK2-A | 16 | 7.4 | 45% |
| PFK1-A | 15 | NQ | |
| GLK1-A | 7.9 | NQ | |
| GUT1-A | 4.2 | ND | |
| HXK1-A | 2.2 | NQ | |
| PDC5-A | 1.5 | ND | |
| ABF1-A | 1.1 | ND | |
| GPD1-B | 1.1 | NQ | |
| GPD2-A | 0.29 | NQ | |
| CLB2-A | 0.22 | ND | |
| CYC1-A | 0.17 | NQ | |
| CLB1-A | 0.049 | ND | |
| PCK1-A | 0.027 | ND | |
| FBP1-A | 0.018 | ND | |
| Average | 115% | ||
| SD | 53% | ||
Ct values for 29 yeast transcripts, determined by kRT–PCR assay using total cellular RNA isolated from strain S288C grown in YPd medium, were converted to transcript copies/cell (KTC). Transcript copy number per cell data derived from SAGE analysis of the yeast transcriptome using RNA isolated from log phase cultures grown in YPd medium are shown for comparison. UD indicates that the transcript was undetectable by SAGE assay because the cDNA lacks a site for the anchoring restriction endonuclease. NQ indicates that the transcript was detected by SAGE assay but the transcript was not quantitated because less than 10 tags were detected. ND indicates that the transcript was not detected in the SAGE assay. The SAGE/KTC transcript copy number per cell ratio times 100% is tabulated for relevant transcripts. mRNAs assayed were for the genes described in Table 2 as well as: ADH1-A, alcohol dehydrogenase 1; ADH2-A, alcohol dehydrogenase 2; PDC1-A, pyruvate decarboxylase isozyme 1; PDC5-A, pyruvate decarboxylase isozyme 2; ABF1-A, ARS binding factor; GPD1-B, glycerol phosphate dehydrogenase 1; GPD2-A, glycerol phosphate dehydrogenase 2; GUT1-A, glycerol kinase; CLB2-A, B-type cyclin, G2/M phase-specific; CLB1-A, B-type cyclin, G2/M phase-specific.
The 29 transcripts quantitated by kRT–PCR assay differed in relative abundance by more than four orders of magnitude. Interestingly, ABF1 mRNA, which encodes one of the most abundant DNA-binding proteins in yeast, was present at 1.1 copies/cell. Similarly, the cyclin B mRNAs CLB1 and CLB2 were present at 0.05 and 0.2 copies/cell, respectively. These data indicate that transcripts encoding yeast transcription factors and other regulatory proteins are present at low intracellular concentrations. This prediction is consistent with the SAGE analysis, where many well-characterized yeast transcription factor transcripts were either not detected or not quantitated.
The accuracy of kRT–PCR in determining the abundance of two or more different transcripts derived from closely related gene families was assessed. The ratios of mRNAs encoded by the two glyceraldehyde 3-phosphate dehydrogenase genes TDH3 and TDH2, the enolase genes ENO2 and ENO1, and the alcohol dehydrogenase genes ADH1 and ADH2 determined by kRT–PCR assay in cells grown in YPd or YPgl medium were similar to independent measurements based on enzyme activity, gel electrophoresis, western blotting and/or northern blotting (Table 4; 25–29). Again, the observed variation is within that expected for differences in kRT–PCR efficiency among primer pairs specific for different yeast transcripts. These results further validate (independent of the SAGE analysis) the ability of the kRT–PCR assay to quantitate transcript copy number per cell within a factor of two.
Table 4. Determination of transcript copy number per cell for yeast transcripts encoded by closely related gene families.
| Primer pair | Copies/cell | Medium | Isozymes | Isozyme ratio | References | |
|---|---|---|---|---|---|---|
| KTC | Expected | |||||
| TDH2-A | 96 | YPd | TDH3/TDH2 | 3.8 | 5 | (25) |
| TDH3-B | 367 | |||||
| ENO1-D | 36 | YPd | ENO2/ENO1 | 7.8 | 10 | (26–28) |
| ENO2-D | 283 | |||||
| ENO1-D | 51 | YPgl | ENO2/ENO1 | 0.85 | 1 | (26–28) |
| ENO2-D | 44 | |||||
| ADH1-A | 145 | YPgl | ADH1/ADH2 | 4.6 | 5–6 | (29) |
| ADH2-A | 32 |
Primer pairs that discriminate these gene family members were designed to include nucleotide sequence differences between genes that were >95% identical. Transcript copy number per cell was calculated from Ct values as described above (Table 3). Kinetic RT–PCR assays were performed with the indicated primer pairs using total cellular RNA isolated from strain S173-6B grown in YPd or YPgl medium. Transcript copy number per cell is tabulated for each gene product. The ratios of transcript number per cell for each pair of genes determined by kRT–PCR assay (KTC) is tabulated along with the ratios determined by independent measurements using different assays (Expected).
Detection limits of the kRT–PCR assay
Four of the transcripts analyzed by kRT–PCR assay (Table 3), CYC1, ADH2, PCK1 and FBP1, are subject to carbon catabolite repression and, consequently, were present at very low levels in cells grown in YPd medium. To assess the reliability of the kRT–PCR assay for quantitating these low abundance transcripts, kRT–PCR assays were performed for these four transcripts using total cellular RNA isolated from a strain grown in derepressing medium (YPgl). The ratio of the transcript levels determined by kRT–PCR assay in cells grown on derepressing (gl) and repressing (d) carbon sources (YPgl and YPd) were similar to published values based on enzyme activity, lacZ fusion and northern blotting assays (Table 5; 30–33). These results demonstrate the reliability of the kRT–PCR assay for quantitating low abundance transcripts.
Table 5. Transcript copy number per cell for carbon catabolite repressed gene products in the repressed and derepressed states.
| Primer pair | Copies/cell | Ratio | References | ||
|---|---|---|---|---|---|
| YPgl | YPd | gl/d | Expected | ||
| ADH2-A | 32 | 0.042 | 749 | 500 | (30) |
| PCK1-A | 29 | 0.027 | 1073 | 500 | (31) |
| FBP1-A | 4.1 | 0.018 | 236 | 200 | (31,32) |
| CYC1-A | 7.1 | 0.17 | 41 | 26 | (33) |
Transcript copy number per cell was calculated from Ct values obtained from kRT–PCR assays of the carbon catabolite repressed yeast genes alcohol dehydrogenase 2 (ADH2), phosphoenolpyruvate carboxykinase (PCK1), fructose bisphosphatase (FBP1) and iso-1-cytochrome c (CYC1), using cellular RNA templates isolated from strain S173-6B grown under repressing (YPd) and derepressing conditions (YPgl). The ratio of transcript copy numbers per cell under derepressing/repressing growth conditions (gl/d) is tabulated together with published ratios using different assays (Expected).
To assess the lower detection limit for kRT–PCR-based transcript level determinations, transcripts derived from an intergenic region were analyzed. The yeast GAL1 and GAL10 genes are divergently transcribed (34) and are separated by a 350 bp regulatory region between the two promoters. Based on the RNA-dependent kRT–PCR data shown in Figure 3, transcripts derived from the GAL1/GAL10 intergenic region were present at 0.00075 copies/cell. Since the GAL1/GAL10 intergenic region is not expected to direct synthesis of a physiologically relevant transcript, it is possible that the transcript detected from this region reflects a low level of intracellular read-through transcription. The results shown in Figure 3 demonstrate the dynamic range of the kRT–PCR assay for quantitating transcripts varying in abundance from 367 (TDH3) to 0.00075 copies/cell (GAL1/GAL10 intergenic region) utilizing a single initial RNA template concentration.
Figure 3.

Kinetic RT–PCR analysis of transcripts from the yeast GAL1/GAL10 intergenic region. Relative fluorescence output is plotted versus PCR cycle number. Kinetic RT–PCR assays were performed with 105 cell equivalents (0.12 µg) of total yeast cellular RNA isolated from a wild-type strain grown in YPd medium. Kinetic curves are shown for the GAL1/GAL10 primer pair using: untreated RNA template (triangles); RNA template pretreated with RNase A (squares); RNA template pretreated with RNase A and DNase I (open circles). The kRT–PCR curve for the TDH3 primer pair (crosses) using 105 cell equivalents (0.12 µg) of total yeast cellular RNA isolated from a wild-type strain grown in YPd medium is also shown.
DISCUSSION
The kRT–PCR assay can accurately quantitate transcript copy number over the full range of yeast cellular RNA, selectively distinguishing between members of gene families with nearly identical nucleotide sequences. The high sensitivity and wide dynamic range of kRT–PCR become significant because ~45% of yeast transcripts are present at ≤2 copies/cell, as determined by Rot studies (35) and recently confirmed by SAGE (2). Moreover, these rare transcripts include mRNAs for cellular regulators such as transcription factors and cyclins. These features of kRT–PCR should prove even more important in analyzing metazoan transcriptomes, where gene families are more numerous than in yeast and RNA abundance may vary more widely, since mammalian cells contain ~20 times (300 000) (36) as many transcripts as yeast (35).
The reproducibility and accuracy of the kRT–PCR-based transcript assay for state comparisons (±20%) or transcript copy number per cell (2-fold) derives from the fact that a complete kinetic curve is generated in each assay and that the transcript copy number calculation relies on a relatively simple base 2 exponential process, as opposed to more complex second order kinetics which describe hybridization-based assays (4–8). The intrinsic reproducibility and accuracy of kRT–PCR assays enables the construction of robust relational data sets. The wide dynamic range of the kRT–PCR assay derives from the fact that the magnitude of the output fluorescence signal is independent of initial transcript concentration, only the PCR cycle number varies. This latter feature distinguishes the kRT–PCR assay from SAGE (1–3) and DNA microarray assays (4–8), where the output signal is proportional to transcript abundance. The sensitivity and resolution of SAGE increase with the number of tags sequenced. Hybridization to oligonucleotide microarrays is reproducible within a factor of two over a range of intracellular transcript abundance up to three orders of magnitude (6).
The kRT–PCR assay uses unfractionated total cellular RNA as template. In contrast, DNA microarray assays require conversion of poly(A)-selected RNA to a hybridization probe (4–8) and SAGE analysis requires construction of concatenated cDNA tags from poly(A)-selected mRNA (1–3). Although individual assays with unique primers for each mRNA are required for kRT–PCR, reaction assembly can be fully automated and scaled to larger formats necessary for complete cellular transcriptome analyses. Perhaps the most attractive feature of the kRT–PCR assay is that an array of reactions can include any customized combination of transcript-specific primer pairs and total cellular RNA templates from any state. Undoubtedly, the intrinsic flexibility of the kRT–PCR assay will be important for analyzing subsets of genes in multiple physiological, genetic or developmental states. The ability to simultaneously analyze expression of selected groups of genes in multiple genetic or developmental states is essential, for example for dissection of cellular transcriptional pathways and networks.
Acknowledgments
ACKNOWLEDGEMENTS
The authors thank Dr Victor Velculescu for providing the complete SAGE data set for the yeast transcriptome. The authors also thank Drs John Sninsky and Tom Myers for stimulating discussions and critical reading of the manuscript and Randy Saiki for providing unpublished data showing that one or more dA nucleotides homologous to the template at the 3′-termini of PCR primers significantly reduces primer dimer artifacts.
REFERENCES
- 1.Velculescu V.E., Zhang,L., Vogelstein,B. and Kinzler,K.W. (1995) Science, 270, 484–487. [DOI] [PubMed] [Google Scholar]
- 2.Velculescu V.E., Zhang,L., Zhou,W., Vogelstein,J., Basrai,M.A., Bassett,D.J., Hieter,P., Vogelstein,B. and Kinzler,K.W. (1997) Cell, 88, 243–251. [DOI] [PubMed] [Google Scholar]
- 3.Zhang L., Zhou,W., Velculescu,V.E., Kern,S.E., Hruban,R.H., Hamilton,S.R., Vogelstein,B. and Kinzler,K.W. (1997) Science, 276, 1268–1272. [DOI] [PubMed] [Google Scholar]
- 4.Schena M., Shalon,D., Davis,R.W. and Brown,P.O. (1995) Science, 270, 467–470. [DOI] [PubMed] [Google Scholar]
- 5.DeRisi J., Penland,L., Brown,P.O., Bittner,M.L., Meltzer,P.S., Ray,M., Chen,Y., Su,Y.A. and Trent,J.M. (1996) Nature Genet., 14, 457–460. [DOI] [PubMed] [Google Scholar]
- 6.Lockhart D.J. et al. (1996) Nature Biotechnol., 14, 1675–1680. [DOI] [PubMed] [Google Scholar]
- 7.Schena M., Shalon,D., Heller,R., Chai,A., Brown,P.O. and Davis,R.W. (1996) Proc. Natl Acad. Sci. USA, 93, 10614–10619. [DOI] [PMC free article] [PubMed] [Google Scholar]
- 8.Heller R.A., Schena,M., Chai,A., Shalon,D., Bedilion,T., Gilmore,J., Woolley,D.E. and Davis,R.W. (1997) Proc. Natl Acad. Sci. USA, 94, 2150–2155. [DOI] [PMC free article] [PubMed] [Google Scholar]
- 9.Nishi K., Park,C.S., Pepper,A.E., Eichinger,G., Innis,M.A. and Holland,M.J. (1995) Mol. Cell. Biol., 15, 2646–2653. [DOI] [PMC free article] [PubMed] [Google Scholar]
- 10.Kang J.J., Yokoi,T.J. and Holland,M.J. (1995) J. Biol. Chem., 270, 28723–28732. [DOI] [PubMed] [Google Scholar]
- 11.Higuchi R., Fockler,C., Dollinger,G. and Watson,R. (1993) Biotechnology, 11, 1026–1030. [DOI] [PubMed] [Google Scholar]
- 12.Longo M.C., Berninger,M.S. and Hartley,J.L. (1990) Gene, 93, 125–128. [DOI] [PubMed] [Google Scholar]
- 13.Udaykumar, Epstein,J.S. and Hewlett,I.K. (1993) Nucleic Acids Res., 21, 3917–3918. [DOI] [PMC free article] [PubMed] [Google Scholar]
- 14.Mulder J., McKinney,N., Christopherson,C., Sninsky,J., Greenfield,L. and Kwok,S. (1994) J. Clin. Microbiol., 32, 292–300. [DOI] [PMC free article] [PubMed] [Google Scholar]
- 15.Myers T.W. and Gelfand,D.H. (1991) Biochemistry, 30, 7661–7666. [DOI] [PubMed] [Google Scholar]
- 16.Myers T.W. and Sigua,C.L. (1995) In Innis,M.A., Gelfand,D.H. and Sninsky,J.J. (eds), PCR Strategies. Academic Press, New York, NY, pp. 55–68.
- 17.Higuchi R., Dollinger,G., Walsh,P.S. and Griffith,R. (1992) Biotechnology, 10, 413–417. [DOI] [PubMed] [Google Scholar]
- 18.Morrison T.B., Weis,J.J. and Wittwer,C.T. (1998) Biotechniques, 24, 954–962. [PubMed] [Google Scholar]
- 19.Clifton D., Weinstock,S.B. and Fraenkel,D.G. (1978) Genetics, 88, 1–11. [DOI] [PMC free article] [PubMed] [Google Scholar]
- 20.Holland M.J., Yokoi,T., Holland,J.P., Myambo,K. and Innis,M.A. (1987) Mol. Cell. Biol., 7, 813–820. [DOI] [PMC free article] [PubMed] [Google Scholar]
- 21.Baker H.V. (1991) Proc. Natl Acad. Sci. USA, 88, 9443–9447. [DOI] [PMC free article] [PubMed] [Google Scholar]
- 22.Uemura H. and Fraenkel,D.G. (1990) Mol. Cell. Biol., 10, 6389–6396. [DOI] [PMC free article] [PubMed] [Google Scholar]
- 23.Sherman F. (1991) Methods Enzymol., 194, 3–21. [DOI] [PubMed] [Google Scholar]
- 24.Sun R., Ku,J., Jayakar,H., Kuo,J.-C., Brambilla,D., Herman,S., Rosenstraus,M. and Spadoro,J. (1998) J. Clin. Microbiol., 36, 2964–2969. [DOI] [PMC free article] [PubMed] [Google Scholar]
- 25.McAlister L. and Holland,M.J. (1985) J. Biol. Chem., 260, 15019–15027. [PubMed] [Google Scholar]
- 26.McAlister L. and Holland,M.J. (1982) J. Biol. Chem., 257, 7181–7188. [PubMed] [Google Scholar]
- 27.Cohen R., Holland,J.P., Yokoi,T. and Holland,M.J. (1986) Mol. Cell. Biol., 6, 2287–2297. [DOI] [PMC free article] [PubMed] [Google Scholar]
- 28.Cohen R., Yokoi,T., Holland,J.P., Pepper,A.E. and Holland,M.J. (1987) Mol. Cell. Biol., 7, 2753–2761. [DOI] [PMC free article] [PubMed] [Google Scholar]
- 29.Wills C. and Jornvall,H. (1979) Eur. J. Biochem., 99, 323–331. [DOI] [PubMed] [Google Scholar]
- 30.Bemis L.T. and Denis,C.L. (1988) Mol. Cell. Biol., 8, 2125–2131. [DOI] [PMC free article] [PubMed] [Google Scholar]
- 31.Mercado J.J. and Gancedo,J.M. (1992) FEBS Lett., 311, 110–114. [DOI] [PubMed] [Google Scholar]
- 32.Hedges D., Proft,M. and Entian,K.D. (1995) Mol. Cell. Biol., 15, 1915–1922. [DOI] [PMC free article] [PubMed] [Google Scholar]
- 33.Guarente L., Lalonde,B., Gifford,P. and Alani,E. (1984) Cell, 36, 503–511. [DOI] [PubMed] [Google Scholar]
- 34.Johnston M. and Davis,R.W. (1984) Mol. Cell. Biol., 4, 1440–1448. [DOI] [PMC free article] [PubMed] [Google Scholar]
- 35.Hereford L.M. and Rosbash,M. (1977) Cell, 10, 453–462. [DOI] [PubMed] [Google Scholar]
- 36.Hastie N.D. and Bishop,J.O. (1976) Cell, 9, 761–774. [DOI] [PubMed] [Google Scholar]