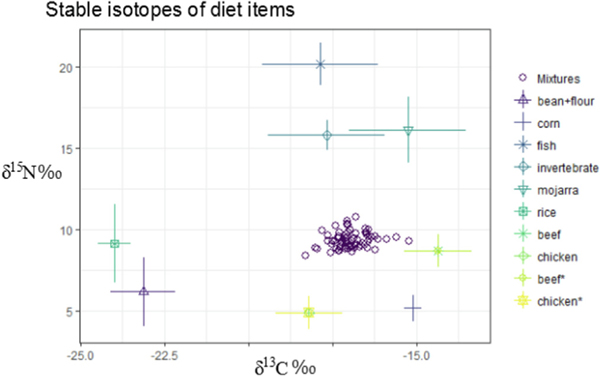
Fig. 6.
Average stable isotope values of grouped dietary items (grouped according to k-neighbor clusters presented in Fig. 5). Values for beef and chicken are provided from Jarhen and Kraft (Jahren and Kraft, 2008) to show the corn signature present in these protein sources, however they were not included in the mixing model. Mixtures provided are individual hair samples (n = 70) from pregnant women in La Paz, Baja California, Mexico.

