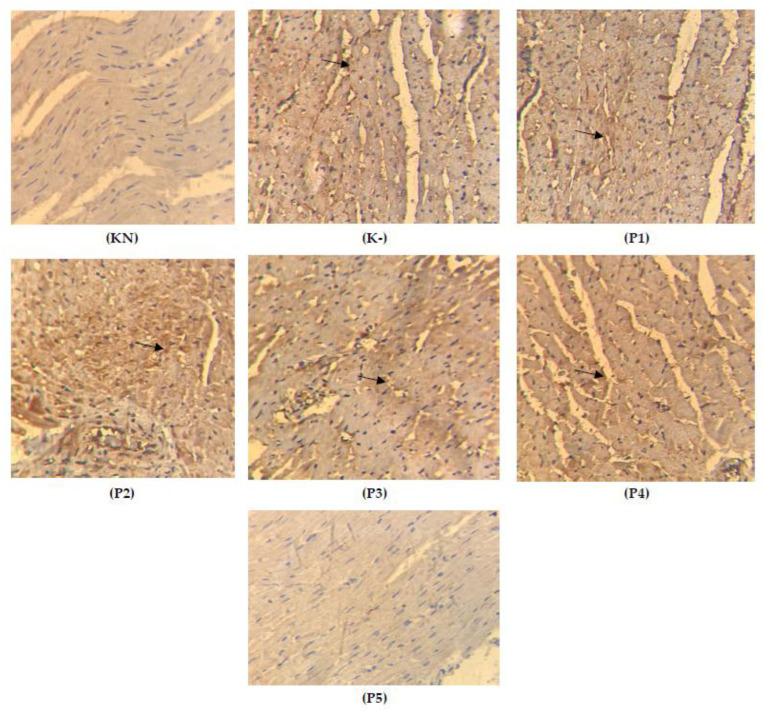
Figure 5.
Histology of cardiac-tissue-stained TGFβ (KN: normal rats, K-: doxorubicin 15 mg/kgbw, P1: 100 mg/kgbw + doxorubicin, P2: 200 mg/kgbw + doxorubicin, P3: 400 mg/kgbw + doxorubicin, P4: 600 mg/kgbw + doxorubicin, P5: 800 mg/kgbw + doxorubicin.; the arrows show the yellow color of the expression of TGFβ).

