


Abstract
Intragenomic and intergenomic comparisons of upstream nucleotide sequences of archaeal genes were performed with the goal of predicting transcription regulatory sites (operators) and identifying likely regulons. Learning sets for the detection of regulatory sites were constructed using the available experimental data on archaeal transcription regulation or by analogy with known bacterial regulons, and further analysis was performed using iterative profile searches. The information content of the candidate signals detected by this method is insufficient for reliable predictions to be made. Therefore, this approach has to be complemented by examination of evolutionary conservation in different archaeal genomes. This combined strategy resulted in the prediction of a conserved heat shock regulon in all euryarchaea, a nitrogen fixation regulon in the methanogens Methanococcus jannaschii and Methanobacterium thermoautotrophicum and an aromatic amino acid regulon in M.thermoautotrophicum. Unexpectedly, the heat shock regulatory site was detected not only for genes that encode known chaperone proteins but also for archaeal histone genes. This suggests a possible function for archaeal histones in stress-related changes in DNA condensation. In addition, comparative analysis of the genomes of three Pyrococcus species resulted in the prediction of their purine metabolism and transport regulon. The results demonstrate the feasibility of prediction of at least some transcription regulatory sites by comparing poorly characterized prokaryotic genomes, particularly when several closely related genome sequences are available.
INTRODUCTION
The rapidly accumulating complete genome sequences of bacteria and archaea provide a new type of information resource for understanding gene functions and evolution. The first tier of comparative genomic studies dealt with protein sequence analysis because, in the course of evolution, protein sequences change much less rapidly than the gene order or nucleotide sequences of non-coding regions (1–3). Comparative genomics at the protein level has proved highly informative. At least 70% of the proteins encoded in each of the completely sequenced prokaryotic genomes have homologs in phylogenetically distant organisms, and functional predictions, with a varying degree of specificity, are possible for the majority of these proteins (3–5). Combination of these predictions across a range of genomes provides for partial reconstruction of metabolic pathways and other functional systems by computational means and allows the identification of poorly understood steps that are in need of experimental investigation.
Gene order is poorly conserved in prokaryotes, compared to protein sequences (4,5). Large scale conservation is seen only in closely related species, e.g. Mycoplasma genitalium and Mycoplasma pneumoniae (6), or Chlamydia trachomatis and Chlamydia pneumoniae (7). Even in these cases, there are several breakpoints of synteny. Moderately related bacteria, such as for example Escherichia coli and Haemophilus influenzae, possess many conserved operons but, on a larger scale, these are shuffled to an extent that the ancestral gene order is indecipherable (8). At larger evolutionary distances, only a few operons are conserved across a wide range of prokaryotic species (4). Conservation of operons in small sets of prokaryotes is, however, more frequent, perhaps in part due to horizontal transfer, and on many occasions information on gene order can be utilized to enhance prediction of gene functions (5,9).
An adequate understanding of cell functioning is impossible without a knowledge of the transcription regulatory circuits that exist in all prokaryotes and can be highly complex in bacteria with advanced metabolic capabilities (10). The first step in this direction is the identification of transcription regulatory sites (operators), which also helps in deciphering the operon organization of genes in poorly characterized genomes. To what extent is the comparative genomic approach helpful in the identification of regulatory signals and operons given the limited conservation of both non-coding nucleotide sequences and gene order? Recently we performed a pilot study that used genome comparison of E.coli and H.influenzae to analyze the evolutionary conservation and transformation of regulons (11). This resulted in the identification of several likely regulons in H.influenzae and in the prediction of new members of regulons in both bacteria.
Here we describe an attempt to apply the comparative genomic approach to the prediction of regulatory signals and operons in six completely sequenced archaeal genomes. The choice of the archaeal genomes for this analysis was dictated by three considerations. First, the basal transcription machinery of the archaea is closely related to that of eukaryotes (12–14). In contrast, detailed analysis of the proteins encoded in complete archaeal genome sequences resulted in the prediction of a number of helix–turn–helix (HTH) proteins resembling bacterial transcriptional regulators and potentially involved in archaeal transcription regulation (15–18). Secondly, a recent comparative analysis of archaeal genomes resulted in the assignment of the majority of the genes to clusters of orthologs (19), which may facilitate analysis of the conservation of potential regulatory signals. Thirdly, transcription regulation in archaea is not well understood. Only for a few sets of co-regulated genes has regulation been experimentally demonstrated and the respective regulatory signals been identified, in particular, heat shock genes in Haloferax volcanii (20–22), two nitrogen fixation genes in Methanococcus maripaludis (23), gas vesicle genes in Halobacterium salinarium (24,25) and bacteriorhodopsin genes in Halobacterium sp. (26).
We were interested in further investigating bacterial-type transcription regulation in archaea and in systematically predicting archaeal regulatory sites and operons. This study resulted in the prediction of several archaeal regulons, only one of which, namely the heat shock regulon, is conserved in all sequenced archaeal genomes.
MATERIALS AND METHODS
Identification of regulatory signals: approach and procedure
At the first step, a group of genes is selected that may be expected to contain a common regulatory signal in the upstream region. There are two basic ways to compile this initial sample. The first possibility is to search for common patterns located upstream of orthologous genes. This approach assumes that the regulatory signal is strongly conserved in at least some of the compared genomes. The second possibility is to select candidate co-regulated genes from one genome on the basis of a common biological function. We used primarily the second approach or a mixed strategy that involved compiling samples of functionally related genes represented by orthologs in several genomes.
At the second step, a recognition rule is generated. In the simplest case, namely when some sites have been identified experimentally, a profile is constructed using the alignment of these known sites. Positional nucleotide weights in this profile were defined as previously described (11):
W(b,k) = log[N(b,k) + 0.5] – 0.25![]() log[N(i,k) + 0.5] 1
log[N(i,k) + 0.5] 1
where N(b,k) is the count of nucleotide b in position k in the learning sample. The score of a candidate site was calculated as the sum of the positional weights:
Z(b1ºbk) = ![]() W(bk,k) 2
W(bk,k) 2
where K is the number of positions in the site. Since Z is the sum of K independent variables, its distribution is approximately normal. The base of the logarithm in 1 is chosen such that the standard deviation of the score distribution on random oligomers equals 1. Thus, Z in 2 has the meaning of the standard z score and can be used to assess the significance of individual sites.
In cases where there are no experimentally defined sites, the noise level is so strong that general procedures for detecting signals in unaligned sequences (reviewed in 27,28) are not applicable. Therefore, we narrowed down the search space by searching for quasi-palindromic signals, a feature that is typical of many bacterial transcription regulatory sites (29). The similarity score between two l-mers was calculated in standard deviation units as
S = (n – l/4)/(σ√l) 3
where n is the number of identical nucleotides and σ = √[0.25 (1 – 0.25)] = √[3/4]. The procedure first identifies imperfect palindromes in each sequence. An imperfect palindrome is defined as an lmer whose similarity to a complementary lmer, calculated according to 3, is greater than 2. With this threshold we get approximately 10–20 imperfect palindromes in each 250 nt fragment, which was the length of the upstream sequence used for the present analysis.
Then each palindrome is compared to all palindromes from other upstream regions in the pre-selected set of genes, and the palindromes most similar to the initial one (at most one from each upstream region) are used to make a profile as defined above. Thus each palindrome in the initial set generates a profile. These profiles are used to scan the sets of palindromes again, the best palindromes are selected and the procedure is iterated until convergence.
The quality of a profile is defined as its information content (30)
I =![]()
![]() f(i,k) log[f(i,k)/0.25] 4
f(i,k) log[f(i,k)/0.25] 4
where f(i,k) is the frequency of nucleotide i at position k of palindromes generating the profile. A fixed number of best profiles was retained for further analysis.
The profiles independently derived for functionally similar gene sets from different genomes were compared by computing the distance
D(U,V) = ![]()
![]() U(i,k) – V(i,k) 5
U(i,k) – V(i,k) 5
where U and V are the compared profiles calculated according to 1. This provides for a consistency check and, in cases when the profiles are similar, increases the confidence in the signal prediction.
The selected optimal profile (or several high quality profiles) were symmetrized by incorporating the complement of each weak palindrome from the generating set and used for the analysis of regulons as previously described (11). Briefly, each genome was scanned with the profile and genes with candidate regulatory sites in upstream regions (normally in positions –200 to +50 relative to the translation start) were selected using a liberal threshold defined relative to the lowest score within the learning set (Results). The resulting set of candidate regulon members was supplemented by genes that are likely to be co-transcribed with a gene containing the signal (transcribed in the same direction, with an intergenic distance <100 bp).
The signal recognition procedure was complemented by protein sequence analysis under the assumption that the composition of regulons in related genomes is at least partially conserved. Given the same signal quality, it is likely that sites located upstream of orthologous genes are indeed utilized for regulation (true positives) whereas those that are randomly scattered among genes may be false positives. The candidate regulon members were mapped to the clusters of archaeal orthologous genes (COGs) (19) and additional protein sequence comparisons and database searches were performed as needed. In addition to the evolutionary conservation, functional assignments for the candidate regulon members were taken into consideration for the final regulon prediction.
Programs and sequence data
Signal identification, construction of recognition profiles, identification of candidate signals in genome sequences and protein similarity searches using the Smith–Waterman algorithm were performed using procedures included in the program Genome (31) obtained from Anchorgen Inc. (http://www. anchorgen.com ). Multiple alignments of protein sequences were constructed using the CLUSTALX program (32). Protein sequence database searches were performed using the gapped BLASTP program and, for the detection of subtle sequence similarities, the PSI-BLAST program (33,34). All searches were run against the non-redundant protein sequence database at the NCBI. Phylogenetic trees were constructed using the PHYLIP package programs NEIGHBOR (the neighbor joining method) and PROTPARS (maximum parsimony method) (35).
Complete genome sequences of four archaea, namely Methanococcus jannaschii (36), Methanobacterium thermoautotrophicum (37), Archaeoglobus fulgidus (38) and Pyrococcus horikoshii (39), as well as additional archaeal sequences, were downloaded from GenBank (40). Unannotated complete genomes of Pyrococcus furiosus and Pyrococcus abyssi were downloaded respectively from Utah Genome Center (University of Utah, USA; http://www.genome. utah.edu ) and Genoscope (National Centre for Sequencing, France; http://www.genoscope.cns.fr ), respectively.
RESULTS AND DISCUSSION
We analyzed four sets of archaeal genes that, on the basis of experimental results and/or by analogy with the respective bacterial systems, appeared to be good candidates for regulons. The procedure used for the prediction of the regulatory signal and regulon members was modified in each case, depending on the nature of the available data, and, accordingly, we describe each of these systems separately.
The heat shock regulon
As the starting point for the analysis of the heat shock regulon, we used the published compilation of 15 heat shock-specific promoters (HSP) from various archaea (21; Table 1). The profile derived from these HSPs was used to scan the four complete archaeal genomes with a threshold equal to the minimum score within the training set. The genes retrieved with this cut-off and genes that are likely to belong in the same operons with them comprised the first set of candidates for the archaeal heat shock regulons. These genes encoded three groups of highly conserved proteins represented in all complete archaeal genomes, namely two families of chaperonins, AAA+ superfamily ATPases that are typically implicated in chaperone-like functions and histone H4 orthologs.
Table 1. Heat shock regulatory sites in archaea.


Italic, the initial sample taken from Kuo et al. (22); the remaining sites were predicted in this work; bold (bold italic), sites used for profile construction; underlined, weak sites (score below 4.0); capitals, nucleotides conforming to the consensus. All members of the relevant families are presented. Notation of COGs: H1, archaeal histone, histone H4 ortholog, first COG; H2, archaeal histone, histone H4 ortholog, second COG; H, archaeal histone, histone H4 ortholog; C1, chaperonin (small heat shock protein, thermosome subunit); C2, grpE–dnaK–dnaJ operon or parts hereof; C3, small heat shock protein (hsp20, class I chaperone); A1, AAA superfamily ATPase, cell cycle control, first COG; A2, AAA superfamily ATPase, cell cycle control, second COG; A3, AAA superfamily and related ATPases, ATP-dependent 26S protease regulatory subunit; OP, gene upstream of an operon containing A1 and C3 genes (see text and Fig. 1); GS, glutamine synthase. UP in column score indicates that an upstream gene is regulated; n/a stands for non-applicable; numbers in parentheses in the pos. column give the length of the upstream region if no site was found (position of the first coding nucleotide is given); up/g indicates that there is an upstream gene; u-def means that gene is the not mapped; C.G. in column AC stands for complete genome [note that the site upstream of M.thermoautotrophicum gene MTH794 was annotated in Fig. 3 of Smith et al. (37) as being upstream of gene MTH1817].
To refine the profile, we excluded the sites from the Crenarchaea (Sulfolobus) and included the candidate HSPs from the genes retrieved in the first iteration. Thus the final profile was constructed from 24 HSPs (Table 1). The results of searches with this profile indicated that, by itself, the signal contained in the profile was insufficient to predict regulon members (data not shown). Therefore, in order to make such predictions, we combined the scores produced by the profile search (see equation 1) with phylogenetic information obtained from the COGs. The four gene families mentioned above as well as the glutamine synthase gene from M.thermoautotrophicum, M.jannaschii and A.fulgidus were the only COGs in which the candidate HSP was conserved in at least three archaeal genomes.
Additional examination of the predicted functions of genes preceded by candidate HSPs, even if they had no orthologs in other genomes, was performed to find other likely members of the heat shock regulon. This resulted in the identification of a candidate HSP upstream of gene string grpE–dnaK–dnaJ of M.thermoautotrophicum that is likely to comprise an operon (Fig. 1).
Figure 1.
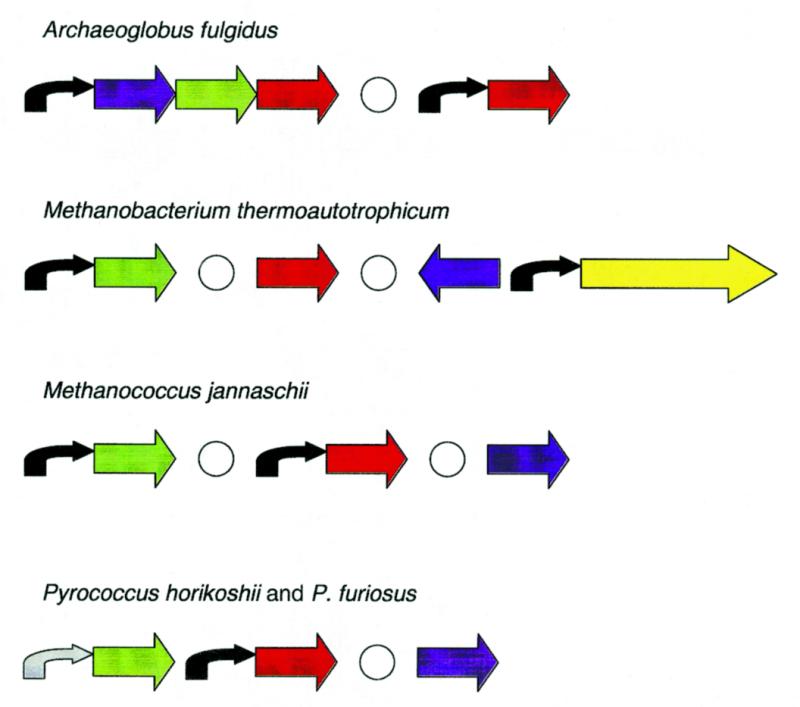
Possible operon structure of some candidate members of the heat shock regulon in the archaea. Blue, helix–turn–helix DNA-binding protein; green, A1 family ATPase; red, chaperone hsp20; yellow, grpE–dnaK–dnaJ gene string; black, candidate heat shock regulatory site; grey, weak heat shock site; white circles, delimiters. If there are several paralogs, only one is shown (see Table 1 for details).
Molecular chaperones. The most straightforward case of HSP conservation is that of HSP60-class heat shock proteins described as chaperonins (41) or thermosome components (42,43). Archaeoglobus fulgidus and M.thermoautotrophicum each encode two representatives of this COG whereas M.jannaschii and the three Pyrococcus spp. encode one representative each. All these genes, as well as representatives of this gene family in other archaea, possess candidate HSPs (Table 1). These genes are indeed regulated by heat shock (21,22,44,45). In some cases where we could find no candidate HSP (α-chaperonins of T.acidophilum strains, α- and β-chaperonins of Pyrococcus kodakarensis), it can be explained by the fact that only a short upstream sequence is available.
For another family of predicted molecular chaperones, namely small heat shock proteins (hsp20), strong candidate HSPs were found in M.jannaschii and A.fulgidus, weak HSPs were detected in P.horikoshii and P.furiosus (but not in P.abyssi, where the gene is interrupted by a frameshift) and no candidate HSPs (or possibly a weak site in one of the two representatives) were seen in M.thermoautotrophicum.
In addition to these families of molecular chaperones, the clustered genes for the grpE–dnaK–dnaJ chaperone group are present in M.thermoautotrophicum and in Methanosarcina mazei (46–48), in both cases in this order; the other archaea whose genomes have been sequenced lack these genes. There is a candidate HSP upstream of grpE in M.thermoautotrophicum (Table 1) but not upstream of any of the M.mazei genes, which are transcribed independently (46,47). In the orthologs of these genes in other archaeal species, the available upstream sequences are too short to include the HSPs. Given the functional plausibility, it seems likely that the putative grpE–dnaK–dnaJ operon of M.thermoautotrophicum indeed belongs to the heat shock regulon, but more sequence information on orthologs from other species is necessary for confident assignments.
Candidate HSPs were also detected in orthologous genes from M.jannaschii, M.thermoautotrophicum and the pyrococci that encode AAA+ superfamily ATPases (the A1 family in Table 1), whose exact functions are not known but that are typically associated with chaperone-like activities (49). In two more families of related ATPases (A2 and A3), potential HSPs were seen only in M.jannaschii and M.thermoautotrophicum (Table 1). Nevertheless, functional considerations suggest that these genes are likely to belong to the heat shock regulon.
Additional evidence comes from the location of the aforementioned genes in the archaeal genomes (Fig. 1). Archaeoglobus fulgidus possesses the gene string AF1298–AF1297–AF1296, where the proximal gene is a predicted HTH-containing DNA-binding protein (18), the middle one is an A1 family ATPase and the distal one is a hsp20 chaperonin. The distances between these genes are short (<20 nt) and there is a HSP upstream of the AF1298 gene. Thus it is likely that these three genes comprise a heat shock-regulated operon. AF1298 could be a heat shock gene transcription regulator that is also subject to autoregulation. In M.thermoautotrophicum, the ortholog of this HTH protein (MTH1288) is located upstream of the predicted grpE–dnaK–dnaJ operon but is transcribed divergently (Fig. 1) and therefore cannot be subject to regulation from the respective HSP (which is an asymmetrical regulatory site). Nevertheless, the juxtaposition of the gene encoding this transcriptional regulator and the predicted molecular chaperone operon is suggestive of a functional connection. In the pyrococci, the orthologs of the putative heat shock transcriptional regulator are not adjacent to any candidate members of the heat shock regulon, and in M.jannaschii, the identity of the corresponding HTH protein is not clear. In P.horikoshii and P.furiosus, the putative heat shock operon found in A.fulgidus is conserved, with the exception of the predicted regulator, and there are strong HSPs upstream of the A1 ATPase genes and weak HSPs upstream of the hsp20 genes (Fig. 1). In contrast, in P.abyssi, the orthologs of the A1 and hsp20 genes are not adjacent.
Thus, it appears that a partially conserved set of structurally and functionally diverse molecular chaperones belongs to the archaeal heat shock regulons.
Archaeal histones. Euryarchaea possess two distinct families of histone H4 orthologs. In all complete archaeal genomes, all of these genes, with a single exception, contain HSPs in the upstream regions; in addition, HSPs were detected in several histone genes from various partially sequenced archaea (Table 1). In cases when there are paralogs from one of the histone families encoded in the same genome, some of them may have weaker, but still discernible, sites (as in the H2 family of M.thermoautotrophicum and one of the three known histone genes of Methanobacterium formicum). The only histone gene without a candidate HSP is the gene MJECL29 of M.jannaschii, which is located on the large extrachromosomal element. Thus the histone genes in Euryarchaeota appear to belong to the heat shock regulon. Euryarchaeal histones could mediate topological changes in DNA during thermal stress, as proposed for the bacterial histone-like HU proteins (50,51) and the histone-like protein Sso7d from the crenarchaeon Sulfolobus solfataricus (52).
Glutamine synthetases. Candidate HSPs were observed upstream of glutamine synthetase genes from A.fulgidus, M.thermoautotrophicum, M.jannaschii and M.maripaludis, but not upstream of orthologous genes from Pyrococcus spp., H.volcanii and Methanococcus voltae (a weak candidate HSP is discernible in the latter case). A connection between nitrogen fixation genes and heat shock genes has been described previously; in α-proteobacteria, some of the groESL operons are transcribed from σ54 promoters activated by NifA (48,53). In archaea, we observe a reverse situation in that a gene involved in nitrogen fixation, namely glutamine synthetase, appears to be under heat shock regulation. More data is needed before this prediction can be considered reliable. It is notable, however, that the relative position of candidate HSPs and candidate nitrogen fixation regulatory sites in M.thermoautotrophicum and Methanococcus spp. genomes is the same (see below and Fig. 4).
Figure 4.
Candidate regulatory sites upstream of glnA genes. Red, HSP (heat shock promoter); blue, NIF (nitrogen fixation) box; numbers, distance to the start codon. Abbreviations are as in Figure 3.
The nitrogen fixation regulon of M.thermoautotrophicum and M.jannaschii
Two repressor-binding sites upstream of the nif operon from M.maripaludis have been identified by site-directed mutagenesis (23). Each of these sites is an imperfect palindrome. Since A.fulgidus and pyrococci do not fix nitrogen, we restricted the analysis of this system to the M.thermoautotrophicum and M.jannaschii genomes.
All archaeal nifH, glnA and glnB gene sequences were collected from GenBank (excluding complete genomes) and the signal determination procedure (Materials and Methods) was applied to their upstream regions. The derived profile was used to find candidate nitrogen fixation sites (NIF boxes) upstream of the nif operon of M.thermoautotrophicum and glnA genes of M.jannaschii. These sites were added to the sample and the final symmetrical profile was constructed (Table 2).
Table 2. Nitrogen fixation regulatory sites in archaea.

Italic bold, sites identified by the signal determination procedure and used to construct the initial profile; bold, sites used to construct the final profile; capitals, nucleotides conforming to the consensus; numbers in parentheses in the ‘pos.’ column give the length of the upstream region if no site was found (position of the first coding nucleotide is given); C.G. in column AC stands for complete genome.
This profile was used again to scan the two complete genomes. With the threshold of 3.90 (score calculated using equation 1), 10 and eight candidate sites were detected in M.jannaschii and M.thermoautotrophicum, respectively. The sample of candidate regulon members was completed by including likely co-transcribed genes, and the conservation of the respective genes in the two genomes was examined. This allowed us to identify two additional, conserved and functionally relevant operons that are predicted to belong to the nitrogen fixation regulon (Fig. 2 and Table 2). Each of these predicted operons includes the glnB (glutamine synthetase regulator) and amtB (ammonium transporter) genes. In M.thermoautotrophicum, the glnB gene is found in two different contexts, with two copies within the nif operon and two more in predicted operons with the permeases; in contrast, M.jannaschii encodes only the permease-linked versions (Fig. 2). The nifH gene that encodes the iron–sulfur subunit of the nitrogenase is present in an apparently regulated form within the nif operon in M.thermoautotrophicum and several other archaeal species, and also as a stand-alone, probably unregulated gene; M.jannaschii possesses only the stand-alone version. Phylogenetic tree analysis showed a separation between the regulated and unregulated versions of nifH (Fig. 3).
Figure 2.
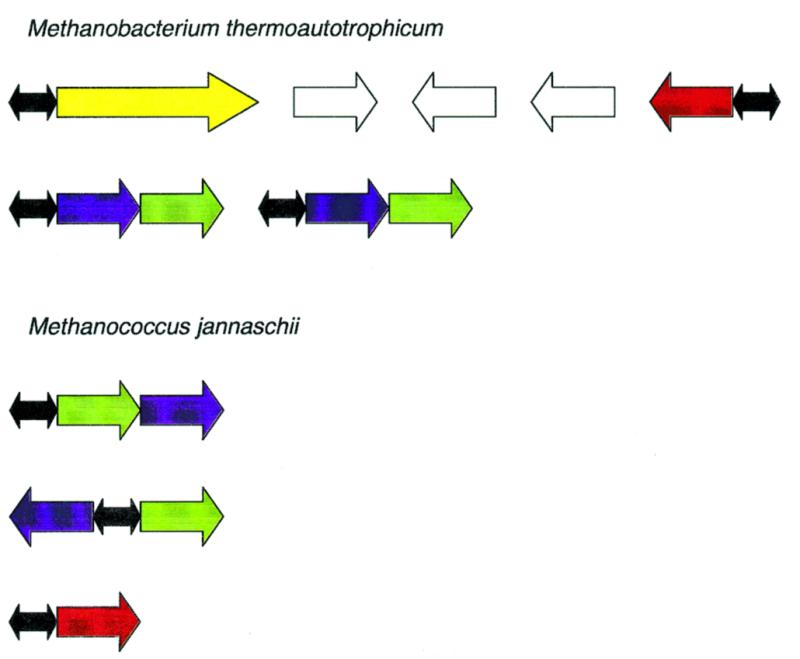
Organization of archaeal nitrogen fixation loci. Yellow, nif operon (nifH–glnBa–glnBb–nifK–nifE–nifN); red, glnA; green, glnB; blue, amtB (ammonium transporter); white, genes that are not members of the NIF regulon; black, NIF boxes. See Table 2 for details.
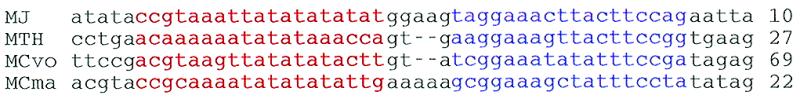
Figure 3.

A phylogenetic tree of archaeal nitrogenases. Italic, regulated nifH genes from nif operons (as opposed to stand-alone, apparently unregulated genes); bold, nifH genes with upstream candidate signals. SwissProt or GenBank ‘gi’ identifiers are given. The numbers indicate the number of bootstrap replications, out of 1000, that support each node. MJ, Methanococcus jannaschii (complete genome); MCtl, Methanococcus thermolithotrophus; MCma, Methanococcus maripaludis; MCvo, Methanococcus voltae; MTH, Methanobacterium thermoautotrophicum strain delta (complete genome); MBth, M.thermoautotrophicum strain Marburg; MBiv, Methanobacterium ivanovii; MSba, Methanosarcina barkeri.
Finally, the glutamine synthetase (glnA) genes of M.thermoautotrophicum and M.jannaschii seem to be under dual control of the HSP and the NIF box. The relative position of the candidate regulatory sites is conserved in the two genomes, which is compatible with the double regulation hypothesis (Fig. 4).
The tryptophan regulon of M.thermoautotrophicum
Two point mutations leading to deregulation of the tryptophan operon in M.thermoautotrophicum strain Marburg have been described (54). Our attempts to identify common regulatory signals upstream of genes involved in aromatic amino acid biosynthesis, either by comparison of the four complete archaeal genomes or by comparison of the M.thermoautotrophicum strains, were unsuccessful. However, when the sample was supplemented by upstream regions of the two tryptophan operons from H.volcanii (55,56), a signal was discovered upstream of the tryptophan operons of H.volcanii and M.thermoautotrophicum. This signal is highly specific; the only other high scoring site in the complete genome of M.thermoautotrophicum is located upstream of the trpB gene that encodes the tryptophan synthase β-subunit.
The signal consists of two or more (imperfect) repeats of the TRP box TGTACA, which are separated by 3–5 bp (Table 3). Using a less restrictive rule resulted in the detection of additional copies of this signal upstream of other genes of M.thermoautotrophicum that encode enzymes of aromatic amino acid metabolism (Fig. 5 and Table 3). The aromatic amino acid regulon of M.thermoautotrophicum is predicted to include all the genes that encode enzymes of tryptophan metabolism; in contrast, in the tyrosine and phenylalanine biosynthesis pathways, only genes for two intermediate enzymes, namely chorismate mutase and prephenate dehydrogenase, appear to be regulated.
Table 3. Predicted TRP boxes in M.thermoautotrophicum.

Bold, the best 2-box site. The total number of candidate 3-box signals (at threshold 7.0) is 11, of which four are correct (i.e. located upstream of genes involved in tryptophan metabolism). The total number of 2-box signals (at threshold 5.5) is 9, with four correct ones.
bMTH748, chorismate synthase (aroC); MTH804, chorismate mutase (pheA); MTH1640, tryptophan synthase β-subunit (trpB paralog); MTH1654, predicted transcriptional regulator (see text); MTH1655, anthranilate synthase component I (trpE).
Figure 5.

TRP boxes upstream of archaeal aromatic amino acid operons. Blue, candidate TRP boxes; red, a position mutated in a deregulated strain of M.thermoautotrophicum Marburg (an upstream site with a mutation that has the same effect is not shown); bold, protein-coding regions; italic, transcribed regions (when known); underlined, TATA box; numbers, distance to start codon. MTH, M.thermoautotrophicum delta; MBth, M.thermoautotrophicum Marburg; Hvu, Haloferax volcanii.
The gene located upstream of the trp operon of M.thermoautotrophicum and transcribed in the opposite direction (MTH1654) could encode the regulator of the aromatic amino acid regulon. The sequence between this gene and the proximal gene of the trp operon (MTH1655, the TrpE ortholog) contains two pairs of TRP boxes that symmetrically flank the likely promoter and could mediate the regulation of both MTH1654 and the trp operon (Fig. 5). Analysis of the amino acid sequence of MTH1654 and its orthologs from A.fulgidus and P.horikoshii is compatible with this protein being a transcription regulator. It contains a C-terminal ACT (acetolactate synthase–chorismate mutase–TyrR) domain which is implicated in the allosteric regulation of numerous enzymes through binding the respective ligands and also in transcription regulation by the TyrR protein, where it is predicted to bind tyrosine (57). Thus in MTH1654 and its orthologs, the ACT domain could bind tryptophan (and possibly other aromatic amino acids), which acts as a co-repressor for the respective genes. One of the mutations that impair the regulation of tryptophan biosynthesis in the Marburg strain of M.thermoautotrophicum maps to the ACT domain of MTH1654 (54). The N-terminal domain of these putative regulators showed limited, not statistically significant, similarity to bacterial HTH proteins (E.V.Koonin, unpublished observations). Given the combined evidence on the regulatory signals and the protein domain architecture, we suspect that this is indeed a derived HTH DNA-binding domain.
The purine regulon in Pyrococcus spp.
In an attempt to analyze potential purine regulons, we collected upstream regions of all genes implicated in purine metabolism in the four complete archaeal genomes and applied the signal detection procedure. However, the candidate signals were not similar, which precluded cross-validation (data not shown).
As an alternative approach, we searched for potential purine regulons in three Pyrococcus genomes. In this case, the strongest signal was the same in each of the three species. The profile (PUR box) was derived from a sample containing highest scoring candidates from all three genomes. When this profile was used to scan the genomes, we noted that the upstream regions of several genes encoding purine metabolism enzymes contained two candidate PUR boxes. Thus the procedure was modified to search for two PUR boxes at a fixed distance (21–24 bp) from each other. This procedure was highly specific since, based on functional assignments, nearly all of the identified genes are likely members of the purine regulon (Table 4).
Table 4. Purine boxes in Pyrococcus spp.

All genes with signals scoring above the threshold of 7.0 are included. The P.furiosus and P.abyssi gene names are ORF names from http://www.genome.utah.edu and http://www.genoscope.cns.fr , respectively. Bold, sites used to derive the profile; underlined, weak sites (purA); underlined italic, probable false positives (glnA).
Many genes of the predicted purine regulons in the pyrococci are organized into compact loci, some of which are likely to be operons. Comparison of these loci revealed several rearrangements (Fig. 6) but the regulation seems to be retained. In particular, in the purTE(K)D locus of P.furiosus, the purK gene is inserted between purE and the PUR box (Fig. 6). This is the first purK gene detected in the archaea (19).
Figure 6.

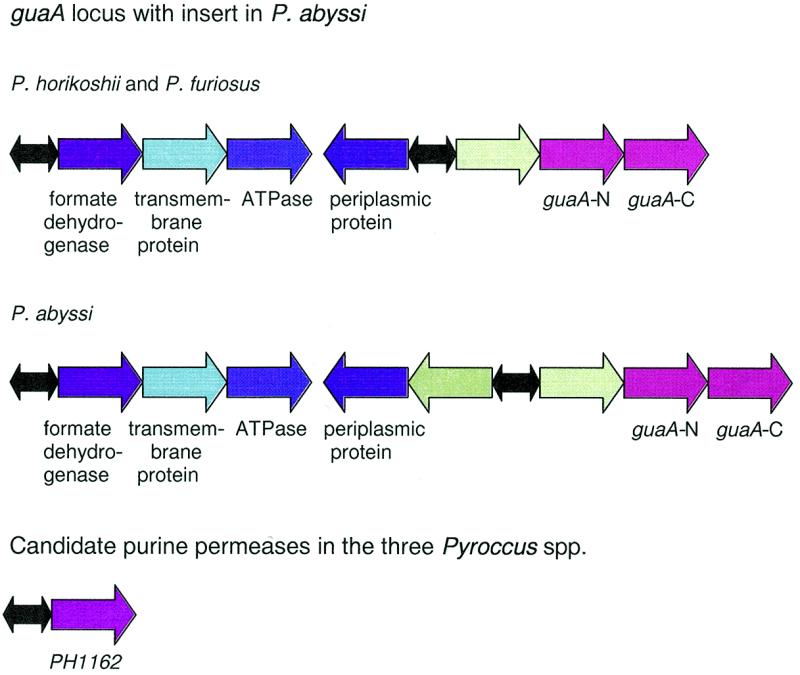
The predicted purine regulons in Pyrococcus spp. Shades of red and yellow, purine metabolism genes; shades of blue, candidate members of the purine regulon; shades of green, genes that are apparently unrelated to purine biosynthesis; black, cooperative PUR signal (two boxes); grey, cooperative signal or strong non-cooperative signal; white circle, delimiter.
A conserved PUR box was identified upstream of the P.horikoshii gene PH1162 and its orthologs in the two other pyrococci that are predicted to encode a permease. This protein is a highly conserved homolog of a family of E.coli permeases that, in our previous study, have been predicted to belong to the purine regulon (11). The apparent conservation of the regulation of these orthologous permeases in such distant species as the pyrococci and E.coli suggests an ancient, tight functional coupling between purine biosynthesis and transport.
The purine regulon of the pyrococci appears to include another transport system, namely a three-component ABC transporter (Fig. 6). The periplasmic binding protein in this system (PH1349 and its orthologs) shows high similarity to bacterial thiamine-binding proteins (data not shown). It remains unclear whether there is some type of coupling between purine metabolism and thiamine transport in the pyrococci or the specificity of this ABC transporter has changed.
Conclusions and general implications
By combining a profile-based search for relatively weak signals and phylogenetic analysis at the level of protein sequences, we predicted several regulons in the archaea. To our knowledge, such predictions have not been previously made for any archaeal genomes. We believe that experimental testing of at least some of these predictions, in particular the heat shock regulation of archaeal histone genes, will be important for understanding transcription regulation and environmental adaptation in the archaea.
The principal message brought about by this analysis, however, seems to be that regulatory signals are, in general, very weak, and systematic prediction of regulons is not feasible without a complementary comparative analysis of multiple genomes. Moreover, dense population of the genome sequence space by sequences with varying degrees of conservation, including closely related ones, appears to be critical. This is illustrated by the analysis of the pyrococcal purine regulon, for which the genome sequences of the three closely related species were indispensable, as well as by the prediction of the M.thermoautotrophicum aromatic amino acid regulon that relied on the data from halobacteria. A related conclusion is that the operon organization in the archaea is at least as variable as in bacteria. The existence of significant variation in the gene arrangements and predicted regulation patterns even among the closely related Pyrococcus spp. and the very limited conservation among the more distant genomes testify to this conclusion. Thus, deciphering the complete system of transcription regulation in archaea, with predicted regulators matched with the cognate operons, is a complicated task that will require extensive sequencing of new genomes, further development of computational techniques for signal recognition and complementary experimental efforts.
Acknowledgments
ACKNOWLEDGEMENTS
We thank R. L. Tatusov and K. S. Makarova for help with the analysis of archaeal COGs. M.G. and A.M. gratefully acknowledge discussions with N. Maltsev and R. Overbeek. This study was partially supported by grants from the Russian Fund of Basic Research to M.G. and the Russian State Scientific Program ‘Human Genome’ to M.G. and A.M. Most of this work was performed during a visit by M.G. and A.M. to the National Center for Biotechnology Information in Bethesda.
REFERENCES
- 1.Huynen M.A. and Bork,P. (1998) Proc. Natl Acad. Sci. USA, 95, 5849–5856. [DOI] [PMC free article] [PubMed] [Google Scholar]
- 2.Koonin E.V. and Galperin,M.Y. (1997) Curr. Opin. Genet. Dev., 7, 757–763. [DOI] [PubMed] [Google Scholar]
- 3.Koonin E.V., Tatusov,R.L. and Galperin,M.Y. (1998) Curr. Opin. Struct. Biol., 8, 355–363. [DOI] [PubMed] [Google Scholar]
- 4.Dandekar T., Snel,B., Huynen,M. and Bork,P. (1998) Trends Biochem. Sci., 23, 324–328. [DOI] [PubMed] [Google Scholar]
- 5.Overbeek R., Fonstein,M., D’Souza,M., Pusch,G.D. and Maltsev,N. (1999) Proc. Natl Acad. Sci. USA, 96, 2896–2901. [DOI] [PMC free article] [PubMed] [Google Scholar]
- 6.Himmelreich R., Plagens,H., Hilbert,H., Reiner,B. and Herrmann,R. (1997) Nucleic Acids Res., 25, 701–712. [DOI] [PMC free article] [PubMed] [Google Scholar]
- 7.Kalman S., Mitchell,W., Marathe,R., Lammel,C., Fan,J., Hyman,R.W., Olinger,L., Grimwood,J., Davis,R.W. and Stephens,R.S. (1999) Nature Genet., 21, 385–389. [DOI] [PubMed] [Google Scholar]
- 8.Tatusov R.L., Mushegian,A.R., Bork,P., Brown,N.P., Hayes,W.S., Borodovsky,M., Rudd,K.E. and Koonin,E.V. (1996) Curr. Biol., 6, 279–291. [DOI] [PubMed] [Google Scholar]
- 9.Bork P., Dandekar,T., Diaz-Lazcoz,Y., Eisenhaber,F., Huynen,M. and Yuan,Y. (1998) J. Mol. Biol., 283, 707–725. [DOI] [PubMed] [Google Scholar]
- 10.Lin E.C.C. and Lynch,A.S. (eds) (1996) Regulation of Gene Expression in Escherichia coli. R.G. Landes Co., NY.
- 11.Mironov A.A., Koonin,E.V., Roytberg,M.A. and Gelfand,M.S. (1999) Nucleic Acids Res., 27, 2981–2989. [DOI] [PMC free article] [PubMed] [Google Scholar]
- 12.Thomm M. (1996) FEMS Microbiol. Rev., 18, 159–171. [DOI] [PubMed] [Google Scholar]
- 13.Brown J.R. and Doolittle,W.F. (1997) Microbiol. Mol. Biol. Rev., 61, 456–502. [DOI] [PMC free article] [PubMed] [Google Scholar]
- 14.Bell S.D. and Jackson,S.P. (1998) Trends Microbiol., 6, 222–228. [DOI] [PubMed] [Google Scholar]
- 15.Koonin E.V., Mushegian,A.R., Galperin,M.Y. and Walker,D.R. (1997) Mol. Microbiol., 25, 619–637. [DOI] [PubMed] [Google Scholar]
- 16.Kyrpides N.C. and Ouzounis,C.A. (1997) J. Mol. Evol., 45, 706–707. [PubMed] [Google Scholar]
- 17.Kyrpides N.C. and Ouzounis,C.A. (1999) Proc. Natl Acad. Sci. USA, 96, 8545–8550. [DOI] [PMC free article] [PubMed] [Google Scholar]
- 18.Aravind L. and Koonin,E.V. (1999) Nucleic Acids Res., 27, 4658–4670. [DOI] [PMC free article] [PubMed] [Google Scholar]
- 19.Makarova K.S., Aravind,L., Galperin,M.Y., Grishin,N.V., Tatusov,R.L., Wolf,Y.I. and Koonin,E.V. (1999) Genome Res., 9, 608–628. [PubMed] [Google Scholar]
- 20.Thompson D.K., Palmer,J.R. and Daniels,C.J. (1999) Mol. Microbiol., 33, 1081–1092. [DOI] [PubMed] [Google Scholar]
- 21.Thompson D.K. and Daniels,C.J. (1998) Mol. Microbiol., 27, 541–551. [DOI] [PubMed] [Google Scholar]
- 22.Kuo Y.P., Thompson,D.K., St Jean,A., Charlebois,R.L. and Daniels,C.J. (1997) J. Bacteriol., 179, 6318–6324. [DOI] [PMC free article] [PubMed] [Google Scholar]
- 23.Cohen-Kupiec R., Blank,C. and Leigh,J.A. (1997) Proc. Natl Acad. Sci. USA, 94, 1316–1320. [DOI] [PMC free article] [PubMed] [Google Scholar]
- 24.Pfeifer F., Kruger,K., Roder,R., Mayr,A., Ziesche,S. and Offner,S. (1997) Arch. Microbiol., 167, 259–268. [DOI] [PubMed] [Google Scholar]
- 25.Kruger K., Hermann,T., Armbruster,V. and Pfeifer,F. (1998) J. Mol. Biol., 279, 761–771. [DOI] [PubMed] [Google Scholar]
- 26.Baliga N.S. and DasSarma,S. (1999) J. Bacteriol., 181, 2513–2518. [DOI] [PMC free article] [PubMed] [Google Scholar]
- 27.Gelfand M.S. (1995) J. Comput. Biol., 2, 87–115. [DOI] [PubMed] [Google Scholar]
- 28.Frech K., Quandt,K. and Werner,T. (1997) Comput. Appl. Biosci., 13, 89–97. [DOI] [PubMed] [Google Scholar]
- 29.Gralla J.D. and Collado-Vides,J. (1996) In Neidhardt,F.C., Curtiss,R.C., III, Ingraham,J.L., Lin,E.C.C., Low,K.B., Magasanik,B., Reznikoff,W.S., Riley,M., Schaechter,M. and Umbarger,H.E. (eds), Escherichia coli and Salmonella. Cellular and Molecular Biology. ASM Press, Washington, DC, Vol. 1, pp. 1232–1245.
- 30.Schneider T.D., Stormo,G.D., Gold,L. and Ehrenfeucht,A. (1986) J. Mol. Biol., 188, 415–431. [DOI] [PubMed] [Google Scholar]
- 31.Mironov A.A. and Gelfand,M.S. (1999) Mol. Biol. (Moscow), 33, 772–778. [PubMed] [Google Scholar]
- 32.Thompson J.D., Gibson,T.J., Plewniak,F., Jeanmougin,F. and Higgins,D.G. (1997) Nucleic Acids Res., 25, 4876–4882. [DOI] [PMC free article] [PubMed] [Google Scholar]
- 33.Altschul S.F., Madden,T.L., Schaffer,A.A., Zhang,J., Zhang,Z., Miller,W. and Lipman,D.J. (1997) Nucleic Acids Res., 25, 3389–3402. [DOI] [PMC free article] [PubMed] [Google Scholar]
- 34.Altschul S.F. and Koonin,E.V. (1998) Trends Biochem. Sci., 23, 444–447. [DOI] [PubMed] [Google Scholar]
- 35.Felsenstein J. (1996) Methods Enzymol., 266, 418–427. [DOI] [PubMed] [Google Scholar]
- 36.Bult C.J., White,O., Olsen,G.J., Zhou,L., Fleischmann,R.D., Sutton,G.G., Blake,J.A., FitzGerald,L.M., Clayton,R.A., Gocayne,J.D., et al. (1996) Science, 273, 1058–1073. [DOI] [PubMed] [Google Scholar]
- 37.Smith D.R., Doucette-Stamm,L.A., Deloughery,C., Lee,H., Dubois,J., Aldredge,T., Bashirzadeh,R., Blakely,D., Cook,R., Gilbert,K., et al. (1997) J. Bacteriol., 179, 7135–7155. [DOI] [PMC free article] [PubMed] [Google Scholar]
- 38.Klenk H.P., Clayton,R.A., Tomb,J.F., White,O., Nelson,K.E., Ketchum,K.A., Dodson,R.J., Gwinn,M., Hickey,E.K., Peterson,J.D., et al. (1997) Nature, 390, 364–370. [DOI] [PubMed] [Google Scholar]
- 39.Kawarabayasi Y., Sawada,M., Horikawa,H., Haikawa,Y., Hino,Y., Yamamoto,S., Sekine,M., Baba,S., Kosugi,H., Hosoyama,A., et al. (1998) DNA Res., 5, 147–155. [DOI] [PubMed] [Google Scholar]
- 40.Benson D.A., Boguski,M.S., Lipman,D.J., Ostell,J., Ouellette,B.F., Rapp,B.A. and Wheeler,D.L. (1999) Nucleic Acids Res., 27, 12–17. [DOI] [PMC free article] [PubMed] [Google Scholar]
- 41.Yoshida T., Yohda,M., Iida,T., Maruyama,T., Taguchi,H., Yazaki,K., Ohta,T., Odaka,M., Endo,I. and Kagawa,Y. (1997) J. Mol. Biol., 273, 635–645. [DOI] [PubMed] [Google Scholar]
- 42.Waldmann T., Lupas,A., Kellermann,J., Peters,J. and Baumeister,W. (1995) Biol. Chem. Hoppe Seyler, 376, 119–126. [DOI] [PubMed] [Google Scholar]
- 43.Andra S., Frey,G., Nitsch,M., Baumeister,W. and Stetter,K.O. (1996) FEBS Lett., 379, 127–131. [DOI] [PubMed] [Google Scholar]
- 44.Kagawa H.K., Osipiuk,J., Maltsev,N., Overbeek,R., Quaite-Randall,E., Joachimiak,A. and Trent,J.D. (1995) J. Mol. Biol., 253, 712–725. [DOI] [PubMed] [Google Scholar]
- 45.Emmerhoff O.J., Klenk,H.P. and Birkeland,N.K. (1998) Gene, 215, 431–438. [DOI] [PubMed] [Google Scholar]
- 46.Clarens M., Macario,A.J. and Conway de Macario,E. (1995) J. Mol. Biol., 250, 191–201. [DOI] [PubMed] [Google Scholar]
- 47.Conway de Macario E., Clarens,M. and Macario,A.J. (1995) J. Bacteriol., 177, 544–550. [DOI] [PMC free article] [PubMed] [Google Scholar]
- 48.Fischer H.M., Babst,M., Kaspar,T., Acuna,G., Arigoni,F. and Hennecke,H. (1993) EMBO J., 12, 2901–2912. [DOI] [PMC free article] [PubMed] [Google Scholar]
- 49.Neuwald A.F., Aravind,L., Spouge,J.L. and Koonin,E.V. (1999) Genome Res., 9, 27–43. [PubMed] [Google Scholar]
- 50.Ogata Y., Inoue,R., Mizushima,T., Kano,Y., Miki,T. and Sekimizu,K. (1997) Biochim. Biophys. Acta, 1353, 298–306. [DOI] [PubMed] [Google Scholar]
- 51.Mizushima T., Kataoka,K., Ogata,Y., Inoue,R. and Sekimizu,K. (1997) Mol. Microbiol., 23, 381–386. [DOI] [PubMed] [Google Scholar]
- 52.Lopez-Garcia P., Knapp,S., Ladenstein,R. and Forterre,P. (1998) Nucleic Acids Res., 26, 2322–2328. [DOI] [PMC free article] [PubMed] [Google Scholar]
- 53.Krishnan H.B. and Pueppke,S.G. (1991) Mol. Microbiol., 5, 737–745. [DOI] [PubMed] [Google Scholar]
- 54.Gast D.A., Wasserfallen,A., Pfister,P., Ragettli,S. and Leisinger,T. (1997) J. Bacteriol., 179, 3664–3669. [DOI] [PMC free article] [PubMed] [Google Scholar]
- 55.Lam W.L., Cohen,A., Tsouluhas,D. and Doolittle,W.F. (1990) Proc. Natl Acad. Sci. USA, 87, 6614–6618. [DOI] [PMC free article] [PubMed] [Google Scholar]
- 56.Lam W.L., Logan,S.M. and Doolittle,W.F. (1992) J. Bacteriol., 174, 1694–1697. [DOI] [PMC free article] [PubMed] [Google Scholar]
- 57.Aravind L. and Koonin,E.V. (1999) J. Mol. Biol., 287, 1023–1040. [DOI] [PubMed] [Google Scholar]