

Abstract
Cognitive demand is thought to modulate two often used, but rarely combined, measures: pupil size and neural α (8–12 Hz) oscillatory power. However, it is unclear whether these two measures capture cognitive demand in a similar way under complex audiovisual-task conditions. Here we recorded pupil size and neural α power (using electroencephalography), while human participants of both sexes concurrently performed a visual multiple object-tracking task and an auditory gap detection task. Difficulties of the two tasks were manipulated independent of each other. Participants' performance decreased in accuracy and speed with increasing cognitive demand. Pupil size increased with increasing difficulty for both the auditory and the visual task. In contrast, α power showed diverging neural dynamics: parietal α power decreased with increasing difficulty in the visual task, but not with increasing difficulty in the auditory task. Furthermore, independent of task difficulty, within-participant trial-by-trial fluctuations in pupil size were negatively correlated with α power. Difficulty-induced changes in pupil size and α power, however, did not correlate, which is consistent with their different cognitive-demand sensitivities. Overall, the current study demonstrates that the dynamics of the neurophysiological indices of cognitive demand and associated effort are multifaceted and potentially modality-dependent under complex audiovisual-task conditions.
SIGNIFICANCE STATEMENT Pupil size and oscillatory α power are associated with cognitive demand and effort, but their relative sensitivity under complex audiovisual-task conditions is unclear, as is the extent to which they share underlying mechanisms. Using an audiovisual dual-task paradigm, we show that pupil size increases with increasing cognitive demands for both audition and vision. In contrast, changes in oscillatory α power depend on the respective task demands: parietal α power decreases with visual demand but not with auditory task demand. Hence, pupil size and α power show different sensitivity to cognitive demands, perhaps suggesting partly different underlying neural mechanisms.
Keywords: α oscillations, audiovisual dual task, cognitive demand, gap detection, multiple object-tracking task, pupil dilation
Introduction
Many situations in everyday life require the integration of information from different sensory modalities. However, cognitive resources are limited (Kahneman, 1973; Lavie, 1995), and, depending on the induced cognitive demand, such situations may be experienced as effortful (Pichora-Fuller et al., 2016; Herrmann and Johnsrude, 2020). A better understanding of how individuals manage cognitive resources under complex multisensory conditions and of the underlying psychophysiology are critical to objectively measuring and identifying effort in people who struggle.
Dual-task paradigms are often used in behavioral research to investigate how perceptual or cognitive demands in one modality affect performance in another modality (Desjardins and Doherty, 2013; Picou and Ricketts, 2014; Wu et al., 2016; Gagné et al., 2017). A hallmark result of dual-task paradigms indicating cognitive constraint is the deterioration of behavioral performance for concurrent tasks that would be performed with high accuracy and speed if conducted separately (Gosselin and Gagné, 2011; Picou and Ricketts, 2014). In addition, manipulating the difficulty of the individual tasks allows tapping into the dynamic allocation of cognitive resources to either task as a function of the respective task difficulty combinations. The current study aims to understand how physiological responses change with varying degrees of task difficulty and thus cognitive demand in single-task and dual-task conditions combining the auditory and visual domains.
At least two neurophysiological measures have been associated with changes in cognitive demand: pupil size (Zekveld et al., 2018; Joshi and Gold, 2020) and neural oscillatory activity in the α-frequency band (8–12 Hz; Obleser et al., 2012; Wisniewski et al., 2017; Paul et al., 2021). Pupil size variations are thought to be driven by noradrenergic pathways from the locus coeruleus (LC; Murphy et al., 2014; Liu et al., 2017), supporting attention and selective attention (Vazey et al., 2018; Dahl et al., 2020). Recent work suggests that the relation between LC activity and pupil size may be more complicated (Megemont et al., 2022) and that other brain structures, such as the pretectal olivary nucleus and the superior colliculus, are also part of the network that regulates pupil size (Aston-Jones and Cohen, 2005; Joshi and Gold, 2020; Wang and Munoz, 2021; Burlingham et al., 2022), indicating that pupil size variations may only be partly driven by norepinephrine pathways from LC (Megemont et al., 2022).
Pupil size varies with the degree to which a person engages cognitively in a task (Kahneman and Beatty, 1966). In the auditory domain, pupil size may indicate listening effort as it increases with increasing speech comprehension difficulty induced by acoustic or linguistic challenges (Zekveld et al., 2010; Wendt et al., 2016; Winn et al., 2016; Miles et al., 2017; Kadem et al., 2020). In the visual domain, pupil size also increases with the degree of cognitive demand during visual search tasks (Porter et al., 2007; Martin et al., 2020; Stolte et al., 2020). However, it is currently unknown whether pupil size constitutes an objective marker of cognitive effort under more realistically complex audiovisual conditions.
The second neurophysiological measure that may enable segregating different contributions associated with cognitive demand is neural α power (8–12 Hz; Petersen et al., 2015; Dimitrijevic et al., 2017; Wöstmann et al., 2017; Paul et al., 2021). The α power in parietal cortex increases when auditory-induced cognitive demand increases (Henry et al., 2017; Winneke et al., 2020; Herrmann et al., 2023), such as with acoustic degradation of speech (Obleser et al., 2012; Wöstmann et al., 2015). In contrast, increased cognitive demand in a visual task leads to a decrease in α power, often in visual rather than parietal areas (Roijendijk et al., 2013; Erickson et al., 2019; Magosso et al., 2019). Recent work further suggests that LC activity is modulating neural oscillatory activity (Dahl et al., 2020, 2022), raising the possibility that pupil size and neural oscillatory activity are both driven by a common underlying neural process, which might be noradrenergically mediated.
The present study examines this hypothesis. We investigate how pupil size and source-localized α power in various sensory and executive brain areas are affected by varying levels of cognitive demand in an audiovisual, dual-task setting.
Materials and Methods
Participants.
Twenty-four adults (age range, 19–30 years; mean age, 23.7 years; SD = 3.09 years; 7 males, 17 females; all right handed) were recruited for the current study via the participant database of the Department of Psychology at the University of Lübeck. They were native speakers of German and reported no history of neural disorders or hearing problems.
Each participant took part in two sessions. In the first session, participants separately performed two single tasks. In the second session, participants performed the same tasks in a dual-task procedure. Task procedures are described in detail below. The two sessions were conducted on different days, separated by at least 1 d (median separation time, 7 d; range of separation time, 1–18 d).
Participants gave written informed consent before participation and were financially compensated with €10/h or received course credits. The study was conducted in accordance with the Declaration of Helsinki and was approved by the local ethics committee of the University of Lübeck.
Experimental environment.
Participants were seated in a comfortable chair in a sound-attenuated booth. Participants placed their head on a chinrest positioned at ∼70 cm distance from a computer monitor (refresh rate, 60 Hz; model TD2421, ViewSonic). The experimental stimulation was controlled by a desktop computer (Windows 7) running Psychtoolbox-3 in MATLAB and an external RME Fireface UC sound card. Visual stimulation was mirrored from the stimulation computer to the computer monitor in the sound booth. Sound was delivered binaurally via in-ear headphones (model EARTONE 3A, 3M). Responses were given via a four-button response box (The Black Box ToolKit).
Auditory stimuli were presented at 50 dB sensation level estimated using a method-of-limits procedure (Herrmann et al., 2018). The individual hearing threshold was estimated with white noise stimulation. White noise sounds of 15 s either decreased or increased in intensity by 4 dB/s. Participants pressed a button as soon as they could no longer hear the sound (intensity decreased) or as soon as they could hear the sound (intensity increased). The procedure contained four increasing and four decreasing trials. The hearing threshold was estimated by averaging the eight intensity values.
Experimental design.
In all task conditions, participants were simultaneously presented with auditory and visual stimulation. The auditory stimulation consisted of a 7 s white noise sound in which a single gap occurred at one of 70 randomly selected and linearly spaced time points at 4–6 s post-noise onset (Fig. 1A). The task for participants was to press a button on a response box as soon as they detected the gap.
Figure 1.

Experimental design. A, Trial design. Auditory and visual stimuli were presented concurrently. Auditory gap detection task: participant had to detect a gap within 7 s of white noise (the gap could occur within the 4–6 s time window). For the hard condition, the gap duration was individually titrated to 75% correct. For the easy condition, the gap duration was doubled. In the multiple object-tracking task, participants viewed 16 moving dots and were asked to follow the initially cued (red) dots in a moving-dot scene. After 7 s, dots stopped moving, and three dots were marked green and labeled 1, 2, and 3. Participants had to decide which of the three dots was among the cued dots. Participants had to follow one (easy; depicted here) or five (hard) dots. Analyses focused on the 3–4 s time window (pregap window; and additionally on the 5–6 s window for pupil size because of its slow response). B, Design for the single-task session (left) and the dual-task session (right). In the single-task session, participants performed the auditory and visual tasks separately (but were always presented with the audiovisual stimulation). In the dual-task condition, participants performed both tasks simultaneously.
The auditory gap detection task comprised two difficulty levels. In the hard condition, gap duration was titrated for each individual participant to ∼75% gap detection performance in training blocks before the main experimental blocks (four to six training blocks, each ∼2 min). In the easy condition, the estimated gap duration was doubled. A button response occurring between 0.1 and 1 s post-gap onset was counted as a hit. Response time (RT) was calculated as the time elapsed between gap onset and button press. Response speed was calculated as the inverse of response times (1/RT). Response speed was averaged across trials, separately for each condition and participant. Note that we did not analyze perceptual sensitivity (d′; Green and Swets, 1966), because (1) the task was not only about gap detection, but also required individuals to identify when in time the gap occurred; (2) there were very few responses outside of the time window we used to identify a hit response (across participants only ∼10% of trials in the hard auditory condition and ∼1% of trials in the easy auditory condition contained a button press outside of the “hit” window); and (3) because of the possibility of responding twice on the same trial, within and outside of the defined time window, resulting in both a hit and a false alarm response.
The visual stimulation consisted of a multiple object-tracking (MOT) display (Pylyshyn and Storm, 1988; Cavanagh and Alvarez, 2005; Herrmann and Johnsrude, 2018a) that requires sustained attention throughout the entire stimulation period (Tombu and Seiffert, 2008; Scholl, 2009). The computer monitor displayed a 14 × 14 cm white-edged black rectangle on a black background at a distance of 70 cm from participants' eyes (visual angle, ∼13°). A small, yellow fixation square was presented at the center of the rectangle. Participants were instructed to fixate their gaze on the fixation square. The critical stimuli were 16 dots presented within the borders of a rectangle (Fig. 1A). At the beginning of each trial (before sound onset), a stationary display of the 16 dots was shown for 1 s. One or 5 of the 16 dots were colored red (target dots), whereas the rest of the dots were white (distractor dots). We refer to the one-dot condition as the “easy” visual condition, whereas we refer to the five-dot condition as the “hard” visual condition. After 1 s, the dots that were marked in red turned to white, and all 16 dots started to move for 7 s, simultaneously with the presentation of the white noise auditory stimulus. By keeping the number of presented dots constant across difficulty conditions, luminance during dot movement did not change across conditions. Dots moved in random directions on each trial, ensuring that dot movements and task difficulty are unconfounded. Participants were instructed to follow the target dots (i.e., the dots that were previously marked in red) over the 7 s period. After 7 s, all dots stopped moving, and one target dot and two distractor dots were colored green. The three colored dots were also overlaid by the numbers 1, 2, and 3. Participants had to decide which of the three dots was a target dot by pressing the respective button on the response box with no explicit time limit. Response times for the visual task were calculated as the time elapsed between the onset of the answer screen and the occurrence of a button press. Again, response speed was calculated (1/RT) and averaged across trials for each participant and condition.
In the single-task session, participants were presented with a total of 70 trials for each of the four resulting task and difficulty combinations (Fig. 1B, left). Trials were split across eight blocks of 35 trials each. Task modality and difficulty levels were varied block by block, resulting in two blocks per task modality and difficulty condition. The order of auditory-task blocks and visual-task blocks alternated. Starting block and difficulty conditions were counterbalanced across participants. Difficulty levels of the to-be-ignored modality varied orthogonally to the difficulty of the target modality across the stimulation blocks. Each block started with written instructions, indicating the level of difficulty and target modality in the upcoming block. Before the main experimental blocks, participants performed the tasks separately to familiarize them with the tasks and procedures.
Similarly, in the dual-task session, participants were presented with 70 trials for each of the four difficulty combinations (Fig. 1B, right), distributed across eight blocks. Participants performed two blocks per difficulty combination, which remained fixed throughout each block of 35 trials. Block order ensured that all four difficulty combinations were presented once before the presentation of the second block per difficulty combination. Condition order was counterbalanced across participants. Each block started with instructions written on the screen, stating the difficulty combination of the trials in the upcoming block.
Pupil data recording and preprocessing.
Eye movements and pupil size of the right eye were continuously recorded using an Eyelink 1000 Plus Eye Tracker (SR Research) at a sampling rate of 500 Hz.
Data were preprocessed and analyzed using MATLAB (MathWorks). Time points at which the pupil size was more than three SDs above or below the mean pupil size calculated over the whole block were categorized as blinks and marked as invalid (“missing”) data in the time window spanning 100 ms before and 100 ms after an identified blink. Subsequently, missing data in the pupil size time series were linearly interpolated. To control for the potential influence of eye movement-related changes, the x-coordinates and y-coordinates were regressed out of the pupil data (multiple linear regression; Fink et al., 2021), and the resultant residual pupil size time course was used for all further analyses. Data were then low-pass filtered at 4 Hz (Butterworth, fourth-order filter) and segmented into trials ranging from –2 to 8 s relative to noise onset. Trials were excluded if >40% of data points within a trial had to be interpolated. The full dataset of a participant was excluded from analysis if >50% of trials were excluded in any of the conditions (N = 1).
Pupil size data were downsampled to 50 Hz. For each trial, the mean pupil size was calculated in the −2 to −1.1 s time window before noise onset and was subtracted from the data at each time point (baseline correction). This baseline time window was chosen to avoid contamination by visual stimulation (presented from −1 s onward). The −1.1 s time point was chosen to avoid potential smearing back of visual onset responses into the baseline period. Pupil size was averaged across trials, separately for each condition. We averaged data both within the main time window of interest used in the EEG analysis (3–4 s) as well as within a later time window from 5 to 6 s. The later time window for the pupil size analysis was chosen to account for the sluggishness of changes in pupil size (Knapen et al., 2016; Winn et al., 2018; Montefusco-Siegmund et al., 2022).
EEG recording and preprocessing.
We recorded participants' electroencephalogram (EEG) from 64 electrodes (ActiChamp, Brain Products) at a sampling rate of 1000 Hz, referenced to electrode TP9 (280 Hz online low-pass filter). EEG data were analyzed with the FieldTrip toolbox (version 2019–09-20; Oostenveld et al., 2011) in MATLAB (MathWorks). Data were rereferenced to the average across electrodes, high-pass filtered at 0.7 Hz (Hann window, 2391 points), and low-pass filtered at 100 Hz (Hann window, 89 points). Data were filtered with a 50 Hz elliptic band-stop filter to suppress line noise.
Independent components analysis (ICA) was calculated to remove artifacts because of blinks, lateral eye movements, and muscle activity. To this end, data were divided into 1 s segments, and segments with nonstereotypical artifacts were removed on the basis of visual inspection before ICA calculation. Noisy channels were removed before ICA (six participants, one channel each). Artifact components were identified through visual inspection. The filtered, continuous data were projected to ICA space using the unmixing matrix (i.e., that was calculated using the 1 s segments for ICA). The components previously identified to contain artifacts were removed, and the mixing matrix was used to project the data back to the original 64 EEG channels. For the single-task data, we removed a mean of 16.3 ± 5.7 SD components; for the dual-task data, we removed a mean of 15.5 ± 6.7 SD components. Noisy channels removed before ICA were interpolated following ICA as the average across neighboring channels. Afterward, data were low-pass filtered at 30 Hz (Hann window, 111 points) and divided into trials of 12 s (−3 to 9 s time locked to the simultaneous onset of sound and dot movement). Finally, data were downsampled to 500 Hz. and trials that exceeded a signal change of >200 µV across the entire epoch were excluded from analyses. Pooled across all participants, 0.8% of trials during the single task and 0.7% of trials during the dual task were excluded.
Analysis of time–frequency power.
To analyze oscillatory activity, single-trial time domain EEG signals were convolved with Morlet wavelets. Complex wavelet coefficients were calculated for frequencies ranging from 1 to 20 Hz in steps of 0.5 Hz and time from –2 to 8 s time locked to noise onset, separately for each trial, electrode, and participant. Power was calculated by squaring the magnitude of the complex wavelet coefficients, separately for each trial, electrode, and time–frequency bin. Time–frequency power representations were then averaged across trials, separately for each condition. Power was baseline corrected to the decibel power change: trial-averaged data at each time point were divided by the mean power in the baseline time window (–2 to –1.1 s), and subsequently log10 transformed. The baseline time window was chosen, similar to the pupil size baseline time window, to avoid influences of visual stimuli on baseline data.
Since we were primarily interested in changes in α power, we calculated α power time courses by averaging across frequencies ranging from 8 to 12 Hz (Klimesch et al., 2007; Jensen and Mazaheri, 2010; Weisz et al., 2011). To avoid analyses to be related to gap-related changes in parietal α power, we focused the analysis on the time window before the gap. We thus averaged power across parietal electrodes (CPz, CP1, CP2, CP3, CP4, Pz, P1, P2, P3, P4, POz, PO3, PO4; see Fig. 4) and across the 3–4 s time window, which is the pregap window (Fig. 1A).
Figure 4.

Sensor-level modulation of α power in the single and dual tasks. A, Single task. Top row, α power time courses. Gray areas reflect the time window of interest for statistical analysis. Right, Topographies for the time window of interest. Time courses, averages, and 45° plots are shown for the channels highlighted in the topographies. Bottom row, Averaged data across participants for the time window of interest. The difficulty effect was present only for the visual task, but not for the auditory task. Inset, Difficulty effect of the visual task shown in a 45° plot. Black dots show the averaged α power per difficulty level for visual task, separately for each participant. The 45° line indicates no difference between conditions. B, Dual task. The order is the same as in A. Increasing the visual demand led to greater α power suppression. This suppression was reduced when the auditory demands were high. Inset, Black dots show the averaged α power for each participant in this hard visual condition, showing the driving effect for the interaction. Error bands reflect the within-subject error. Error bars indicate the SEM.
Source localization.
To localize the underlying sources related to α power, the FieldTrip MRI template was used as the source model (Holmes et al., 1998) along with a three-layer boundary element model (Oostenveld et al., 2003) as volume conductor. This head model was used to estimate individual leadfields (Nolte, 2003). A cross-spectral density matrix was calculated based on a fast Fourier transform using all trials per participants centered on 10 Hz (spectral smoothing, ±2Hz; multitaper) for the −2 to 8 s time window. The cross-spectral density matrix was used to calculate spatial filters for each source location using dynamic imaging of coherent sources (DICS; Gross et al., 2001).
The spatial-filter coefficients resulting from the DICS calculation were multiplied with the single-trial wavelet coefficients that were calculated in the sensor-level time–frequency analysis. Similar to the sensor-level analysis, a source-localized single-trial time–frequency power was calculated by squaring the magnitude of the complex wavelet coefficients. Time–frequency power representations were averaged across trials, separately for each condition. The decibel power change was calculated relative to the baseline time window of −2 to −1.1 s.
Finally, we separately averaged individual source-projected power within three predefined regions of interest (ROIs; auditory, visual, and parietal regions; see Fig. 5) using functional parcels defined by the Human Connectome Project parcellation template (Glasser et al., 2016; Keitel and Gross, 2016). The two sensory regions (auditory and visual cortex) were included because the stimulation was audiovisual, which is known to elicit sensory α activity (Bauer et al., 2012; Mazaheri et al., 2014; Wöstmann et al., 2017; Herrmann et al., 2023). We also included the parietal region, because parietal cortex is part of the attentional networks and is known to elicit α activity (Rushworth et al., 2001; Behrmann et al., 2004; Banerjee et al., 2011; Herrmann et al., 2023). Similar to the analysis in sensor space, power was averaged in the time window of interest (3–4 s time locked to noise onset).
Figure 5.

Source-localized demand-driven modulation of α power. A, Single-task data for the auditory, parietal, and visual ROIs. Data are averaged in the pregap time window (3–4 s). Areas on the brain surfaces show the ROIs. The same ROIs were used for the single-task and the dual-task analyses. B, Dual-task data. C, Mean difference between the hard and easy conditions for the auditory and the visual single task (Modality × Difficulty interaction). The α power was larger for the hard compared with the easy condition during the auditory task, whereas the reverse effect was present for the visual task. D, Condition differences to visualize significant interactions for dual-task data. Left, The difference between the hard and easy conditions in the auditory task was larger when the visual task was difficult compared with easy. Middle, The auditory difficulty effect (i.e., hard minus easy) was greatest in parietal cortex. Right, α-Power suppression for the hard compared with the easy visual task was greatest in visual cortex. Reported p-values are significant after FDR correction unless indicated with “n.s. FDR” in the figure.
Statistical analysis.
For the analysis of behavioral performance in the single task, we tested whether performance accuracy and speed differed between the easy and the hard task difficulty using paired samples t tests, separately for each sensory modality. For the analysis of behavioral data in the dual-task, we used a repeated-measures ANOVA (rmANOVA) with the factors Auditory Difficulty (easy, hard) and Visual Difficulty (easy, hard), separately for the auditory and visual performance measures (accuracy and speed). Note that auditory and visual performance measures were treated separately for the behavioral analysis, because the scales and chance levels were different between the two tasks. The chance levels between the two tasks were not the same since only the visual but not the auditory task was a three-alternative forced-choice task. Furthermore, for the auditory task, participants responded immediately on gap detection, whereas, for the visual task, the response was delayed until the presentation of the response screen (which also involved scanning the three response options). These differences resulted in faster responses in the auditory task compared with the visual task.
For the analysis of pupil size in the single task, an rmANOVA with the factors Modality (auditory, visual) and Difficulty (easy, hard) was calculated. For the analysis of pupil size in the dual task, we calculated an rmANOVA with the two factors Auditory Difficulty (easy, hard) and Visual Difficulty (easy, hard). Analyses were conducted separately for the 3–4 s and the 5–6 s time window.
The details of the statistical analysis of α power data mirrored those for the analysis of pupil size. For the analysis of the single task, an rmANOVA with the factors Modality (auditory, visual) and Difficulty (easy, hard) was calculated. For the analysis of α power in the dual task, we calculated an rmANOVA with the two factors Auditory Difficulty (easy, hard) and Visual Difficulty (easy, hard). For the analysis of α power in source space, the additional within-participants factor ROI (auditory, parietal, visual) was added to the rmANOVA.
To investigate whether difficulty-independent trial-by-trial variation in pupil size and α power are related, we used linear mixed-effect modeling (LMM) in R software (version 4.1.2; with the packages lme4 and sjPlot). We regressed single-trial source-localized α power onto single-trial pupil size estimates, both averaged across the same 3–4 s time window. We only used trials from the dual-task data and only from the two conditions for which both the auditory and visual tasks were easy and trials for which both the auditory and visual tasks were hard.
We included task difficulty as a deviation-coded predictor to analyze how single-trial states of α power and pupil size were related independent of their changes with varying cognitive demand. As an alternative approach to baselining, we included α power averaged across the baseline time window (–2 to –1.1 s) as an additional predictor and used non-baseline-corrected α power as a dependent measure (Alday, 2019). To disentangle covariation of α power and pupil size at the trial-by-trial state level (e.g., within-participant factor) from covariation at trait level (i.e., between-participants factor), we included two separate regressors reflecting changes in pupil size: the between-participants regressor contained the trial-averaged pupil size per individual, whereas the within-participant regressor contained the single-trial pupil size relative to each individual mean (Bell et al., 2019; Tune et al., 2021). All α power data were log transformed, and all continuous predictors (pupil size, baseline α power) were z-scored. To account for individual differences in overall α power as well as in the single-trial relationship of pupil size and α power, we modeled participant-specific random intercepts and random slopes for the effect of pupil size. We calculated separate models per ROI using the following formula:
We also investigated the relationship between task difficulty-related changes in pupil size and α power. For this analysis, we focused on dual-task data and calculated the difference in both pupil size and source-localized α power (both from 3 to 4 s time locked to stimulus onset) between the auditory and visual easy condition and the auditory and visual hard condition. To test for a systematic relationship of demand-driven change in our two measures of interest, we calculated the Pearson correlation between individual differences (hard–easy) in α power and pupil size across participants.
Effect sizes for t tests are reported as Cohen's d values (Cohen, 1988). Effect sizes for ANOVAs are reported as generalized η2 (ηg2; Bakeman, 2005). For null results, Bayes factors are reported. All statistical analyses were calculated in MATLAB (MathWorks). For multiple comparisons (three-way ANOVA of source-localized α power, LMM, pupil–α correlations), we used false discovery rate (FDR) correction including all terms at a discovery rate of q = 5% (Benjamini and Hochberg, 1995).
Data availability.
Data and analysis scripts are available at https://osf.io/ha58r/.
Results
Behavioral performance declines with increasing task demand
As expected, in the single task (Fig. 2), accuracy was lower for the hard compared with the easy difficulty level (auditory: t(23) = −8.60, p = 1.21 × 10⁻⁸, d = −1.76; visual: t(23) = −13.5, p = 2.04 × 10⁻¹², d = −2.76). Response speed was also slower for the hard compared with the easy difficulty level (auditory: t(23) = −8.32, p = 2.19 × 10⁻⁸, d = −1.70; visual: t(23) = −10.97, p = 1.24 × 10⁻¹⁰, d = −2.24).
Figure 2.
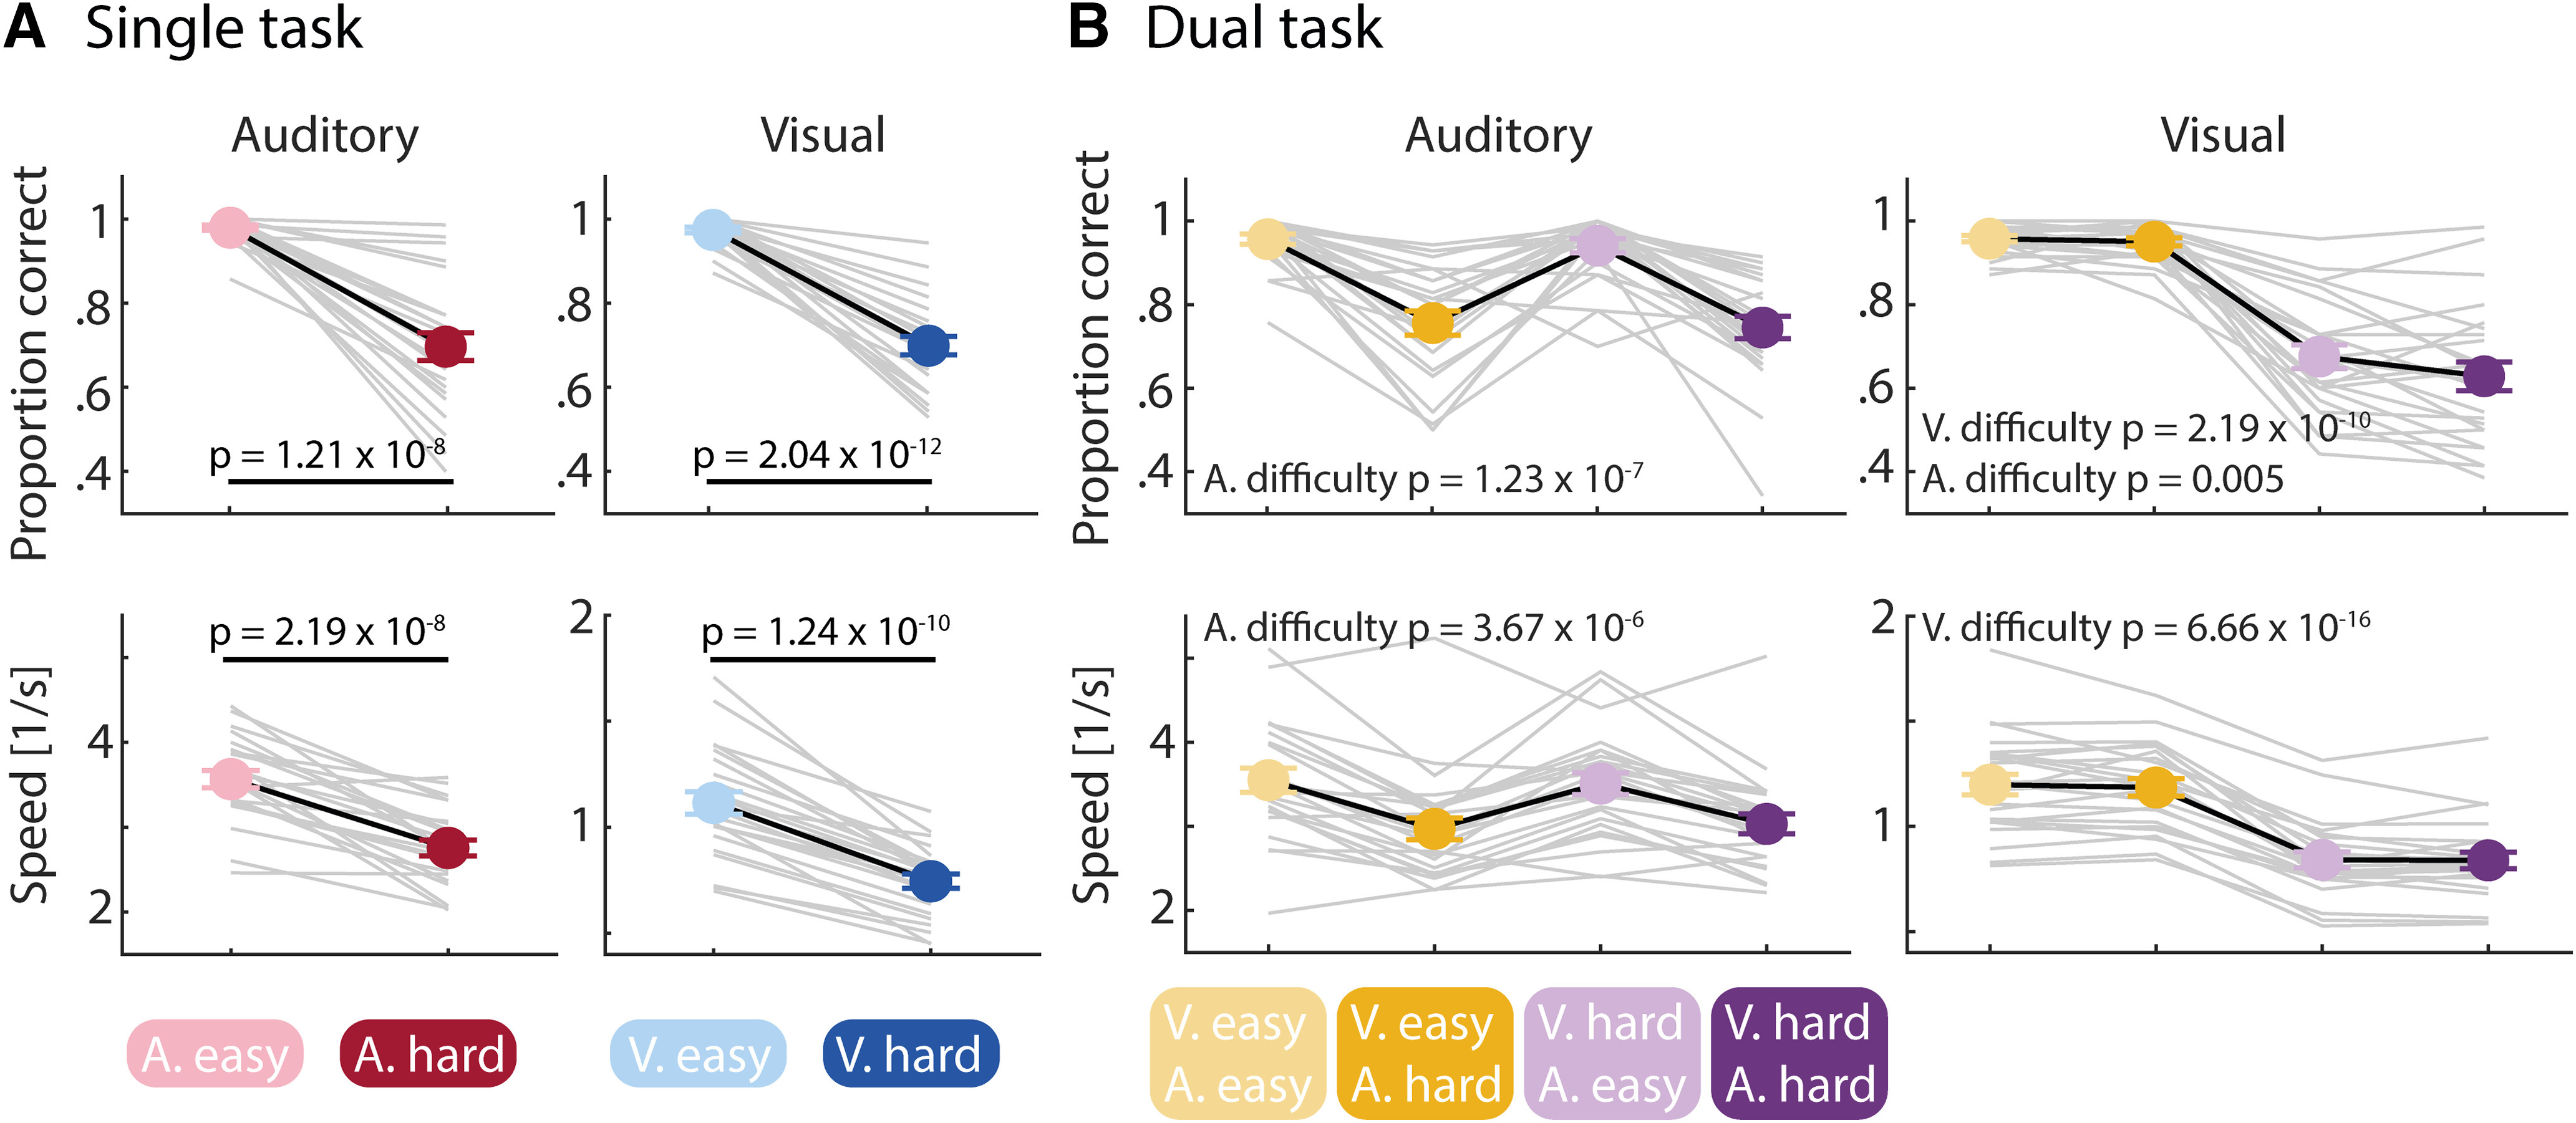
Effects of task difficulty on performance in the single and the dual task. A, Single task. Results for the auditory gap detection task (left) and visual MOT task (right). Accuracy as a proportion of correct responses (top) and speed as an inverse response time (bottom). For both modalities, performance was lower for the hard condition compared with the easy condition. p-Values are obtained from paired-samples t tests. B, Dual task. Order is the same as in A. For both modalities, performance was lower for the hard condition than for the easy condition. For accuracy in the visual task, a significant main effect of auditory difficulty was observed as well. Only significant effects of the rmANOVAs are presented. Error bars reflect the SEM. Gray lines show data from individual participants.
The analysis of performance in the dual task was conducted separately for the auditory and visual task. For the auditory task performance, we observed lower accuracy and speed when the auditory task was hard compared with easy (main effect of Auditory Difficulty; accuracy: F(1,23) = 56.48, p = 1.23 × 10⁻⁷, ηg2 = 0.46; speed: F(1,23) = 36.51, p = 3.67 × 10⁻⁶, ηg2 = 0.15), whereas performance was not significantly affected by the concurrent visual-task difficulty (main effect of Visual Difficulty: for both accuracy and speed, p > 0.3; Auditory Difficulty × Visual Difficulty interaction: for both accuracy and speed, p > 0.1).
For the visual-task performance, we observed lower accuracy and speed when the visual task was hard compared with easy (main effect of Visual Difficulty; accuracy: F(1,23) = 113.99, p = 2.19 × 10⁻¹⁰, ηg2 = 0.65; speed: F(1,23) = 387.78, p = 6.66 × 10⁻¹⁶, ηg2 = 0.43). However, visual-task accuracy was also affected by the difficulty in the auditory task (main effect of Auditory Difficulty: F(1,23) = 9.8, p = 0.005, ηg2 = 0.02): accuracy in the visual task was lower when the concurrent auditory task was hard compared with easy (no main effect of Auditory Difficulty for speed, p > 0.5). The data perhaps suggest that participants prioritized the auditory task over the visual task (i.e., visual performance dropped when the auditory task was hard, whereas auditory performance was unaffected by visual-task difficulty). The Auditory Difficulty × Visual Difficulty interaction for visual performance was not significant (for both accuracy and speed, p > 0.1).
Pupil size reflects demand manipulation independent of sensory modality
Single task
Pupil size time courses for each task and difficulty condition are shown in Figure 3A. Descriptively, difficulty-induced changes in pupil size followed modality-dependent trajectories: when participants performed the visual MOT task, pupil size increased relatively early during the trial for hard compared with easy trials, whereas in the auditory gap detection task, pupil size increased later for the hard relative to the easy condition. This is consistent with the nature of the different tasks. The visual MOT task requires attention throughout (Tombu and Seiffert, 2008; Scholl, 2009), whereas the auditory gap detection task requires participants to focus to a specific point in time (Herrmann et al., 2023).
Figure 3.

Results for pupil size in the single and dual tasks. A, Single task. Top, Pupil size time courses. Gray areas reflect the time windows of interest for statistical analysis, vertical gray lines indicate the time window during which a gap could occur. Bottom, Averaged pupil size for time windows of interest. Left, Time window of 3–4 s. Pupil size increased with task difficulty independent of modality. Right, Time window of 5–6 s. In addition to the difficulty effect, pupil size was larger for the auditory compared with the visual task. Inset, 45° plot for the main effect difficulty. Black dots show individual averaged pupil size for each difficulty level averaged across modalities. B, Dual task. Order is the same as in A. Pupil size was larger when the visual task was hard compared with easy. The interaction indicates that the auditory difficulty effect was greater when the visual task was easy. Inset, Black dots show individual data points for the visual easy condition, showing the driving effect of the interaction. Error bands reflect the within-subject error. Error bars indicate SEM. Crosshairs indicate the 95% CI.
Despite different temporal evolutions of pupil size for the auditory and the visual task, pupil size increased with task difficulty for both tasks. More formally, in the 3–4 s time window, pupil size was larger for the hard compared with the easy condition (main effect Difficulty: F(1,22) = 9.99, p = 0.005, ηg2 = 0.03), but there was no difference in pupil size between modalities (p > 0.07) and no interaction (p > 0.3). In the 5–6 s time window, pupil size was also larger for the hard relative to the easy condition (main effect of Difficulty: F(1,22) = 13.93, p = 0.001, ηg2 = 0.04) and for the auditory compared with the visual task (main effect of Modality: F(1,22) = 36.66, p = 4.29 × 10⁻⁶, ηg2 = 0.21). We did not find evidence for any interactive effects of task difficulty and modality (p > 0.7).
Dual task
Pupil size time courses in the dual task are shown in Figure 3B. Time courses in the dual task visually appear to resemble the combination of the time courses in the auditory and visual single tasks.
In the 3–4 s time window, we observed a larger pupil size for the visual hard condition compared with the visual easy condition (main effect of Visual Difficulty: F(1,22) = 16.59, p = 0.001, ηg2 = 0.08), whereas there was no effect of Auditory Difficulty (p > 0.07). The Auditory Difficulty × Visual Difficulty interaction was marginally significant (F(1,22) = 4.12, p = 0.055, ηg2 = 0.008), showing that the increase in pupil size with auditory-task difficulty was greater when the visual task was easy compared with hard.
Changes in pupil size in the 5–6 s time window were similar to those in the 3–4 s time window: pupil size was larger for the hard than the easy conditions, for both the visual and auditory tasks (main effect of Visual Difficulty: F(1,22) = 10.97, p = 0.003, ηg2 = 0.03; main effect of Auditory Difficulty: F(1,22) = 7.86, p = 0.01, ηg2 = 0.01). The Auditory Difficulty × Visual Difficulty interaction was significant (F(1,22) = 5.10, p = 0.034, ηg2 = 0.006), indicating again that the increase in pupil size with auditory-task difficulty was greater when the visual task was easy compared with hard. Pupil size only differed between the auditory easy and hard conditions when the visual task was easy (t(22) = 4.28, p = 3.03 × 10⁻⁴, d = −0.89), but not when the visual task was hard (p > 0.4).
Task difficulty affects α power differently for the auditory and visual modality
Single task
As shown in Figure 4A, parietal α power at the sensor level was lower when participants performed the visual task compared with the auditory task (main effect of Modality: F(1,23) = 22.35, p = 9.19 × 10⁻⁵, ηg2 = 0.28), and when task difficulty was hard compared with easy (main effect of Difficulty: F(1,23) = 11.94, p = 0.002, ηg2 = 0.03). Critically, the decrease in parietal α power with task difficulty was more pronounced for the visual compared with the auditory task (Modality × Difficulty interaction: F(1,23) = 11.89, p = 0.002, ηg2 = 0.03). Parietal α power was more suppressed for the hard compared with the easy conditions for the visual task (t(23) = −4.76, p = 8.53 × 10⁻⁵, d = −0.97), whereas there was no task-difficulty effect for the auditory task (p > 0.7).
Dual task
Time courses for sensor-level α power in the dual task are shown in Figure 4B. The α power was lower for the hard compared with the easy condition in the visual task (main effect of Visual Difficulty: F(1,23) = 15.81, p = 0.001, ηg2 = 0.05) but lower for the easy compared with the hard condition in the auditory task (main effect of Auditory Difficulty: F(1,23) = 7.18, p = 0.013, ηg2 = 0.008). Critically, the Auditory Difficulty × Visual Difficulty interaction (F(1,23) = 8.82, p = 0.007, ηg2 = 0.006) shows that, when the visual task was hard and led to an overall suppression of parietal α power, this suppression was reduced when the concurrent auditory task was hard relative to when it was easy (t(23) = 3.87, p = 7.75 × 10⁻⁴, d = 0.79; no auditory-difficulty effect when the visual task was easy, p > 0.7). Hence, the data demonstrate that, in a competing audiovisual situation, rising demands in the visual modality decrease parietal α power (i.e., greater power suppression), whereas additional rising demands in the auditory modality reduce the suppression of parietal α power.
Differential effects of auditory and visual demand in cortical regions
We were interested in characterizing the region specificity of the α oscillatory dynamics. To this end, we projected α power data to source space to differentiate between α oscillatory activity in auditory, parietal, and visual cortices (Fig. 5; for details, see Materials and Methods).
Single task
For the source-localized single-task data, we used a three-way rmANOVA with a Modality × Difficulty × ROI design to analyze potential differences of the modality and difficulty effects among the three ROIs. Source-localized α power was overall more suppressed during the visual compared with the auditory task (main effect of Modality: F(1,23) = 13.45, p = 0.001, ηg2 = 0.15). Critically, the Modality × Difficulty interaction was significant (F(1,23) = 6.51, p = 0.018, ηg2 = 0.009), showing that α power was larger for the hard compared with the easy auditory task, whereas α power was smaller (i.e., more suppressed) for the hard compared with the easy visual task (Fig. 5C). This is in line with the sensor-level analysis showing α suppression with increasing demand only for the visual task.
There was also a main effect of ROI (F(2,46) = 6.06, p = 0.005, ηg2 = 0.03), showing that the suppression of α power in auditory cortex was lower compared with the suppression in visual cortex (t(23) = 2.5, p = 0.02, d = 0.51) and parietal cortex (t(23) = 5.6, p = 9.74 × 10⁻⁶, d = 1.15). No other two-way or three-way interaction was significant.
Dual task
For the source-localized dual-task data, we used a three-way rmANOVA with Auditory Difficulty × Visual Difficulty × ROI to analyze potential differences of the auditory and visual difficulty effects among the three ROIs. The analysis of source-localized α power in the dual task revealed that two of the three two-way interactions were statistically significant at α = 0.05 after FDR correction, whereas the three-way interaction was not significant (p > 0.89). Specifically, the Auditory Difficulty × Visual Difficulty interaction (F(1,23) = 6.63, p = 0.017, ηg2 = 0.007) demonstrates that the power increase for the hard relative to the easy condition associated with the auditory task was more pronounced when the concurrent visual task was hard compared with easy (Fig. 5D, left). This replicates the results from the sensor-level analysis. We also observed an ROI × Auditory Difficulty interaction (F(2,46) = 3.27, p = 0.047, ηg2 = 0.001), although it was not significant after FDR correction. Nevertheless, an explorative analysis of the interaction suggests that the difficulty effect (i.e., hard minus easy) associated with the auditory task was greatest in parietal cortex (Fig. 5D, middle), and that it was larger than the auditory difficulty effect in visual cortex (t(23) = 2.21, p = 0.04, d = 0.45). Finally, α power suppression for the hard compared with the easy condition in the visual task was greatest in visual cortex (ROI × Visual Difficulty interaction: F(2,46) = 4.76, p = 0.013, ηg2 = 0.005; Fig. 5D, right) and was significantly smaller than in parietal cortex (t(23) = −2.46, p = 0.02, d = −0.50).
Overall, the results of the source-localized α power in the dual task suggest that the stronger α power suppression associated with visual-task difficulty originates primarily from visual cortex. There was weak evidence (non-FDR corrected) suggesting a relative diminishment of α power suppression associated with auditory-task difficulty in parietal cortex (Fig. 5D).
Demand-driven changes in pupil size and α power appear to be independent
In the previous sections, we have reported the effects of task difficulty and sensory modality separately for pupil size and α power, showing that pupil size and α power are differently modulated by task demands. One key question in the field is whether these two neurophysiological measures of cognitive demand (or effort) are driven by a common underlying mechanism (Miles et al., 2017; Alhanbali et al., 2019; Ala et al., 2020). To address this question, we first evaluated the relationship between pupil size and α power by statistically controlling for possible task-induced influences. Second, we tested for a systematic relationship of demand-driven change in the two measures. If the same mechanisms were to underlie changes in pupil size and α power, we would expect difficulty-related changes in the two measures to correlate across participants.
To investigate the underlying physiological relationship between pupil size and α power independent of task difficulty, we calculated single-trial LMMs per ROI, controlling for task difficulty (Fig. 6A). For all three regions, we found a negative within-participant relationship of pupil size and α power (β values approximately −0.3; p values < 0.0008; significant after FDR correction), whereas there was no significant between-participant relationship between pupil size and α power (p values > 0.5). In other words, trial-level states of enlarged pupil were associated with states of decreased α power. Note that for the single task, we found the same negative pupil–α power relationship (visual: β approximately −0.2, p values < 0.0004; auditory: −0.1 < β values < −0.13, 0.01 < p values < 0.09).
Figure 6.

Relationship between pupil size and source α power for dual-task data. A, Linear mixed-model analysis using auditory and visual easy condition, and auditory and visual hard conditions, and controlling for task difficulty effects. A negative relationship between pupil size and α power is only present at the within-participant level but not at the between-participants level. Pupil size and source-localized α power are averaged over 3–4 s. All significant effects survive FDR correction. B, Correlation of intraindividual demand-driven changes in pupil size and α power. Data points reflect the individual difference between the dual-task auditory and visual hard and auditory and visual easy conditions, for pupil size and source-localized α power. Pupil size and α power data are averaged over 3–4 s. The black line reflects the best fitting line (correlation). Left, Auditory ROI. Middle, Parietal ROI. Right, Visual ROI. All three correlations are nonsignificant after FDR correction.
To investigate how task difficulty-induced changes in pupil size and α power are related, we calculated individual difficulty effects (auditory–visual hard vs auditory–visual easy conditions in the dual-task data) separately for pupil size and α power (using data from the 3–4 s time window). This allowed us to calculate a Pearson correlation between demand-driven changes in pupil size and α power. The correlation was calculated separately for each of the three ROIs (Fig. 6B). There was no significant correlation between pupil size and α power differences in any of the three brain regions (p > 0.05). Visual cortex exhibits an indecisive r = –0.41 correlation (BF10 ∼1.5). In the auditory and parietal cortices, however, Bayes factors (BF10 ∼0.33) provide tentative evidence for the absence of a true correlation. We also calculated these correlations for single-task data. Correlations were nonsignificant for both the auditory and the visual task as well as for all brain regions (p values > 0.2).
In sum, although single-trial variations in pupil size were negatively related to variations in α power, task difficulty-related changes in pupil size and α power did not correlate across individuals. The latter may not be surprising given the different sensitivity of pupil and α power to our experimental task manipulations reported in previous sections.
Discussion
In the current study, we investigated how two key and often used neurophysiological measures, pupil size and neural α oscillatory power, change with increasing cognitive demand under complex audiovisual dual-task conditions. We observed that higher cognitive demand affected pupil size and α power differently. Pupil size increased with increasing demands for both the auditory and the visual task, and its temporal dynamics indicated the specific temporal evolution of the required cognitive task demands in each modality. In contrast, α power responded differently to increasing cognitive demand for the following two tasks: parietal α power decreased with visual cognitive demand, but not with auditory cognitive demand. Last, when statistically controlling for task difficulty, we observed a negative state-level relationship of pupil size and α power. However, task-induced changes in pupil size and α power did not correlate. In sum, our data suggest that pupil size and α power differentially index cognitive demand under complex audiovisual conditions.
Behavioral performance suggests prioritization of the auditory over the visual task
Behavioral performance decreased with increasing cognitive demand in the auditory and the visual task, as well as under single-task and dual-task conditions. In previous uses of dual tasks, participants were instructed to prioritize one task over the other (Picou and Ricketts, 2014; Wu et al., 2016; Gagné et al., 2017). We avoided such prioritization instruction to investigate how different degrees of cognitive demand in either task affect performance. Still, as indicated by the performance decline in the visual task with increasing difficulty in the auditory task, participants appear to have prioritized the auditory task over the visual task (Fig. 1B). This pattern suggests that the available cognitive resources were insufficient to perform both tasks well concurrently. This is broadly in line with the dual-task literature showing declining performance in a secondary task with increasing demand in a primary task (Gosselin and Gagné, 2011; Desjardins and Doherty, 2013; Picou and Ricketts, 2014; Gagné et al., 2017).
Participants may have prioritized the auditory over the visual task because the timing of when cognitive investment was required differed between the auditory task and the visual task. For the auditory task, participants were required to detect a single event in time with some degree of temporal predictability (Herrmann et al., 2023), whereas the visual MOT task required participants to attentively focus throughout a trial (Pylyshyn and Storm, 1988; Cavanagh and Alvarez, 2005; Scholl, 2009; Herrmann and Johnsrude, 2018a; Wutz et al., 2020). Participants may have lost track of the target dots when they fully focused on and responded to the auditory gap detection task.
Pupil size tracks cognitive demand in the auditory and visual tasks
In line with previous work, pupil size increased with higher cognitive demand for both the auditory and the visual task (Fig. 3; Kahneman and Beatty, 1966; Porter et al., 2007; Zekveld et al., 2010; Koelewijn et al., 2012; Zekveld and Kramer, 2014; Wendt et al., 2016; Ohlenforst et al., 2018; Winn et al., 2018; Zhao et al., 2019; Kadem et al., 2020; Martin et al., 2020; Stolte et al., 2020).
Pupil size time courses mirrored the temporal evolution of the cognitive demand manipulation in each task: for the auditory task, they diverged late between task-difficulty conditions and peaked late during a trial, mirroring the temporal occurrence of the gap. For the visual task, they diverged between task-difficulty conditions right from the beginning of a trial and remained different throughout, likely reflecting the need to track the relevant dots from the beginning to the end of a trial (Pylyshyn and Storm, 1988; Cavanagh and Alvarez, 2005; Scholl, 2009; Herrmann and Johnsrude, 2018a, b; Wutz et al., 2020). Our data thus suggest high sensitivity of pupil size changes to when in time and to what degree participants invest cognitively during an auditory or visual task.
Under dual-task conditions, we further observed that auditory difficulty effects were only present when the concurrent visual task was easy. This may suggest that the respective highly demanding task is driving the pupil response. Therefore, the pupil size time courses under dual-task settings were more similar to single-task time courses of the auditory task when the concurrent visual task was easy, but were more similar to the visual single-task time courses when the visual task was hard.
Cognitive demand modulated α power differently under auditory and visual task conditions
Visual α power decreased with heightened demand in the visual task, but not with heightened auditory demand (although there was some indication that parietal α power increased with auditory demand; Fig. 5). These findings shed light on the different cognition-related changes in α power in vision and audition. Increases in α power have been observed for increases in auditory task demands (Obleser et al., 2012; Wöstmann et al., 2015; Wisniewski et al., 2017; Winneke et al., 2020), and this effect may originate from an oscillator in parietal cortex (Herrmann et al., 2023). In contrast, decreases in α power (i.e., α power suppression) have been observed for increases in visual task demands (Erickson et al., 2019; Magosso et al., 2019), and this effect may originate from an oscillator in occipital cortex (Bonnefond and Jensen, 2012).
Although we observed a distinction based on different tasks, others have suggested that demand-dependent changes in α power may differ with the degree of internal (e.g., audition) or external (e.g., vision) processing requirements (Palva and Palva, 2011). Regardless of this functional distinction, our data emphasize the presence of multiple cortical α oscillators (but see Başar et al., 1997; Bollimunta et al., 2008; Mo et al., 2011; Wisniewski et al., 2021; Herrmann et al., 2023) that are modulated differently by cognitive demand, depending on different tasks.
Oscillatory α activity is thought to reflect functional inhibition, such that brain regions in which α power increases are inhibited (Klimesch et al., 2007; Jensen and Mazaheri, 2010; Foxe and Snyder, 2011; Weisz et al., 2011). Our observations that α power decreases with increasing difficulty in the visual task is consistent with this functional inhibition view, potentially reducing inhibition in visual cortices. In contrast, the trending increase in parietal α power with increased auditory demand may be less consistent with functional inhibition, except if we were to assume that parietal cortex is selectively inhibited when individuals invest cognitively in the auditory task. An increase in α power with auditory attention has been observed previously (Obleser et al., 2012; Wöstmann et al., 2015; Wisniewski et al., 2017; Winneke et al., 2020) and aligns more generally with recent suggestions that the functional inhibition hypothesis may not generalize across sensory modalities (Linkenkaer-Hansen et al., 2004; Ai and Ro, 2014; Herrmann et al., 2016).
Pupil size and α power differentially reflect cognitive demands
Trial-by-trial fluctuations (independent of task difficulty) showed that a larger pupil is associated with greater α power suppression. The negative α–pupil size relationship is consistent with work suggesting that noradrenergic LC activity influences both oscillatory α activity and pupil size (Dahl et al., 2022). Specifically, LC activity appears to be associated with low-frequency cortical desynchronization (McCormick, 1989; Marzo et al., 2014; Dahl et al., 2020) and with larger pupil size (Aston-Jones and Cohen, 2005; Joshi et al., 2016; Liu et al., 2017; Joshi and Gold, 2020), suggesting that both physiological measures are part of the same generating network.
Critically, pupil size and α power were both modulated by cognitive demand, although in different ways (Figs. 3, 4). As described above, pupil size increased for both auditory and visual demands, and indicated the temporal evolution of different task demands across the trial duration. In contrast, visual α power decreased with visual cognitive demand, but not with auditory cognitive demand. The α power modulation also did not index the temporal evolution of task demands. The results of the current study thus demonstrate a dissociation in how pupil size and α power relate to cognitive challenges. Pupil size appears to be the more intuitive index for cognitive demand: a larger pupil size indexes higher cognitive demand with temporal precision (Kahneman and Beatty, 1966; Pichora-Fuller et al., 2016).
Perhaps not surprisingly, given the different sensitivity to cognitive demand of the two measures, demand-related changes in pupil size did not correlate with demand-related changes in α power (Fig. 6B). The absence of a correlation is consistent with previous work also showing no relation (Miles et al., 2017; Alhanbali et al., 2019; Ala et al., 2020). Although we find reasonable evidence for a true absence of a correlation based on Bayes factors, our study was set up as a within-participant design, and, as a result, the number of participants we recruited are likely insufficient for explicit investigations of interindividual differences (but see Yarkoni, 2009; Grady et al., 2021). Nevertheless, the distinct patterns of pupil size and α power results induced by our experimental manipulations make finding a correlation unlikely.
As a note of caution, the temporal structure and type of task differed between the auditory and the visual stimulation, as described above. Whereas this enabled us to observe task-dependent temporal evolutions of pupil responses (interestingly absent for α power), it does raise the question of whether the differential impact of task difficulty induced by visual versus auditory stimulation on α power is related to the task structure or rather to the sensory modality. The fact that the temporal evolution of the two tasks was only represented in pupil size, but not α power, makes it unlikely that task structure is the main driver. Nevertheless, switching the task structures between the two modalities or designing auditory and visual tasks with similar temporal structure may be fruitful avenues to further investigate the impact of task difficulty in different modalities.
Whereas pupil size indexes cognitive demand in an intuitive way, α power changes are more difficult to interpret. The existence of different α oscillators and their spatial mixing in EEG needs to be considered, which may contribute to an absent correlation between pupil size and α power. The α power may perhaps index more clearly the cognitive demands in auditory tasks when stimulation is devoid of visual input (Wöstmann et al., 2015; Henry et al., 2017; Paul et al., 2021; Herrmann et al., 2023), and vice versa in visual tasks (Bonnefond and Jensen, 2012; Roijendijk et al., 2013; Erickson et al., 2019; Magosso et al., 2019). The current data provide a detailed picture of the multifaceted changes in α power under complex audiovisual task conditions that differ from changes in pupil size under the same complex conditions.
Conclusions
Our results show that pupil size and neural α power are not interchangeable as measures of cognitive investment or effort. Specifically, we demonstrate that pupil size tracks an increase in cognitive demand independent of the task that induces the demand. However, changes in the magnitude of neural α power associated with task demand depend on the specific task from which the demand originates. The α power in visual cortex decreases with visual cognitive demand, but not with auditory cognitive demand. Finally, our data add to the mounting evidence that pupil size and α power variations are not solely driven by a unitary, putatively noradrenergically governed pathway. Overall, the current study demonstrates that the dynamics of the neurophysiological indices of cognitive effort are multifaceted under complex audiovisual task conditions.
Footnotes
This work was supported by Deutsche Forschungsgesellschaft (Grant HE 7857/1-1) awarded to B.H. B.H. was supported by the Natural Sciences and Engineering Research Council of Canada (Discovery Grant RGPIN-2021-02602) and the Canada Research Chair program (232733). We thank Larissa Scheller and Hannah Schewe for assisting with the data collection.
The authors declare no competing financial interests.
References
- Ai L, Ro T (2014) The phase of prestimulus alpha oscillations affects tactile perception. J Neurophysiol 111:1300–1307. 10.1152/jn.00125.2013 [DOI] [PubMed] [Google Scholar]
- Ala TS, Graversen C, Wendt D, Alickovic E, Whitme WM, Lunner T (2020) An exploratory study of EEG alpha oscillation and pupil dilation in hearing-aid users during effortful listening to continuous speech. PLoS One 15:e0235782. 10.1371/journal.pone.0235782 [DOI] [PMC free article] [PubMed] [Google Scholar]
- Alday PM (2019) How much baseline correction do we need in ERP research? Extended GLM model can replace baseline correction while lifting its limits. Psychophysiology 56:e13451. 10.1111/psyp.13451 [DOI] [PubMed] [Google Scholar]
- Alhanbali S, Dawes P, Millman RE, Munro KJ (2019) Measures of listening effort are multidimensional. Ear Hear 40:1084–1097. 10.1097/AUD.0000000000000697 [DOI] [PMC free article] [PubMed] [Google Scholar]
- Aston-Jones G, Cohen JD (2005) An integrative theory of locus coeruleus-norepinephrine function: adaptive gain and optimal performance. Annu Rev Neurosci 28:403–450. 10.1146/annurev.neuro.28.061604.135709 [DOI] [PubMed] [Google Scholar]
- Bakeman R (2005) Recommended effect size statistic. Behav Res Methods 37:379–384. 10.3758/bf03192707 [DOI] [PubMed] [Google Scholar]
- Banerjee S, Snyder AC, Molholm S, Foxe JJ (2011) Oscillatory alpha-band mechanisms and the deployment of spatial attention to anticipated auditory and visual target locations: supramodal or sensory-specific control mechanisms? J Neurosci 31:9923–9932. 10.1523/JNEUROSCI.4660-10.2011 [DOI] [PMC free article] [PubMed] [Google Scholar]
- Başar E, Schürmann M, Başar-Eroglu C, Karakaş S (1997) Alpha oscillations in brain functioning: an integrative theory. Int J Psychophysiol 26:5–29. 10.1016/s0167-8760(97)00753-8 [DOI] [PubMed] [Google Scholar]
- Bauer M, Kennett S, Driver J (2012) Attentional selection of location and modality in vision and touch modulates low-frequency activity in associated sensory cortices. J Neurophysiol 107:2342–2351. 10.1152/jn.00973.2011 [DOI] [PMC free article] [PubMed] [Google Scholar]
- Behrmann M, Geng JJ, Shomstein S (2004) Parietal cortex and attention. Curr Opin Neurobiol 14:212–217. 10.1016/j.conb.2004.03.012 [DOI] [PubMed] [Google Scholar]
- Bell A, Fairbrother M, Jones K (2019) Fixed and random effects models: making an informed choice. Qual Quant 53:1051–1074. 10.1007/s11135-018-0802-x [DOI] [Google Scholar]
- Benjamini Y, Hochberg Y (1995) Controlling the false discovery rate: a practical and powerful approach to multiple testing. J R Stat Soc Series B Stat Methodol 57:289–300. 10.1111/j.2517-6161.1995.tb02031.x [DOI] [Google Scholar]
- Bollimunta A, Chen Y, Schroeder CE, Ding M (2008) Neuronal mechanisms of cortical alpha oscillations in awake-behaving macaques. J Neurosci 28:9976–9988. 10.1523/JNEUROSCI.2699-08.2008 [DOI] [PMC free article] [PubMed] [Google Scholar]
- Bonnefond M, Jensen O (2012) Alpha oscillations serve to protect working memory maintenance against anticipated distracters. Curr Biol 22:1969–1974. 10.1016/j.cub.2012.08.029 [DOI] [PubMed] [Google Scholar]
- Burlingham CS, Mirbagheri S, Heeger DJ (2022) A unified model of the task-evoked pupil response. Sci Adv 8:eabi9979. 10.1126/sciadv.abi9979 [DOI] [PMC free article] [PubMed] [Google Scholar]
- Cavanagh P, Alvarez GA (2005) Tracking multiple targets with multifocal attention. Trends Cogn Sci 9:349–354. 10.1016/j.tics.2005.05.009 [DOI] [PubMed] [Google Scholar]
- Cohen J (1988) Statistical power analysis for the behavioral sciences. Hillsdale, NJ: Erlbaum. [Google Scholar]
- Dahl MJ, Mather M, Sander MC, Werkle-Bergner M (2020) Noradrenergic responsiveness supports selective attention across the adult lifespan. J Neurosci 40:4372–4390. 10.1523/JNEUROSCI.0398-19.2020 [DOI] [PMC free article] [PubMed] [Google Scholar]
- Dahl MJ, Mather M, Werkle-Bergner M (2022) Noradrenergic modulation of rhythmic neural activity shapes selective attention. Trends Cogn Sci 26:38–52. 10.1016/j.tics.2021.10.009 [DOI] [PMC free article] [PubMed] [Google Scholar]
- Desjardins JL, Doherty KA (2013) Age-related changes in listening effort for various types of masker noises. Ear Hear 34:261–272. 10.1097/AUD.0b013e31826d0ba4 [DOI] [PubMed] [Google Scholar]
- Dimitrijevic A, Smith ML, Kadis DS, Moore DR (2017) Cortical alpha oscillations predict speech intelligibility. Front Hum Neurosci 11:88. 10.3389/fnhum.2017.00088 [DOI] [PMC free article] [PubMed] [Google Scholar]
- Erickson MA, Smith D, Albrecht MA, Silverstein S (2019) Alpha-band desynchronization reflects memory-specific processes during visual change detection. Psychophysiology 56:e13442. 10.1111/psyp.13442 [DOI] [PubMed] [Google Scholar]
- Fink L, Simola J, Tavano A, Lange E, Wallot S, Laeng B (2021) From pre-processing to advanced dynamic modeling of pupil data. PsyArXiv. Advance online publication. Retrieved May 9, 2023. 10.31234/osf.io/wqvue. [DOI] [PMC free article] [PubMed] [Google Scholar]
- Foxe JJ, Snyder AC (2011) The role of alpha-band brain oscillations as a sensory suppression mechanism during selective attention. Front Psychol 2:154. 10.3389/fpsyg.2011.00154 [DOI] [PMC free article] [PubMed] [Google Scholar]
- Gagné JP, Besser J, Lemke U (2017) Behavioral assessment of listening effort using a dual-task paradigm: a review. Trends Hear 21:2331216516687287. 10.1177/2331216516687287 [DOI] [PMC free article] [PubMed] [Google Scholar]
- Glasser MF, Coalson TS, Robinson EC, Hacker CD, Harwell J, Yacoub E, Ugurbil K, Andersson J, Beckmann CF, Jenkinson M, Smith SM, Van Essen DC (2016) A multi-modal parcellation of human cerebral cortex. Nature 536:171–178. 10.1038/nature18933 [DOI] [PMC free article] [PubMed] [Google Scholar]
- Gosselin PA, Gagné J-P (2011) Older adults expend more listening effort than young adults recognizing speech in noise. J Speech Lang Hear Res 54:944–958. 10.1044/1092-4388(2010/10-0069) [DOI] [PubMed] [Google Scholar]
- Grady CL, Rieck JR, Nichol D, Rodrigue KM, Kennedy KM (2021) Influence of sample size and analytic approach on stability and interpretation of brain-behavior correlations in task-related fMRI data. Hum Brain Mapp 42:204–219. 10.1002/hbm.25217 [DOI] [PMC free article] [PubMed] [Google Scholar]
- Green DM, Swets JA (1966) Signal detection theory and psychophysics. In: Signal detection theory and psychophysics, Chap 2, pp 30–50. New York: Wiley. [Google Scholar]
- Gross J, Kujala J, Hämäläinen M, Timmermann L, Schnitzler A, Salmelin R (2001) Dynamic imaging of coherent sources: studying neural interactions in the human brain. Proc Natl Acad Sci U S A 98:694–699. 10.1073/pnas.98.2.694 [DOI] [PMC free article] [PubMed] [Google Scholar]
- Henry MJ, Herrmann B, Kunke D, Obleser J (2017) Aging affects the balance of neural entrainment and top-down neural modulation in the listening brain. Nat Commun 8:15801. 10.1038/ncomms15801 [DOI] [PMC free article] [PubMed] [Google Scholar]
- Herrmann B, Johnsrude IS (2018a) Attentional state modulates the effect of an irrelevant stimulus dimension on perception. J Exp Psychol Hum Percept Perform 44:89–105. 10.1037/xhp0000432 [DOI] [PubMed] [Google Scholar]
- Herrmann B, Johnsrude IS (2018b) Neural signatures of the processing of temporal patterns in sound. J Neurosci 38:5466–5477. 10.1523/JNEUROSCI.0346-18.2018 [DOI] [PMC free article] [PubMed] [Google Scholar]
- Herrmann B, Johnsrude IS (2020) A model of listening engagement (MoLE). Hear Res 397:108016. 10.1016/j.heares.2020.108016 [DOI] [PubMed] [Google Scholar]
- Herrmann B, Henry MJ, Haegens S, Obleser J (2016) Temporal expectations and neural amplitude fluctuations in auditory cortex interactively influence perception. Neuroimage 124:487–497. 10.1016/j.neuroimage.2015.09.019 [DOI] [PubMed] [Google Scholar]
- Herrmann B, Maess B, Johnsrude IS (2018) Aging affects adaptation to sound-level statistics in human auditory cortex. J Neurosci 38:1989–1999. 10.1523/JNEUROSCI.1489-17.2018 [DOI] [PMC free article] [PubMed] [Google Scholar]
- Herrmann B, Maess B, Henry MJ, Obleser J, Johnsrude IS (2023) Neural signatures of task-related fluctuations in auditory attention and age-related changes. Neuroimage 268:119883. 10.1016/j.neuroimage.2023.119883 [DOI] [PubMed] [Google Scholar]
- Holmes CJ, Hoge R, Collins L, Woods R, Toga AW, Evans AC (1998) Enhancement of MR images using registration for signal averaging. J Comput Assist Tomogr 22:324–333. 10.1097/00004728-199803000-00032 [DOI] [PubMed] [Google Scholar]
- Jensen O, Mazaheri A (2010) Shaping functional architecture by oscillatory alpha activity: gating by inhibition. Front Hum Neurosci 4:186. 10.3389/fnhum.2010.00186 [DOI] [PMC free article] [PubMed] [Google Scholar]
- Joshi S, Gold JI (2020) Pupil size as a window on neural substrates of cognition. Trends Cogn Sci 24:466–480. 10.1016/j.tics.2020.03.005 [DOI] [PMC free article] [PubMed] [Google Scholar]
- Joshi S, Li Y, Kalwani RM, Gold JI (2016) Relationships between pupil diameter and neuronal activity in the locus coeruleus, colliculi, and cingulate cortex. Neuron 89:221–234. 10.1016/j.neuron.2015.11.028 [DOI] [PMC free article] [PubMed] [Google Scholar]
- Kadem M, Herrmann B, Rodd JM, Johnsrude IS (2020) Pupil dilation is sensitive to semantic ambiguity and acoustic degradation. Trends Hear 24:2331216520964068. 10.1177/2331216520964068 [DOI] [PMC free article] [PubMed] [Google Scholar]
- Kahneman D (1973) Attention and effort. Englewood Cliffs, NJ: Prentice Hall. 10.2307/1421603 [DOI] [Google Scholar]
- Kahneman D, Beatty J (1966) Pupil diameter and load on memory. Science 154:1583–1585. 10.1126/science.154.3756.1583 [DOI] [PubMed] [Google Scholar]
- Keitel A, Gross J (2016) Individual human brain areas can be identified from their characteristic spectral activation fingerprints. PLoS Biol 14:e1002498. 10.1371/journal.pbio.1002498 [DOI] [PMC free article] [PubMed] [Google Scholar]
- Klimesch W, Sauseng P, Hanslmayr S (2007) EEG alpha oscillations: the inhibition-timing hypothesis. Brain Res Rev 53:63–88. 10.1016/j.brainresrev.2006.06.003 [DOI] [PubMed] [Google Scholar]
- Knapen T, De Gee JW, Brascamp J, Nuiten S, Hoppenbrouwers S, Theeuwes J (2016) Cognitive and ocular factors jointly determine pupil responses under equiluminance. PLoS One 11:e0155574. 10.1371/journal.pone.0155574 [DOI] [PMC free article] [PubMed] [Google Scholar]
- Koelewijn T, Zekveld AA, Festen JM, Kramer SE (2012) Pupil dilation uncovers extra listening effort in the presence of a single-talker masker. Ear Hear 33:291–300. 10.1097/AUD.0b013e3182310019 [DOI] [PubMed] [Google Scholar]
- Lavie N (1995) Perceptual load as a necessary condition for selective attention. J Exp Psychol Hum Percept Perform 21:451–468. 10.1037//0096-1523.21.3.451 [DOI] [PubMed] [Google Scholar]
- Linkenkaer-Hansen K, Nikulin VV, Palva S, Ilmoniemi RJ, Palva JM (2004) Prestimulus oscillations enhance psychophysical performance in humans. J Neurosci 24:10186–10190. 10.1523/JNEUROSCI.2584-04.2004 [DOI] [PMC free article] [PubMed] [Google Scholar]
- Liu Y, Rodenkirch C, Moskowitz N, Schriver B, Wang Q (2017) Dynamic lateralization of pupil dilation evoked by locus coeruleus activation results from sympathetic, not parasympathetic, contributions. Cell Rep 20:3099–3112. 10.1016/j.celrep.2017.08.094 [DOI] [PMC free article] [PubMed] [Google Scholar]
- Magosso E, De Crescenzio F, Ricci G, Piastra S, Ursino M (2019) EEG alpha power is modulated by attentional changes during cognitive tasks and virtual reality immersion. Comput Intell Neurosci 2019:7051079. 10.1155/2019/7051079 [DOI] [PMC free article] [PubMed] [Google Scholar]
- Martin JT, Whittaker AH, Johnston SJ (2020) Component processes in free-viewing visual search: insights from fixation-aligned pupillary response averaging. J Vis 20(7):5, 1–24. 10.1167/jov.20.7.5 [DOI] [PMC free article] [PubMed] [Google Scholar]
- Marzo A, Totah NK, Neves RM, Logothetis NK, Eschenko O (2014) Unilateral electrical stimulation of rat locus coeruleus elicits bilateral response of norepinephrine neurons and sustained activation of medial prefrontal cortex. J Neurophysiol 111:2570–2588. 10.1152/jn.00920.2013 [DOI] [PubMed] [Google Scholar]
- Mazaheri A, van Schouwenburg MR, Dimitrijevic A, Denys D, Cools R, Jensen O (2014) Region-specific modulations in oscillatory alpha activity serve to facilitate processing in the visual and auditory modalities. Neuroimage 87:356–362. 10.1016/j.neuroimage.2013.10.052 [DOI] [PubMed] [Google Scholar]
- McCormick DA (1989) Cholinergic and noradrenergic modulation of thalamocortical processing. Trends Neurosci 12:215–221. 10.1016/0166-2236(89)90125-2 [DOI] [PubMed] [Google Scholar]
- Megemont M, McBurney-Lin J, Yang H (2022) Pupil diameter is not an accurate real-time readout of locus coeruleus activity. Elife 11:e70510. 10.7554/eLife.70510 [DOI] [PMC free article] [PubMed] [Google Scholar]
- Miles K, McMahon C, Boisvert I, Ibrahim R, de Lissa P, Graham P, Lyxell B (2017) Objective assessment of listening effort: coregistration of pupillometry and EEG. Trends Hear 21:2331216517706396. 10.1177/2331216517706396 [DOI] [PMC free article] [PubMed] [Google Scholar]
- Mo J, Schroeder CE, Ding M (2011) Attentional modulation of alpha oscillations in macaque inferotemporal cortex. J Neurosci 31:878–882. 10.1523/JNEUROSCI.5295-10.2011 [DOI] [PMC free article] [PubMed] [Google Scholar]
- Montefusco-Siegmund R, Schwalm M, Jubal ER, Devia C, Egaña JI, Maldonado PE (2022) Alpha EEG activity and pupil diameter coupling during inactive wakefulness in humans. eNeuro 9:ENEURO.0060-21.2022. 10.1523/ENEURO.0060-21.2022 [DOI] [PMC free article] [PubMed] [Google Scholar]
- Murphy PR, O'Connell RG, O'Sullivan M, Robertson IH, Balsters JH (2014) Pupil diameter covaries with BOLD activity in human locus coeruleus. Hum Brain Mapp 35:4140–4154. 10.1002/hbm.22466 [DOI] [PMC free article] [PubMed] [Google Scholar]
- Nolte G (2003) The magnetic lead field theorem in the quasi-static approximation and its use for magnetoencephalography forward calculation in realistic volume conductors. Phys Med Biol 48:3637–3652. 10.1088/0031-9155/48/22/002 [DOI] [PubMed] [Google Scholar]
- Obleser J, Wöstmann M, Hellbernd N, Wilsch A, Maess B (2012) Adverse listening conditions and memory load drive a common α oscillatory network. J Neurosci 32:12376–12383. 10.1523/JNEUROSCI.4908-11.2012 [DOI] [PMC free article] [PubMed] [Google Scholar]
- Ohlenforst B, Wendt D, Kramer SE, Naylor G, Zekveld AA, Lunner T (2018) Impact of SNR, masker type and noise reduction processing on sentence recognition performance and listening effort as indicated by the pupil dilation response. Hear Res 365:90–99. 10.1016/j.heares.2018.05.003 [DOI] [PubMed] [Google Scholar]
- Oostenveld R, Stegeman DF, Praamstra P, Van Oosterom A (2003) Brain symmetry and topographic analysis of lateralized event-related potentials. Clin Neurophysiol 114:1194–1202. 10.1016/s1388-2457(03)00059-2 [DOI] [PubMed] [Google Scholar]
- Oostenveld R, Fries P, Maris E, Schoffelen JM (2011) FieldTrip: open source software for advanced analysis of MEG, EEG, and invasive electrophysiological data. Comput Intell Neurosci 2011:156869. 10.1155/2011/156869 [DOI] [PMC free article] [PubMed] [Google Scholar]
- Palva S, Palva JM (2011) Functional roles of alpha-band phase synchronization in local and large-scale cortical networks. Front Psychol 2:204. 10.3389/fpsyg.2011.00204 [DOI] [PMC free article] [PubMed] [Google Scholar]
- Paul BT, Chen J, Le T, Lin V, Dimitrijevic A (2021) Cortical alpha oscillations in cochlear implant users reflect subjective listening effort during speech-in-noise perception. PLoS One 16:e0254162. 10.1371/journal.pone.0254162 [DOI] [PMC free article] [PubMed] [Google Scholar]
- Petersen EB, Wöstmann M, Obleser J, Stenfelt S, Lunner T (2015) Hearing loss impacts neural alpha oscillations under adverse listening conditions. Front Psychol 6:177. 10.3389/fpsyg.2015.00177 [DOI] [PMC free article] [PubMed] [Google Scholar]
- Pichora-Fuller MK, Kramer SE, Eckert MA, Edwards B, Hornsby BWY, Humes LE, Lemke U, Lunner T, Matthen M, Mackersie CL, Naylor G, Phillips NA, Richter M, Rudner M, Sommers MS, Tremblay KL, Wingfield A (2016) Hearing impairment and cognitive energy: the framework for understanding effortful listening (FUEL). Ear Hear 37:5S–27S. 10.1097/AUD.0000000000000312 [DOI] [PubMed] [Google Scholar]
- Picou EM, Ricketts TA (2014) The effect of changing the secondary task in dual-task paradigms for measuring listening effort. Ear Hear 35:611–622. 10.1097/AUD.0000000000000055 [DOI] [PubMed] [Google Scholar]
- Porter G, Troscianko T, Gilchrist ID (2007) Effort during visual search and counting: insights from pupillometry. Q J Exp Psychol (Hove) 60:211–229. 10.1080/17470210600673818 [DOI] [PubMed] [Google Scholar]
- Pylyshyn ZW, Storm RW (1988) Tracking multiple independent targets: evidence for a parallel tracking mechanism. Spat Vis 3:179–197. 10.1163/156856888x00122 [DOI] [PubMed] [Google Scholar]
- Roijendijk L, Farquhar J, Van Gerven M, Jensen O, Gielen S (2013) Exploring the impact of target eccentricity and task difficulty on covert visual spatial attention and its implications for brain computer interfacing. PLoS One 8:e80489. 10.1371/journal.pone.0080489 [DOI] [PMC free article] [PubMed] [Google Scholar]
- Rushworth MFS, Paus T, Sipila PK (2001) Attention systems and the organization of the human parietal cortex. J Neurosci 21:5262–5271. 10.1523/JNEUROSCI.21-14-05262.2001 [DOI] [PMC free article] [PubMed] [Google Scholar]
- Scholl BJ (2009) What have we learned about attention from multiple-object tracking (and vice versa)? In: Computation, cognition, and Pylyshyn (Dedrick D, Trick L, eds), pp 49–77. Cambridge, MA: MIT. [Google Scholar]
- Stolte M, Gollan B, Ansorge U (2020) Tracking visual search demands and memory load through pupil dilation. J Vis 20(6):21, 1–19. 10.1167/jov.20.6.21 [DOI] [PMC free article] [PubMed] [Google Scholar]
- Tombu M, Seiffert AE (2008) Attentional costs in multiple-object tracking. Cognition 108:1–25. 10.1016/j.cognition.2007.12.014 [DOI] [PMC free article] [PubMed] [Google Scholar]
- Tune S, Alavash M, Fiedler L, Obleser J (2021) Neural attentional-filter mechanisms of listening success in middle-aged and older individuals. Nat Commun 12:1–14. 10.1038/s41467-021-24771-9 [DOI] [PMC free article] [PubMed] [Google Scholar]
- Vazey EM, Moorman DE, Aston-Jones G (2018) Phasic locus coeruleus activity regulates cortical encoding of salience information. Proc Natl Acad Sci U S A 115:E9439–E9448. 10.1073/pnas.1803716115 [DOI] [PMC free article] [PubMed] [Google Scholar]
- Wang CA, Munoz DP (2021) Coordination of pupil and saccade responses by the superior colliculus. J Cogn Neurosci 33:919–932. 10.1162/jocn_a_01688 [DOI] [PubMed] [Google Scholar]
- Weisz N, Hartmann T, Müller N, Lorenz I, Obleser J (2011) Alpha rhythms in audition: cognitive and clinical perspectives. Front Psychol 2:73. 10.3389/fpsyg.2011.00073 [DOI] [PMC free article] [PubMed] [Google Scholar]
- Wendt D, Dau T, Hjortkjær J (2016) Impact of background noise and sentence complexity on processing demands during sentence comprehension. Front Psychol 7:345. 10.3389/fpsyg.2016.00345 [DOI] [PMC free article] [PubMed] [Google Scholar]
- Winn MB, Edwards JR, Litovsky RY (2016) The impact of auditory spectral resolution on listening effort revealed by pupil dilation. Ear Hear 36:e153–e165. 10.1097/AUD.0000000000000145 [DOI] [PMC free article] [PubMed] [Google Scholar]
- Winn MB, Wendt D, Koelewijn T, Kuchinsky SE (2018) Best practices and advice for using pupillometry to measure listening effort: an introduction for those who want to get started. Trends Hear 22:2331216518800869. 10.1177/2331216518800869 [DOI] [PMC free article] [PubMed] [Google Scholar]
- Winneke AH, Schulte M, Vormann M, Latzel M (2020) Effect of directional microphone technology in hearing aids on neural correlates of listening and memory effort: an electroencephalographic study. Trends Hear 24:2331216520948410. 10.1177/2331216520948410 [DOI] [PMC free article] [PubMed] [Google Scholar]
- Wisniewski MG, Thompson ER, Iyer N (2017) Theta- and alpha-power enhancements in the electroencephalogram as an auditory delayed match-to-sample task becomes impossibly difficult. Psychophysiology 54:1916–1928. 10.1111/psyp.12968 [DOI] [PubMed] [Google Scholar]
- Wisniewski MG, Zakrzewski AC, Bell DR, Wheeler M (2021) EEG power spectral dynamics associated with listening in adverse conditions. Psychophysiology 58:1–19. 10.1111/psyp.13877 [DOI] [PMC free article] [PubMed] [Google Scholar]
- Wöstmann M, Herrmann B, Wilsch A, Obleser J (2015) Neural alpha dynamics in younger and older listeners reflect acoustic challenges and predictive benefits. J Neurosci 35:1458–1467. 10.1523/JNEUROSCI.3250-14.2015 [DOI] [PMC free article] [PubMed] [Google Scholar]
- Wöstmann M, Lim SJ, Obleser J (2017) The human neural alpha response to speech is a proxy of attentional control. Cereb Cortex 27:3307–3317. 10.1093/cercor/bhx074 [DOI] [PubMed] [Google Scholar]
- Wu YH, Stangl E, Zhang X, Perkins J, Eilers E (2016) Psychometric functions of dual-task paradigms for measuring listening effort. Ear Hear 37:660–670. 10.1097/AUD.0000000000000335 [DOI] [PMC free article] [PubMed] [Google Scholar]
- Wutz A, Zazio A, Weisz N (2020) Oscillatory bursts in parietal cortex reflect dynamic attention between multiple objects and ensembles. J Neurosci 40:6927–6937. 10.1523/JNEUROSCI.0231-20.2020 [DOI] [PMC free article] [PubMed] [Google Scholar]
- Yarkoni T (2009) Big correlations in little studies. Perspect Psychol Sci 4:294–298. 10.1111/j.1745-6924.2009.01127.x [DOI] [PubMed] [Google Scholar]
- Zekveld AA, Kramer SE (2014) Cognitive processing load across a wide range of listening conditions: insights from pupillometry. Psychophysiology 51:277–284. 10.1111/psyp.12151 [DOI] [PubMed] [Google Scholar]
- Zekveld AA, Kramer SE, Festen JM (2010) Pupil response as an indication of effortful listening: the influence of sentence intelligibility. Ear Hear 31:480–490. 10.1097/AUD.0b013e3181d4f251 [DOI] [PubMed] [Google Scholar]
- Zekveld AA, Koelewijn T, Kramer SE (2018) The pupil dilation response to auditory stimuli: current state of knowledge. Trends Hear 22:2331216518777174. 10.1177/2331216518777174 [DOI] [PMC free article] [PubMed] [Google Scholar]
- Zhao S, Bury G, Milne A, Chait M (2019) Pupillometry as an objective measure of sustained attention in young and older listeners. Trends Hear 23:2331216519887815. 10.1177/2331216519887815 [DOI] [PMC free article] [PubMed] [Google Scholar]
Associated Data
This section collects any data citations, data availability statements, or supplementary materials included in this article.
Data Availability Statement
Data and analysis scripts are available at https://osf.io/ha58r/.