Abstract
The recently published complete DNA sequence of the bacterium Thermotoga maritima provides evidence, based on protein sequence conservation, for lateral gene transfer between Archaea and Bacteria. We introduce a new method of periodicity analysis of DNA sequences, based on structural parameters, which brings independent evidence for the lateral gene transfer in the genome of T.maritima. The structural analysis relates the Archaea-like DNA sequences to the genome of Pyrococcus horikoshii. Analysis of 24 complete genomic DNA sequences shows different periodicity patterns for organisms of different origin. The typical genomic periodicity for Bacteria is 11 bp whilst it is 10 bp for Archaea. Eukaryotes have more complex spectra but the dominant period in the yeast Saccharomyces cerevisiae is 10.2 bp. These periodicities are most likely reflective of differences in chromatin structure.
INTRODUCTION
The publication of the first complete DNA sequence of a thermophilic Bacteria (1) initiated a debate about massive lateral gene transfer between Archaea and Bacteria (2). The recently published complete DNA sequence of the bacterium Thermotoga maritima (3) provides further evidence, based on protein sequence conservation, for lateral gene transfer between Archaea and Bacteria. Sequence analysis of the proteins encoded in genome of T.maritima showed that about half are most similar to Bacterial proteins, whilst a quarter are most similar to Archaeal proteins, mainly from Pyrococcus horikoshii (3). We present here supporting evidence for lateral gene transfer, based on a new method of periodicity analysis of physical parameters along the DNA sequence.
The physical properties of specific DNA sequences can be evaluated using di- or tri-nucleotide models of structural parameters. Propeller twist (4), stacking energy (5) and protein induced deformability (6) are examples of structural parameters, which are related to the flexibility of the double helix (7). The periodicity pattern based on flexibility of the DNA helix can provide information about the bendability of the molecule and how it can be wrapped around chromatin proteins.
Correlation functions are powerful tools that can be used to reveal periodicities in DNA sequences. Correlation functions of DNA sequences normally show a strong periodicity of 3 bp, due to the triplet nature of the protein encoding, and a much weaker periodicity of 10–11 bp. Analysis of DNA sequences using non-linear curve fitting of correlation functions shows a characteristic difference between Bacterial and Archaeal genomes, where Bacteria have a typical period of 11 bp and Archaea a period of 10 bp (8). The periodicities of 3 and 10–11 bp can also be shown by a Fourier transformation of the DNA sequence (9). We have found favourable results using a combination of the two methods, in which a Fourier transform of the correlation function is used to elucidate the weaker periodicity of 10–11 bp. This method gives a much stronger signal at 10–11 bp than a direct Fourier transformation of the sequence and the outcome is a spectrum of periodicities, which characterize the analysed genome.
MATERIALS AND METHODS
Structural parameters
We have used three different dinucleotide models of structural parameters (protein induced deformability, stacking energy and propeller twist) plus the AT content to generate periodicity spectra of the listed genomes. Protein induced deformability is based on comparisons of crystal structures of DNA/protein complexes with crystal structures of pure DNA (6). Stacking energy is based on quantum mechanical calculations of interaction energies between neighbouring base pairs (5). Propeller twist is the twist that makes the two bases of a pair non-coplanar, the values are based on crystallographic data of DNA oligomers (4), where we have added a theoretical estimate for the TA dinucleotide (10).
The use of numerical methods like correlation functions and Fourier transform requires that the DNA sequence is transformed into numerical form. This can be done either by using the appearance of single or dinucleotides or by using structural parameters derived from di- or trinucleotide models of the physical properties of DNA. The use of structural parameters has the advantage that di- or trinucleotides with similar physical properties will be represented by similar values in the generated numerical sequence.
Autocorrelation function
The autocorrelation function, G(k), can be calculated from a numerical sequence as:  1
1
where k is the correlation distance, N is the length of the sequence and f(i) is the value at position i in the sequence. A normalized autocorrelation function Gn(k) makes results using different structural parameters directly comparable:
where [f]2 is the mean value squared. The results in this work are based on normalized autocorrelation functions. The autocorrelation function Gn(k) is by definition an even function and it has very large values at the innermost points compared to the remainder. Because the correlations of the 10–11 bp periodicities do not range longer than 200 bp, only the first 200 points in the autocorrelation functions were calculated.
Fourier transform of the autocorrelation function
The periodicities in the genomic sequences can be extracted by a Fourier transform of the autocorrelation function. Due to the relatively weak 10–11 bp periodicity, a noise reducing scheme was necessary. All the autocorrelation functions were prepared for Fourier transformation by the following procedure. The number of data points were doubled by an inversion of the 200 points in the point k = 0, a running average of 3 was applied, the strong peak around k = 0 was removed by replacing the functional values in the interval (–5,5) with Gn(6), and finally the background was removed by subtracting a smooth fit made with 20 cubic spline functions. The inversion enhances the spectral resolution of the Fourier spectrum and is justified by the fact that the autocorrelation function is even. The running average of 3 removes the strong period 3 signal due to protein encoding and highlights the periodicities of interest. The strong peak at k = 0 and the shape of the background will have Fourier components (overtones) at all periodicities, which may hide a weak signal. In some cases the spectra are noisy and the precise position of the peak can be difficult to determine, these spectra are marked in Table 1. The criterion for designating a spectrum as noisy is that the amplitude of the noise has more than half the value of amplitude of the main peak.
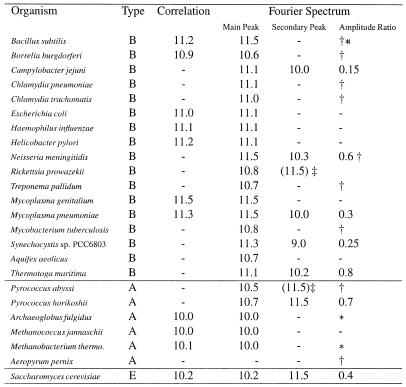
Table 1. Periodicities in complete genomes.
The results listed under Fourier spectrum are based on propeller twist, except in three cases. *, where the stacking energy provides the strongest signal. The amplitude ratio is the height of the secondary peak relative to the main peak. *, stacking energy used instead of propellar twist. †, low signal to noise ratio. ‡, the secondary peak appears as a shoulder at the main peak and the position is uncertain. The results listed under Correlation are from Herzel et al. (8).
BLAST search for Archaea-like and Bacteria-like sequences
To obtain a sequence of Archaea-like DNA from T.maritima the encoded proteins were aligned using BLAST against the proteins of five different Archaeal genomes: Pyrococcus abyssi, P.horikoshii, Archaeoglobus fulgidus, Methanococcus jannaschii and Methanobacterium thermoautotrophicum. Protein sequences with an expectation score smaller than 10–9 were picked out. To reduce boundary value problems only DNA sequences longer than 500 bp were collected for calculation of the autocorrelation function. The Bacteria-like sequences were collected using the same procedure but with proteins from the following six Bacterial genomes: Bacillus subtilis, Escherichia coli, Haemophilus influenzae, Helicobacter pylori, Mycoplasma genitalium and Rickettsia prowazekii.
RESULTS
Structural analysis of complete genomes
We have analysed the complete DNA sequences of 23 different Bacterial and Archaeal genomes as well as the genome of the yeast Saccharomyces cerevisiae in terms of periodicity of sequence patterns. Three different structural parameters [propeller twist (4), protein induced deformability (6) and stacking energy (5)] plus the AT content were used to generate periodicity spectra of the listed genomes. By comparing the spectra made with the different structural parameters we have found that the propeller twist gives the strongest signal for the 10–11 bp periodicity, except in three cases where the stacking energy gives the strongest signal.
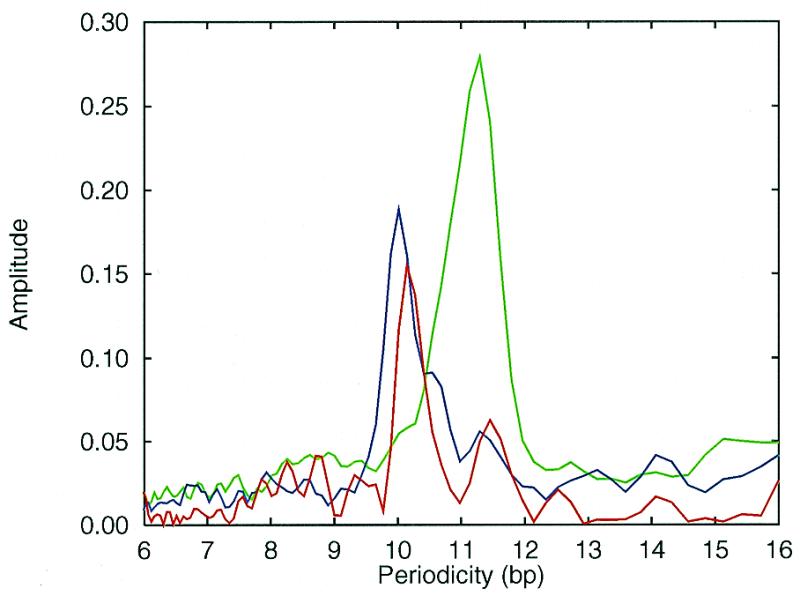
We have found a typical periodicity close to 11 bp for the Bacterial genomes and 10 bp for the Archaeal genomes (Fig. 1). The average spectrum of the Bacterial genomes yields a distinct peak at 11.3 bp (green line), while the average spectrum of the Archaeal genomes has a distinct peak at 10.0 bp (blue line). However, close to a third of the genomes analysed revealed more than one period. The results from the periodicity analysis are summarised in Table 1, and the spectra for all 24 genomes are available from our web page (http://www.cbs.dtu.dk/services/ GenomeAtlas/periodicity/ ).
Figure 1.

Average periodicity spectra for Bacteria (green) and Archaea (blue) shown together with the spectrum for the complete genome of the yeast S.cerevisiae (red).
The genomes of T.maritima and P.horikoshii
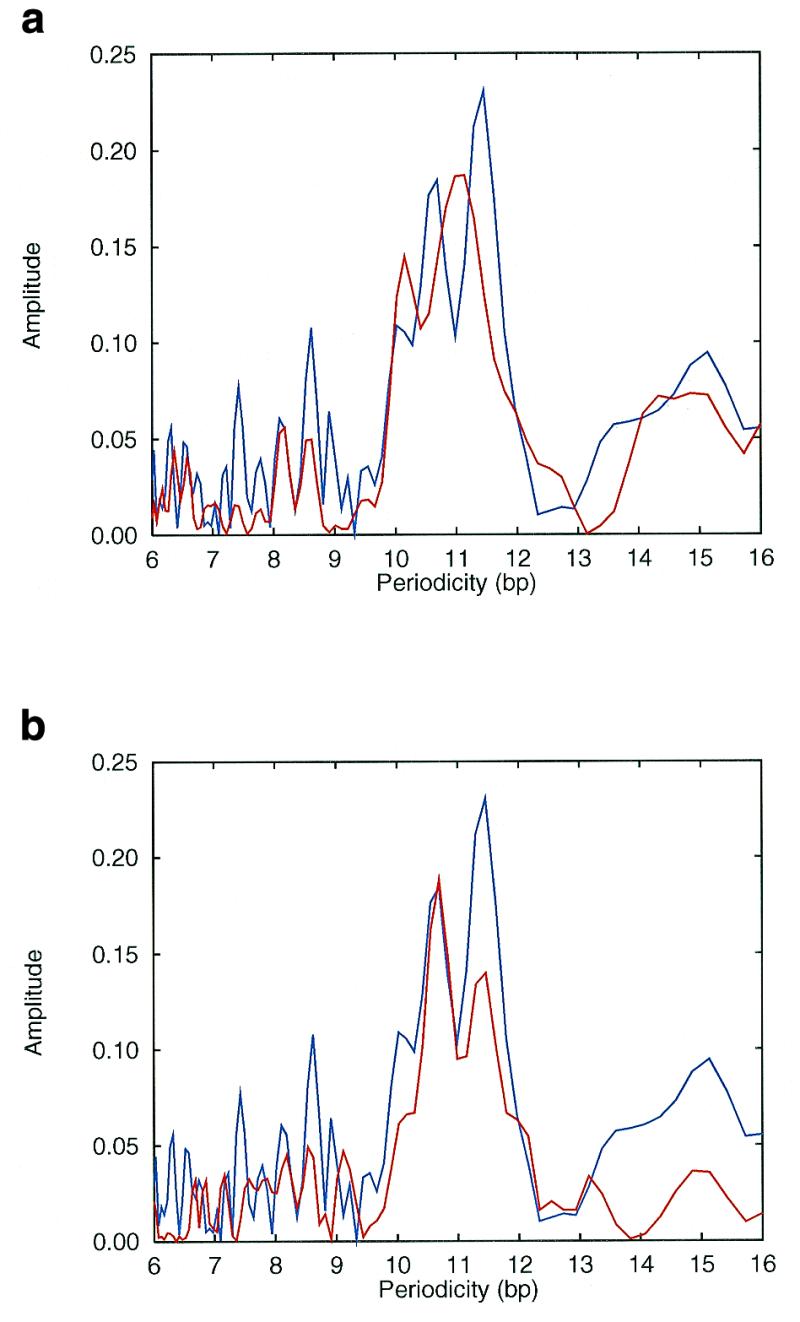
The spectra of T.maritima (Fig. 2a) and P.horikoshii (Fig. 2b) have two distinct peaks, well above the noise level. However, both the position of the peaks and the overall shape of the spectra are quite different. While T.maritima has peaks at 11.1 and 10.2 bp with a main peak which is much broader than the secondary peak, P.horikoshii has peaks at 10.7 and 11.5 bp of approximately the same width. To further study the Archaeal-like part of the T.maritima genome, a BLAST search was made of T.maritima proteins against the proteins from five different complete Archaeal genomes. DNA sequences encoding the proteins that matched the Archaeal proteins were collected from the T.maritima genome and a periodicity spectrum was made. The collected sequences make a total of 500 kb, or nearly a quarter of the genome. This spectrum is indicated by the blue line in Figure 2a and b; note that there are two distinct peaks, which exactly match the positions of the peaks in the P.horikoshii spectrum, see Figure 2b. The noise level is higher due to the smaller size of the collected sequence, but the overall shape of the spectrum is much more similar to the P.horikoshii than the T.maritima spectrum. An equivalent analysis was made against six complete Bacterial genomes resulting in 700 kb of collected Bacterial-like T.maritima DNA sequences; the Bacteria-like sequences yielded a periodicity spectrum which was very similar to the complete T.maritima spectrum (data not shown, available from our web page).
Figure 2.

(a) Periodicity spectrum for the complete genome of the thermophilic bacteria T.maritima (red) shown together with the Archaea-like sequences from T. maritima (blue). (b) Periodicity spectrum for the complete genome of thermophilic Archaea P.horikoshii (red) shown together with the Archaea-like sequences from T.maritima (blue).
Analysis of other genomes
Until now only two thermophilic Bacteria have been sequenced: T.maritima (3) and Aquifex aeolicus (1). The spectrum of A.aeolicus shows only one distinct peak at 10.7 bp and the periodicity spectrum of the Archaea-like part of the genome, extracted by the procedure described above, is very similar to the spectrum of the whole genome (data not shown).
Some genomes revealed noisy spectra with very weak periodicities especially the two species, Sulfolobus solfataricus and Aeropyrum pernix, both of which belongs to Crenarchaeota a separate kingdom of extremely thermophilic Archaea. A preliminary analysis of the available 2.1 Mb (70%) from the S.solfataricus genome shows a noisy spectrum with a weak periodicity of 10.7 bp and the A.pernix genome revealed no periodicity at all. Eukaryotes shows more complicated spectra where the signal-to-noise ratio generally are lower than for prokaryotes. The spectrum of the complete S.cerevisiae genome shows a dominating periodicity of 10.2 bp with a much weaker peak at 11.5 bp (the red line in Fig. 1).
DISCUSSION
Evidence for massive lateral gene transfer
The similarity between the periodicity spectra of the Archaea-like regions in the T.maritima genome and the complete P.horikoshii genome, together with the differences between the spectra of the Archaea-like part and the remaining part of T.maritima, suggest that this genome is a mosaic consisting of two types of sequences, where a quarter of the genome is closely related to the Archaeal genome of P.horikoshii, while the remaining part has a different thermophilic Bacterial ancestry. The sequence alignments of single proteins and the similarity of the periodicity spectra of DNA sequences represent independent evidence of the mosaic nature of the T.maritima genome. This brings new evidence supporting the idea of massive lateral gene transfer between Archaeal and Bacterial genomes (2). To date the arguments in the debate about lateral gene transfer between Archaea and Bacteria (3,11,12) have been based on pair-wise similarity of protein sequences only.
Biological implications of the periodicity
There are several possible biological reasons for the difference in periodicity between Archaea and Bacteria. Herzel et al. proposed that a period of 11 in Bacteria is the result of negative supercoiling, while the period of 10 in Archaea is due to positive supercoiling (13). Presently, it appears that positive supercoiling could be a general characteristic of thermophilic Archaea, whilst negatively supercoiling is characteristic of mesophilic Bacteria and possibly mesophilic Archaea as well (14,15). The topological status of thermophilic Bacterial genomes is unknown; positive as well as negative supercoiling is possible, because both gyrase and reverse gyrase enzymes are present in T.maritima and A.aeolicus (1,16). A preliminary analysis made with 200 kb of DNA from several different species of mesophilic Archaea showed a periodicity of 10 (data not shown; available at our web page). Reliable conclusions about periodicities of mesophilic Archaea must wait until more sequence data become available.
An alternative explanation for the difference in periodicity is that the chromatin structure is quite different in Archaea and Bacteria. Based on the sequence of chromatin proteins, there is a large difference between Archaea and Bacteria, while the Archaeal chromatin proteins are closely related to the Eukaryal core histones (17). Furthermore, Archaeal chromatin contains nucleosomes that appear analogous to Eukaryal nucleosomes (18). The dominating periodicity of 10.2 bp we have observed in Eukaryal DNA is exactly equal to the helical periodicity around the Eukaryal nucleosome core, found by X-ray crystallography of the nucleosome core particle (19).
The relation to chromatin structure is from our view the most probable and fruitful explanation of the genomic periodicities. In this perspective the periodicity patterns of the structural parameters investigated in this work represent an evolutionary adaption of the DNA sequence to the chromatin structure in each genome. The very weak periodicities in the genomes of two species from the Crenarchaeota kingdom, A.pernix and S.solfataricus, and the fact that no histone-like proteins have been reported so far within this kingdom (20) are indications of a different chromatin structure in Crenarchaeota. The similar chromatin proteins and the similar dominating periodicity values in Eukaryotes and Archaea are independent evidence of a common ancestry of Eukaryal and Archaeal chromatin structure.
Implications for phylogenetic analysis
The existence of massive lateral gene transfer between Archaea and Bacteria makes the validity of prokaryotic phylogenetic trees very uncertain, because the shape of the tree will depend on the sequences chosen to calculate the distances. Recently Teichmann and Mitchison have raised serious doubts about the value of the phylogenetic signal in Prokaryotic proteins (21). In this context, the strength of the present periodicity analysis is that the entire genomic sequence is used to make the spectrum.
Acknowledgments
ACKNOWLEDGEMENTS
The authors would like to thank Lars Øgendal from the Royal Veterinary and Agricultural University of Copenhagen, Daniel W. Drell of the Department of Energy in the US, and people at CBS for valuable propositions and conversations. This work was supported by a grant from the Danish National Research Foundation.
REFERENCES
- 1.Deckert G., Warren,P., Gaasterland,T., Young,W., Lenox,A., Graham,D., Overbeek,R., Snead,M., Keller,M., Aujay,M., Huber,R., Feldman,R., Short,J., Olsen,G. and Swanson,R. (1998) Nature, 392, 353–358. [DOI] [PubMed] [Google Scholar]
- 2.Aravind L., Tatusov,R.T., Wolf,Y.I., Walker,D.R. and Koonin,E.V. (1998) Trends Genet., 14, 442–444. [DOI] [PubMed] [Google Scholar]
- 3.Nelson K.E., Clayton,R., Gill,S., Gwinn,M., Dodson,R., Haft,D., Hickey,E., Peterson,J., Nelson,W., Ketchum,K., McDonald,L., Utterback,T., Malek,J., Linher,K., Garrett,M., Stewart,A., Cotton,M., Pratt,M., Phillips,C., Richardson,D., Heidelberg,J., Sutton,G., Fleischmann,R., Eisen,J.A., White,O., Salzberg,S.L., Smith,H.O., Venter,J.C. and Fraser,C. (1999) Nature, 399, 323–329. [DOI] [PubMed] [Google Scholar]
- 4.elHassan M. and Calladine,C. (1996) J. Mol. Biol., 259, 95–103. [DOI] [PubMed] [Google Scholar]
- 5.Ornstein R., Rein,R., Breen,D. and MacElroy,R. (1978) Biopolymers, 17, 2341–2360. [DOI] [PubMed] [Google Scholar]
- 6.Olson W., Gorin,A., Lu,X., Hock,L. and Zhurkin,V. (1998) Proc. Natl Acad. Sci. USA, 95, 11163–11168. [DOI] [PMC free article] [PubMed] [Google Scholar]
- 7.Jensen L.J., Friis,C. and Ussery,D. (1999) Res. Microbiol., 150, 773–777. [DOI] [PubMed]
- 8.Herzel H., Weiss,O. and Trifonov,E. (1999) Bioinformatics, 15, 187–193. [DOI] [PubMed] [Google Scholar]
- 9.Widom J. (1996) J. Mol. Biol., 259, 579–588. [DOI] [PubMed] [Google Scholar]
- 10.Gorin A., Zhurkin,V. and Olson,W. (1995) J. Mol. Biol., 247, 34–48. [DOI] [PubMed] [Google Scholar]
- 11.Kyprides N.C. and Olsen,G.J. (1999) Trends Genet., 15, 298–299. [DOI] [PubMed] [Google Scholar]
- 12.Aravind L., Tatusov,R.T., Wolf,Y.I., Walker,D.R. and Koonin,E.V. (1999) Trends Genet., 15, 299–300. [DOI] [PubMed] [Google Scholar]
- 13.Herzel H., Weiss,O. and Trifonov,E. (1998) J. Biomol. Struct. Dyn., 16, 341–345. [DOI] [PubMed] [Google Scholar]
- 14.Forterre P., Bergerat,A. and Lopez-Garcia,P. (1996) FEMS Microbiol. Rev., 18, 237–248. [DOI] [PubMed] [Google Scholar]
- 15.Charbonnier F. and Forterre,P. (1994) J. Bacteriol., 176, 1251–1259. [DOI] [PMC free article] [PubMed] [Google Scholar]
- 16.Guipaud O., Marguet,E., Noll,K.M., de laTour,C.B. and Forterre,P. (1997) Proc. Natl Acad. Sci. USA, 94, 10606–10611. [DOI] [PMC free article] [PubMed] [Google Scholar]
- 17.Hyat M. and Mancarella,D. (1995) Micron, 26, 461–480. [DOI] [PubMed] [Google Scholar]
- 18.Pereira S.L., Grayling,R.A., Lurz,R. and Reeve,J.N. (1997) Proc. Natl Acad. Sci. USA, 94, 12633–12637. [DOI] [PMC free article] [PubMed] [Google Scholar]
- 19.Luger K., Mäder,A.W., Richmond,R.K., Sargent,D.F. and Richmond,T.J. (1997) Nature, 389, 251–260. [DOI] [PubMed] [Google Scholar]
- 20.Zlatanova J. (1997) Proc. Natl Acad. Sci. USA, 94, 12251–12254. [DOI] [PMC free article] [PubMed] [Google Scholar]
- 21.Teichmann S.A. and Mitchison,G. (1999) J. Mol. Evol., 49, 98–107. [DOI] [PubMed] [Google Scholar]


