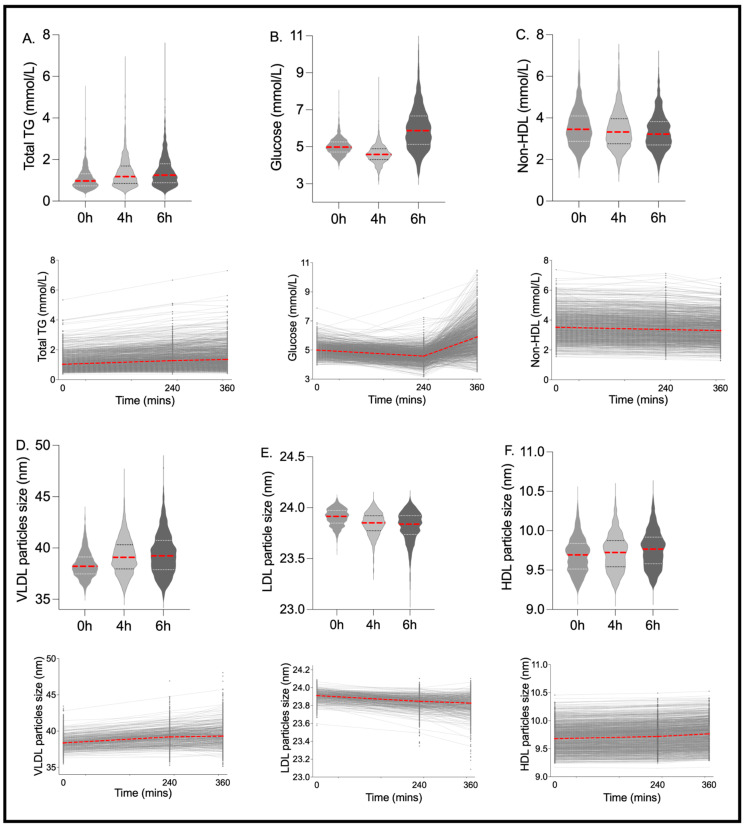
Figure 2.
Inter-individual variation and distribution for traditional clinical metabolites and lipoprotein particle size. Fasting and postprandial concentrations of (A) triglycerides (TG) (mmol/L), (B) glucose (mmol/L), (C) non-high-density lipoprotein (HDL) (mmol/L) and particle sizes of: (D) very low-density lipoprotein (VLDL) (nm), (E) low-density lipoprotein (LDL) (nm), (F) high-density lipoprotein (HDL) (nm). n = 1002. Red lines show the median value.

