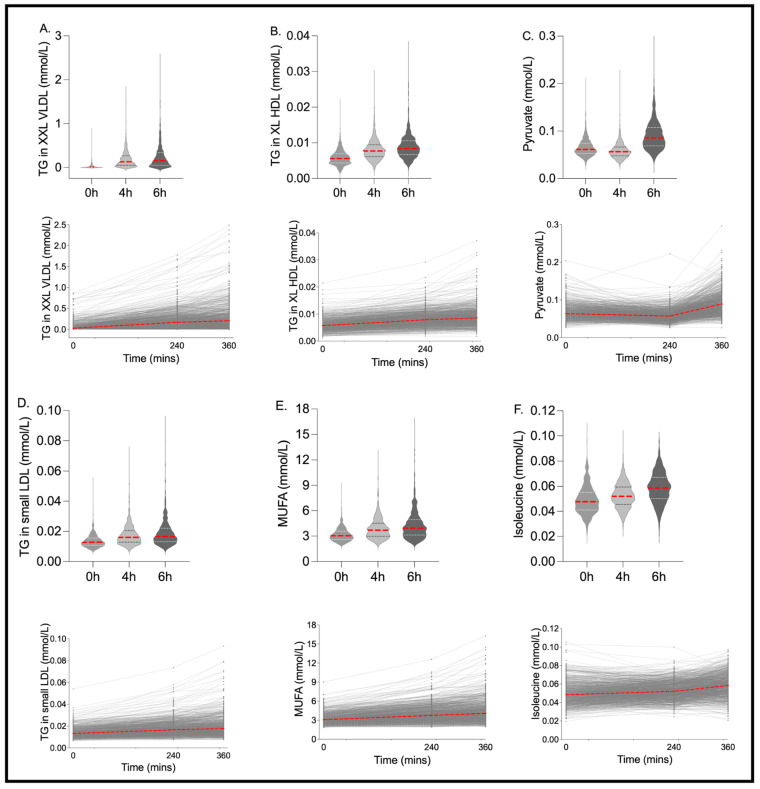
Figure 3.
Metabolites with the greatest postprandial change and/or postprandial inter-individual variability. Fasting and postprandial concentrations of (A) triglycerides in extremely large VLDL particles and chylomicrons (TG in XXL VLDL), (B) triglycerides in large HDL particles and chylomicrons (TG in XL HDL), (C) triglycerides in LDL particles and chylomicrons (TG in LDL), (D) pyruvate, (E) mono-unsaturated fatty acids (MUFA), (F) isoleucine. n = 1002. Red lines show the median value.

