


Abstract
The solution structure of the dodecamer duplex d(CTTTTGCAAAAG)2 and its 2:1 complex with the bis-benzimidazole Hoechst 33258 has been investigated by NMR and NOE-restrained molecular dynamics (rMD) simulations. Drug molecules are bound in each of the two A-tracts with the bulky N-methylpiperazine ring of each drug located close to the central TG (CA) step, binding essentially to the narrow minor groove of each A-tract. MD simulations over 1 ns, using an explicit solvation model, reveal time-averaged sequence-dependent narrowing of the minor groove from the 3′-end towards the 5′-end of each TTTT sequence. Distinct junctions at the TpG (CpA) steps, characterised by large positive roll, low helical and propeller twists and rapid AT base pair opening rates, add to the widening of the groove at these sites and appear to account for the bound orientation of the two drug molecules with the N-methylpiperazine ring binding in the wider part of the groove close to the junctions. Comparisons between the free DNA structure and the 2:1 complex (heavy atom RMSD 1.55 Å) reveal that these sequence-dependent features persist in both structures. NMR studies of the sequence d(GAAAAGCTTTTC)2, in which the A-tracts have been inverted with the elimination of the TpG junctions, results in loss of orientational specificity of Hoechst 33258 and formation of multiple bound species in solution, consistent with the drug binding in a number of different orientations.
INTRODUCTION
The majority of small molecules that bind in the minor groove of duplex DNA, including distamycin and Hoechst 33258 (Fig. 1a), have a marked preference for AT rich sequences (1–3). Many interfere with DNA topoisomerases and transcription factor binding making them clinically useful anti-tumour, anti-viral and anti-microbial agents (4–8). Recently it has been suggested that sequence specificity may be dominated by ability to select binding sites on the basis of groove width, allowing optimum van der Waal’s complementarity and hydrophobic surface burial, rather than specific hydrogen bonding interactions with the groove floor (9). The Hoechst family of compounds has been studied extensively using biophysical methods (10–12), and a number of X-ray structures (13–20) and NMR studies (21–26) have been reported that have, in part, shed light on the molecular basis for DNA minor groove recognition. These structural data are now being complemented by calorimetric data to add a detailed thermodynamic profile to the DNA recognition process (10).
Figure 1.

(a) Left, side-by-side, head-to-tail co-operative interaction between distamycin molecules in the 2:1 complex; right, co-operative head-to-head interaction between H33258 molecules in the minor groove of the 2:1 complex described here. (b) Selection of NOEs observed from non-exchangeable protons that define the position of H33258 within the minor groove. (c) Direct and solvent-mediated hydrogen bonding interactions with the floor of the minor groove (adenine N3 and thymine O2; w, water). Mean distances and standard deviations are given in Table 1.
The vast majority of the structural data on Hoechst 33258 and its analogues bound to DNA have reported complexes containing a single binding site of 4–6 A-T base pairs within self-complementary AATT, ATAT and AAATTT binding sites (13–26). The limitations imposed by these sequences are 2-fold. (i) The limited size of these binding sites has complicated the analysis of sequence-dependent A-tract recognition by restricting the number of high affinity binding sites available in one sequence. (ii) The orientational preference of the bound ligand has been obscured by choosing A-tracts containing self-complementary (AnTn) binding sites where the drug can bind in one of two symmetry related orientations. It is known that Tn or An tracts (n ≥ 4) are not uniform; recent studies of the localisation of ammonium ions in the minor groove of various A-tracts show sequence-dependent effects which correlate with groove narrowing towards the 3′-end of An tracts (n > 4) (27), making symmetrical AnTn tracts narrowest at the centre of the sequence. The sensitivity of ligand binding to the direction of groove narrowing in isolated An and Tn tracts, together with the effects of A-tract junctions on binding orientation, has not been addressed.
To examine the effects of sequence-dependent structural features on groove recognition and ligand orientation we describe a high resolution NMR study of Hoechst 33258 binding to the dodecamer duplex d(CTTTTGCAAAAG)2 containing two TTTT tracts. Previously, titration studies and subsequent low resolution structural analysis, revealed that two bound drug molecules are accommodated in symmetry-related orientations such that the overall dyad symmetry of the duplex is retained in solution (21). Binding at the two sites was found to be highly co-operative with only the 2:1 complex detected in equilibrium with the free duplex. Capillary electrophoresis studies have demonstrated a similar co-operative behaviour with other AT-rich sequences (28). Further, the two TTTT sites are separated by an intervening GC pair which isolates the two ligands (Fig. 1a). Thus, a direct-contact mechanism cannot explain the observed co-operativity. This contrasts with the anti-parallel side-by-side dimer motif of distamycin where there is a highly complementary fit within a widened minor groove with a favourable π-stacking interaction between the two drug molecules (29,30).
On the basis of a set of 56 drug–DNA NOEs, which define with some precision the binding site of H33258 in the TTTT minor groove of d(CTTTTGCAAAAG)2, we have employed a restrained molecular dynamics (rMD) protocol, involving an explicit solvation model (31,32), to determine the structure of the complex and have studied the dynamic nature of the interaction from an analysis of a 1 ns rMD simulation. Subsequently, we have determined the structure and dynamics of the free duplex using a similar protocol to assess the extent to which features of the drug–DNA interaction are a consequence of ‘induced fit’ and which arise from sequence-dependent structural features. In both cases, the quality of the fit to the experimental NMR restraints suggests that the structures are well defined and shed some light on the orientational preference for binding to the TTTT tract.
MATERIALS AND METHODS
DNA synthesis
The DNA decamer d(CTTTTGCAAAAG) was synthesised using standard solid-phase phosphoramidite chemistry, and purified trityl-on by reverse-phase HPLC using TEAA buffer (pH 7.0) and an acetonitrile gradient, as previously described (26).
Sample preparation
The sample of Hoechst 33258 was purchased from Sigma. The drug–DNA complex was formed by titrating small aliquots of drug (~10 mM solution) into an annealed solution of the oligonucleotide in 100 mM NaCl, 10 mM NaD2PO4, at pH 7.0 (measured in D2O solution and uncorrected for the deuterium isotope effect). The stoichiometry was monitored by 1H NMR to give a 2:1 complex at a duplex concentration of 2 mM. The sodium salt of trimethylsilylpropionate was added as an internal reference compound, 0.1% sodium azide added as an anti-bacterial agent and 0.1% EDTA to complex any heavy metal ions.
NMR analysis
NMR data were collected at 500 MHz on a Bruker DRX500 spectrometer and processed on an R4600PC Silicon Graphics Indy workstation using XWINNMR software. Standard phase-sensitive 2D NMR pulse sequences were used throughout, including NOESY, DQF-COSY, TOCSY and WATERGATE-NOESY for solvent suppression in 90% H2O solutions (26). NOESY spectra were acquired at mixing times between 50 and 300 ms and, typically, 2048 complex data points were collected for each of 512 t1 increments with 48 transients for each. Spectra were zero filled to 2048 × 1024 prior to Fourier transformation. Measurements of imino proton line widths as a function of [NH3] used the jump-return pulse sequence for solvent suppression (21,23).
NOE restraints
Interproton distances in both the 2:1 complex and the free DNA were derived by integration of NOEs assigned from 75, 100 and 125 ms NOESY spectra in D2O, and 200 and 100 ms NOESY data in H2O solutions. Distances were determined by extrapolation to zero mixing time (33), and calibrated as appropriate to a number of fixed reference distances: deoxyribose H2′/H2′′ (1.85 Å), cytosine H5/H6 (2.45 Å), thymine CH3/H6 (3.0 Å), and bz1 and bz2 H6/H7 (1.85 Å). An upper error bound of 20% was added to all data involving non-exchangeable protons, and 40% to distances calculated for exchangeable protons. A total of 396 NOE restraints were used for structural refinement of the free DNA and 464 for the 2:1 complex, including 56 drug–DNA NOEs.
Structure calculations
Molecular modelling and structure calculations were carried out on a Silicon Graphics Origin 200 server interfaced with O2 work stations using AMBER 95 software, incorporating the Cornell forcefield (34). A canonical B-DNA conformation of d(CTTTTGCAAAAG)2 was generated using the LeaP module of AMBER and was used as the starting structure. Twenty-two sodium counterions were added around the phosphate groups and the system solvated by a periodic box of 216 TIP3P water molecules to a minimum distance of 5 Å around the solute. This resulted in a box of dimensions 40 × 40 × 60 Å containing 1700 water molecules. Prior to molecular dynamics simulations, the systems (including the TIP3P solvent model) were subjected to a careful conditioning protocol, as previously described (26,35). Distance restraints with a force constant of 30 kcal mol–1 Å–2 were introduced over a period of 20 ps, with a simultaneous increase in temperature from 1 to 300 K. The NOE-restrained B-DNA dynamics simulation was extended to 1 ns, with all simulations employing the particle mesh Ewald (PME) method to treat electrostatic interactions (31,32).
The electrostatic potential around Hoechst 33258 was calculated by an ab initio method at G-13C* basis set level using Gaussian 98 software (36). The two drug molecules were manually docked in three different positions (a–c) within a canonical B-DNA structure to ensure the binding site found was not biased by the starting structure; in (a) the drug molecules were located in the minor groove according to several NOE distances; in (b) and (c) the drug was displaced by 1 bp in either direction along the groove and also out of the groove by ~3 Å. A set of key NOE restraints for each drug to the groove floor were then applied to the three conditioned structures while the DNA was restrained with a force of 100 kcal mol–1 Å–2. One structure from the three complexes that best satisfied the intermolecular distance restraints was selected for the continuation of dynamics. The temperature of the system was ramped from 1 to 300 K over a period of 10 ps with the DNA restrained with a force constant of 100 kcal mol–1 Å–2. The whole set of drug–DNA and DNA–DNA distance restraints were introduced with a force constant of 30 kcal mol–1 Å–2. In successive 10 ps runs the force constant on the DNA was reduced to 50, 25, 10, 5 and 2 kcal mol–1 Å–2. Restrained dynamics followed for 1 ns with the drug and DNA fully free. Snapshots of the simulation were collected every picosecond. The average structure, and the RMSD from the average over the final 500 ps of the trajectory, was calculated using the CARNAL module of AMBER 4.1. RMSDs between starting and final energy minimised structures were calculated using MOLMOL (37).
Restraint violations
Free DNA. At the end of the 1 ns NOE-restrained simulation the energy penalty from restraint violations was 32.15 kcal mol–1; 36 distances (most of them found at the terminal residues) were violated from the set of 396 restraints. The maximum distance violation was 0.46 Å, 21 restraints were violated by <0.1 Å, a further nine restraints by <0.2 Å and five restraints by <0.4 Å. The pairwise RMSD from the mean structure over the final 500 ps of the simulation was 0.82 (±0.13) Å.
2:1 complex. At the end of the 1 ns NOE-restrained simulation the energy penalty from restraint violations was 21.36 kcal mol–1 with only 28 distance violations. The maximum distance violation was 0.24 Å, eight restraints were violated by <0.1 Å, 14 restraints by <0.2 Å and six restraints by <0.24 Å. The pairwise RMSD from the mean structure over the final 500 ps of the simulation was 1.13 (±0.17) Å.
The co-ordinates of the energy minimised structure of the 2:1 complex have been deposited in the Brookhaven protein data bank, accession code: 1qsx. Helical parameters for the free DNA and the 2:1 complex derived from CURVES analysis (38) are available as supplementary data.
RESULTS AND DISCUSSION
Orientation and conformation of H33258 within the TTTT tract
The orientation of H33258 within each A-tract is unambiguously defined by the pattern of NOEs to the floor and walls of the minor groove (Fig. 1b). For example, NOEs from the N-methylpiperazine ring to A8H2, A9H2 and A9H1′ at one end of the binding site, and from the phenyl ring protons pH 2,6 to T2H1′, T3H1′ and A11H2 at the other end of the A-tract establish that the H33258 binds with the N-methylpiperazine rings of the two bound molecules located at the centre of the duplex each close to the T5-G6 step. The structure of the 2:1 complex is shown in Figure 2. Each drug is bound across the TTTT tract such that the complex retains a pseudo 2-fold symmetry. The view into the minor groove illustrates the proximity of the two charged piperazine rings. These are separated by ~15 Å (N–N distance) with the intervening cavity filled with water molecules. The pattern of hydrogen bonding interactions with the floor of the groove is shown in Figure 1c, with the drug forming cross-strand bifurcated interactions between adenine N3 and thymine O2 (Table 1). The pattern of interactions in the two binding sites is essentially the same; hydrogen bonds with the N3 of A10 and A11 are generally longer than those with the O2 of T3 and T4 on the complementary strand with standard deviations in these distances over the final 500 ps of the simulation of ~0.3 Å. Although the charged piperazinium ring does not form direct hydrogen bonds to the floor of the groove, analysis of the solvation shell during the MD simulation shows persistent water-mediated interactions with the N3 of G6 in both ligand binding sites.
Figure 2.
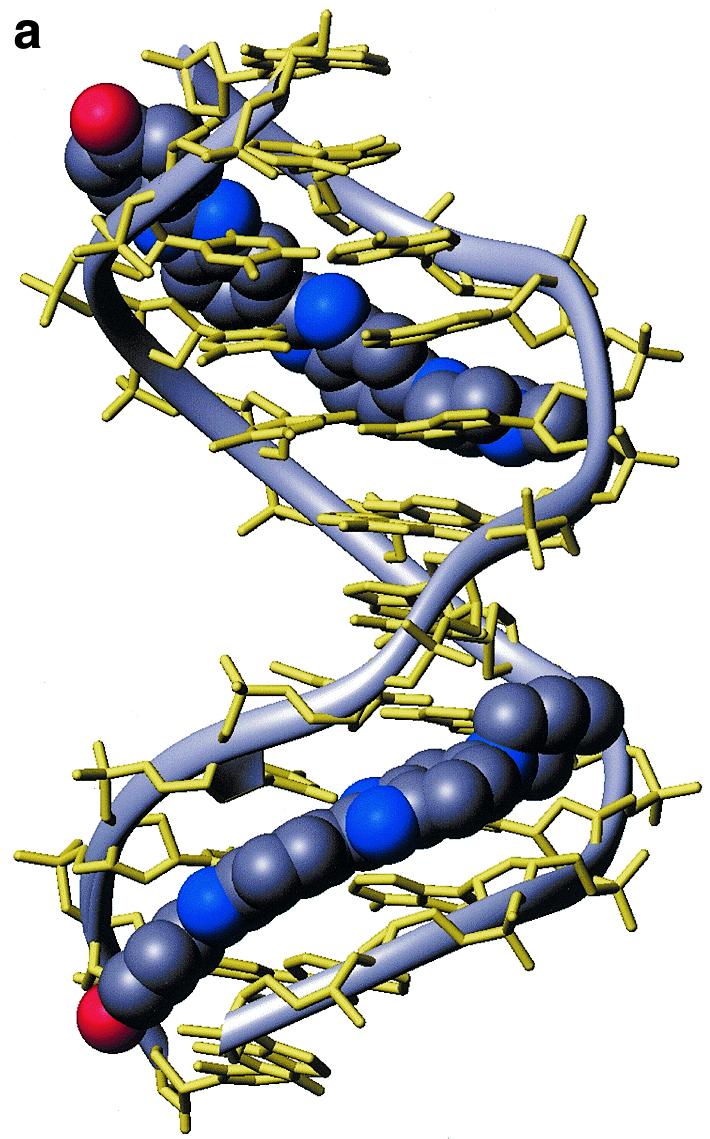
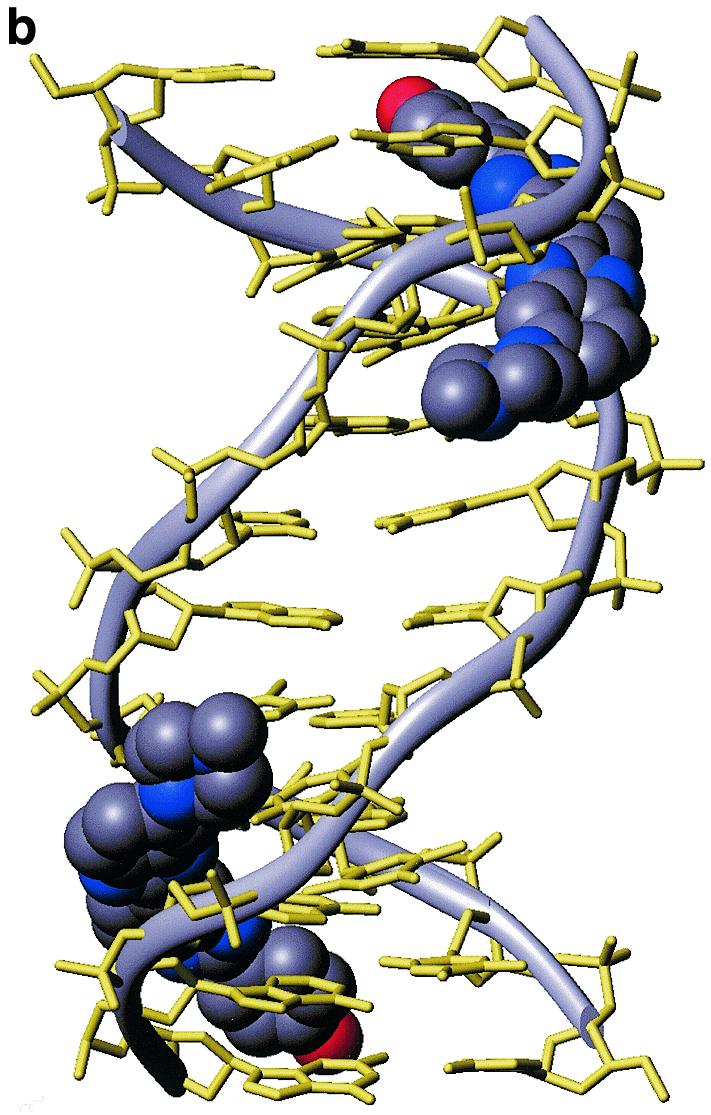

Structure of the 2:1 complex of H33258 bound to d(CTTTTGCAAAAG)2. (a) Diagrammatic representation (both drug molecules shown in CPK format) illustrating the change in groove width along the sequence with widening at the junctions with the central GC steps. (b) View into the minor groove indicating the relative separation of the two N-methylpiperazine rings. (c) Stereoview of one binding site illustrating close van der Waal’s contacts between the bound ligand and the walls of the minor groove.
Table 1. Mean ligand torsion angles, intermolecular hydrogen bonding distances and angles in the 2:1 complex with d(CTTTTGCAAAAG)2 taken over the final 500 ps of restrained molecular dynamics simulations.
| Torsion angles (degrees)a | |||
|---|---|---|---|
| ph–bz1 | bz1–bz2 | bz2–pip | |
| H33258 (1) | 11.7 (12.1) | 9.0 (13.9) | 17.4 (39.4) |
| H33258 (2) | 12.3 (11.4) | 17.6 (10.3) | –24.3 (15.7) |
| Hydrogen bond distance (H–X, Å)a and angles [N-H–A(N3)/T(O2), degrees]b | ||
|---|---|---|
| H33258 (1) | ||
| bz1 NH | A11 N3 2.91 (0.29) [117.8 (13.9)] | T3 O2 2.11 (0.24) [148.5 (17.3)] |
| bz2 NH | A10 N3 2.54 (0.33) [132.4 (19.2)] | T4 O2 2.53 (0.31) [129.7 (22.1)] |
| H33258 (2) | ||
| bz1 NH | A11 N3 2.99 (0.28) [112.4 (12.0)] | T3 O2 2.09 (0.19) [154.8 (12.3)] |
| bz2 NH | A10 N3 2.76 (0.22) [117.6 (12.6)] | T4 O2 2.22 (0.25) [146.3 (13.7)] |
aMean values given with standard deviations in parentheses.
bHydrogen bond angles for bifurcated interactions typically lie between 120 and 160°.
To maximise groove complementarity the drug molecules have a slightly twisted conformation (Table 1). The torsion angles between the phenyl–benzimidazole (ph–bz1) and benzimidazole–benzimidazole (bz1–bz2) rings (Fig. 1b) show only small deviations from planarity (<20° in the mean structure) while standard deviations from the mean values are also relatively small during the course of the dynamics simulations. The planar aromatic rings of both bound drug molecules appear to be conformationally restricted by van der Waal’s interactions with the groove walls and hydrogen bonds to the groove floor. In contrast, the benzimidazole–piperazine (bz2–pip) torsion angle shows greater dynamic freedom sampling a range of conformations within the wider region of the groove.
DNA conformation in the 2:1 complex
The DNA helical parameters have been analysed over the final 500 ps of the dynamics simulation using CURVES (38), and the fluctuations in a number of key parameters assessed. Sequence-dependent variations in structure are illustrated in Figure 3 for propeller twist, groove width and roll angle. Most striking is the apparent widening of the groove in the 5′→3′ direction along both TTTT tracts, culminating in distinct junctions with the central G-C base pairs. The mean propeller twist at the 5′-end of each TTTT sequence is quite pronounced (>20°), typical of H33258 bound tightly within the narrow minor groove of many X-ray structures (13–20). However, propeller twist diminishes towards the centre of the sequence. Minor groove width, measured from the Pi to Pj+3 distance (less 5.8 Å), also increases and is widest across the central G-C step, showing a strong correlation with propeller twist. Widening of the groove is evident from the structures shown in Figure 2 with the N-methylpiperazine rings sitting at the end of each TTTT tract close to the TpG step in the wider part of the groove. While the roll angles within the T-tracts are relatively small, large positive roll (>10°) at the TpG and CpA steps, typical of pyrimidine–purine steps (39), are clearly evident.
Figure 3.

Sequence-dependent analysis of propeller twist (a), roll angle (b), minor groove width (Pi–Pj+3 distance minus 5.8 Å) (c), in the 2:1 complex of H33258 with d(CTTTTGCAAAAG)2 (solid lines), and for the free DNA (dotted lines); error bars represent one standard deviation from the mean over the final 500 ps of the 1 ns dynamics simulation.
The structural analysis identifies distinct sequence-dependent features in general agreement with earlier conclusions that the A-tract is not uniform in width but tends to widen from the 5′- towards the 3′-end of Tn sequences (40,41). The N-methylpiperazine ring is accommodated at the end of each of these T-tracts precisely in the region where the groove widens towards the junction with the central GC base pairs. As a consequence we see a distinct orientational preference for H33258 which takes advantage of this sequence-dependent groove widening. The planar phenyl and benzimidazole portions of the molecule are accommodated in the region where the minor groove is at its narrowest at the 5′-end of the TTTT tract, where intermolecular van der Waal’s interactions are maximised. The tight-fit between the walls of the groove and the bound ligand are illustrated for one site in Figure 2.
Induced-fit versus sequence-dependent DNA conformation
The structural features identified in the 2:1 complex appear to account reasonably clearly for the orientational preference observed for H33258. However, to what extent are these structural features a consequence of induced-fit by the bound ligand, reflecting sequence-dependent DNA flexibility, rather than intrinsic sequence-dependent DNA structure? To this end, we have calculated structures of the free DNA using a very similar NOE-restrained MD protocol to examine this question in more detail. A stereo view of five structures is illustrated in Figure 4, showing overlayed snapshots from the rMD simulation taken at 100 ps intervals between 500 and 1000 ps. The RMSD from the mean structure is 0.82 (±0.13) Å. Structural parameters have been calculated as described above; plots of propeller twist, groove width and roll for d(CTTTTGCAAAAG)2 are shown in Figure 3 with the data for the complex. Many of the structural features identified for the 2:1 complex are also apparent for the structure of the free DNA. A superposition of energy minimised DNA structures for the free DNA and complex (Fig. 5) show a relatively small RMSD over all heavy atoms of 1.55 Å. Notably, propeller twist is found to be greatest for A-T base pairs at the 5′-end of the TTTT tract, but this again decreases significantly towards the 3′-end of the tract and across the central GC step. In parallel with this we again see a narrow groove in the A-tracts, which widens considerably towards the 3′-end of the TTTT sequences suggesting that the two parameters are correlated (42). Analysis of sugar puckers shows, with the exception of the more dynamic terminal residues, that the deoxyribose rings adopt C2′-endo/C1′-exo conformations (P = 144–188°), typical of B-DNA. Noticably, T5 and C7 at the TpG (CpA) junctions show a larger standard deviation indicative of a greater degree of dynamic flexibility (see below).
Figure 4.

Stereoviews of five overlaid structures of d(CTTTTGCAAAAG)2 taken at 600, 700, 800, 900 and 1000 ps during the rMD simulation, viewed into the minor groove. RMSD between structures is 0.82 (±0.13) Å.
Figure 5.
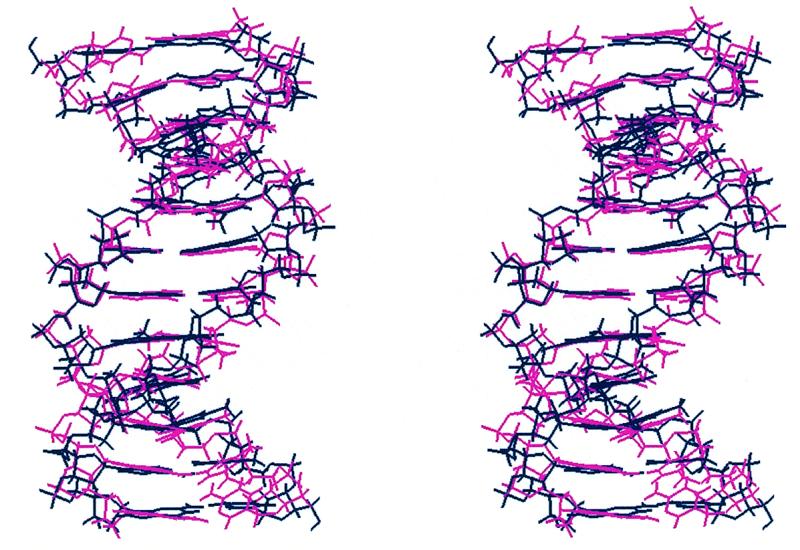
Stereoviews of the energy minimised mean structure of the DNA from simulations of the free DNA (red) and the 2:1 complex (blue) (drug removed for clarity), RMSD over all heavy atoms 1.55 Å.
Helical twist also shows some degree of sequence-dependence. While the two A-tracts have high positive twist, the TpG and CpA steps have lower values in contrast to previous studies where twist is large at these steps (43,44), but in good agreement with H33258 binding across alternating pur–pyr sequences (ATAT) (15). Junctions are clearly visible at the TpG and CpA steps at the centre of the sequence where the roll angles become large and positive. Roll angle shows a similar but opposite trend to helical twist. Roll increases to a maximum at the TpG step, decreases at the neighbour GpC step and again increase to a maximum at the CpA step. These observations are consistent with positive roll at TpG (CpA) steps reducing cross-strand steric clash in the minor groove (39). Helical twist and roll angle appear to be anti-correlated in these simulations, as has been observed for MD simulations of a 30mer duplex d(C6T4A4CGT4A4G6)2 (45). In short, the structural features identified in the complex are clearly evident, if not more pronounced, in the structure of the free DNA suggesting that these are intrinsic sequence-dependent features that largely account for ligand binding in the observed position and orientation.
Evidence for cooperative A-tract stabilisation with dynamic GC junctions
The local structure of DNA can be considered a consequence of either nearest neighbour effects, in which each base pair adopts a conformation dependent only on adjacent interactions, or longer-range co-operative phenomena. The structure of A-tracts is generally regarded to fit into this latter category; as a sequence of successive adenine bases increases in length there is evidence for a co-operative change in helix structure (46–48). Moreover, A-tract sequences when repeated in phase every helical turn are known to lead to intrinsically bent or curved DNA, as evident from gel retardation and cyclisation kinetic measurements (46). A nucleation length of at least four consecutive adenine bases appears to be necessary to induce the ‘A-tract’ structure which is proposed to be stabilised by a minor groove hydration network (49). This solvation network is disrupted by GC-rich sequences, but also TpA but not ApT steps. When An and Tn tracts are interrupted by intervening GC base pairs they act as independent structural elements (46,47), as might be predicted for the sequence d(CTTTTGCAAAAG)2. We have investigated, from a dynamic perspective, to what extent the formation of co-operative A-tract structure might be significant in the present context of minor groove recognition, and to what extent the junctions with the central GC base pairs identified in the structural analysis disrupt this structure.
Earlier studies have established from measurements of imino proton exchange rates that AT base pairs within An tracts (n ≥ 4) show anomalously long lifetimes reflecting A-tract stabilisation (50). The imino proton spectrum of d(CTTTTGCAAAAG)2 was examined at various concentrations of ammonia, which is added as an exchange catalyst (47,50,51). The imino proton exchange times τex measured from the excess line width in the presence and absence of ammonia provides a direct measure of the lifetime of the base paired (closed) state. When τex is extrapolated to infinite catalyst concentration (1/[NH3] = 0), base pair opening becomes the rate limiting step for proton exchange (51). Exchange times (τex) versus 1/[NH3] are plotted in Figure 6 from data at 15°C. Imino protons of C1-G12 and T2-A11 exchange rapidly as a consequence of end fraying effects, resulting in base pair lifetimes too short to measure (<1 ms) even at 5°C. The lifetime for T3-A10 is ~4 ms, typical of AT base pairs in mixed sequence DNA and, in the present context, may also be influenced by end effects. In contrast, the lifetime of T4-A9 is anomalously long (~23 ms) and similar to that observed for the central AT base pair of a number of A-tract sequences (47), indicative of enhanced stability. The lifetime of the T5-A8 base pair, by comparison, is essentially normal (~6 ms) indicating a breakdown of A-tract stabilisation at the GC junction. The central GC base pairs are much more stable (τex ~ 43 ms), consistent with previously observed lifetimes (50). The data suggest that d(CTTTTGCAAAAG)2 does have some of the features of co-operative A-tract structures previously identified (47,50); the distinct junction at the TpG (CpA) step, identified in the structural analysis, is supported by our kinetic measurements of base pair lifetimes. Breakdown of A-tract structure, and greater intrinsic DNA flexibility, may be important factors in site-specific recognition, and, in the present context orientational specificity, by minor groove binding agents.
Figure 6.

Plot of imino proton exchange time τex (ms) versus 1/[NH3] (M–1) for the base pairs of d(CTTTTGCAAAAG)2 at 15°C. Extrapolation to 1/[NH3] = 0 provides a measure of the base pair lifetime where imino proton exchange becomes limited only by base pair opening.
Inversion of A-tracts destroys orientational specificity
In the final analysis, we have carried out complementary studies of the dodecamer duplex d(GAAAAGCTTTTC)2 in which the orientation of the two A-tracts has been inverted while simultaneously eliminating the TpG junctions at the ends of these tracts. Analogous NMR titration studies show that H33258 does not bind with the same orientational specificity seen with d(CTTTTGCAAAAG)2. At a ratio of drug to duplex of 2:1, we see evidence for multiple bound species in solution consistent with the drug binding in a number of different orientations. The complexity of the spectrum does not permit us to resolve the mixture of bound species present. These observations seem to add weight to our conclusion that the TpG junctions strongly influence the orientational preference, while an ApG junction does not result in distinct structural features capable of influencing minor groove recognition.
SUPPLEMENTARY MATERIAL
See Supplementary Material available at NAR Online.
Acknowledgments
ACKNOWLEDGEMENTS
We thank John Keyte in the School of Biomedical Sciences, University of Nottingham, for oligonucleotide synthesis, and Huw Williams for advice with computational aspects of the work. We thank EPSRC for a studentship to E.G., and AstraZeneca Pharmaceuticals, the Royal Society and the University of Nottingham, Department of Chemistry for financial support.
PDB accession no. 1qsx
REFERENCES
- 1.Portugal J. and Waring,M.J. (1988) Biochim. Biophys. Acta, 949, 158–168. [DOI] [PubMed] [Google Scholar]
- 2.Harshman K.D. and Dervan,P.B. (1985) Nucleic Acids Res., 13, 4825–4835. [DOI] [PMC free article] [PubMed] [Google Scholar]
- 3.Abu-Daya A., Brown,P.M. and Fox,K.R. (1995) Nucleic Acids Res., 23, 3385–3392. [DOI] [PMC free article] [PubMed] [Google Scholar]
- 4.Bell C.A., Dykstra,C.C., Naiman,N.A., Cory,M., Fairley,T.A. and Tidwell,R.R. (1993) Antimicrob. Agents Chemother., 37, 2668–2673. [DOI] [PMC free article] [PubMed] [Google Scholar]
- 5.Tidwell R.R., Jones,S.K., Naiman,N.A., Berger,L.C., Brake,W.B., Dykstra,C.C. and Hall,J.E. (1993) Antimicrob. Agents Chemother., 37, 1713–1716. [DOI] [PMC free article] [PubMed] [Google Scholar]
- 6.Fairley T.A., Tidwell,R.R., Donkor,I., Naiman,N.A., Ohemeng,K.A., Lombardy,R., Bentley,J.A. and Cory,M. (1993) J. Med. Chem., 36, 1746–1753. [DOI] [PubMed] [Google Scholar]
- 7.Chen A.Y., Chiang,Y., Gatto,B. and Lui,L.F. (1993) Proc. Natl Acad. Sci. USA, 90, 8131–8135. [DOI] [PMC free article] [PubMed] [Google Scholar]
- 8.Patel S.R., Kvols,L.K., Rubin,J., O’Connell,M.J., Edmonson,J.H., Ames,M.M. and Kovach,J.S. (1991) Invest. New Drugs, 9, 53–57. [DOI] [PubMed] [Google Scholar]
- 9.Clark G.R., Squire,C.J., Gray,E.J., Leupin,W. and Neidle,S. (1996) Nucleic Acids Res., 24, 4882–4886. [DOI] [PMC free article] [PubMed] [Google Scholar]
- 10.Haq I., Ladbury,J.E., Chowdhry,B.Z., Jenkins,T.C. and Chaires,J.B. (1997) J. Mol. Biol., 271, 244–257. [DOI] [PubMed] [Google Scholar]
- 11.Loontiens F.G., McLaughlin,L.W., Diekmann,S. and Clegg,R.M. (1991) Biochemistry, 30, 182–189. [DOI] [PubMed] [Google Scholar]
- 12.Bostock-Smith C.E. and Searle,M.S. (1999) Nucleic Acids Res., 27, 1619–1624. [DOI] [PMC free article] [PubMed] [Google Scholar]
- 13.Pjura P.E., Grzeskowiak,K. and Dickerson,R.E. (1987) J. Mol. Biol., 197, 257–271. [DOI] [PubMed] [Google Scholar]
- 14.Teng M.-K., Usman,N., Frederick,C.A. and Wang,A.H.-J. (1988) Nucleic Acids Res., 16, 2671–2690. [DOI] [PMC free article] [PubMed] [Google Scholar]
- 15.Carrondo M.A., Coll,M., Aymami,J., Wang,A.H.-J., van der Marel,G.A., van Boom,J.H. and Rich,A. (1989) Biochemistry, 28, 7849–7859. [DOI] [PubMed] [Google Scholar]
- 16.Quintana J.R., Lipanov,A.A. and Dickerson,R.E. (1991) Biochemistry, 30, 10294–10306. [DOI] [PubMed] [Google Scholar]
- 17.Vega M.C., Garcia Saez,I., Aymami,J., Eritja,R., van der Marel,G.A., van Boom,J.H., Rich,A. and Coll,M. (1994) Eur. J. Biochem., 222, 721–726. [DOI] [PubMed] [Google Scholar]
- 18.Clark G.R., Boykin,D.W., Czarny,A. and Neidle,S. (1997) Nucleic Acids Res., 25, 1510–1515. [DOI] [PMC free article] [PubMed] [Google Scholar]
- 19.Clark G.R., Gray,E.J., Neidle,S., Li.,Y.-H. and Leupin,W. (1996) Biochemistry, 35, 13745–13752. [DOI] [PubMed] [Google Scholar]
- 20.Spink N., Brown,D.G., Skelly,J.V. and Neidle,S. (1994) Nucleic Acids Res., 22, 1607–1612. [DOI] [PMC free article] [PubMed] [Google Scholar]
- 21.Searle M.S. and Embrey,K.J. (1990) Nucleic Acids Res., 18, 3753–3762. [DOI] [PMC free article] [PubMed] [Google Scholar]
- 22.Parkinson J.A., Barber,J., Douglas,K.T., Rosamond,J. and Sharples,D. (1990) Biochemistry, 29, 10181–10190. [DOI] [PubMed] [Google Scholar]
- 23.Embrey K.J., Searle,M.S. and Craik,D.J. (1993) Eur. J. Biochem., 211, 437–447. [DOI] [PubMed] [Google Scholar]
- 24.Fede A., Labhardt,A., Bannwarth,W. and Leupin,W. (1991) Biochemistry, 30, 11377–11388. [DOI] [PubMed] [Google Scholar]
- 25.Fede A., Billeter,M., Leupin,W. and Wuthrich,K. (1993) Structure, 1, 177–186. [DOI] [PubMed] [Google Scholar]
- 26.Bostock-Smith C.E., Laughton,C.A. and Searle,M.S. (1998) Nucleic Acids Res., 26, 1660–1667. [DOI] [PMC free article] [PubMed] [Google Scholar]
- 27.Hud N.V., Sklenar,V. and Feigon,J. (1999) J. Mol. Biol., 286, 651–660. [DOI] [PubMed] [Google Scholar]
- 28.Hamden I.I., Skellern,G.G. and Waigh,R.D. (1998) Nucleic Acids Res., 26, 3053–3058. [DOI] [PMC free article] [PubMed] [Google Scholar]
- 29.Pelton J.G. and Wemmer,D.E. (1989) Proc. Natl Acad. Sci. USA, 86, 5723–5727. [DOI] [PMC free article] [PubMed] [Google Scholar]
- 30.Wemmer D.E. and Dervan,P.B. (1997) Curr. Opin. Struct. Biol., 7, 355. [DOI] [PubMed] [Google Scholar]
- 31.Cheatham P.E.,III and Kollman,P.A. (1996) J. Mol. Biol., 259, 434–444. [DOI] [PubMed] [Google Scholar]
- 32.York D.M., Yang,W., Lee,H., Darden,T.A. and Pederson,L.G. (1995) J. Am. Chem. Soc., 117, 5001–5002. [Google Scholar]
- 33.Baleja J.D., Moult,J. and Sykes,B.D. (1990) J. Magn. Reson., 87, 375–384. [Google Scholar]
- 34.Pearlman D.A., Case,D.A., Caldwell,J.W., Ross,W.S., Cheatham,T.E.,III, Ferguson,D.M., Seibel,G.L., Singh,U.C., Weiner,P.K. and Kollman,P.A. (1995) AMBER 4.1, University of California, San Francisco, CA.
- 35.Bostock-Smith C.E., Laughton,C.A. and Searle,M.S. (1999) Biochem. J., 342, 125–132. [PMC free article] [PubMed] [Google Scholar]
- 36. Guassian 98, Gaussian Inc., Pittsburgh, USA.
- 37.Koradi R., Billeter,M. and Wüthrich,K. (1996) J. Mol. Graphics, 14, 51–55. [DOI] [PubMed] [Google Scholar]
- 38.Lavery R. and Sklenar,H. (1989) J. Biomol. Struct. Dyn., 6, 63–91. [DOI] [PubMed] [Google Scholar]
- 39.Hunter C.A. (1993) J. Mol. Biol., 230, 1025–1054. [DOI] [PubMed] [Google Scholar]
- 40.Burkoff A.M. and Tulius,T.D. (1988) Nature, 331, 455–456.3340190 [Google Scholar]
- 41.Katahira M., Sugeta,H., Kyogoku,Y., Fuji,S., Fujisawa,R. and Tomita,K.-I. (1988) Nucleic Acids Res., 17, 8619–8632. [DOI] [PMC free article] [PubMed] [Google Scholar]
- 42.Nelson H.M.C., Finch,J.T., Luis,B.F. and Klug,A. (1987) Nature, 330, 221–226. [DOI] [PubMed] [Google Scholar]
- 43.Dornberger U., Flemming,J. and Fritzsche,H. (1998) J. Mol. Biol., 284, 1453–1463. [DOI] [PubMed] [Google Scholar]
- 44.Baleja J.P., Germann,M.W., van de Sande,J.H. and Sykes,B.D. (1990) J. Mol. Biol., 215, 411–428. [DOI] [PubMed] [Google Scholar]
- 45.Sprous D., Young,M.A. and Beveridge,D.L. (1999) J. Mol. Biol., 285, 1623–1632. [DOI] [PubMed] [Google Scholar]
- 46.Crothers D.M., Haran,T.E. and Nadeau,J.G. (1990) J. Biol. Chem., 265, 7093–7096. [PubMed] [Google Scholar]
- 47.Leroy J.-L., Kochoyan,M., Huynh-Dinh,T. and Gueron,M. (1988) J. Mol. Biol., 200, 223–238. [DOI] [PubMed] [Google Scholar]
- 48.Nadeau J.G. and Crothers,D.M. (1989) Proc. Natl Acad. Sci. USA, 86, 2622–2626. [DOI] [PMC free article] [PubMed] [Google Scholar]
- 49.Fratini A.V., Kopka,M.L., Drew,H.R. and Dickerson,R.E. (1982) J. Biol. Chem., 257, 14686–14707. [PubMed] [Google Scholar]
- 50.Leroy J.-L., Charretier,E., Kochoyan,M. and Gueron,M. (1988) Biochemistry, 27, 8894–8898. [DOI] [PubMed] [Google Scholar]
- 51.Gueron M., Kochoyan,M. and Leroy,J.-L. (1987) Nature, 328, 89–92. [DOI] [PubMed] [Google Scholar]
Associated Data
This section collects any data citations, data availability statements, or supplementary materials included in this article.