Abstract
Prior work suggests opioid prescribing cap laws are not associated with changes in opioid prescribing among patients with chronic pain. It is unknown how these effects differ by provider specialty, provider opioid prescribing volume, or patient insurer. This study assessed effects of state opioid prescribing cap laws on opioid prescribing among providers of patients with chronic non-cancer pain, by high volume prescribing, provider specialty, and patient insurer. We identified 224,290 providers of patients with low back pain, fibromyalgia, or headache, from the IQVIA administrative database. Using a difference-in-differences approach, we examined impacts of opioid prescribing cap laws implemented between 2016-2018 on the annual proportion of a provider’s patient panel who received any opioid prescription, as well as on dose and duration of opioid prescriptions. For providers overall, high volume prescribers, all specialties, and patient insurance categories, prescribing cap laws were associated with non-significant changes of less than 1.0, 1.5, and 3.5 percentage points in the proportion of chronic non-cancer patients receiving any opioid prescription, a prescription with ≥7 days’ supply, or with ≥50 morphine milligram equivalents (MME)/day, per year, respectively. There were two exceptions with high dose prescribing: prescribing cap laws were associated with a 1.5 percentage point increase in the proportion of high-volume prescribers’ patient panel receiving an opioid prescription with ≥ 50 MME/day, and a 3.0 percentage point decrease in the same measure among surgeons. Among nearly all measured subgroups of providers and patient insurers, opioid prescribing cap laws were not associated with changes in opioid prescribing.
Keywords: opioid prescribing, state policy, opioid prescribing cap laws, chronic non-cancer pain, prescribing practices
Introduction
Opioid prescribing rates have declined in recent years, but remain substantially higher today than in the early 2000s.1 While no longer considered to be first-line treatment in most cases, opioids continue to be commonly prescribed for chronic non-cancer pain, including conditions such as low back pain, headache, and fibromyalgia.2 Because of the risks of opioid misuse and overdose associated with high dose and long duration opioid prescriptions,2–4 clinical guidelines highlight that when prescription opioids are deemed clinically appropriate, lower dose and shorter duration prescriptions should be used.2,4–8 Opioid prescribing practices vary across provider and patient populations.9–12 Physician specialties including family medicine, internal medicine, and pain medicine account for a high proportion of opioid prescribing.11 The majority of all opioid analgesic medications are issued by a small proportion of high-volume prescribers.12 In addition, persons insured by Medicaid experience increased rates of high-risk opioid prescribing (e.g., higher dosage or possession of more than one opioid prescription on a given day),13 and Medicaid beneficiaries are at increased risk for overdose involving prescription opioids relative to other insured groups.9,10
Over the past decade, many states have implemented policies aimed at reducing harms associated with inappropriate opioid prescribing.14 Of interest here, by the end of 2019, 39 states had adopted laws that limit the dose and/or duration of certain opioid analgesic prescriptions.15 Most of these state opioid prescribing cap laws are limited to opioid analgesic medications prescribed for acute pain.14 However, spillover effects on chronic non-cancer pain treatment are possible because of the lack of clear differentiation between acute and chronic pain,16,17 and concerns exist about these laws leading to abrupt discontinuation or hurried tapering without adequate substitution of other guideline-concordant non-opioid pharmacological and non-pharmacological treatments.16
Recent work examining the effects of these laws on opioid prescribing and receipt of other guideline-concordant treatments among people diagnosed with chronic non-cancer pain conditions found that prescribing cap laws were not associated with changes in opioid analgesic prescribing or the receipt of other non-opioid treatments for chronic pain.18 However, this study focused on patients with commercial insurance. Given differential opioid prescribing patterns by provider characteristics12,19 and for persons with different insurance types,9 it is possible that these laws have differing effects based on provider- and patient-level factors. The objective of the current study was to assess the effects of state opioid prescribing cap laws on opioid prescribing for chronic non-cancer pain patients among high-volume prescribers, across provider specialties, and by patient insurer.
Methods
Design
This study used IQVIA administrative claims data. This data includes both longitudinal prescription and medical claims from 2010 to 2018. IQVIA pharmacy claims capture 90% of all prescriptions dispensed from US retail pharmacies. The medical claims data includes services delivered by about 75% of licensed physicians in the US.20 This data contains information on patient diagnoses and services provided in outpatient settings. This database is all payer, including services and prescriptions paid by private health insurance, Medicare, Medicaid, and cash. Data for this study includes all outpatient and pharmaceutical claims for all patients with at least one diagnosis of headache, fibromyalgia, or low back pain between January 2008 to December 2018. This study was deemed exempt by the institutional review board of the Johns Hopkins Bloomberg School of Public Health.
The study sample included providers who treated at least one patient aged 18 years or older with one or more of three chronic non-cancer pain conditions – headache, fibromyalgia, or low back pain – at any point during the 2010-2018 study period and who were present in the data for the entire period, with a total sample size of 224,290 providers. In order to be included in a provider’s patient panel, patients had to have at least two separate claims with a headache, fibromyalgia, or low back pain diagnosis in a given year (Appendix B). We focused on these three conditions because they are among the most common chronic non-cancer pain conditions and because opioids were historically considered acceptable first-line treatment before recent guideline changes.21 Patients were excluded if they had a cancer diagnosis in a given year.
We used previously published data on opioid prescribing cap laws collected by our study team.15,18,22 Data were systematically collected and analyzed by two public health lawyers using standard legal mapping and legislative history techniques.23 States and information about their laws, including implementation dates and provisions are included in Appendix A. Detailed information about the legal research methods is published elsewhere.14
Our analysis included the 24 states that implemented opioid prescribing cap laws between July 1, 2016 and June 30, 2018, and the 24 states plus the District of Columbia (DC) without a prescribing cap law as of June 30, 2018. Illinois and Massachusetts were excluded, since both implemented prescribing cap laws before July, 2016. The adapted difference-in-differences modeling approach used for this study, described in more detail below, produces unstable estimates when the number of geographic units implementing a policy at a given time is less than five.24 Consistent with prior work,18,22,25,26 we coded year of implementation as the first calendar year in which the state had an opioid prescribing cap law in place for six or more months. Twelve states were coded as implementing a prescribing cap law in 2017 (CT, DE, KY, MD, ME, NH, NJ, NY, PA, RI, UT, VA) and 12 in 2018 (AK, AZ, CO, HI, IN, LA, NC, NV, OH, SC, VT, WV). Our control pool included all states and DC without an opioid prescribing cap law prior to July 1, 2018 (AL, AR, CA, DC, FL, GA, IA, ID, KS, MI, MN, MO, MS, MT, ND, NE, NM, OK, OR, SD, TN, TX, WA, WI, WY).
Opioid prescribing outcomes were calculated at the provider-level and then aggregated to the state-year level. We constructed three measures of opioid prescribing. The first was the proportion of a provider’s chronic non-cancer pain patient panel who received an opioid prescription in a given year. In line with clinical guidance suggestive of high risk prescribing,2 we then identified the annual proportion of providers’ chronic non-cancer pain patient panels with an opioid prescription with ≥ 7 days’ supply, as well as the proportion who received an opioid prescription with ≥ 50 morphine milligram equivalents (MME) per day in a given year. We also examined the mean days’ supply and the mean MME per day, per provider’s patient panel prescribed opioids, per year. Opioid prescriptions were identified using the CDC Opioid and Oral MME Conversion file.27 Measures excluded opioid agonist medications that are used primarily to treat opioid use disorder (OUD): Buprenorphine-Naloxone (Bunavail, Suboxone, Zubsolv) and two Buprenorphine products (Probuphine and Subutex). We included opioid medications used to treat both pain and OUD.
Statistical Analysis
We used an adapted difference-in-differences design developed by Callaway and Sant’Anna that allows for treatment effect heterogeneity and dynamic treatment effects over time in study settings such as ours where there is staggered policy implementation.24 With this method, we estimated the average treatment effect for the treated group (ATT). The ATT is interpreted as the average change in each opioid prescribing outcome attributable to the law. The overall effect represents the average effect of the law across the post-law period. With this approach, standard errors are clustered by state. Additionally, we examined differences in pre-law trends in outcomes between states with and without a prescribing cap law. If there are differences in pre-law trends, this may indicate a violation of the parallel trends assumption underlying difference-in-differences.24
Primary analyses used balanced models where all treatment states contributed the same number of pre- and post-law years of data, with comparison states contributing data for the same years. With our study period (2010-2018), each treatment state cohort (2017 and 2018) could contribute 7 years of pre-law data and 1 year of post-law data. Because it is possible that effects of opioid prescribing cap laws on opioid prescribing may vary by prescriber factors or based on a patient’s insurer, we conducted models separately for the following: 1) all providers in our sample; 2) providers considered to be a high-volume prescriber, demarcated as being in the top 5% of total MME prescribed in a given year;12 3) by provider specialty: primary care, emergency medicine, surgery, pain (i.e., “pain” in specialty description), and anesthesiology/neurology/physical medicine and rehabilitation (specialties that commonly treat people with chronic non-cancer pain);28 4) each patient insurance type, including private, Medicare, Medicaid, and cash payment. Main models were unadjusted.
We conducted sensitivity analyses with models stratified by each of the three chronic non-cancer pain conditions. We also included models adjusted for patient age, sex, substance use disorder and/or mental illness comorbidity, and provider specialty (only in models that did not stratify by specialty). Additionally, we conducted cohort-specific analyses, for the two cohorts of states that implemented laws in 2017 and 2018, respectively, that allowed us to examine outcomes two years post-law for states that implemented a law in 2017. We also conducted sensitivity analyses with two alternative pools of comparison states: states that have never gone on to implement an opioid prescribing cap law as of September 2022 and those that implemented a prescribing cap law between July 2018-September 2022 (after the end of the study period). Lastly, we stratified unadjusted models by laws that do and do not include a professional judgement exemption. We considered controlling for other state opioid prescribing laws including pill mill laws and prescription drug monitoring program (PDMP) laws, but there was insufficient variation in these laws among states in the post-law period: no states implemented pill mill laws in our study period and all but four (HI, MO, NC, and SC) treatment states in this study had mandatory PDMP laws prior to 2017. All analyses were conducted with the “did” package designed by Callaway and Sant’Anna29 in R Version 4.0.3.
Results
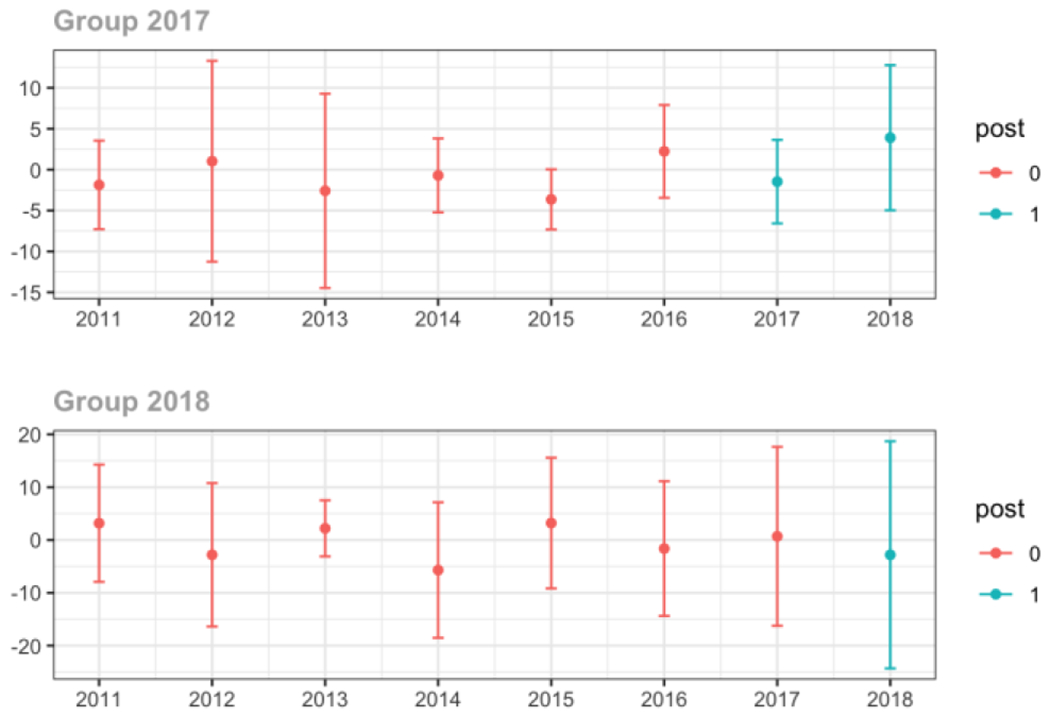
Pre-law characteristics of the 24 states with a prescribing cap law and 25 without a law are presented in Table 1. There were several small in magnitude, but statistically significant differences between treatment and comparison states. Relative to comparison states, treatment states had slightly lower annual proportion of patient panels prescribed an opioid (treated=11.2, comparison=13.3), but higher proportion of patients who received an opioid with days’ supply ≥ 7 days in a given year (treated=57.1, comparison=55.4) and average days’ supply of opioid prescriptions (treated=13.1, comparison=12.6). Demographically, there were slight differences between states: proportion female (treated=64.7, comparison=65.1), mean age (treated=53.6, comparison=54.3), proportion with a substance use disorder (treated=2.4, comparison=1.9), and insurer type (Table 1). While we did observe slight differences in pre-period characteristics, we did not observe any differences in pre-period trends in outcomes for the treatment and comparison states (Appendix C). The lack of differential pre-period trends provides confidence that the parallel counterfactual trends assumption was not likely violated.
Table 1.
Descriptive characteristics of states with and without opioid prescribing cap laws, prior law implementation
| States with an prescribing cap law (N=24a) | States without a prescribing cap law (N=25b) | |
|---|---|---|
| State patient demographics | ||
|
| ||
| Proportion female | 64.7 | 65.1 |
| Mean age | 53.6 | 54.3 |
| Proportion with any mental illness | 7.3 | 7.4 |
| Proportion with any substance use disorder | 2.4 | 1.9 |
| Proportion with private insurance | 62.5 | 63.1 |
| Proportion with Medicare | 19.8 | 22.3 |
| Proportion with Medicaid | 13.6 | 10.0 |
| Proportion with cash payment | 0.7 | 1.1 |
|
| ||
| Opioid analgesic prescriptions | ||
|
| ||
| Proportion of patient panel with at least one opioid rx | 11.2 | 13.3 |
| Proportion of patient panel with receipt of opioid rx with ≥ 7 days’ supply | 57.1 | 55.4 |
| Proportion of patient panel with receipt of opioid rx with MME ≥ 50 per day | 26.1 | 26.7 |
| Days’ supply of opioid prescriptions, per patient panel prescribed opioids | 13.1 | 12.6 |
| Mean Morphine Equivalent (MME) per day per patient panel prescribed opioids | 42.5 | 42.1 |
Bold indicates P<0.05. Statistical significance was assessed using t-tests comparing states with versus without opioid prescribing cap laws.
CT, NY, ME, NH, PA, VA, RI, DE, UT, NJ, MD, KY (implementation in 2017); HI, IN, AK, VT, LA, OH, NC, NV, AZ, SC, CO, WV (2018);
DC, MN, WY, TX, MT, AL, CA, GA, IA, ID, KS, ND, NE, NM, OR, SD, WI, FL, MI, TN, AR, MO, MS, OK, WA were in the comparison state pool and did not have a cap law during the study period. Of these twelve states ( FL, MI, TN, AR, MO, MS, OK, WA, MN, MT, TX, WY) had implementation dates ≥ July 2018. Two states (IL, MA) were excluded from analyses because implementation dates were prior to 2017.
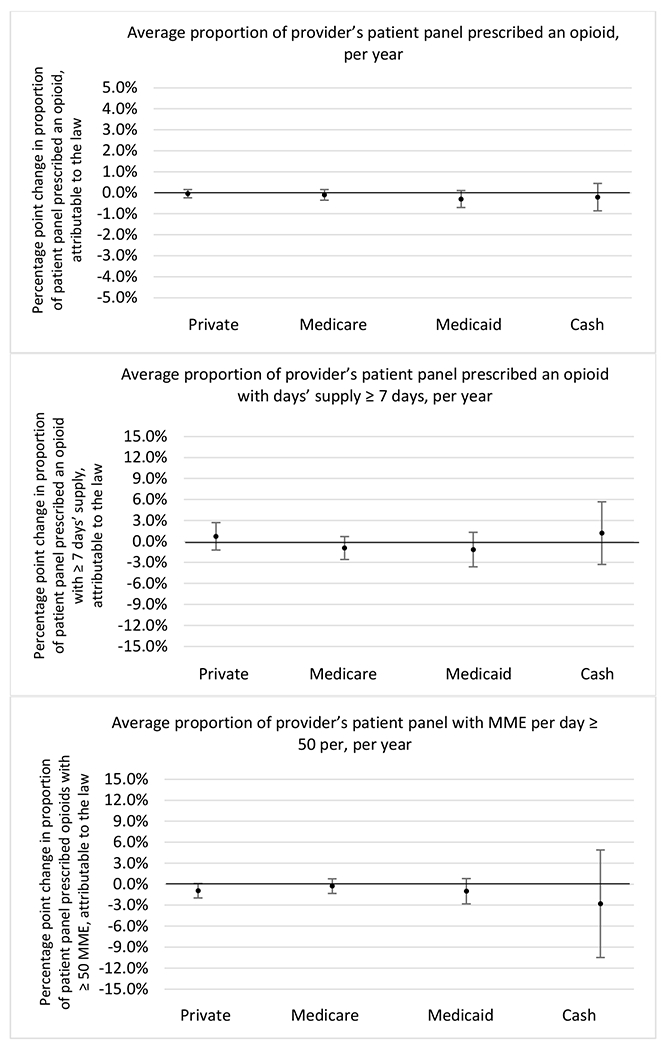
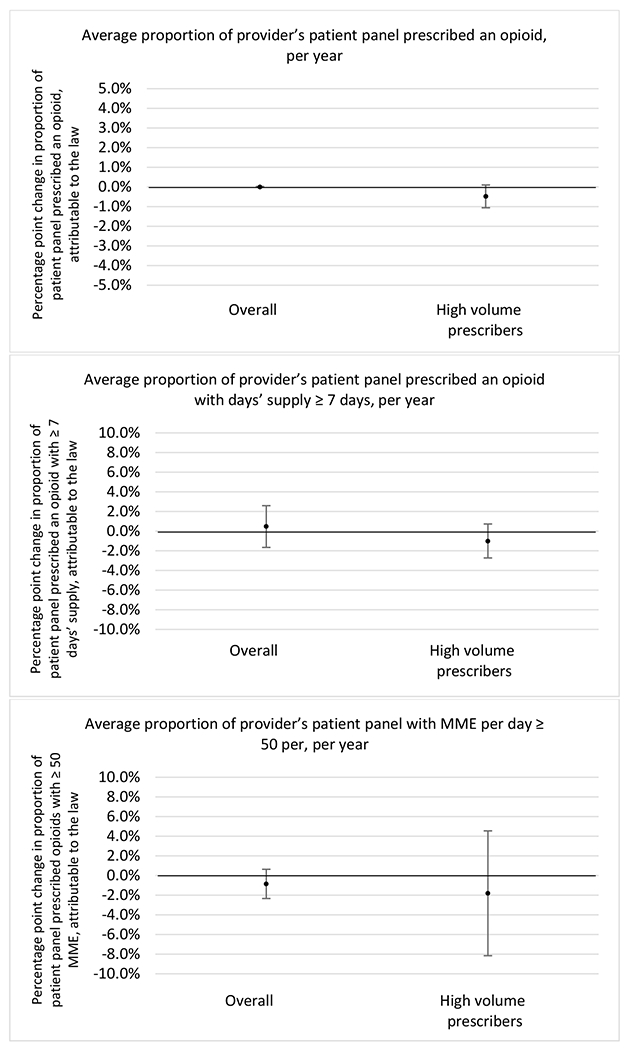
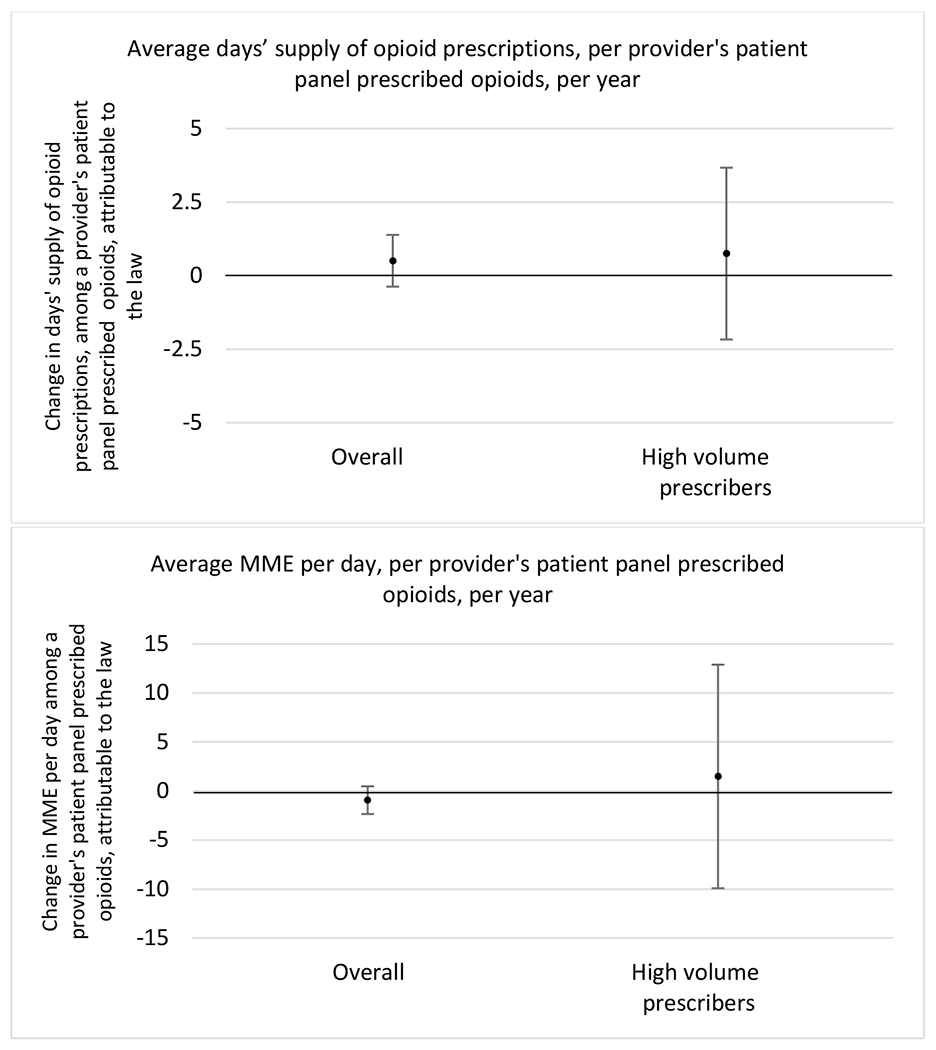
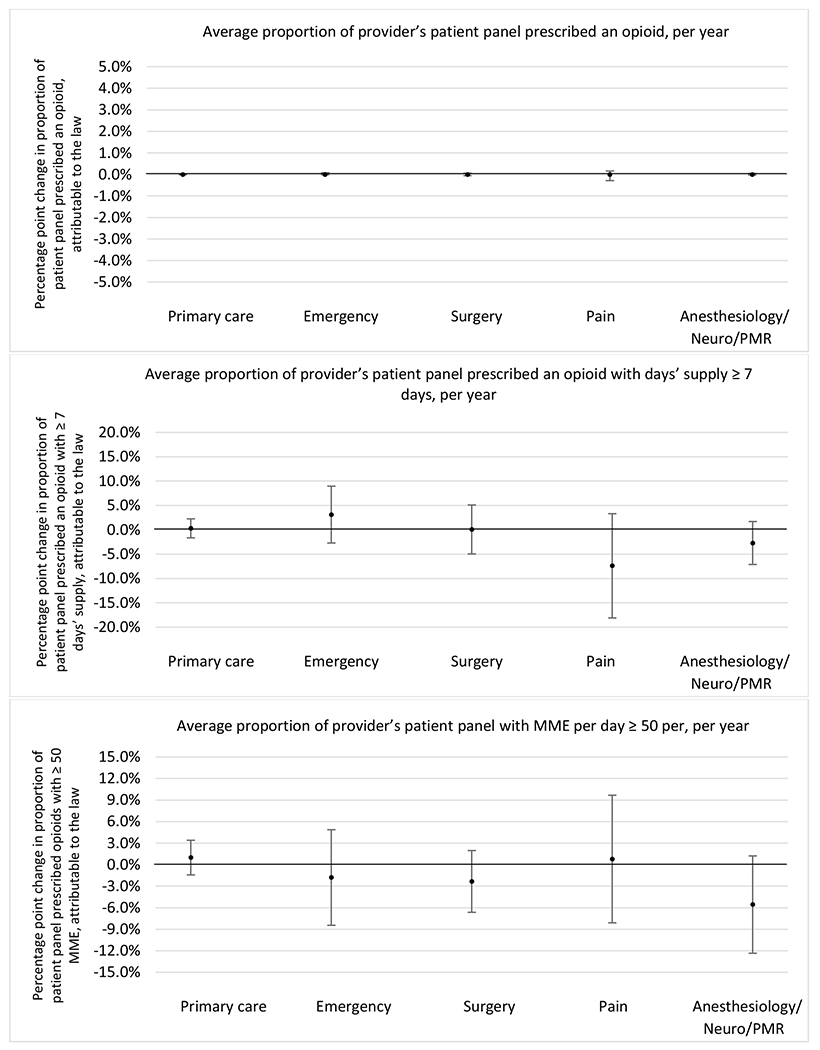
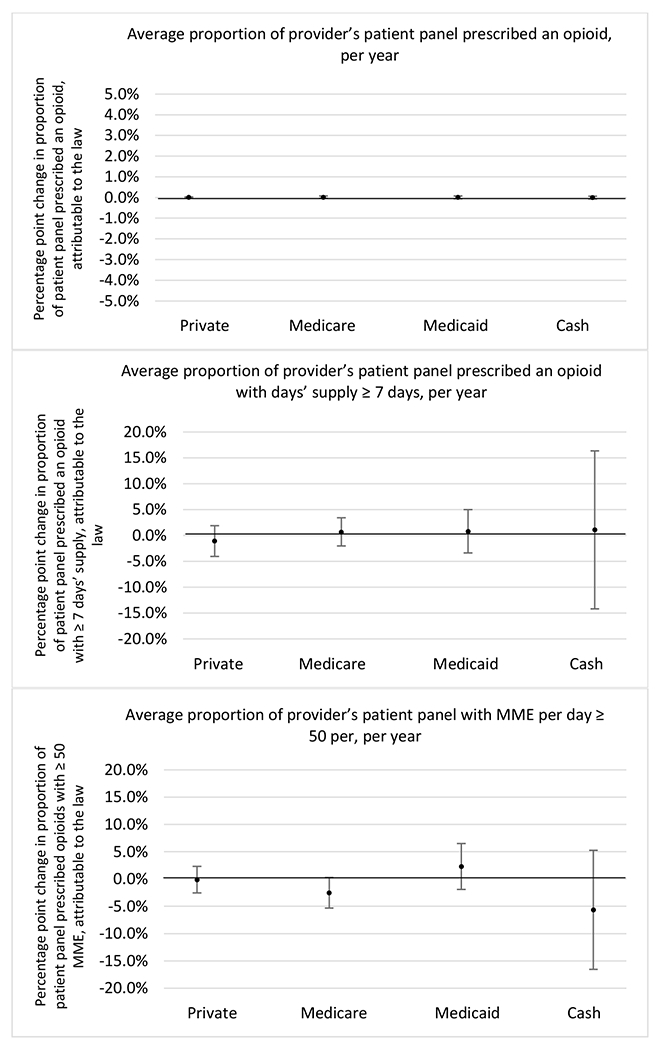
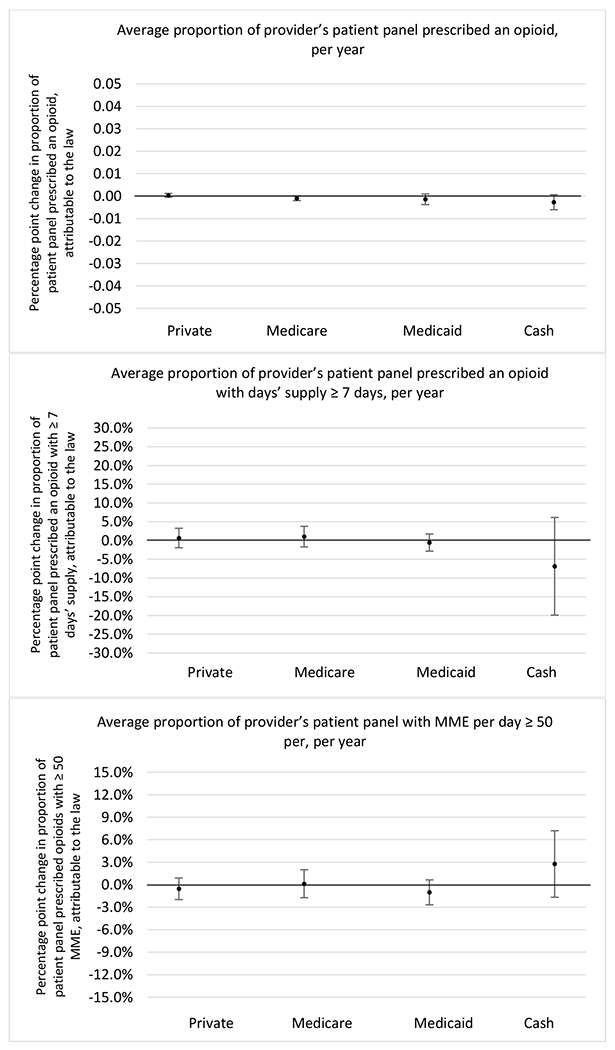
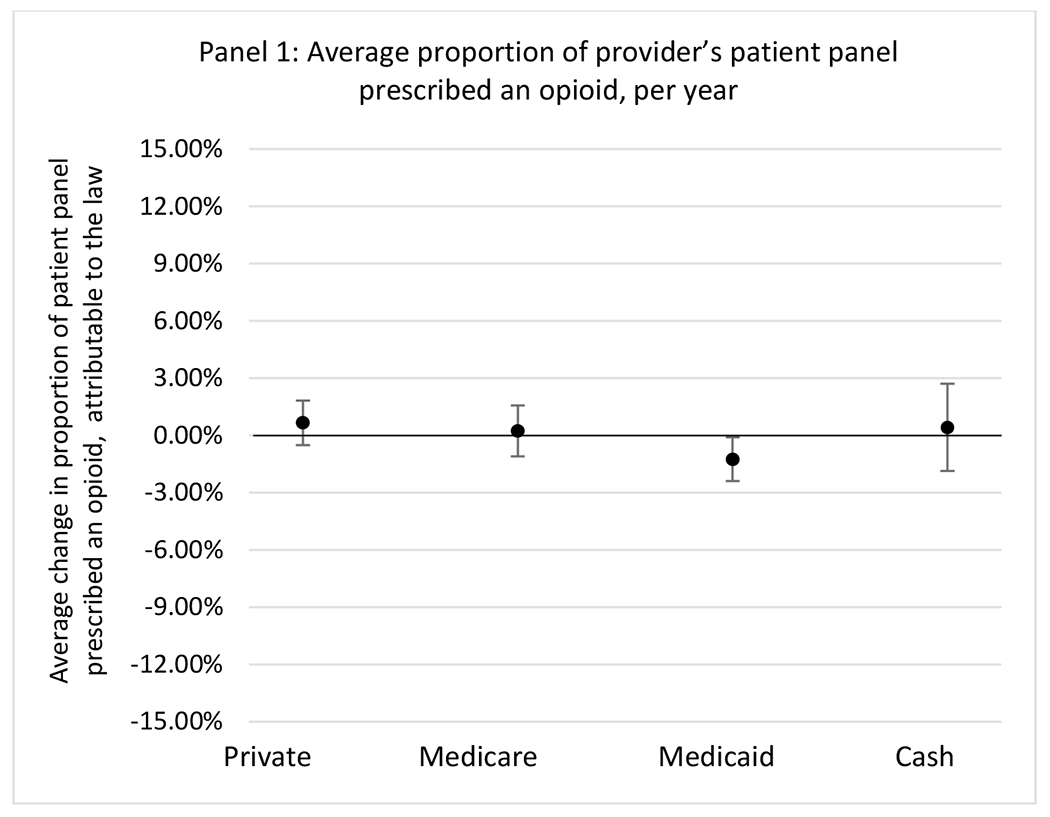
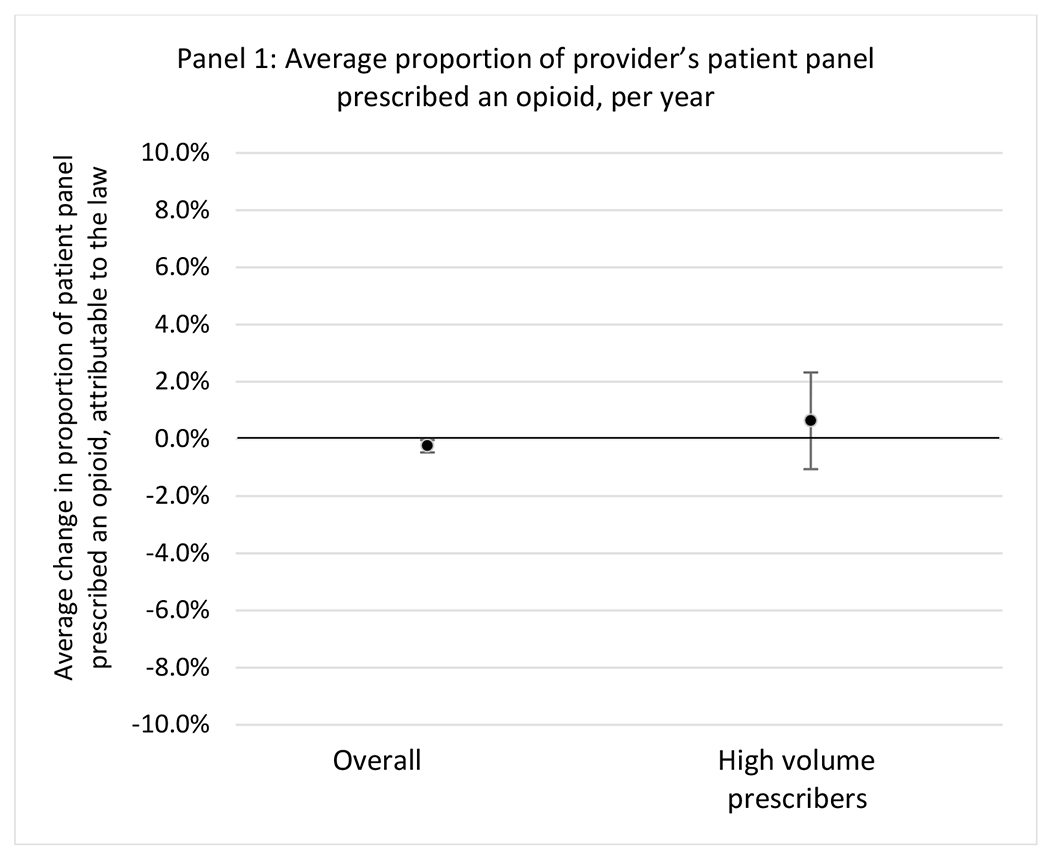
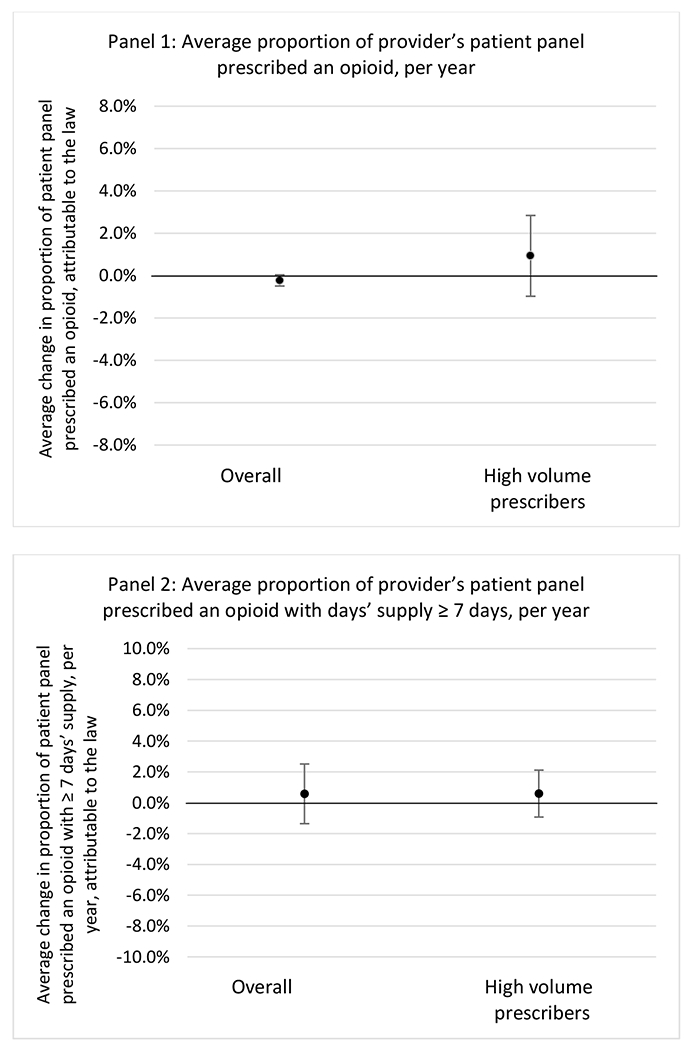
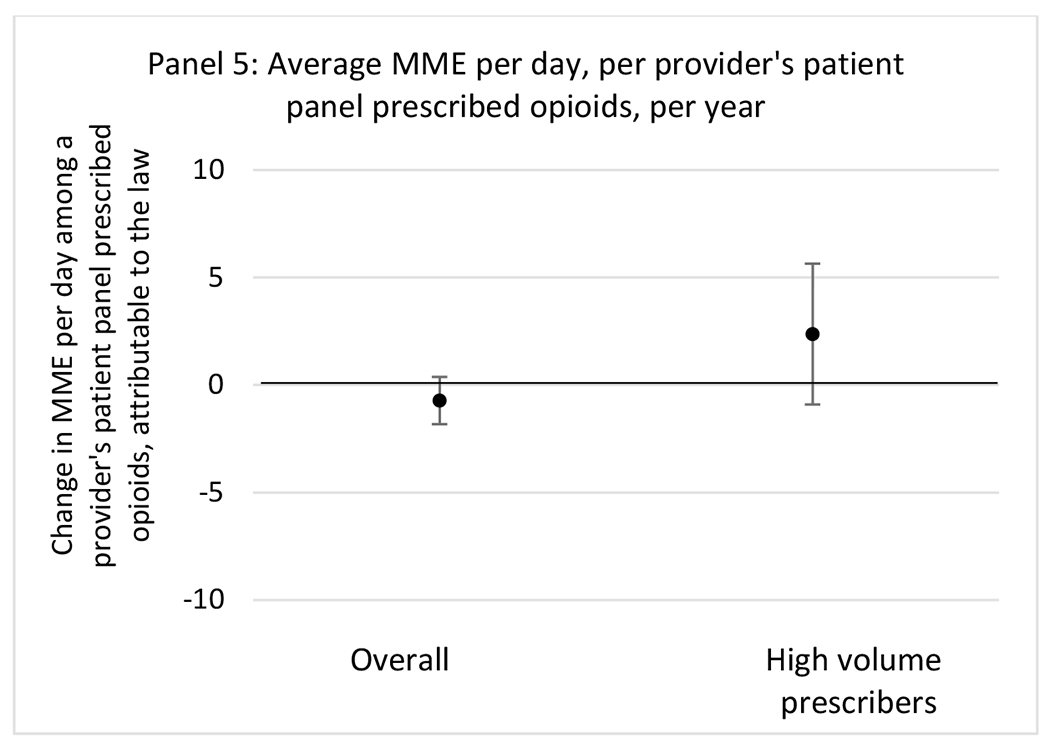
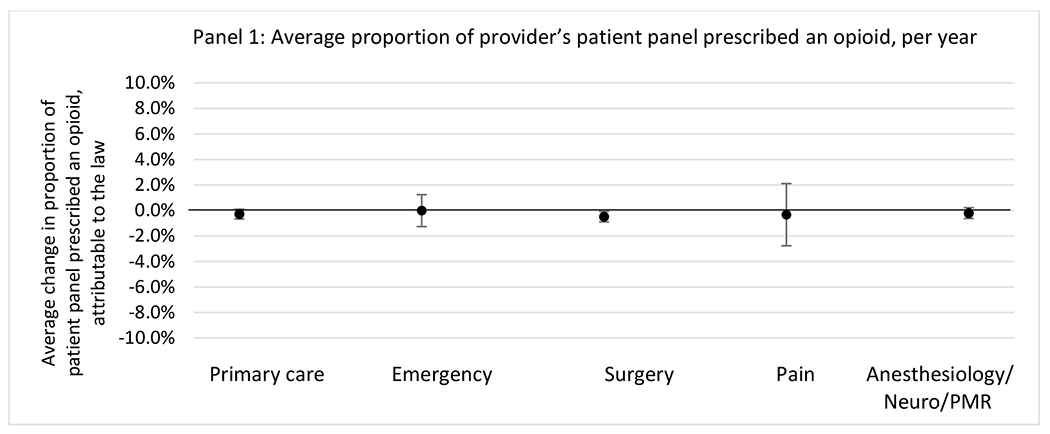
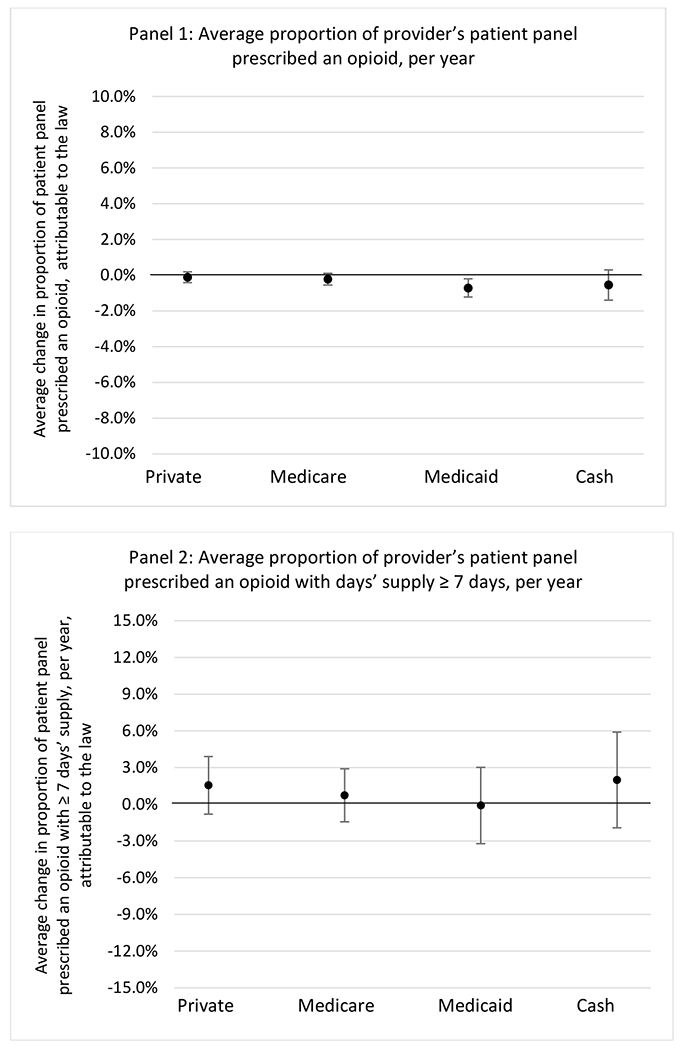
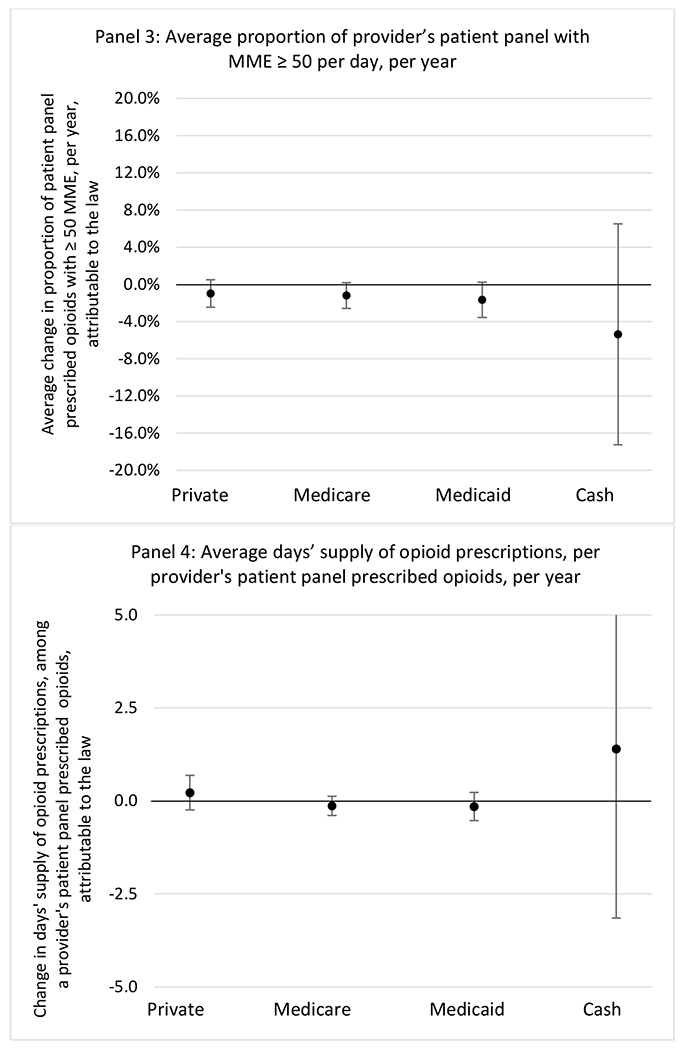
State opioid prescribing cap laws were associated with small-in-magnitude or non-significant changes in opioid prescribing outcomes for all of the samples examined. Across all samples, opioid prescribing cap laws were associated with a change of less than 1 percentage point in the annual proportion of a provider’s panel of chronic non-cancer pain patients who received an opioid prescription (Figures 1–3). Changes ranged from 0.60 (95% Confidence Interval (CI) −1.28, 0.07) percentage point reduction in the annual proportion of a provider’s patient panel prescribed an opioid attributable to the prescribing cap law among providers of patients who were primarily cash payers to 0.69 (95% CI −0.71, 2.09) percentage point increase attributable to the law among high-volume opioid prescribers.
Figure 1.
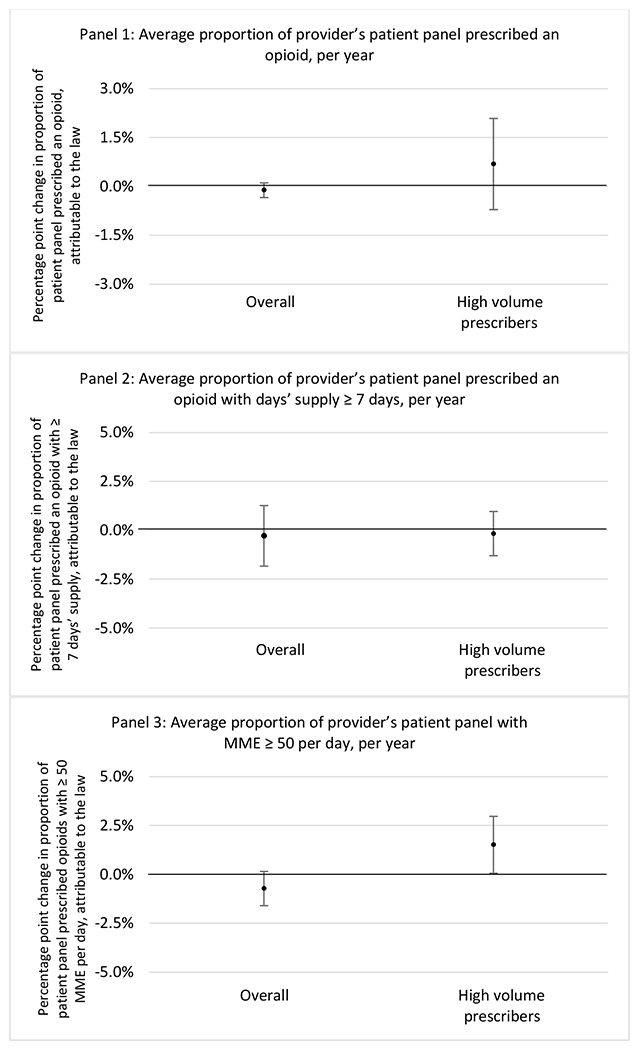
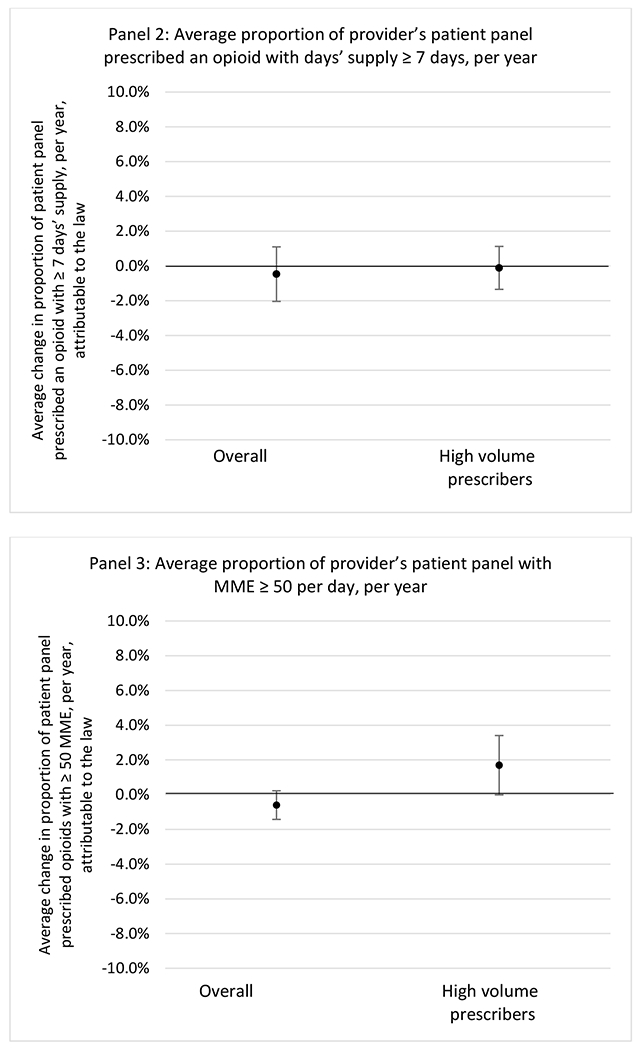
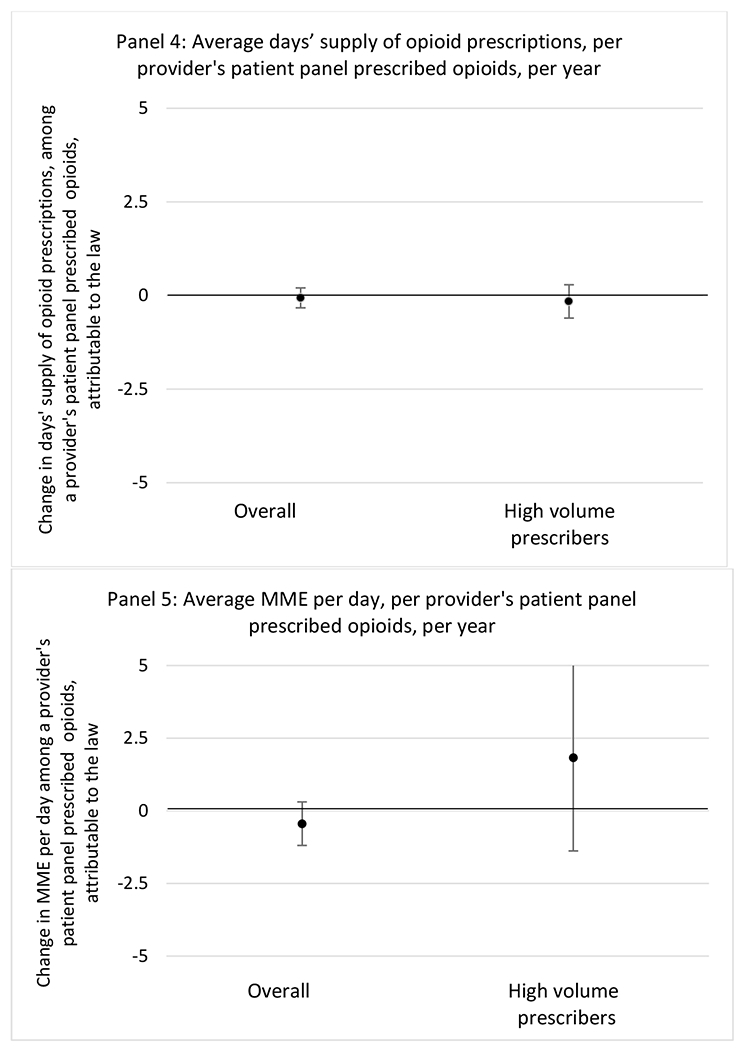
Changes in opioid prescribing for chronic non-cancer pain patients, per year, attributable to implementation of a state opioid prescribing cap law, among all prescribers and high-volume opioid prescribers
1 High volume was defined as being in the top 5% of total morphine milligram equivalents (MME) prescribed in a given year
Figure 3.
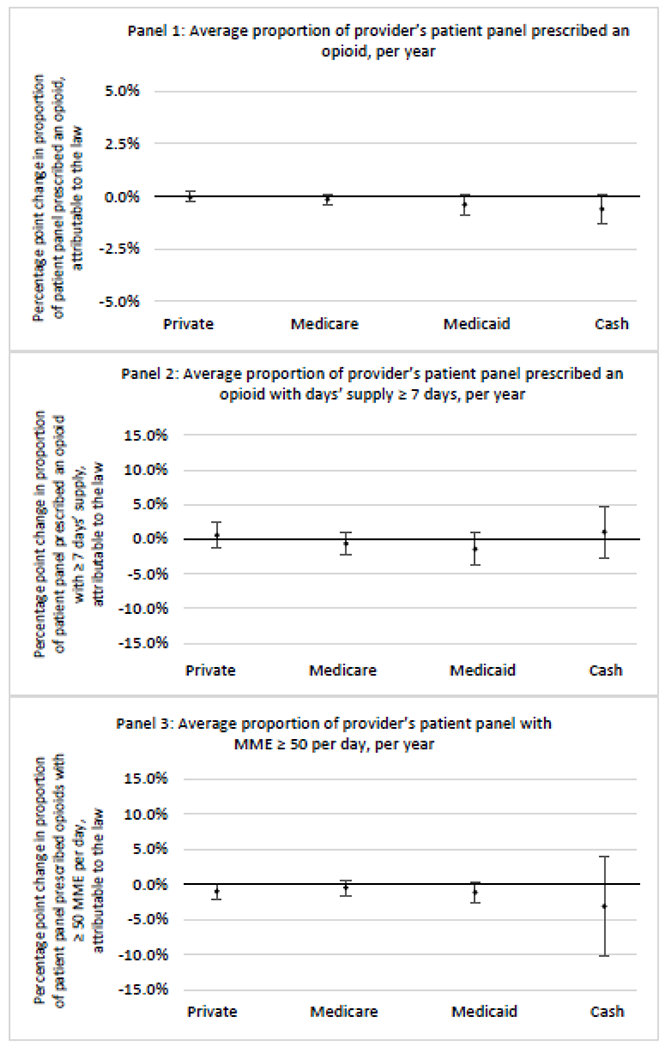
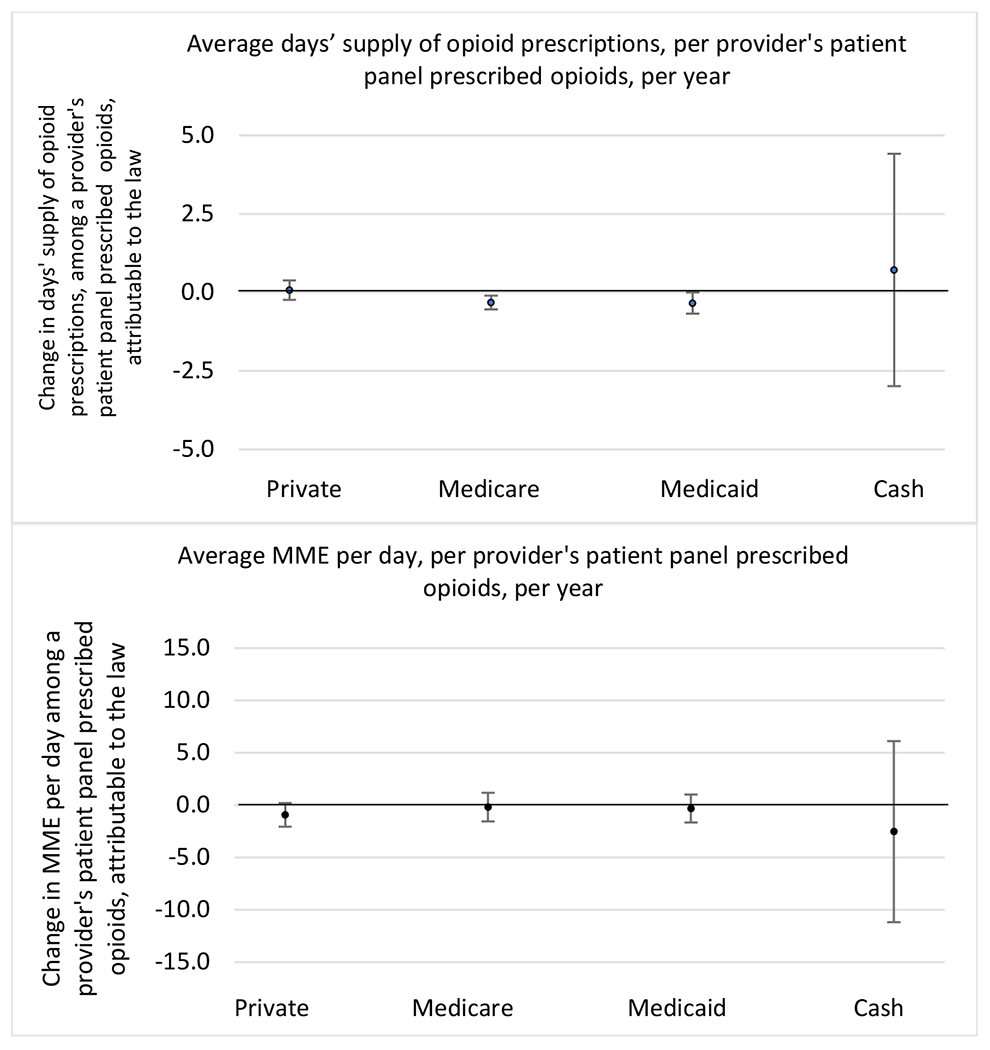
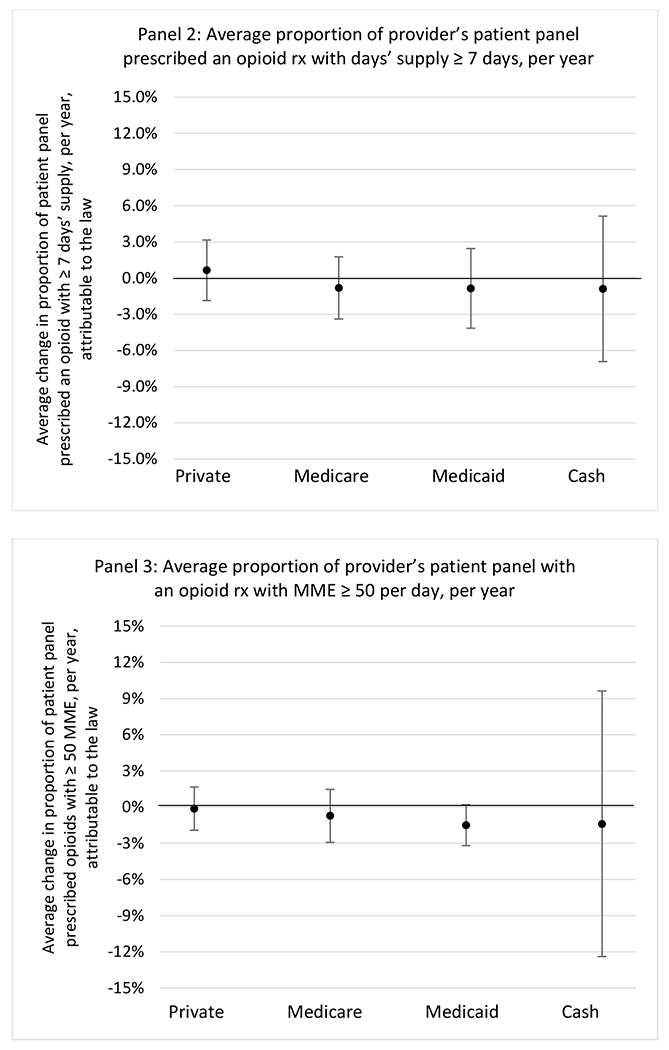
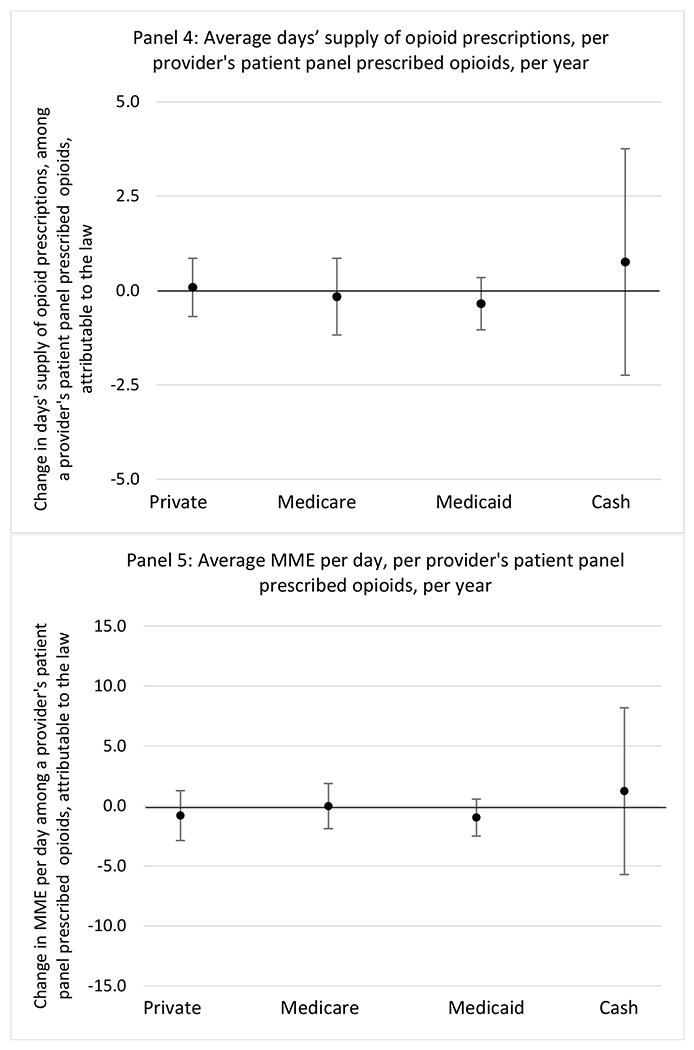
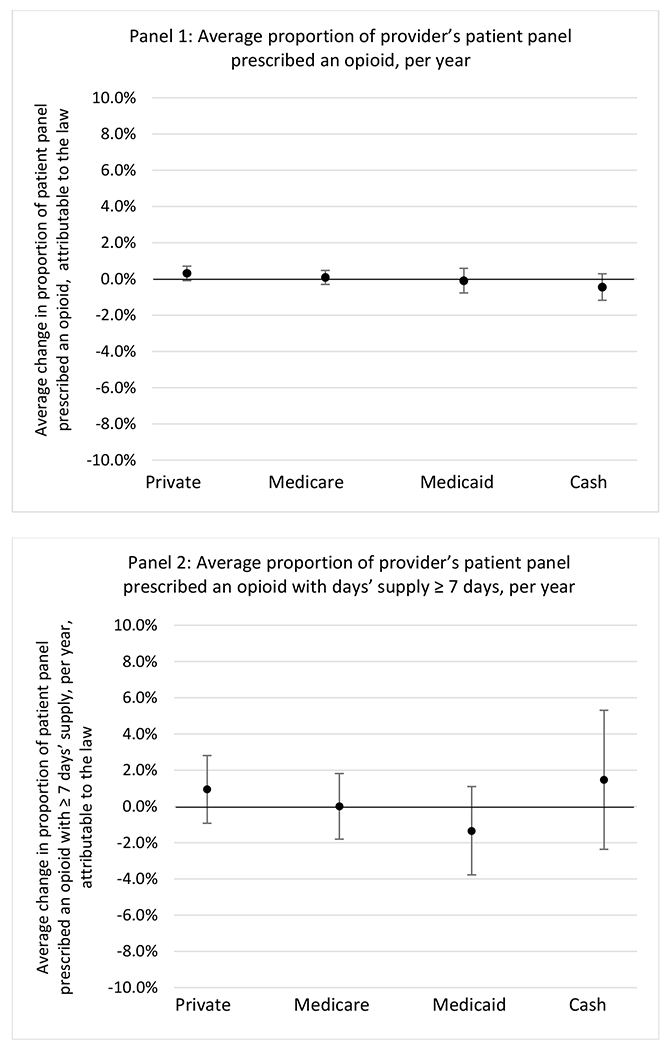
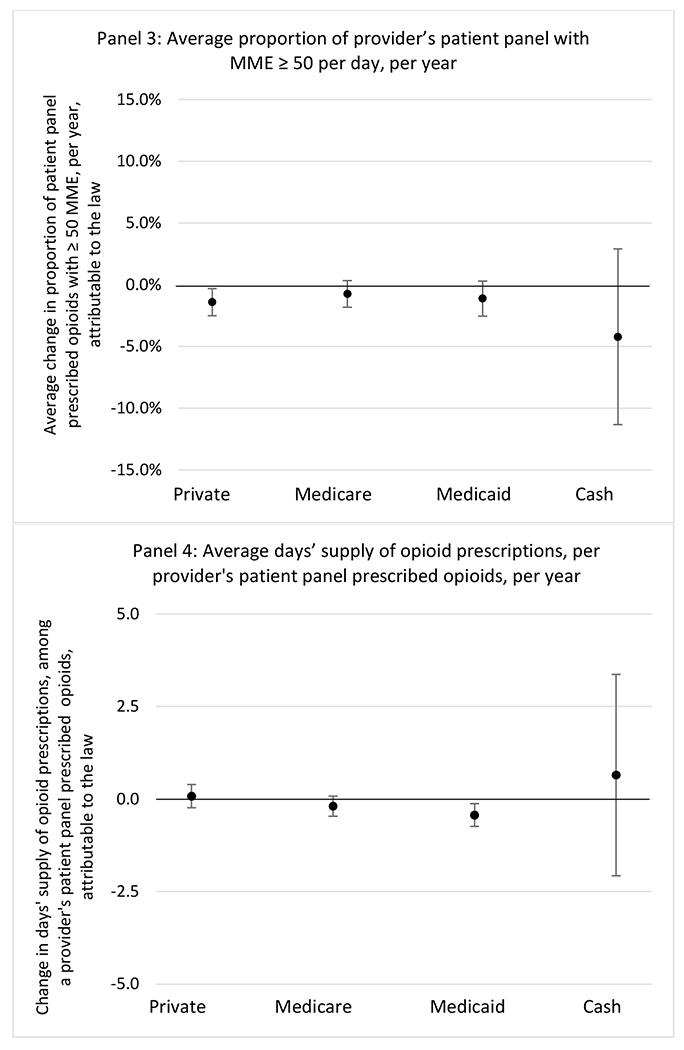
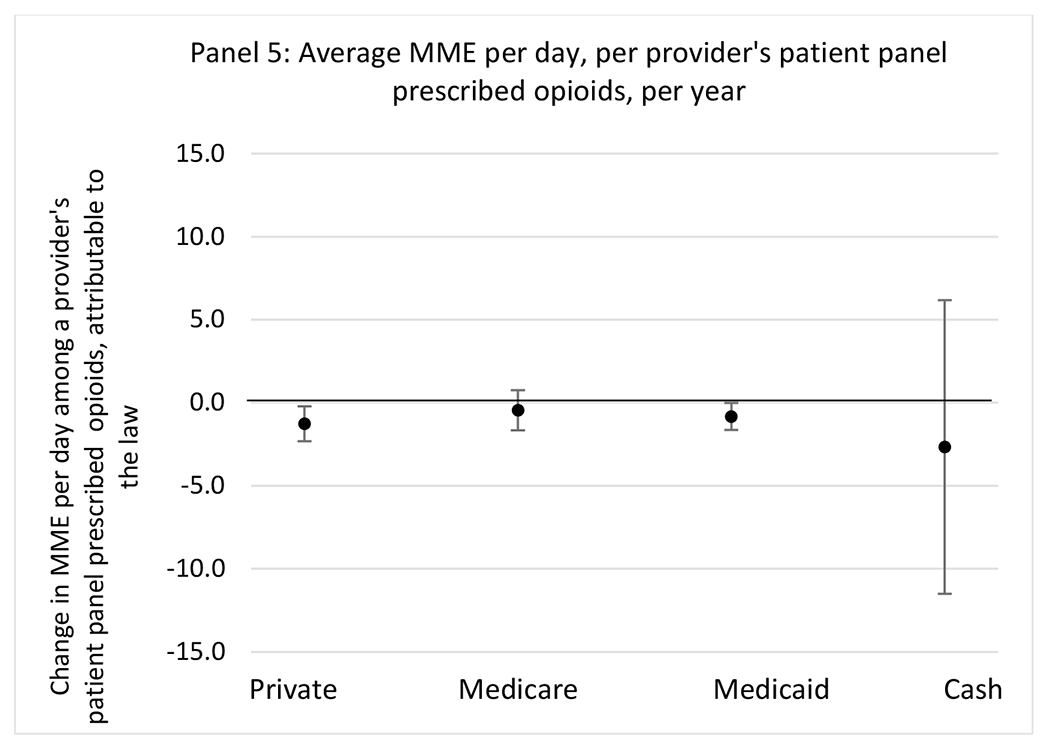
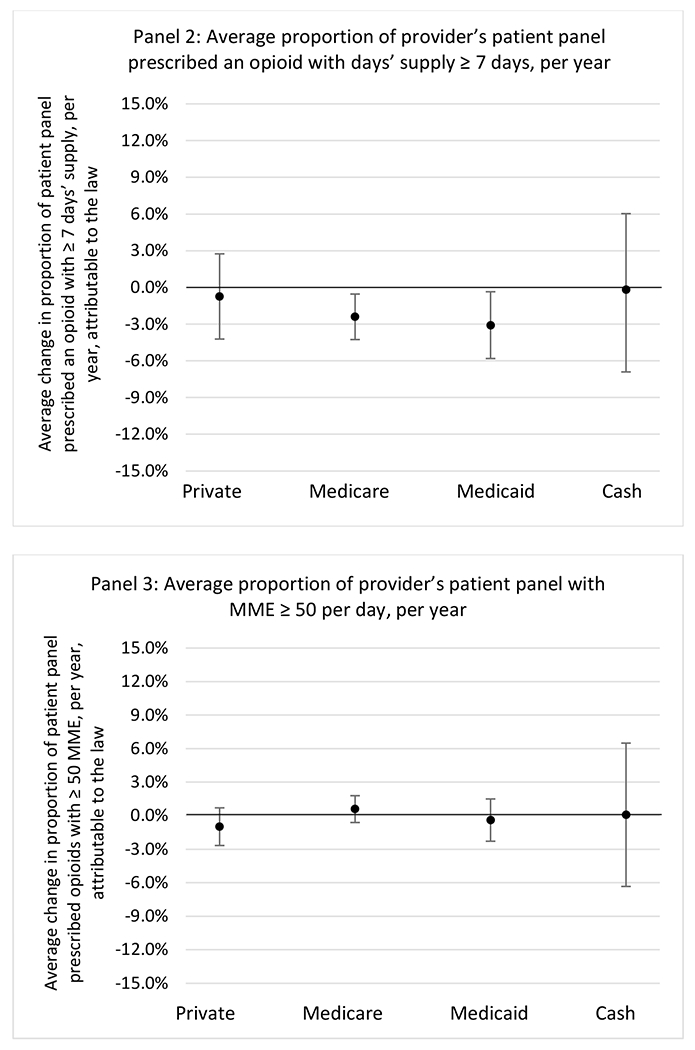
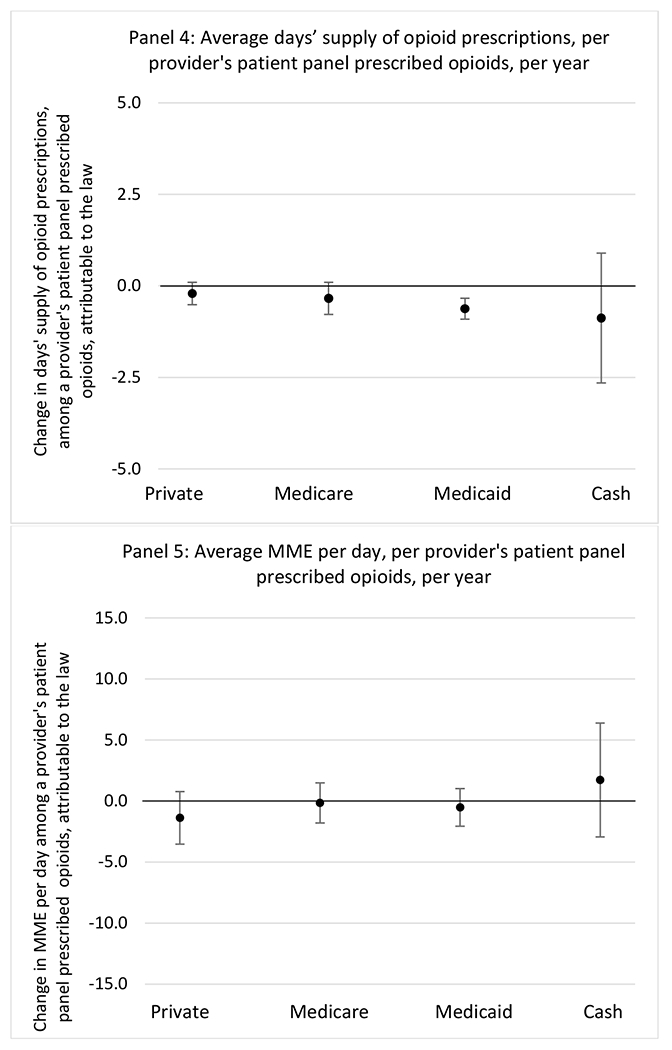
Changes in opioid prescribing for chronic non-cancer pain patients, per year, attributable to implementation of a state opioid prescribing cap law, by patient insurance type
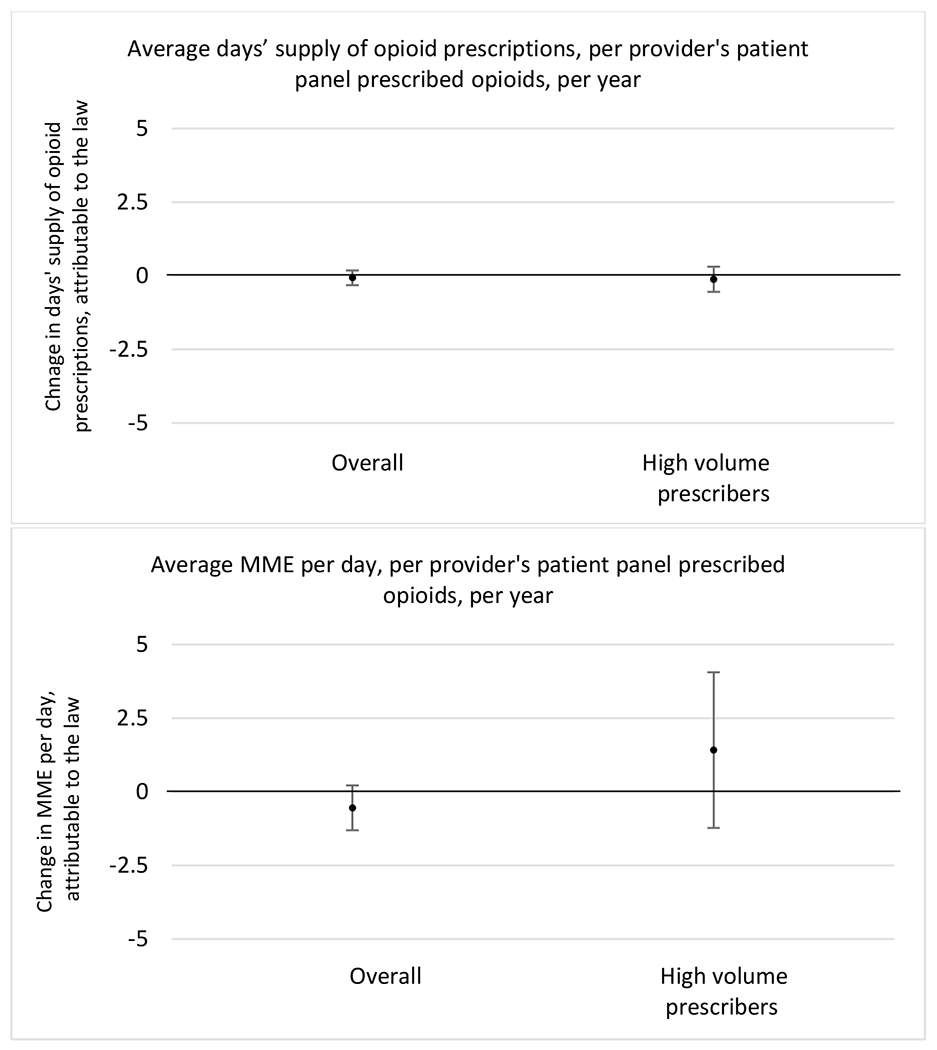
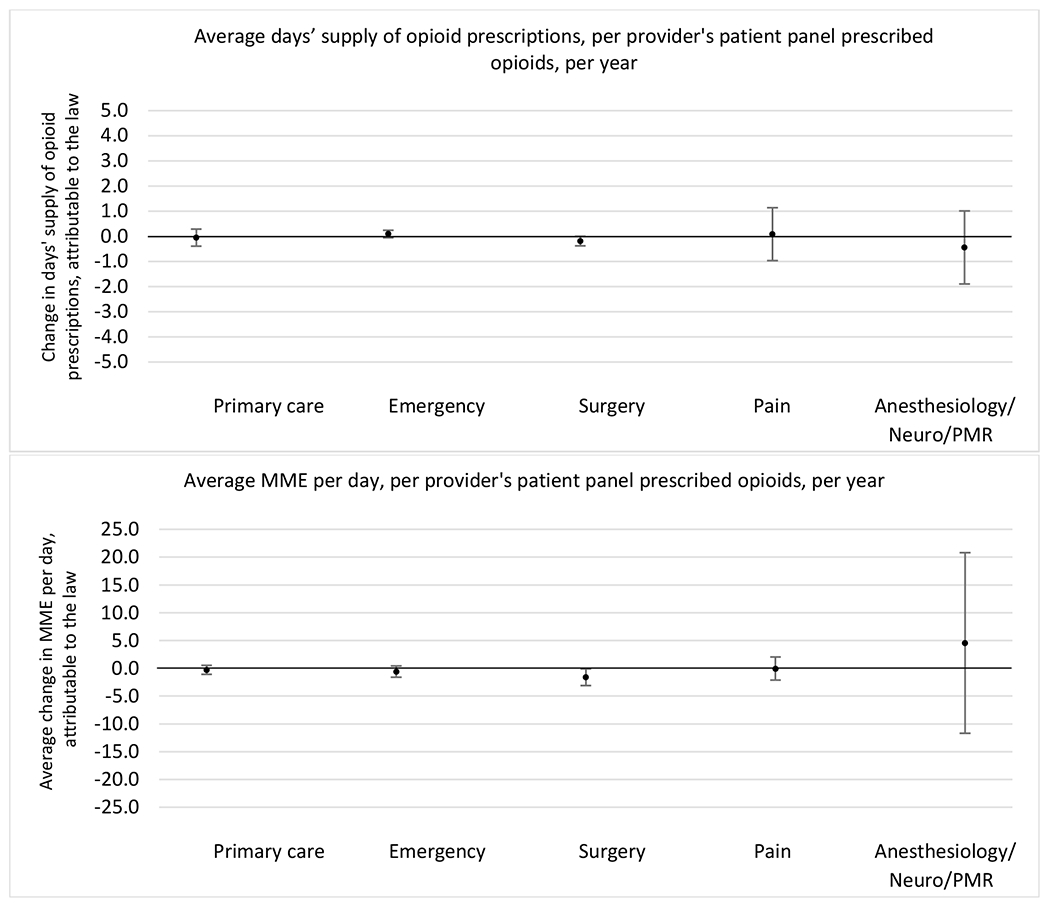
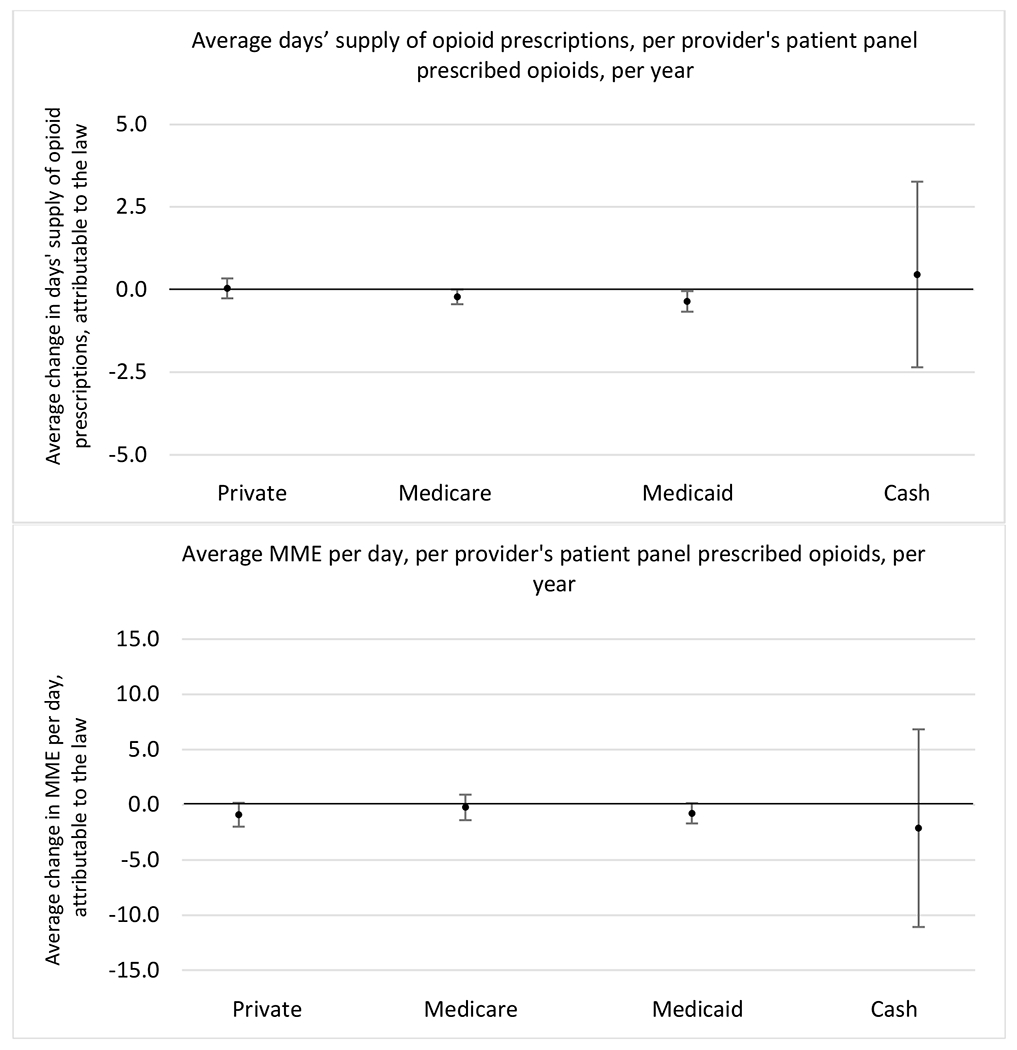
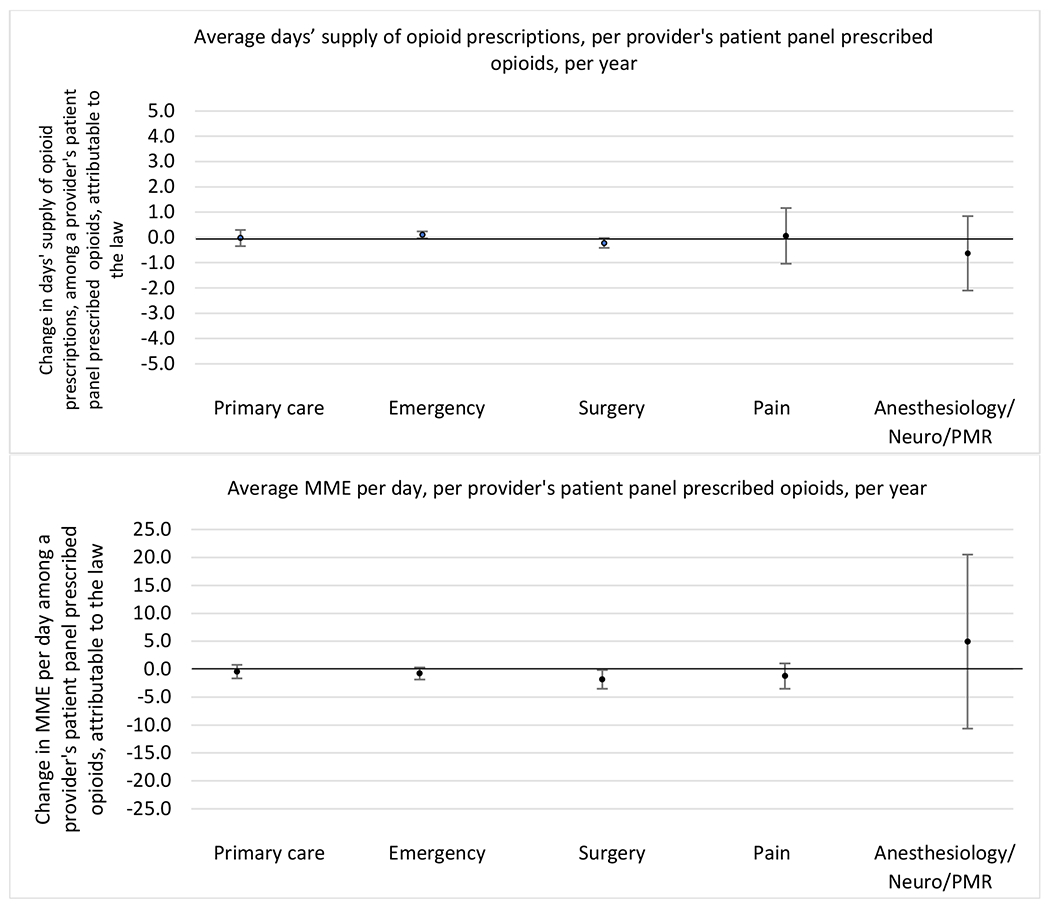
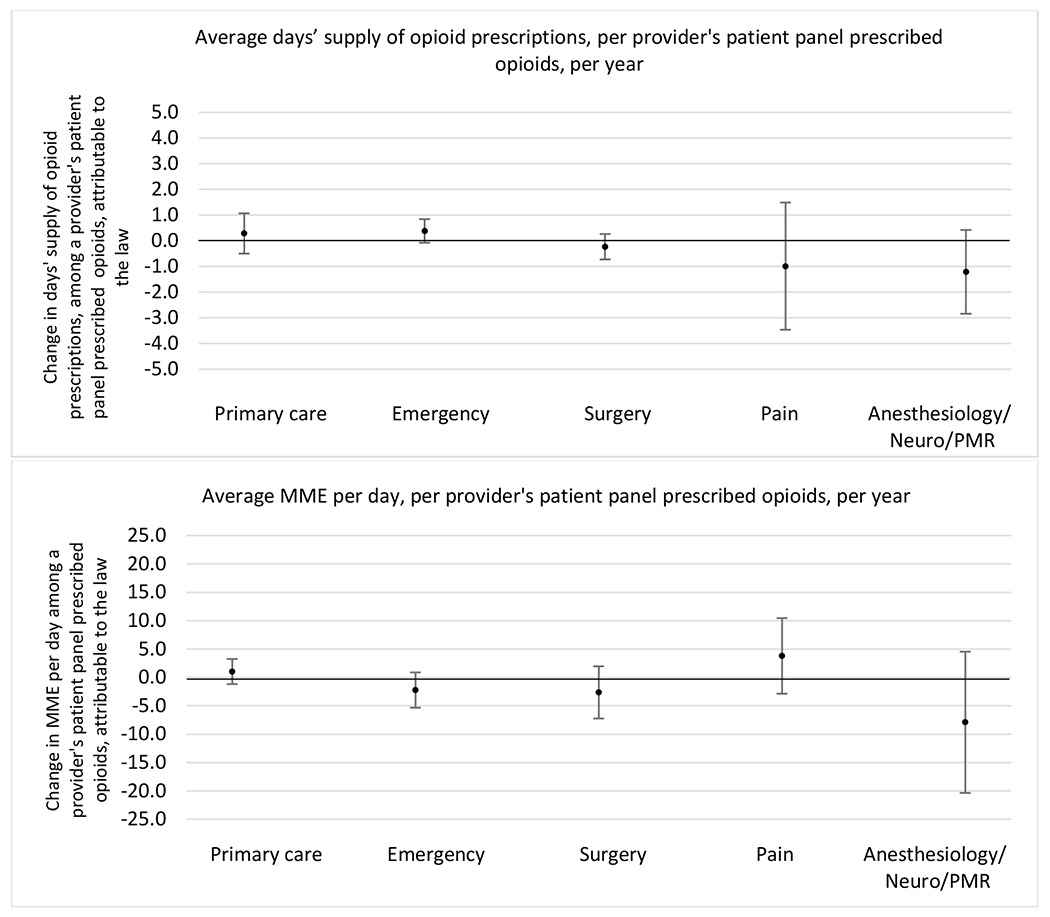
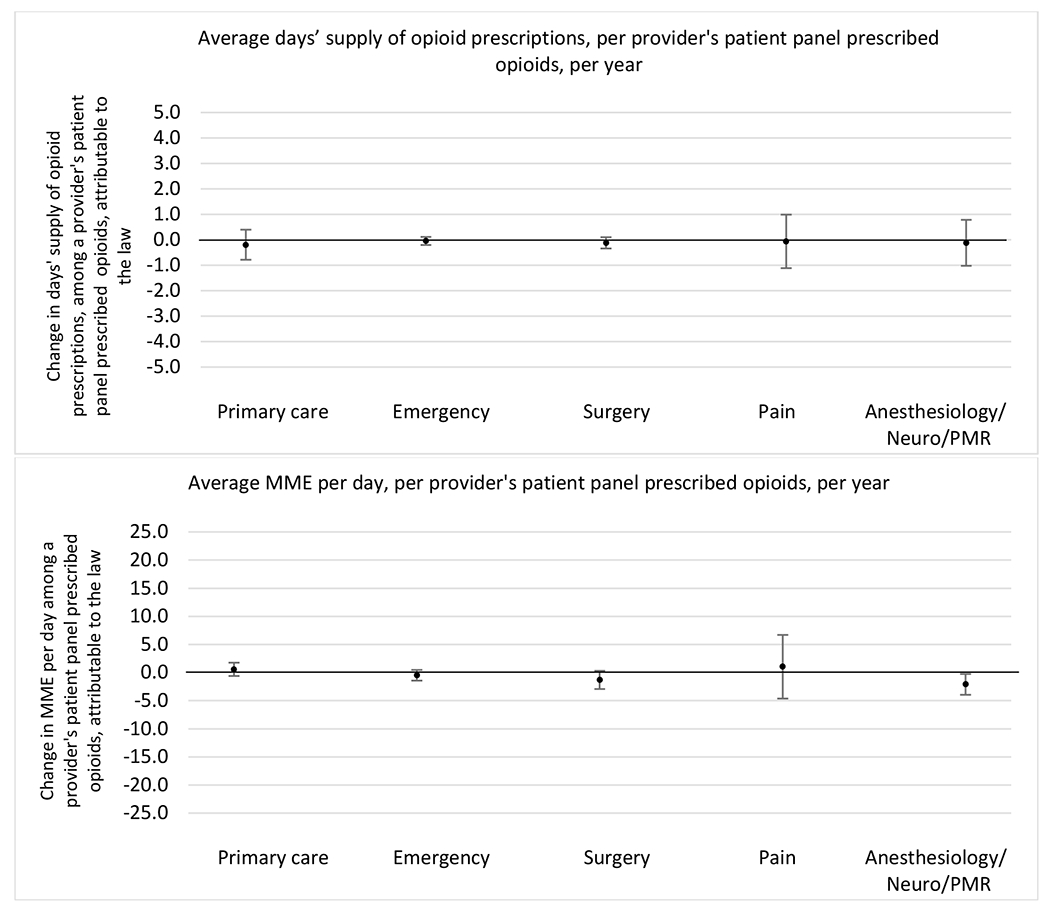
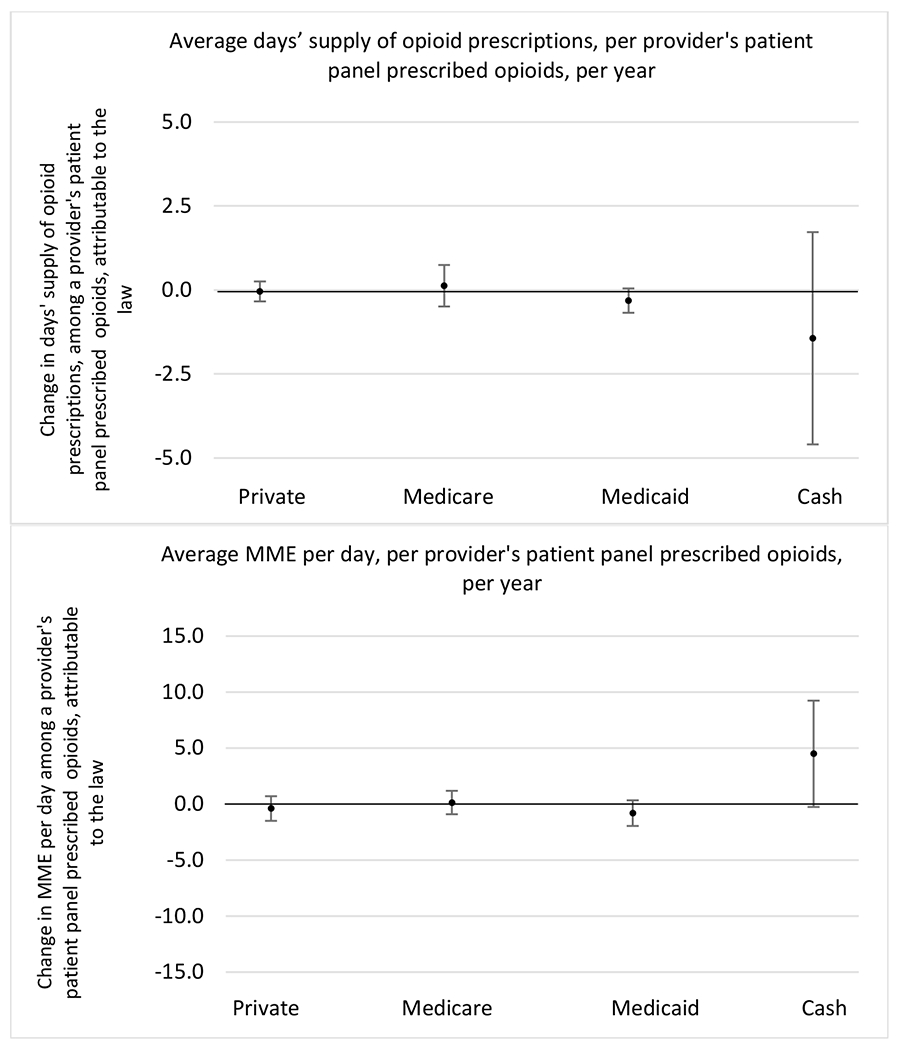
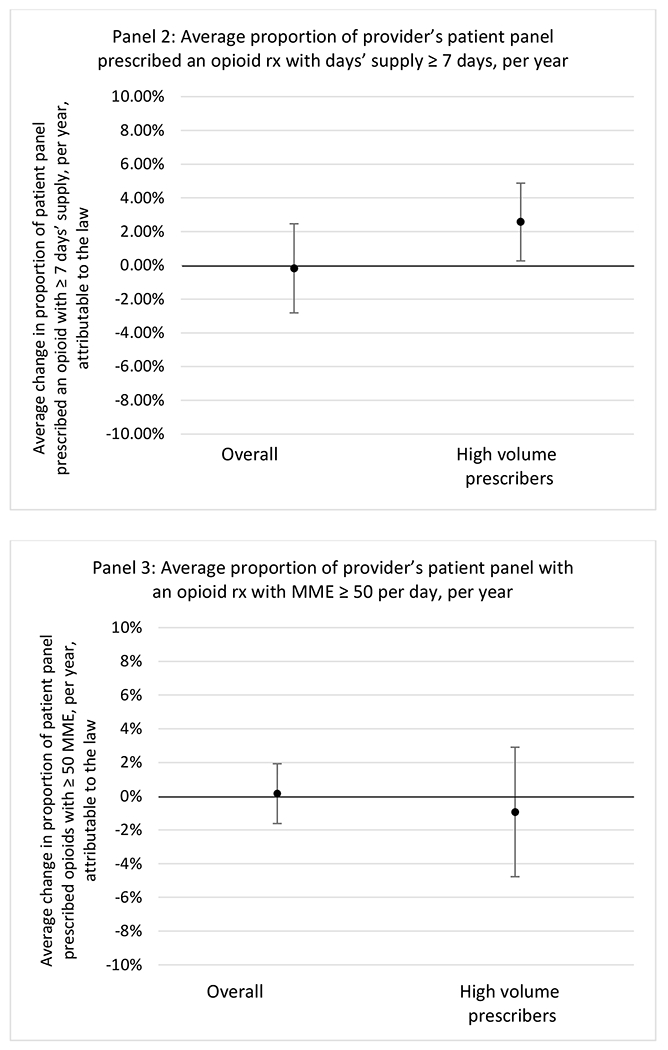
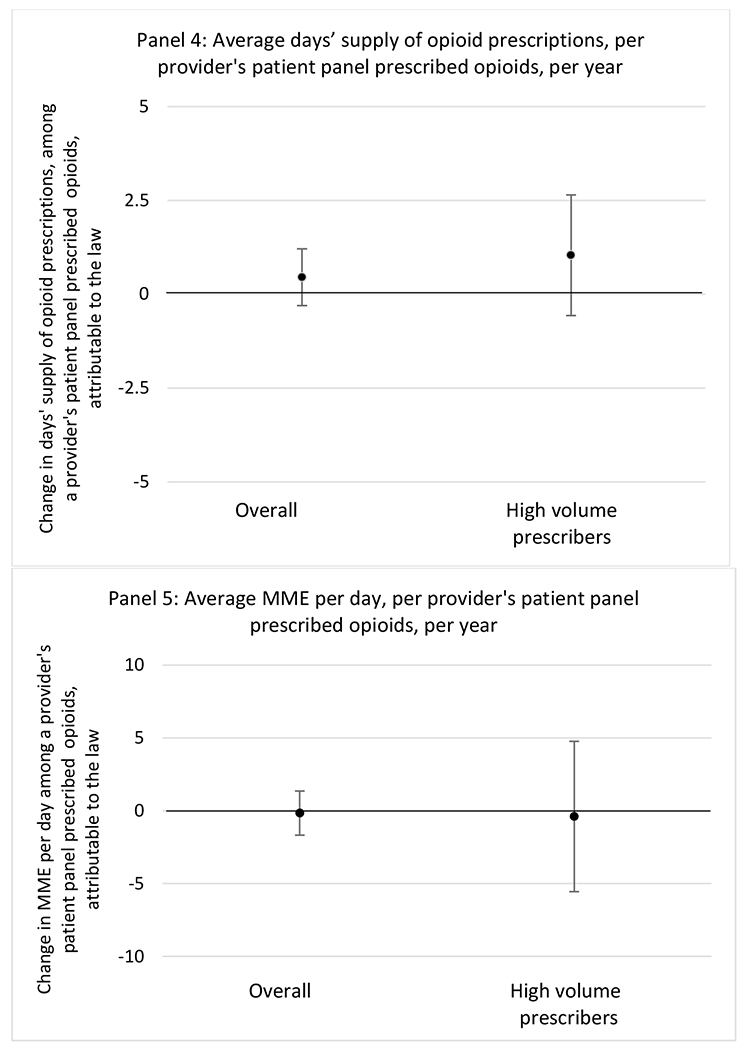
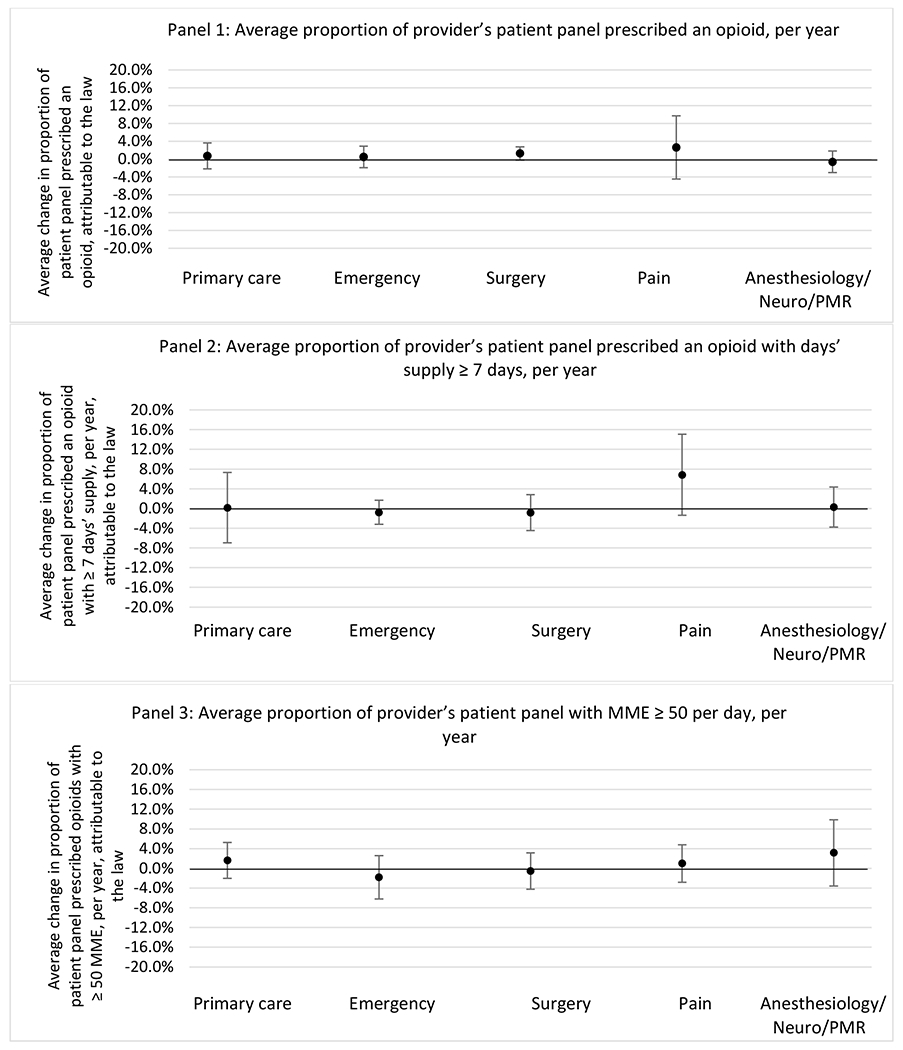
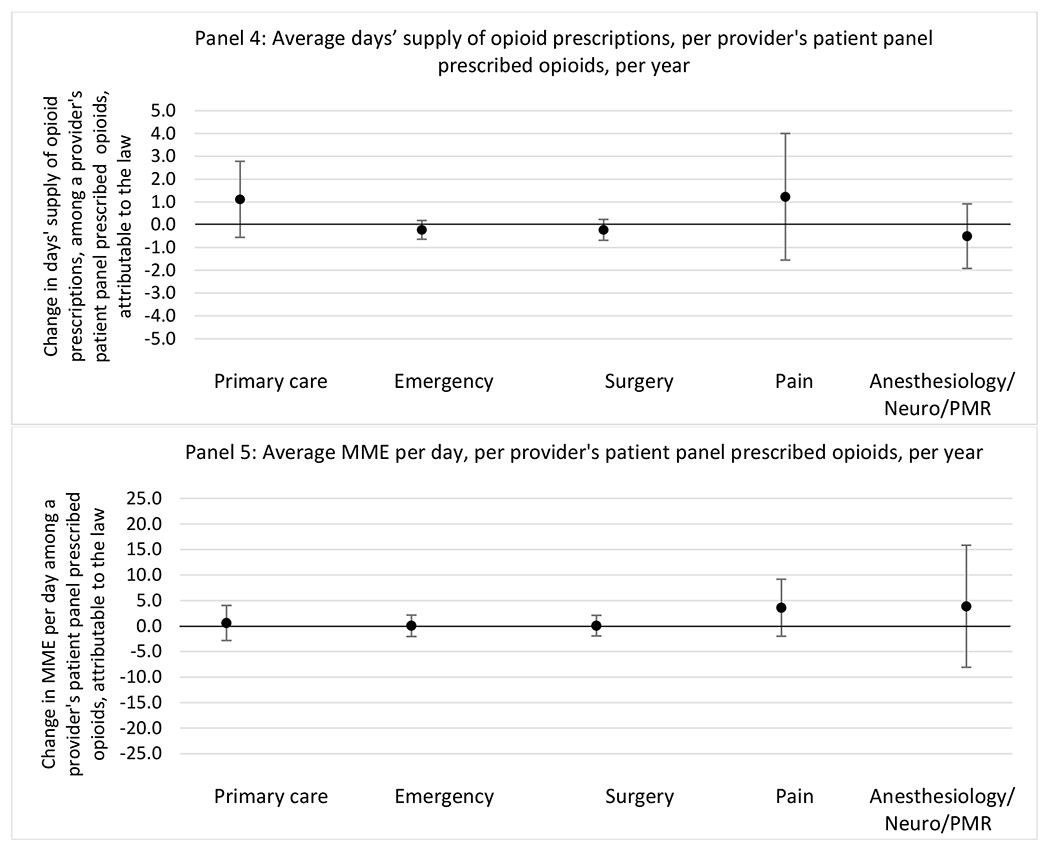
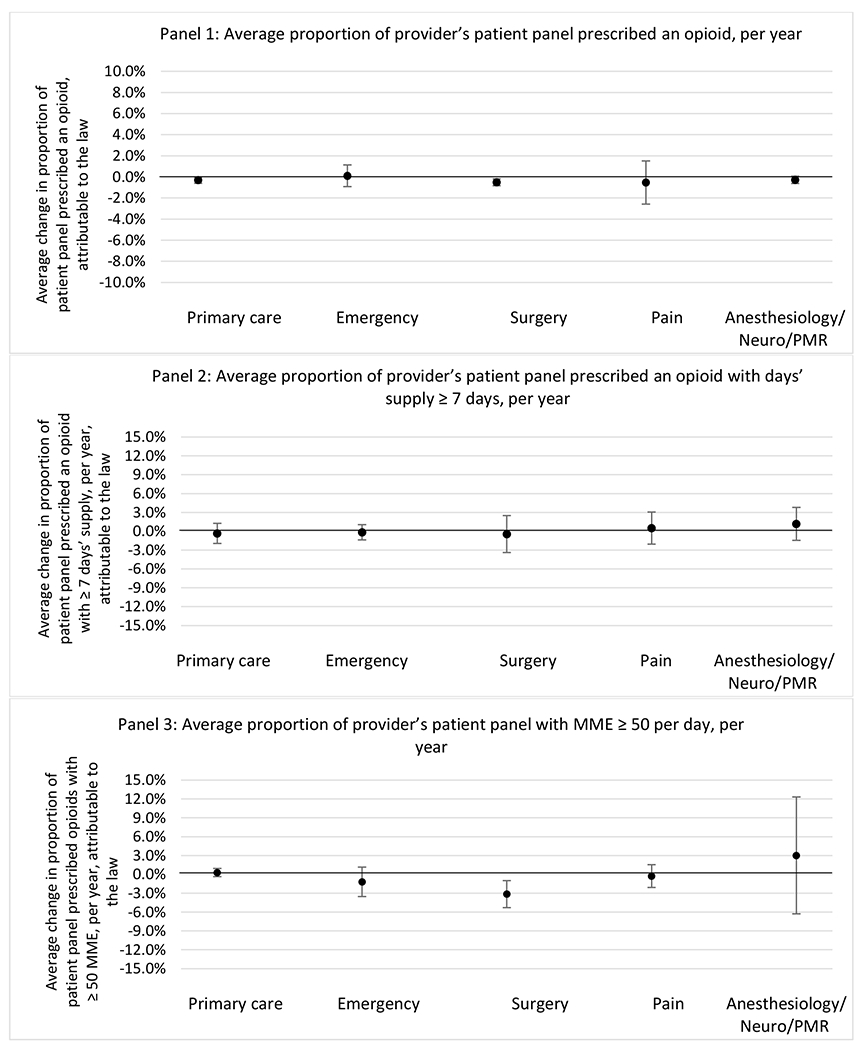
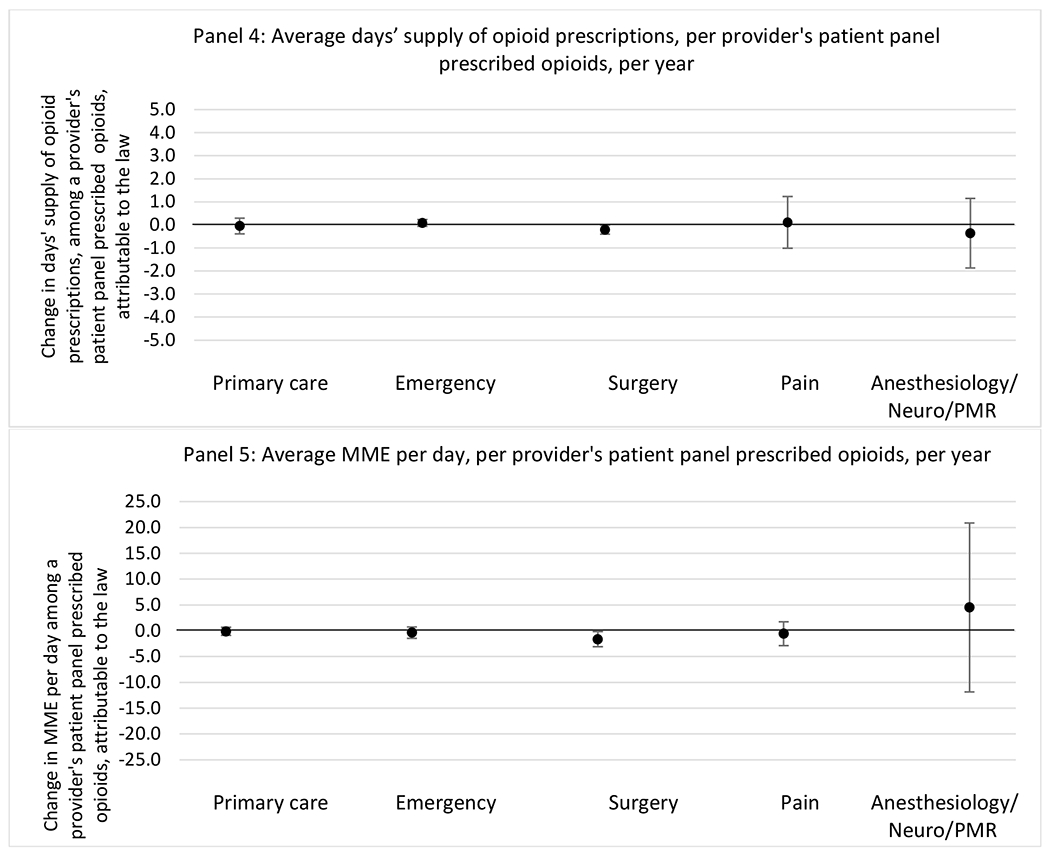
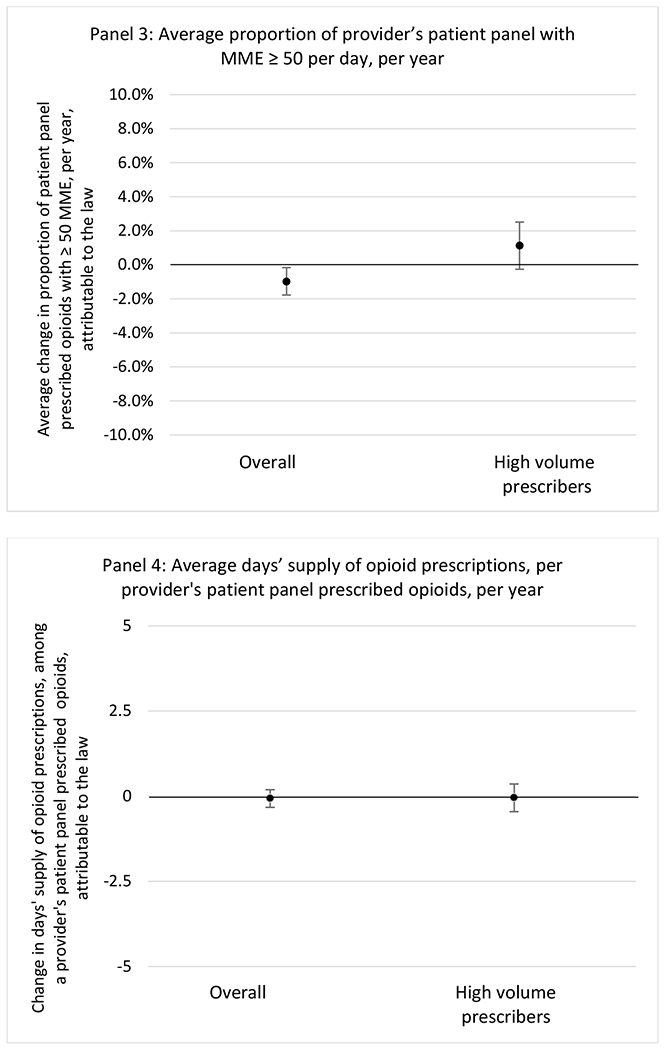
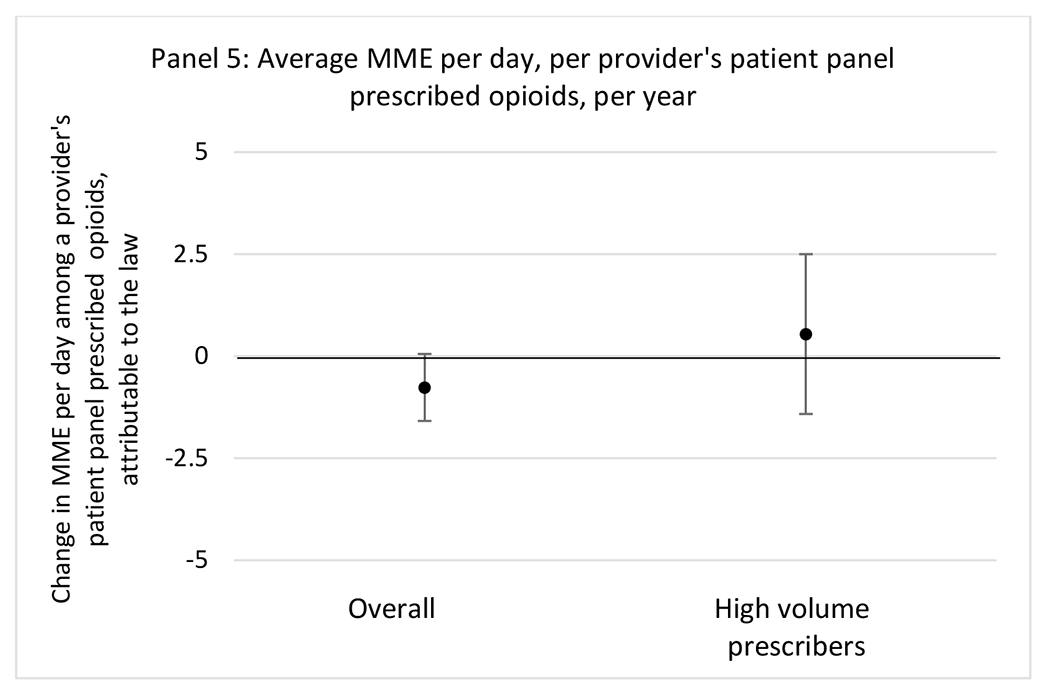
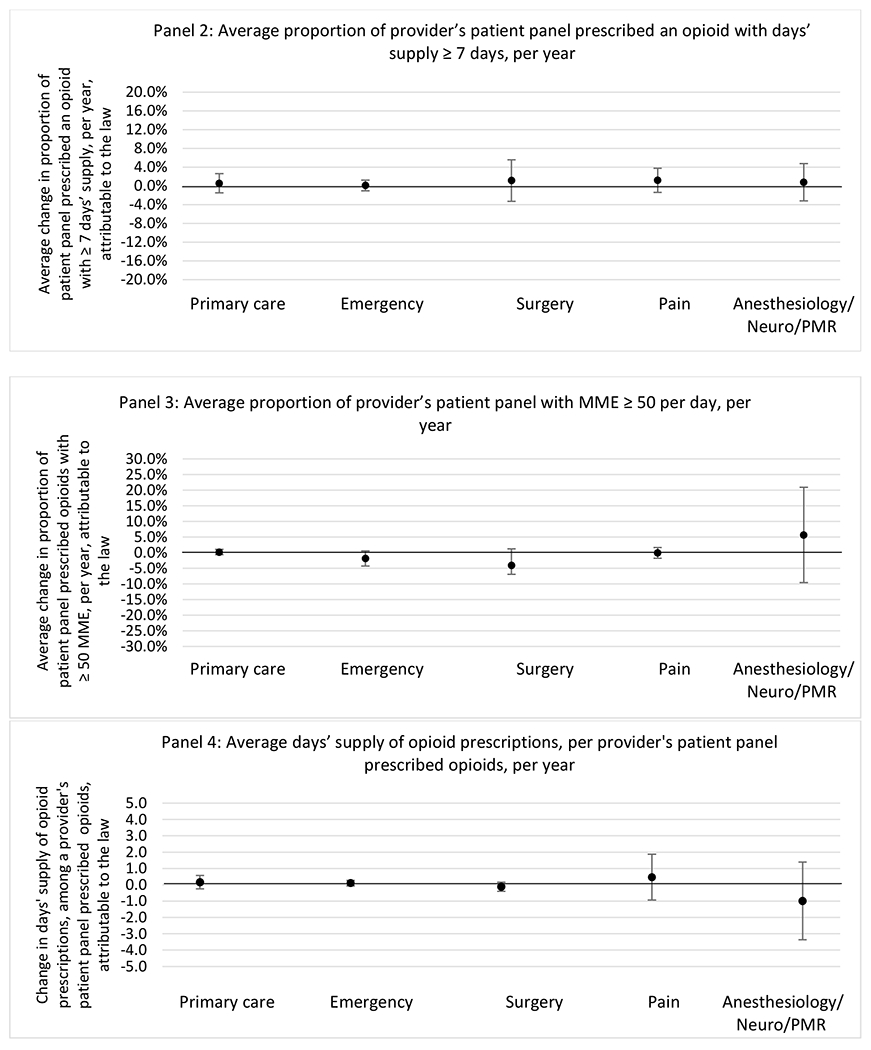
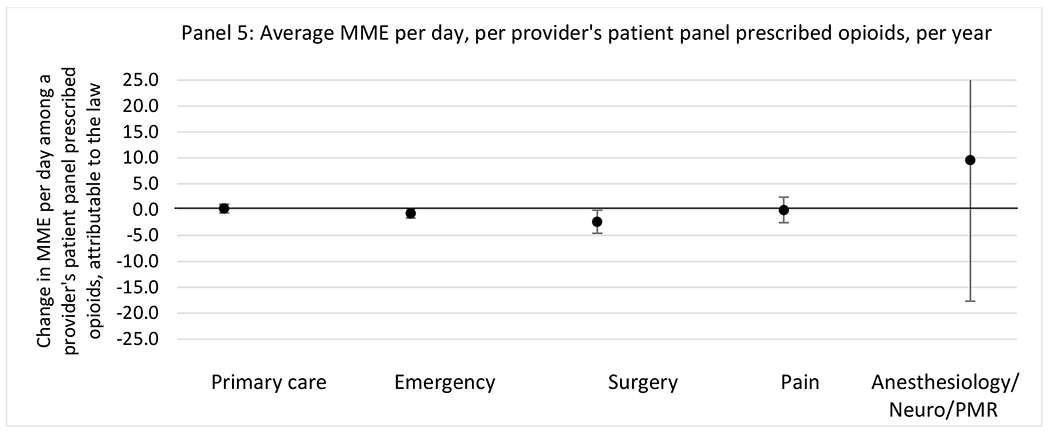
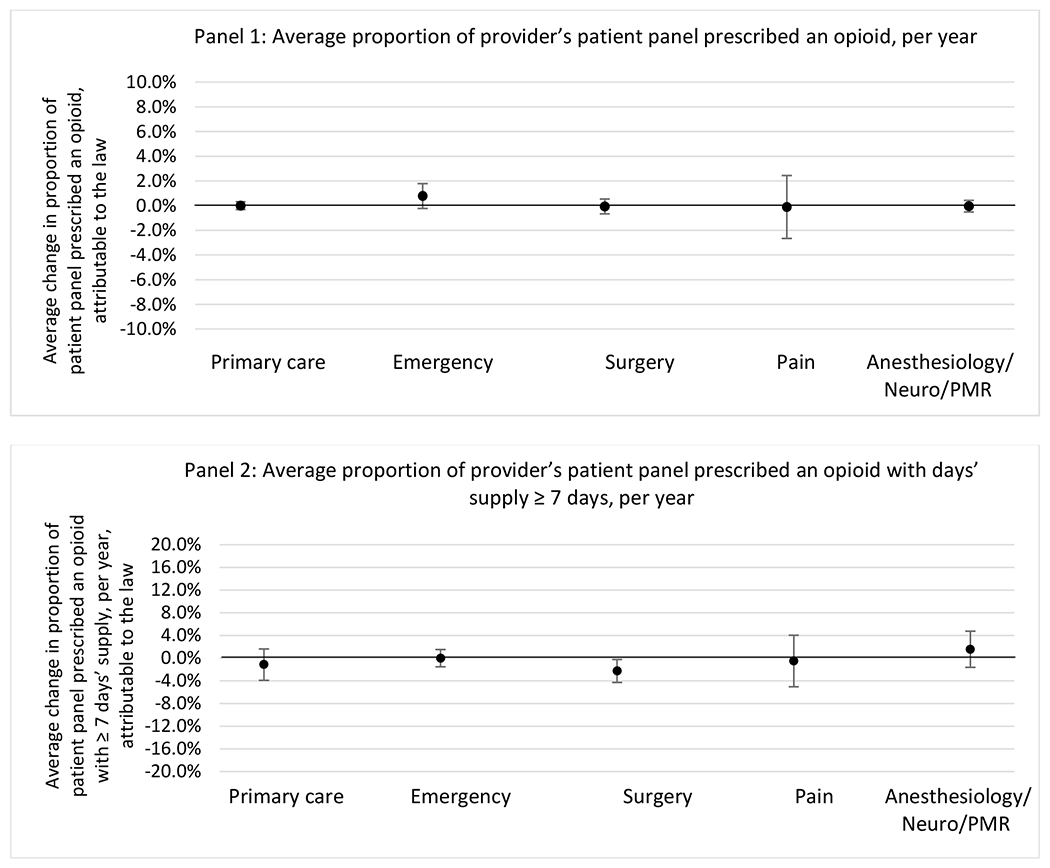
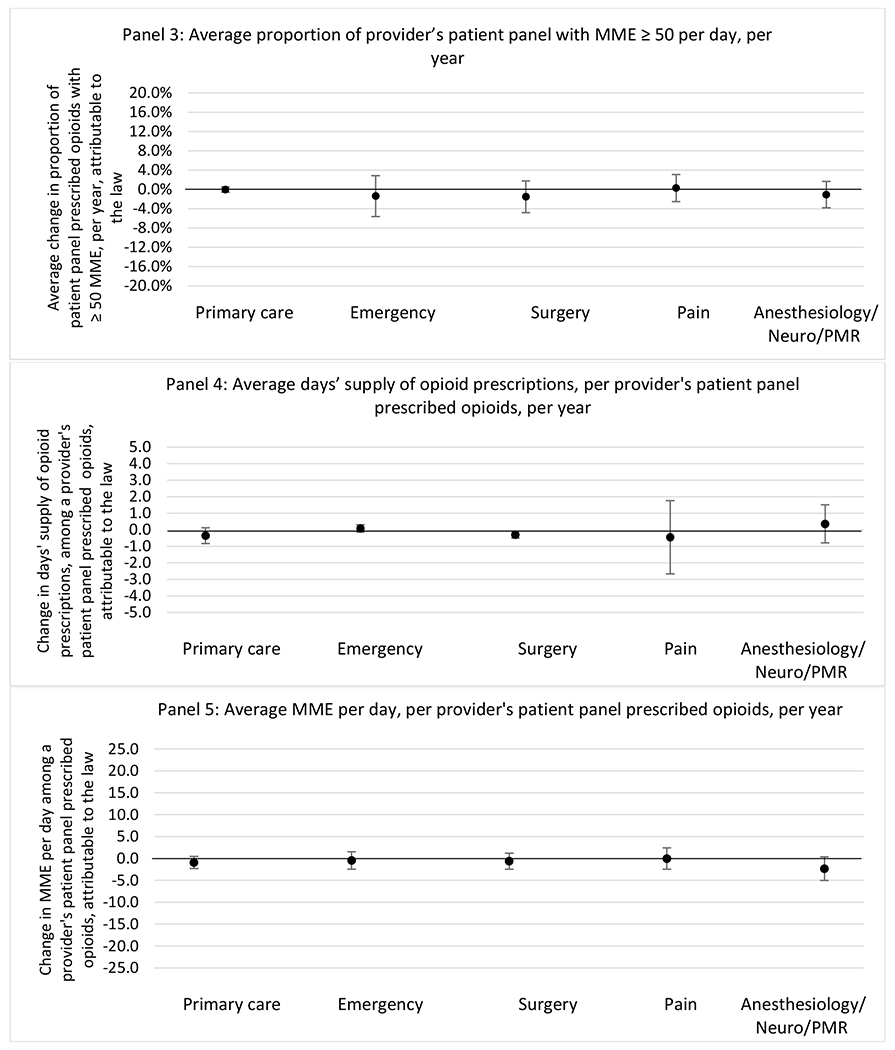
State opioid prescribing cap laws were not statistically associated with changes in the annual proportion of chronic pain patient panels with an opioid prescription with ≥ 7 days’ supply. We observed a change less than 1.5 percentage points attributable to the law across the subgroups examined, ranging between a 1.38 (95% CI −3.69, 0.93) annual reduction among providers of patients insured by Medicaid and 1.09 (95% CI −2.62, 4.79) annual increase among providers of cash payers. However, state laws were associated with small declines in the average annual days’ supply of opioid prescriptions among surgeons (−0.19 days, 95% CI −0.38, −0.01), and providers of patients insured by Medicaid (−0.22 days, 95% CI −0.44, −0.003) or Medicare (−0.36 days, 95% CI −0.67, −0.04) (Appendix D). State opioid prescribing cap laws were also associated with small-in-magnitude and non-significant changes in the annual proportion of a provider’s patient panel who received an opioid prescription with ≥ 50 MME per day and average MME per day of opioid prescriptions, with the following exceptions: Among high-volume opioid prescribers, cap laws were associated with a 1.52 (95% CI 0.06, 2.97) percentage point increase in the annual proportion a provider’s patient panel with an opioid prescription with ≥ 50 MME/day, however among surgeons there was a 2.98 (95% CI −5.13, −0.83) percentage point decrease attributable to the law (Figures 1 and 2, panel 3). Among surgeons, opioid prescribing cap laws were also associated with a 1.60 (95% CI −3.10, −0.10) reduction in the average MME per day, per provider’s patient panel prescribed opioids, per year (Appendix D).
Figure 2.
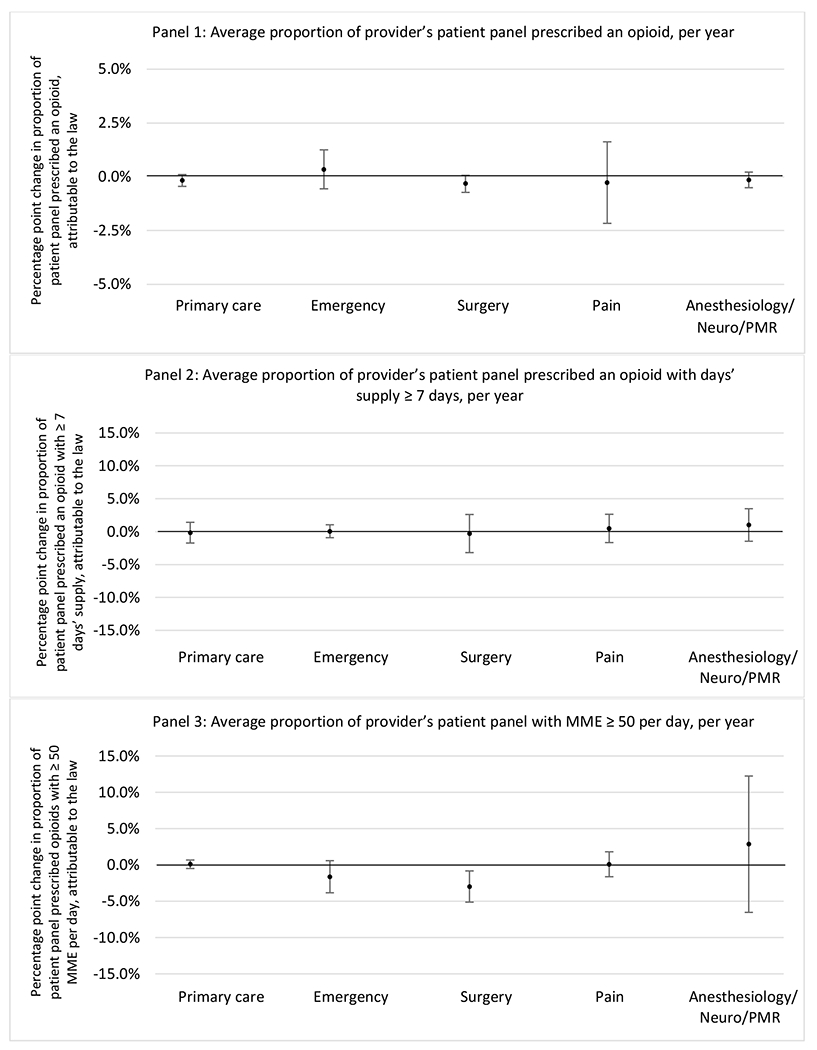
Changes in opioid prescribing for chronic non-cancer pain patients, per year, attributable to implementation of a state opioid prescribing cap law, by provider specialty
Note. Neuro/PMR= neurology/physical medicine & rehabilitation. These specialties were grouped because they all commonly treat people with chronic non-cancer pain.
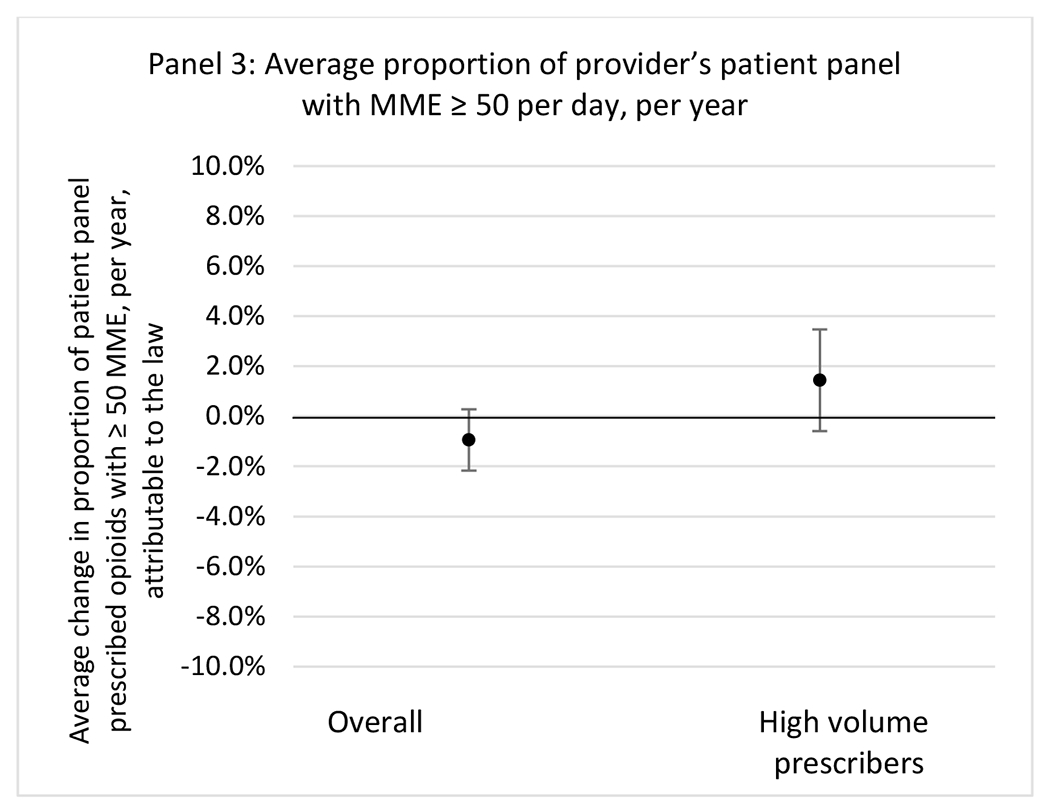
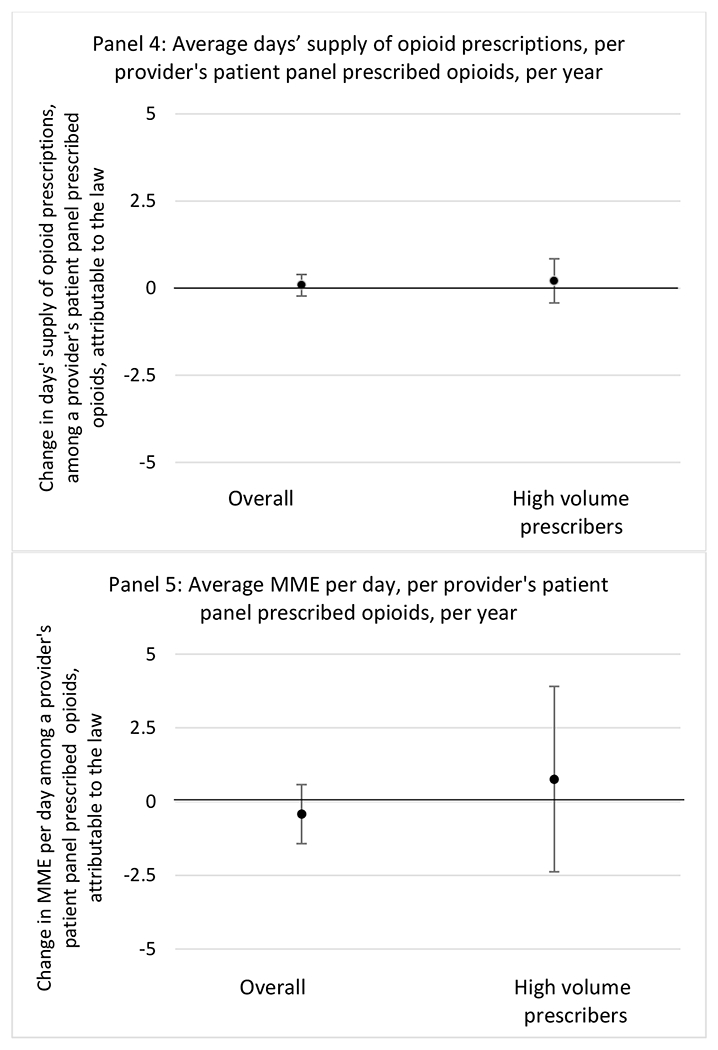
Results from sensitivity analyses including models stratified by condition, adjusted models for all samples, models with the two alternative comparison state pools, and models that stratified by professional judgement exemptions generally paralleled results of the main models. While there were a small number of isolated statistically significant changes in outcomes attributable to state opioid prescribing cap laws in these analyses, no clear patterns emerged. All results from sensitivity analyses are included in Appendices E–H.
Discussion
We did not find an association between state opioid prescribing cap laws and providers’ patterns of opioid prescribing for patients with chronic non-cancer pain, with a few exceptions. The laws had a small effect on high-dose opioid prescribing by high volume opioid prescribers and surgeons. The decrease in high-dose prescribing among surgeons is consistent with existing work.30 Further, surgeons most typically prescribe opioids for acute postoperative pain, which was not of specific focus here; but, prior research suggests that these laws have limited impacts on opioid prescribing following surgery.26 It is not clear why the law would be associated with increased prescribing among high volume prescribers. One possible explanation, which is unobservable in our data, might be that the state opioid prescribing laws led patients with more severe pain, greater dependence on high-dose prescription opioids, and/or stronger preference for high-dose opioids versus other treatment modalities to switch to high volume prescribers unlikely to change their prescribing behavior for chronic non-cancer pain due to state laws targeting acute pain. Additionally, while there were no significant changes to indicators of high risk opioid prescribing among providers of patients insured by Medicaid or Medicare, we did observe small but statistically significant decreases in average days’ supply of opioid prescriptions. Overall, the largely null results found in this study are consistent with existing work examining the impact of opioid prescribing cap laws on the receipt of opioid prescriptions, non-opioid medications, and procedures used to treat chronic pain conditions among patients with chronic non-cancer pain.27 The current study’s results suggest the lack of association between state opioid prescribing cap laws and opioid prescribing patterns22,31 are apparent across provider- and patient-level factors despite differential patterns in opioid prescribing among these groups.9,11–13
There are a number of possible explanations for these findings. As mentioned previously, these laws are designed largely to apply to acute pain, rather than chronic non-cancer pain; our findings suggest that the spillover effects leading to undertreatment of chronic pain feared by some experts are not in fact occurring in practice on a broad scale.16 State opioid prescribing cap laws also include a number of provisions, which vary across states. Of the 24 treatment states, 16 have a provision that only applies the law to initial opioid prescriptions and 14 states have professional judgement exemptions that allow physicians to override prescribing limits set forth by the law.14 However, we conducted models that stratified by states with and without professional judgement exemptions and did not find differences in results. We were unable to examine the initial opioid prescription provision because while we observed the entirety of a provider’s data for patients with chronic pain in a given year, we did not necessarily have the entirety of a patient’s data and therefore could not confidently identify their first opioid prescription. Additionally, implementation and enforcement challenges likely contribute the null findings. Results from a previous qualitative study highlighted a number barriers including lack of prescriber understanding of the law, difficulty operationalizing law criteria, and the absence of information technology infrastructure needed to implement and enforce dose and duration limits.32 Our study results suggest that these factors likely persist beyond a broad sample of providers to those with high volume prescribing, different medical specialties and for patients with different insurers.
The study results and the challenges described above have implications for other types of interventions intended to influence opioid prescribing. Because of the differences we see in general opioid prescribing by baseline prescribing volume and provider specialty, more tailored interventions could be useful to provide education and training to providers already prescribing high-risk opioid medications. For example, provider education strategies such as audit-and-feedback, detailing, and coaching could be useful for prescribers attempting to implement these laws in practice.33 Lastly, during our study period opioid prescribing decreased in the US, which was likely more heavily influenced by strategies including changes to clinical guidelines and modifications to views on pain treatment. Our results suggest that this downward trend in prescribing may have been driven by increased community awareness of the risks of opioid treatment and changes to the pain management culture, rather than state laws that limit dose and/or duration of opioid prescriptions.
Our study has a number of limitations. State prescribing cap laws were implemented relatively recently, limiting our ability to examine longer-term effects of the laws. However, cohort-specific results in year 2 of the post-law period for the 2017 cohort were consistent with those results in year 1. As we note, a number of other opioid prescribing policies and initiatives were implemented during the study period. However, these would need to vary across time and between the treatment and control states to introduce any bias.34 This study focused on three common chronic non-cancer pain conditions. Results may not generalize to other conditions. Additionally, while this analysis examined some markers of high-risk prescribing based on dose and days’ supply, other markers of high-risk opioid prescribing may result from co-prescribing with benzodiazepines, overlapping prescriptions, and prescriptions from multiple providers which were not examined here. Lastly, we were not able to measure patients’ initial opioid prescription and were unable to identify clinical appropriateness of opioid prescribing.
Our study observed scant associations between state opioid prescribing cap laws and opioid prescribing among all providers and stratified by high volume prescribers, provider specialty, and patient insurer. Other levels of policies and initiatives may be more appropriate for modifying provider prescribing practices of opioids for chronic non-cancer pain.
Highlights.
Among nearly all subgroups, prescribing cap laws did not impact opioid prescribing
These laws may have small effects on high dose prescribing among some providers
Other strategies may be needed to modify opioid prescribing for chronic pain
Grant Support:
R01DA044987 from the National Institute on Drug Abuse.
Appendices
Appendix A. State opioid prescribing cap laws among states that implemented a law between July 1, 2016 and June 30, 2018
| State | Initial Effective date | Day supply limit | Dosage limit | Initial Rx only | Professional judgment exemption | Cancer treatment exemption | Surgical pain exemption | Palliative care exemption |
|---|---|---|---|---|---|---|---|---|
| AK | July 26, 2017 | 7 | - | Yes | Yes | Yes | No | Yes |
| AZ | April 26, 2018 | 5 | 90 MME/day | Yes | Yes | Yes | Yesa | Yes |
| CO | May 21, 2018 | 7 | - | No | Yes | Yes | Yes | Yes |
| CT | July 1, 2016 | 7 | - | Yes | Yes | Yes | No | Yes |
| DE | April 1, 2017 | 7 | - | Yes | Yes | Yes | No | Yes |
| HI | July 1, 2017 | 7 | - | Yes | No | Yes | Yes | Yes |
| IN | July 1, 2017 | 7 | - | Yes | Yes | Yes | No | Yes |
| KY | June 29, 2017 | 3 | - | No | Yes | Yes | Yes | Yesb |
| LA | Aug. 1, 2017 | 7 | - | Yes | Yes | Yes | No | Yes |
| MD | May 25, 2017 | No greater than needed | Lowest effective | No | No | Yes | No | Yes |
| ME | Jan. 1, 2017 | 7 (acute); 30 (chronic) | 100 MME/dayc | No | No | Yes | Yes | Yes |
| NC | Jan. 1, 2018 | 5 | - | Yes | No | Yes | Yes | Yes |
| NH | Jan. 1, 2017 | 7 (ED, urgent care, walk-in clinic) | Lowest effective | No | Yes | Yes | No | No |
| NJ | May 16, 2017 | 5 | Lowest effective | Yes | No | Yes | No | Yes |
| NV | Jan. 1, 2018 | 14 | 90 MME/day | Yes | Yesd | Yesd | No | Yesd |
| NY | July 22, 2016 | 7 | - | Yes | No | Yes | No | Yes |
| OH | Aug. 31, 2017 | 7 | 30 MME/day (acute); 120 MME/day | Yes | Yes | Yes | Yes | Yes |
| PA | Jan. 3, 2017 | 7 (adult ED, urgent care, and hospital) | - | No | Yes | Yes | No | Yes |
| RI | March 22,2017 | 20 doses | 30 MME/day | Yes | No | Yes | No | Yes |
| SC | May 15, 2018 | 7 | - | Yes | No | Yes | Yes | Yes |
| UT | May 9, 2017 | 7 | - | No | No | No | Yes | No |
| VA | March 15,2017 | 7 | - | No | Yes | Yes | Yes | Yes |
| VT | July 1, 2017 | Varies | Varies | Yes | Yes | Yes | Yes | No |
| WV | June 7, 2018 | 3, 4, 7 | Lowest effective | Yes | No | Yes | Yes | Yes |
Control states (No cap law ≤ 7/2018): DC, MN, WY, TX, MT, AL, CA, GA, IA, ID, KS, ND, NE, NM, OR, SD, WI, FL, MI, TN, AR, MO, MS, OK, WA
Note: All provisions listed above represent the current state of the law (as of 12/31/2019). For a small number of states, changes were made after the initial effective date. This is denoted by a superscript.
Yes as of 8/3/2018
Yes as of 6/27/2019
Decreased from 300 MME per day to 100 MME per day as of 7/1/2017
Yes as of 6/3/2019
Appendix B: Chronic non-cancer pain condition diagnosis codes
| Condition | ICD-9 | ICD-10 |
|---|---|---|
| Low back pain | 721.30, 721.42, 722.52, 722.73, 724.02, 724.03, 724.20, 724.30, 724.40, 724.50 | M43.06, M43.07, M43.16, M43.17, M47.16, M47.26, M47.27, M47.816, M47.817, M47.896, M47.897, M48.06*, M48.07, M51.06, M51.16, M51.17, M51.26, M51.27, M51.36, M51.37, M54.16, M54.17, M54.3*, M54.4*, M54.5, M54.89, M54.9, S39.012$, S39.023$, S39.092$ |
| Fibromyalgia | 729.1 | M79.7 |
| Headache | 307.81, 339.*, 346.*, 349.0, 723.8, 784.0 | R51, G43.*, G44.*, G97.1, M54.81 |
Raw file with all ICD codes for chronic non-cancer pain conditions are located at: https://github.com/sbandar2/CNCP_Trt_Codes
Appendix C. Cohort-specific effects for unadjusted models among all providers, high-volume opioid prescribers, by patient insurer and by provider specialty
The exhibits below show the results of staggered difference-in-differences models for the states that implemented opioid prescribing cap laws in 2017 (“Group 2017”) and the states that implemented these laws in 2018 (“Group 2018”).
C.1. All providers
Average proportion of provider’s patient panel prescribed an opioid, per year
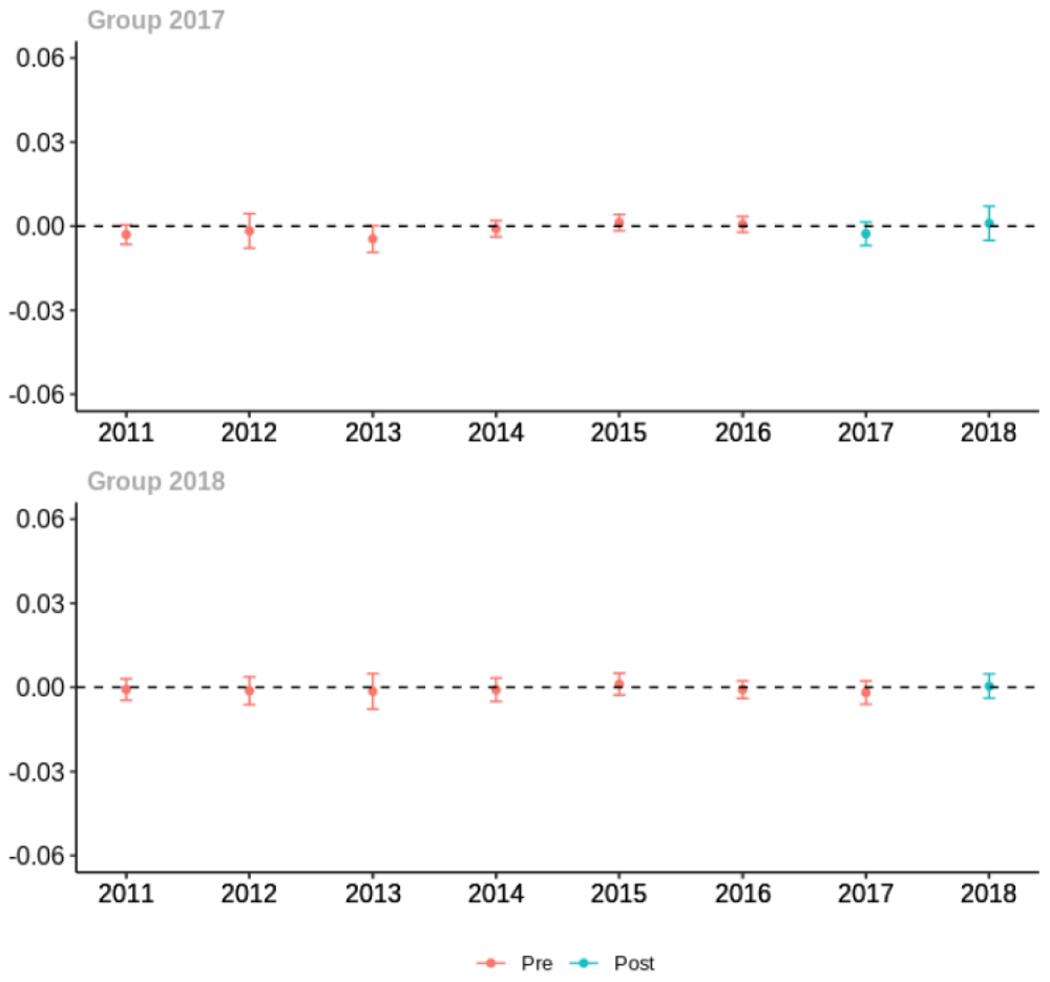
Average proportion of provider’s patient panel prescribed an opioid with days’ supply ≥ 7 days, per year
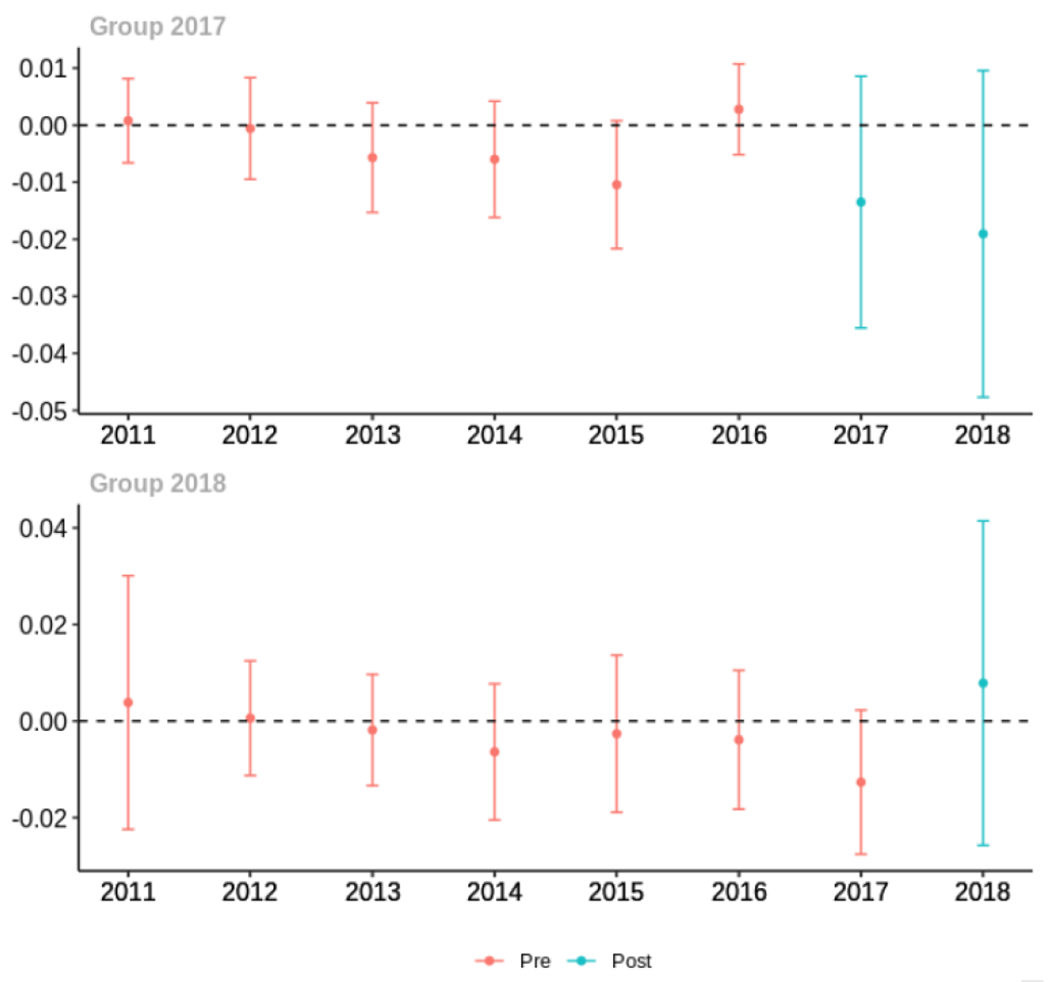
Average proportion of provider’s patient panel with an opioid prescription with MME ≥ 50 per day, per year
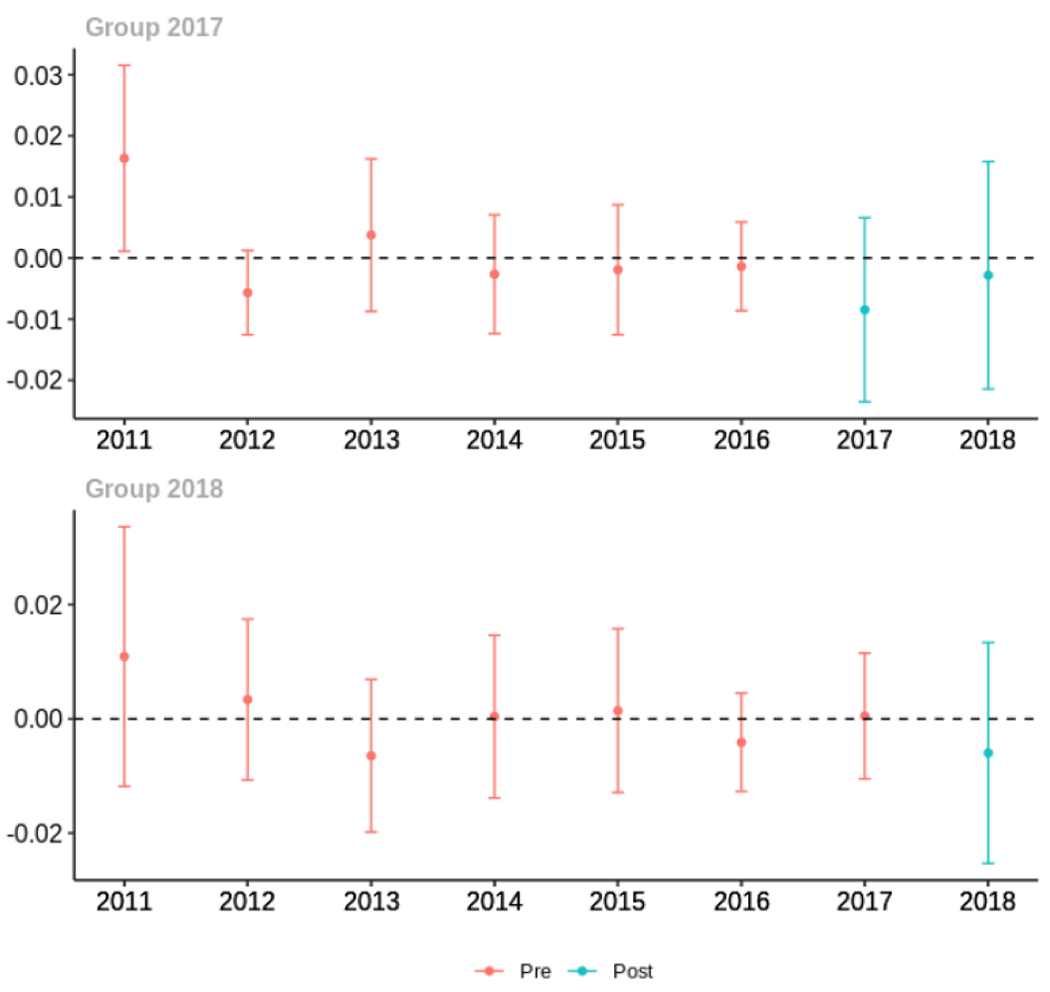
Average days’ supply of opioid prescriptions, per provider’s patient panel prescribed opioids, per year
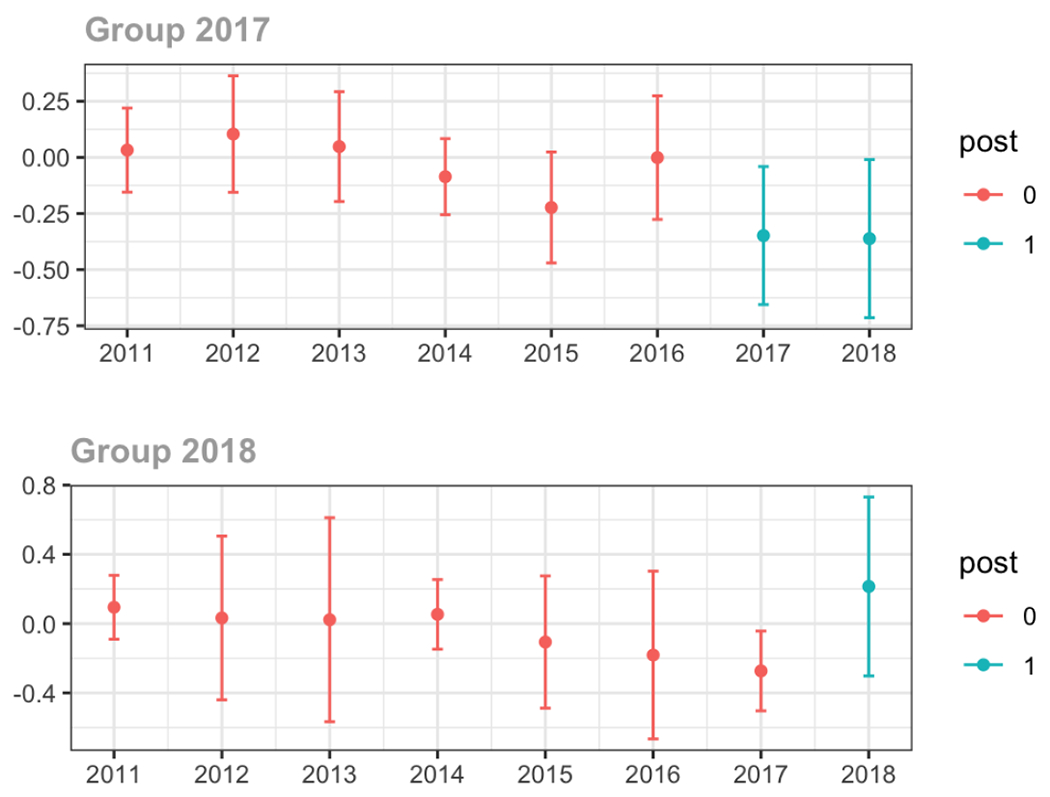
Average MME per day, per provider’s patient panel prescribed opioids, per year
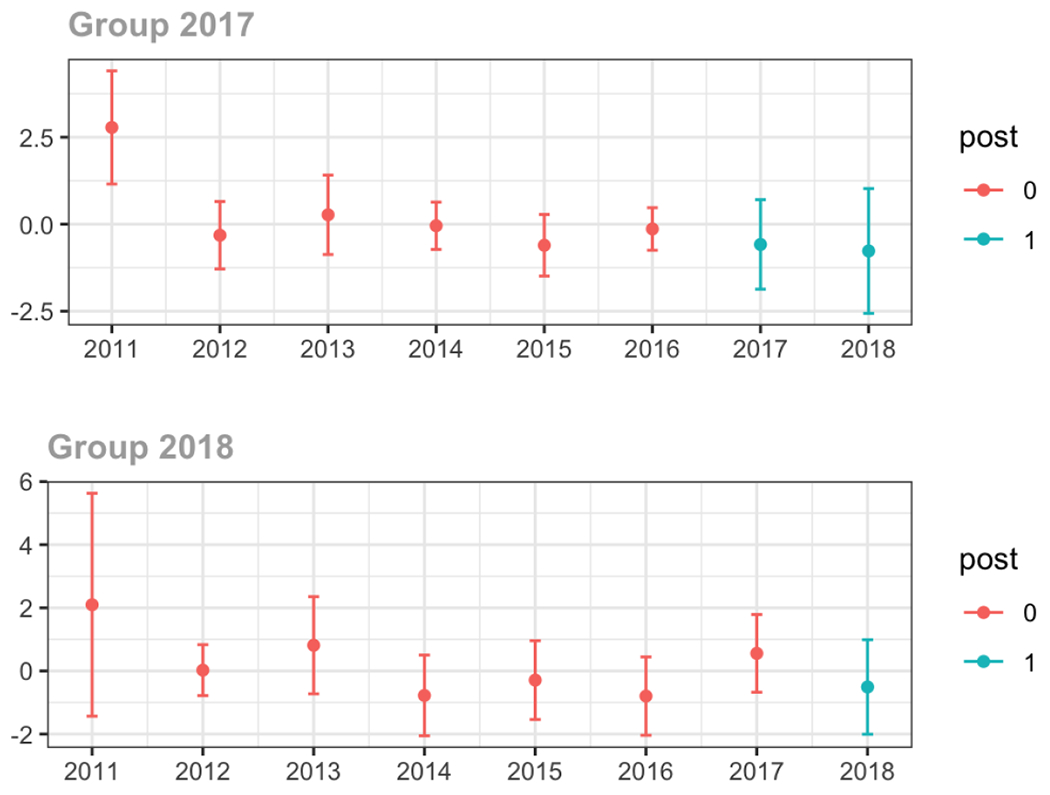
C.2. High volume opioid prescribers
Average proportion of provider’s patient panel prescribed an opioid, per year
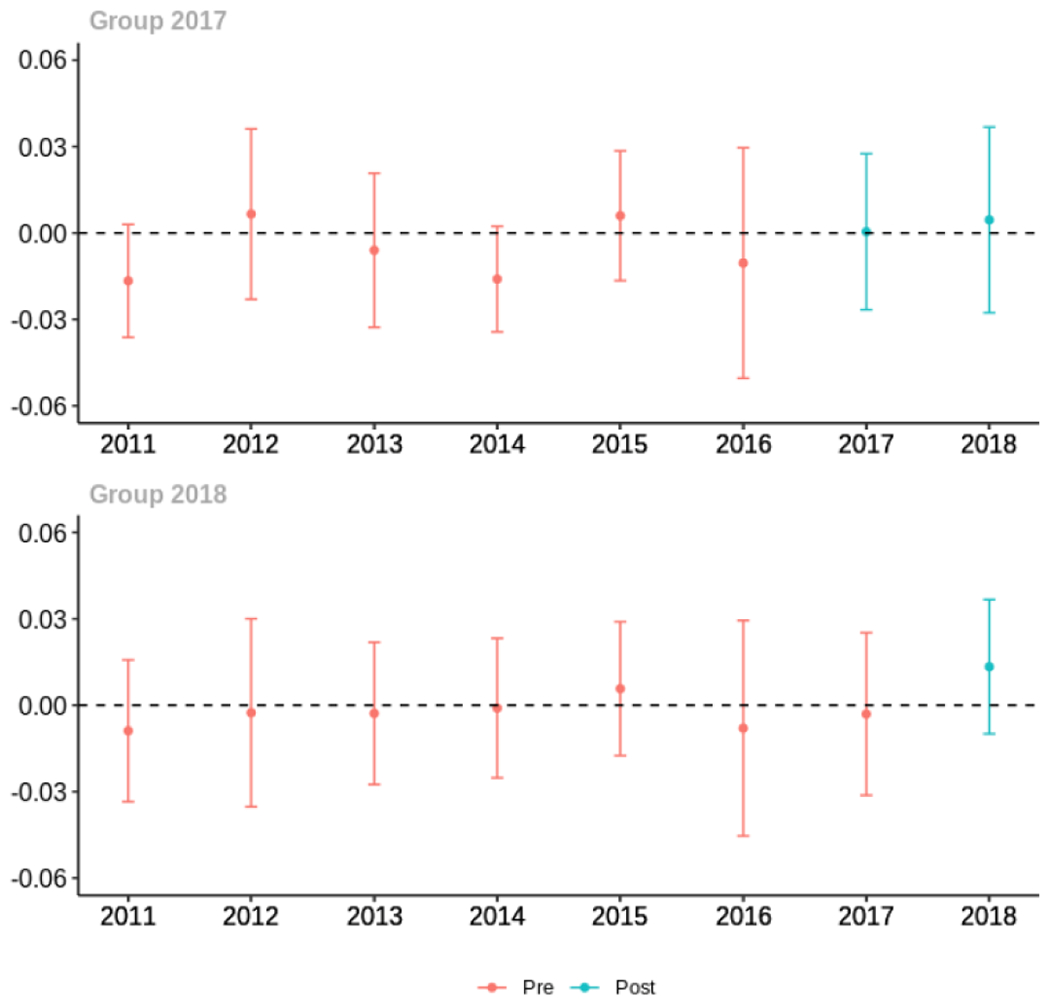
Average proportion of provider’s patient panel prescribed an opioid with days’ supply ≥ 7 days, per year
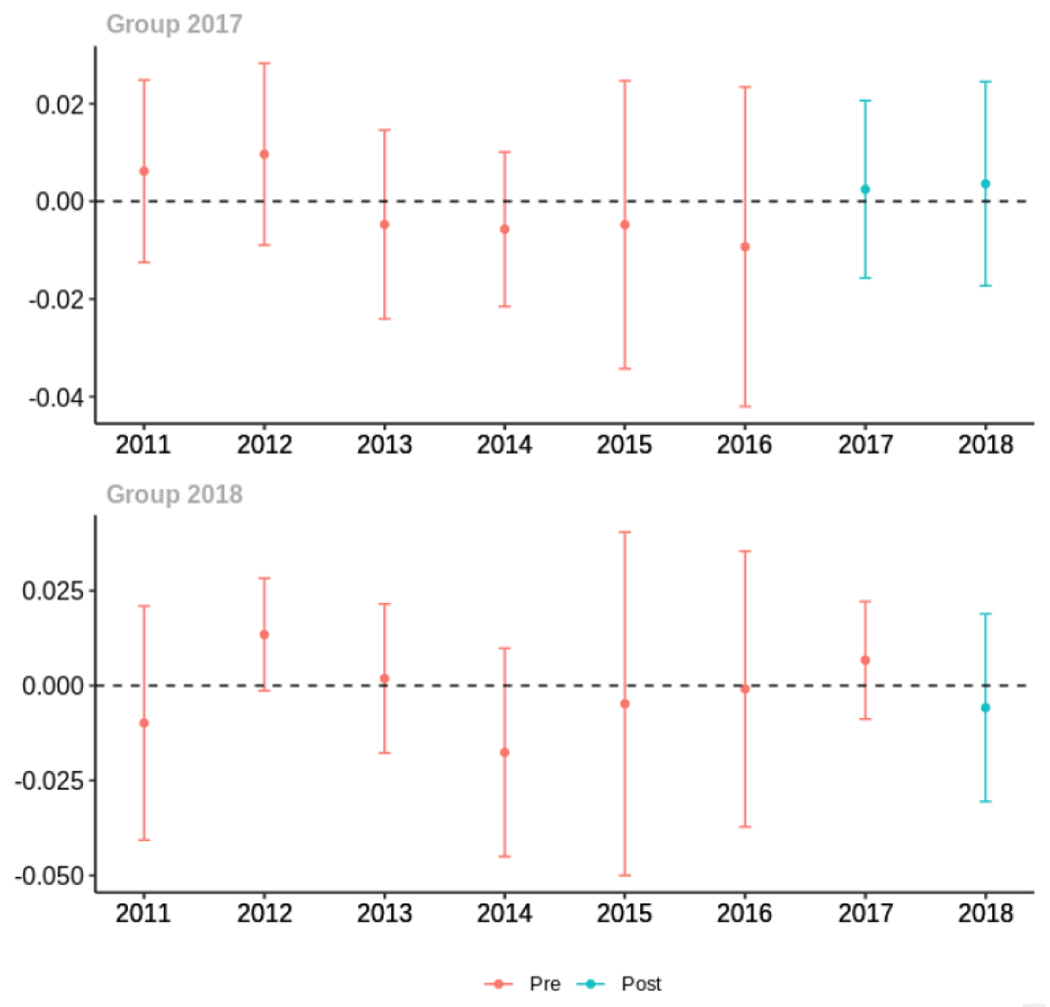
Average proportion of provider’s patient panel with an opioid prescription with MME ≥ 50 per day, per year
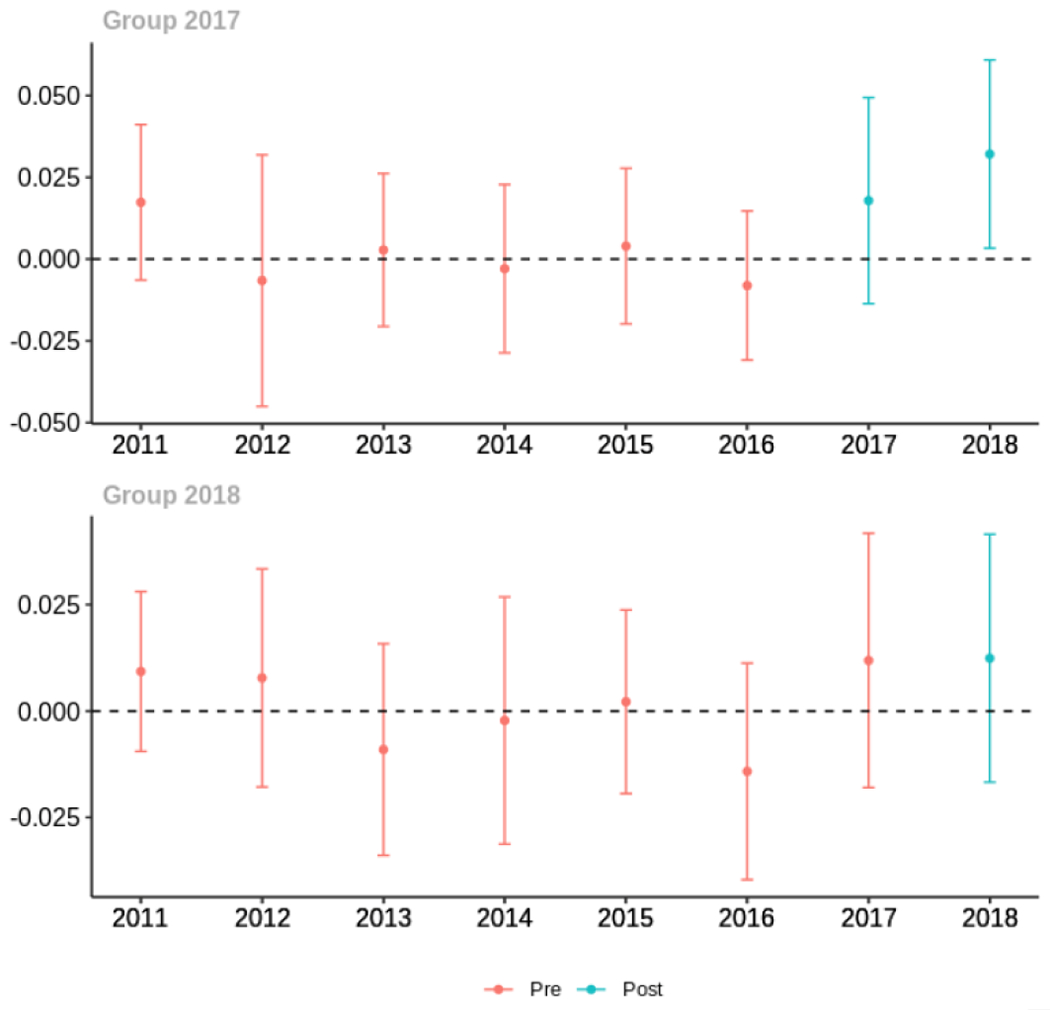
Average days’ supply of opioid prescriptions, per provider’s patient panel prescribed opioids, per year
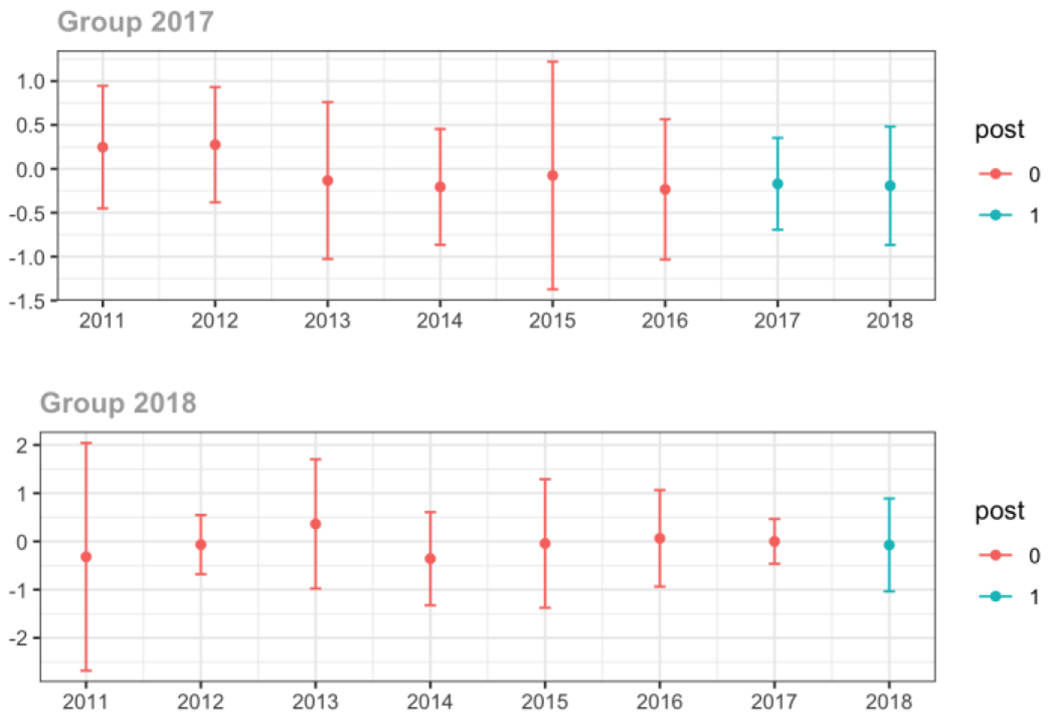
Average MME per day, per provider’s patient panel prescribed opioids, per year
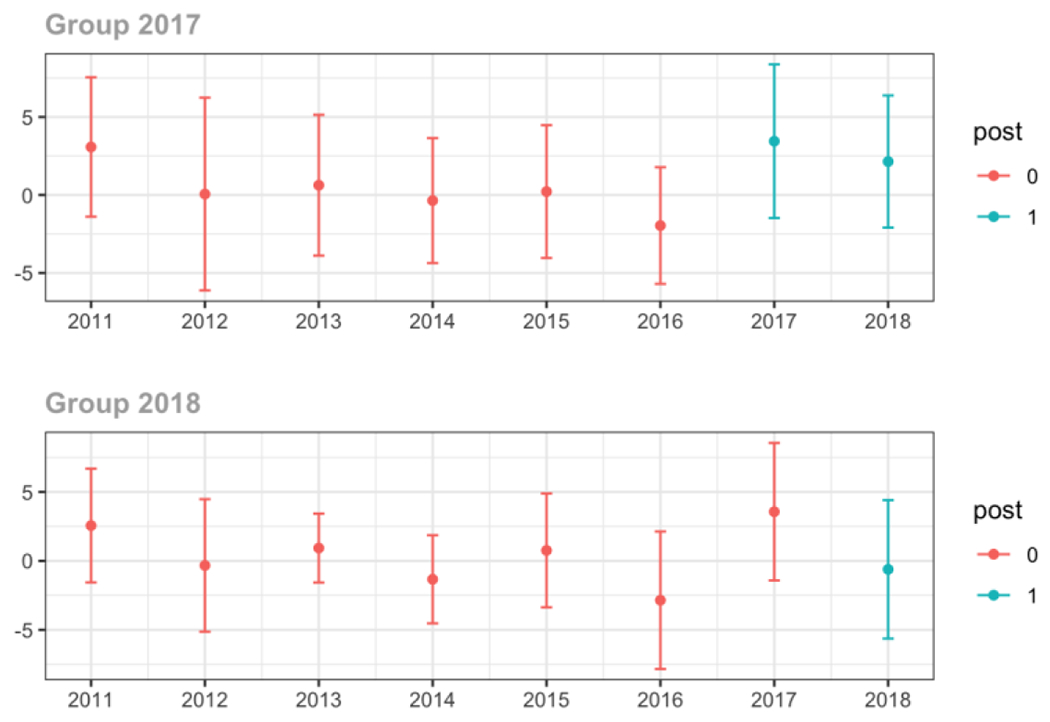
C.3. Provider specialty
Primary Care
Average proportion of provider’s patient panel prescribed an opioid, per year
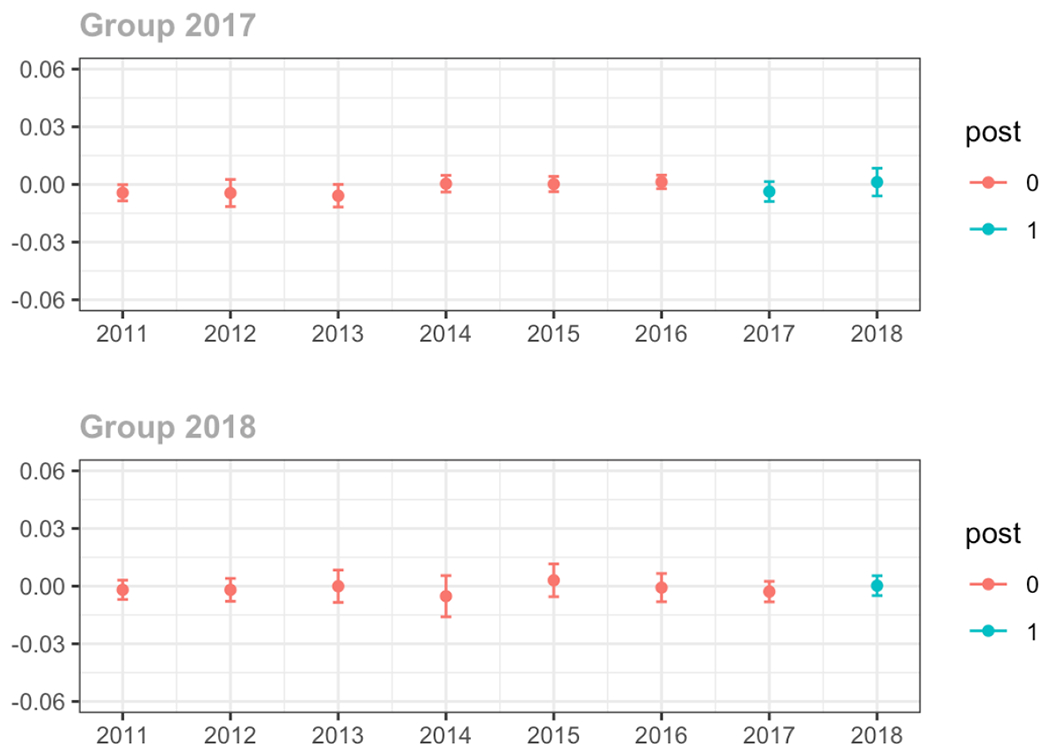
Average proportion of provider’s patient panel prescribed an opioid with days’ supply ≥ 7 days, per year
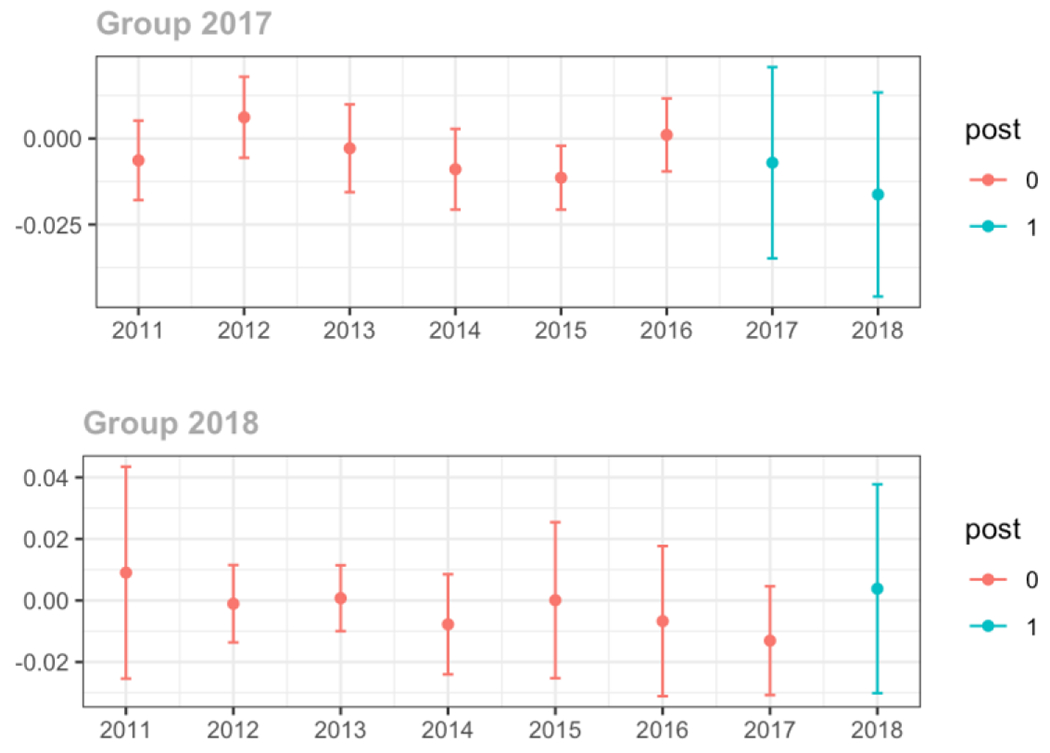
Average proportion of provider’s patient panel with an opioid prescription with MME ≥ 50 per day, per year
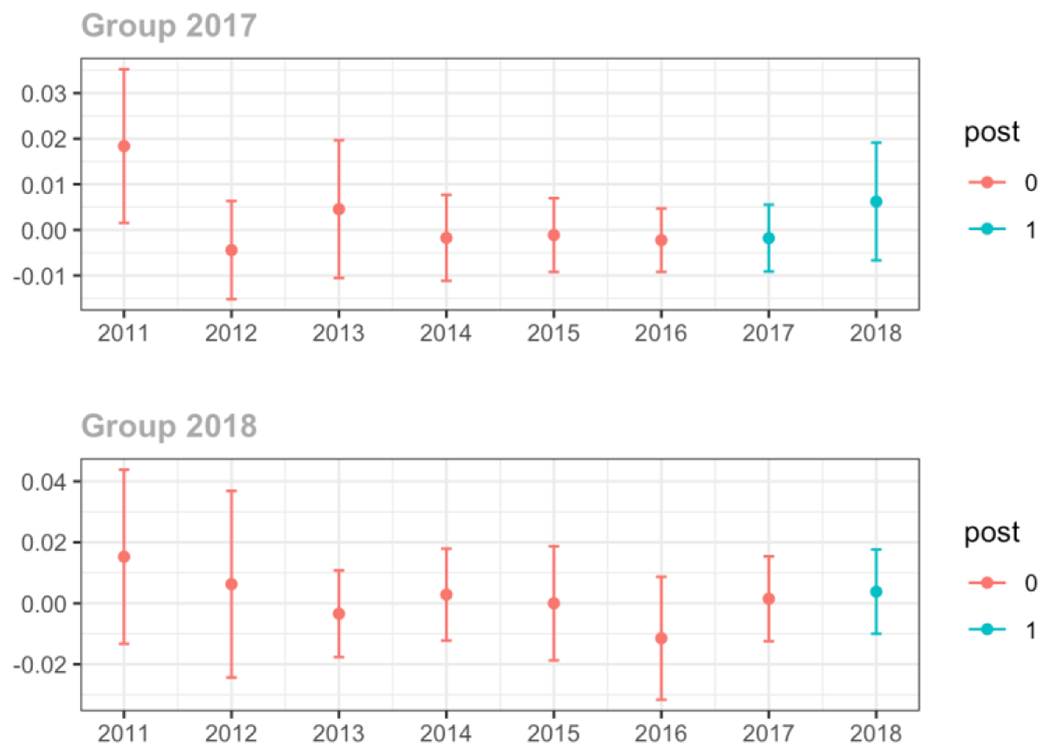
Average days’ supply of opioid prescriptions, per provider’s patient panel prescribed opioids, per year
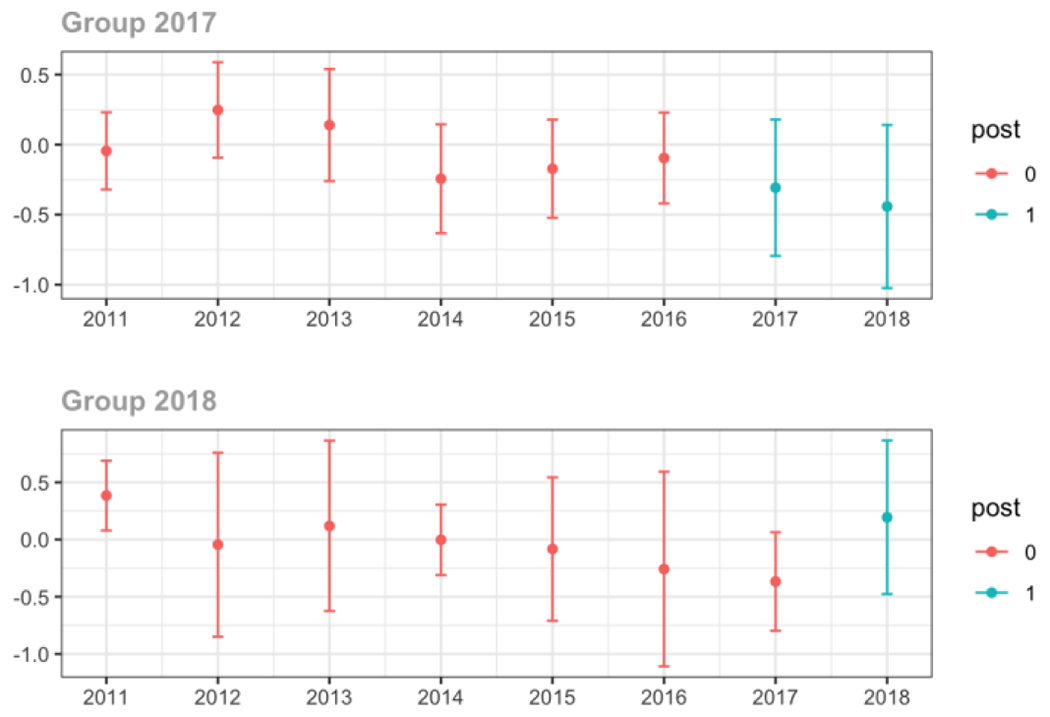
Average MME per day, per provider’s patient panel prescribed opioids, per year
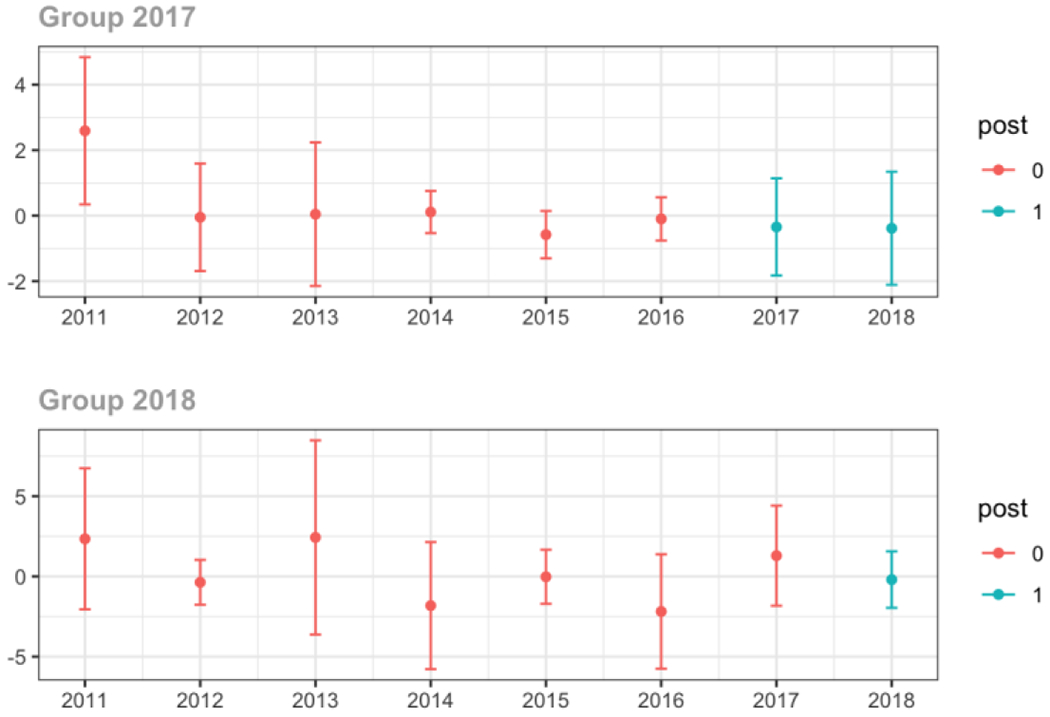
Emergency Medicine
Average proportion of provider’s patient panel prescribed an opioid, per year
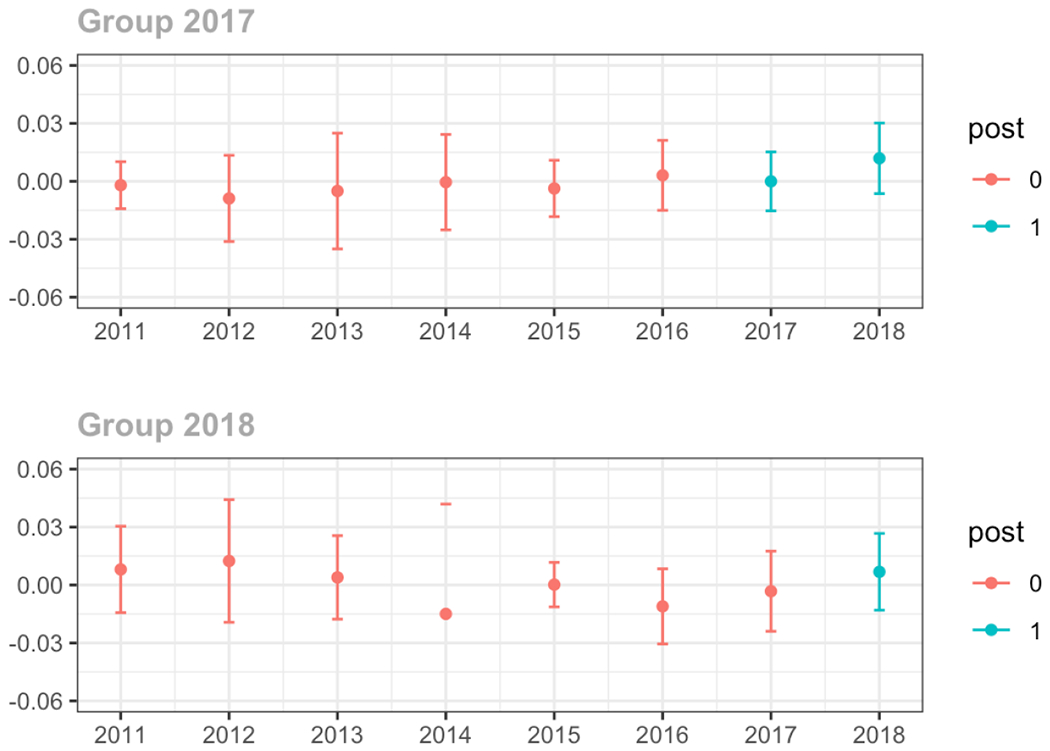
Average proportion of provider’s patient panel prescribed an opioid with days’ supply ≥ 7 days, per year
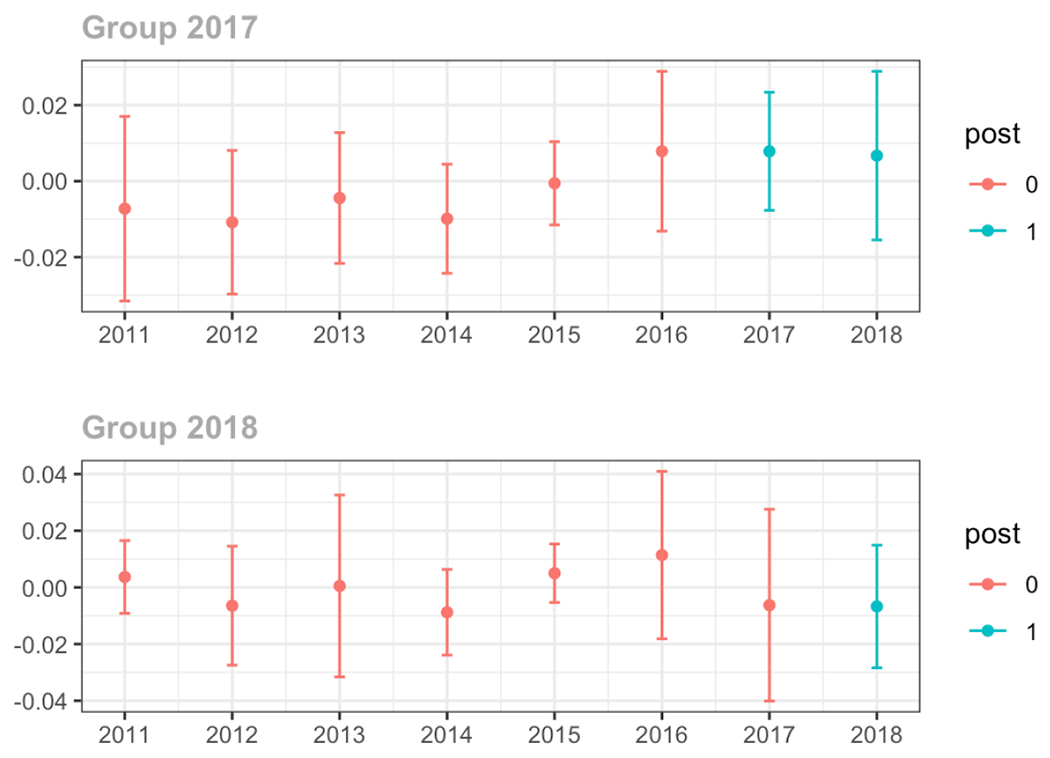
Average proportion of provider’s patient panel with an opioid rx with MME ≥ 50 per day, per year
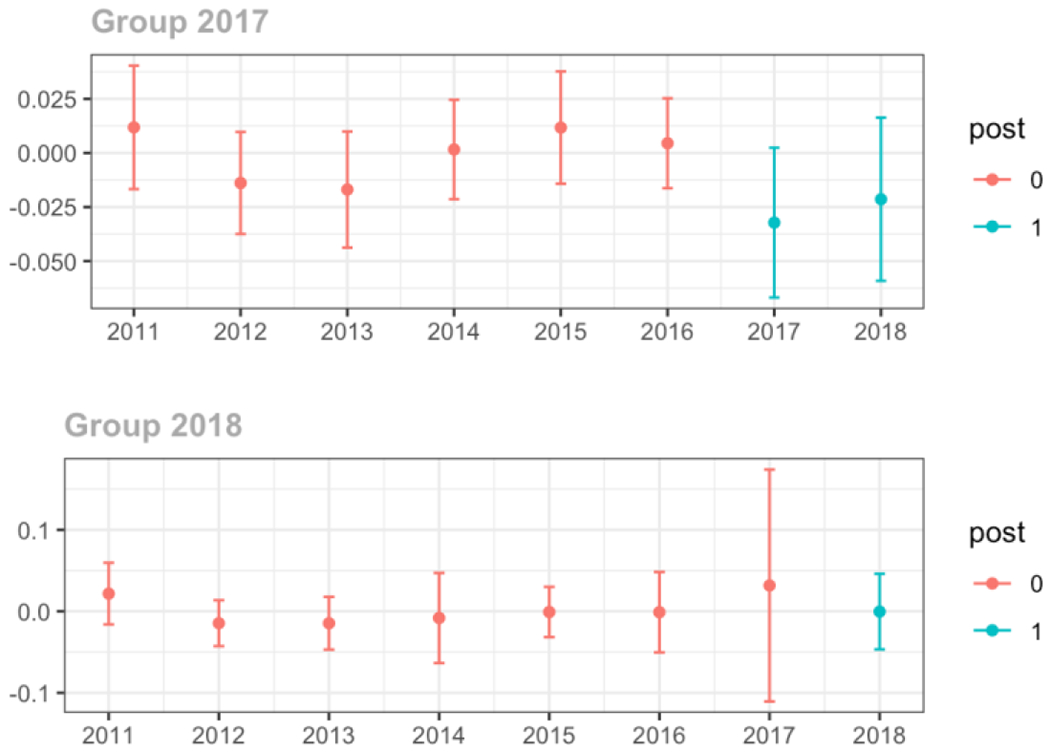
Average days’ supply of opioid prescriptions, per provider’s patient panel prescribed opioids, per year
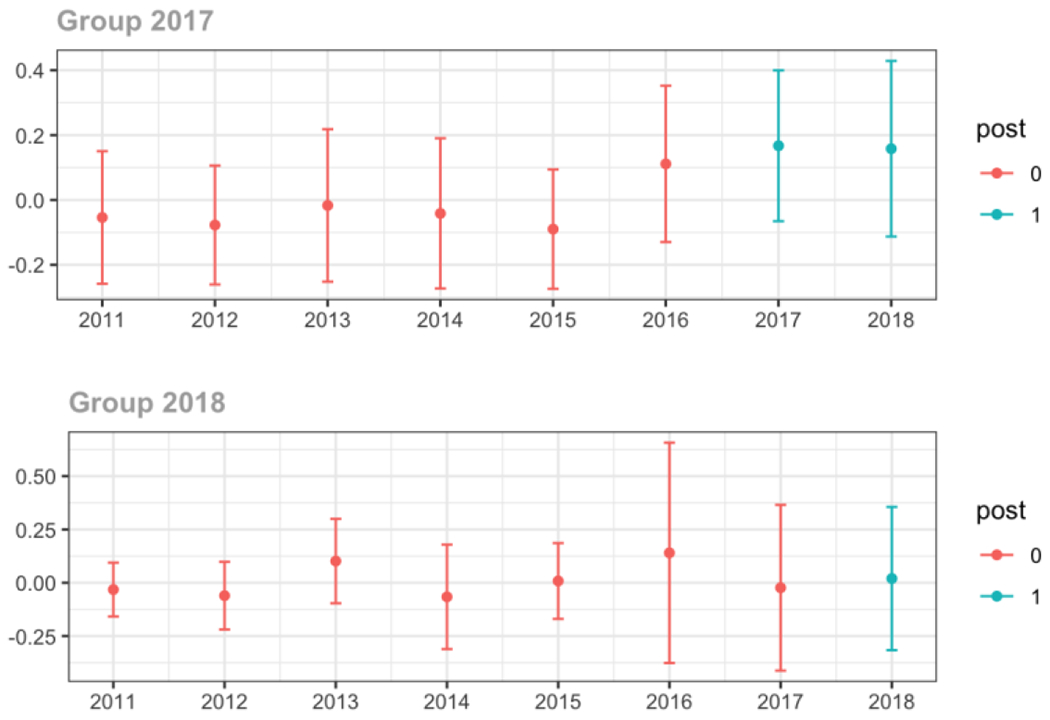
Average MME per day, per provider’s patient panel prescribed opioids, per year
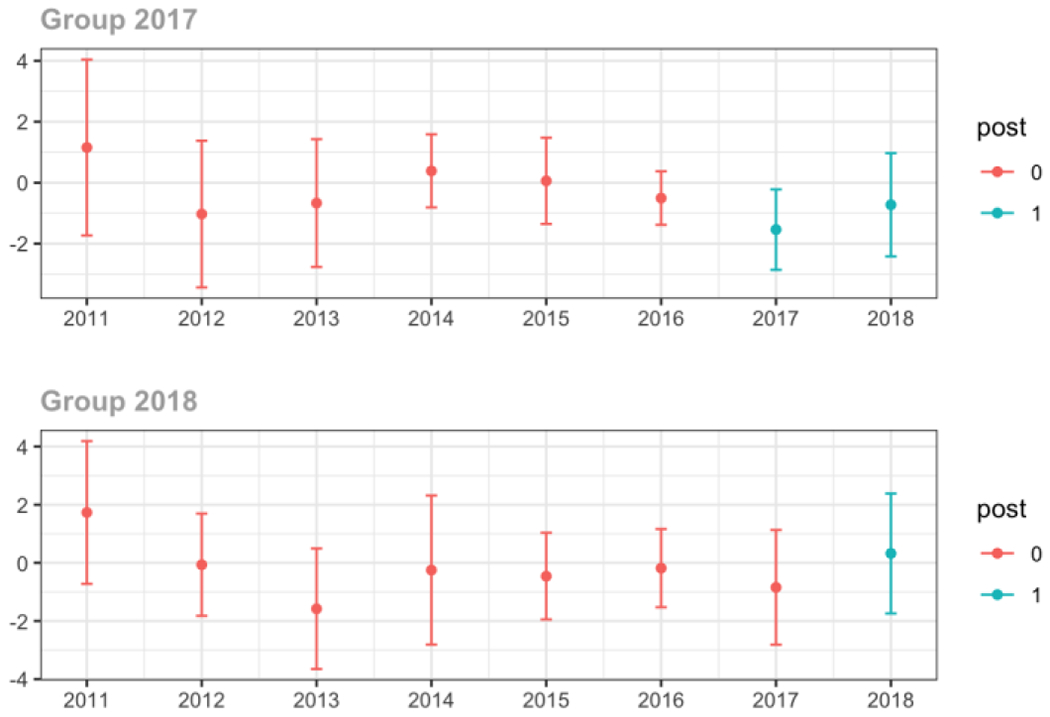
Surgery
Average proportion of provider’s patient panel prescribed an opioid, per year
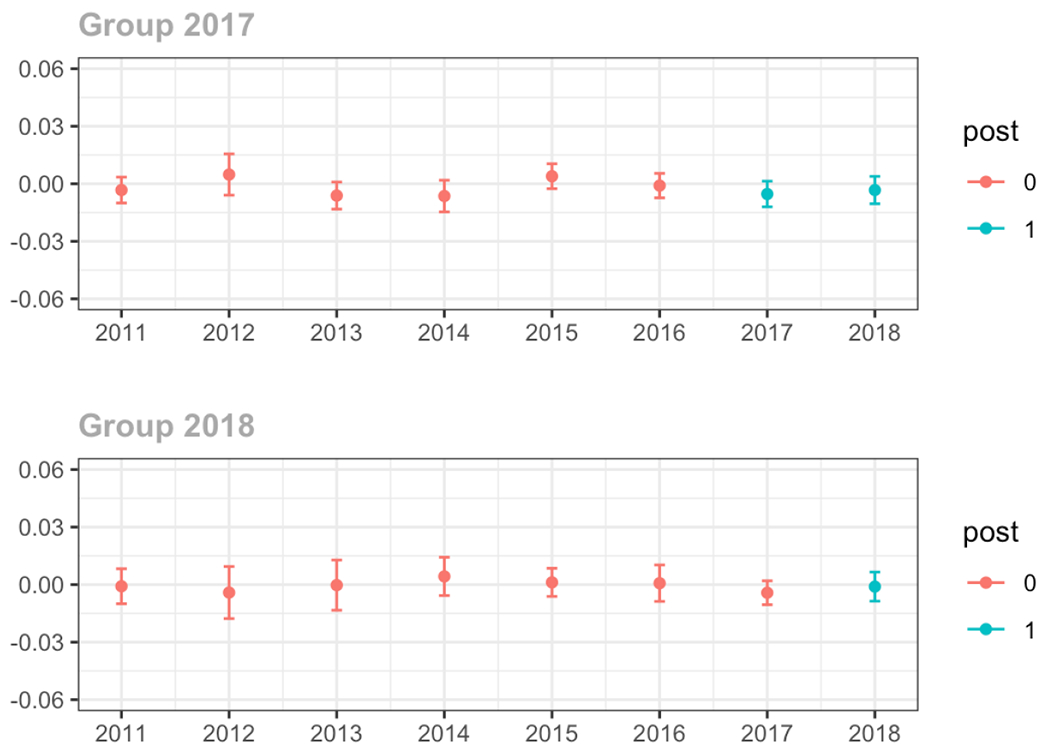
Average proportion of provider’s patient panel prescribed an opioid with days’ supply ≥ 7 days, per year
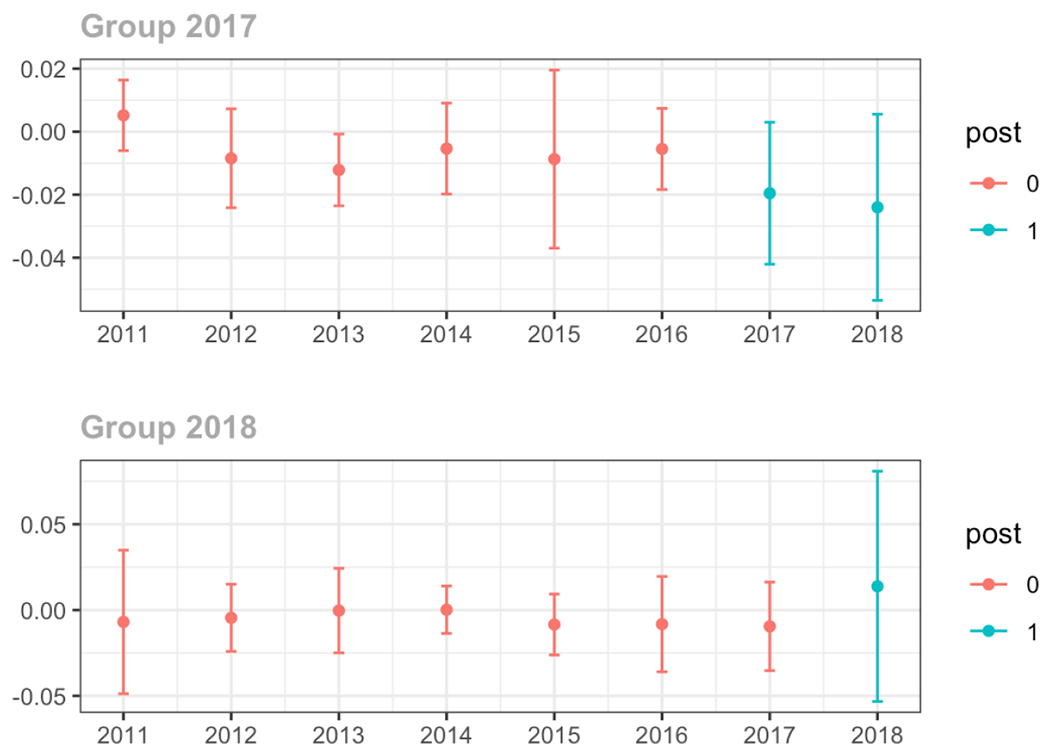
Average proportion of provider’s patient panel with an opioid prescription with MME ≥ 50 per day, per year
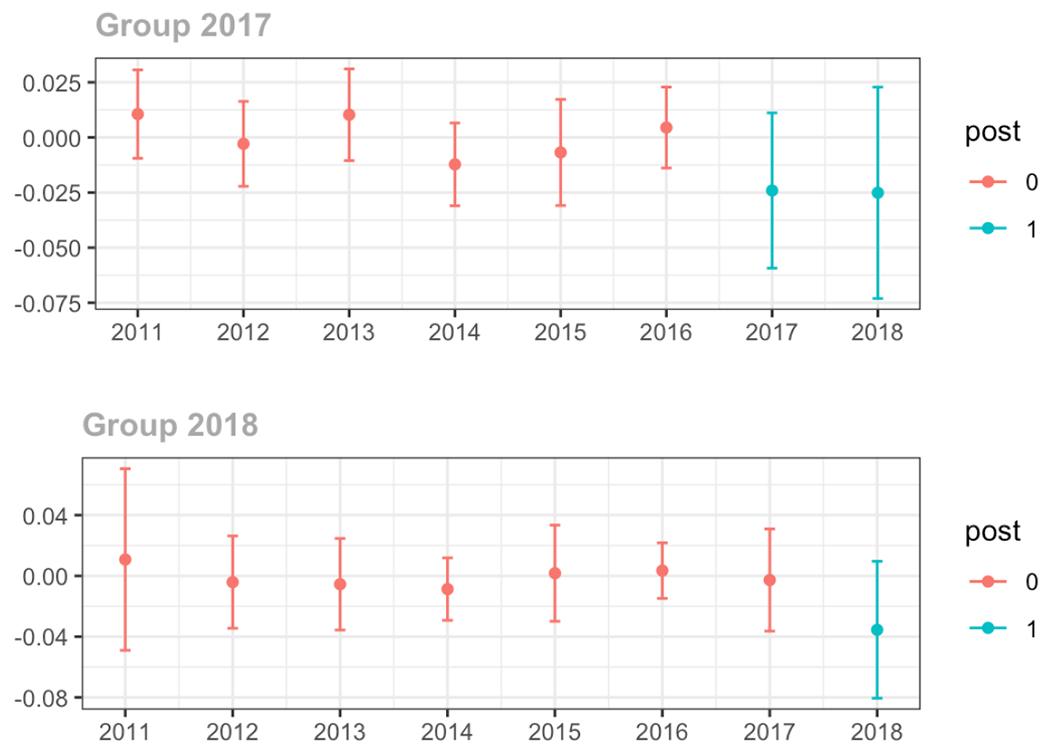
Average days’ supply of opioid prescriptions, per provider’s patient panel prescribed opioids, per year
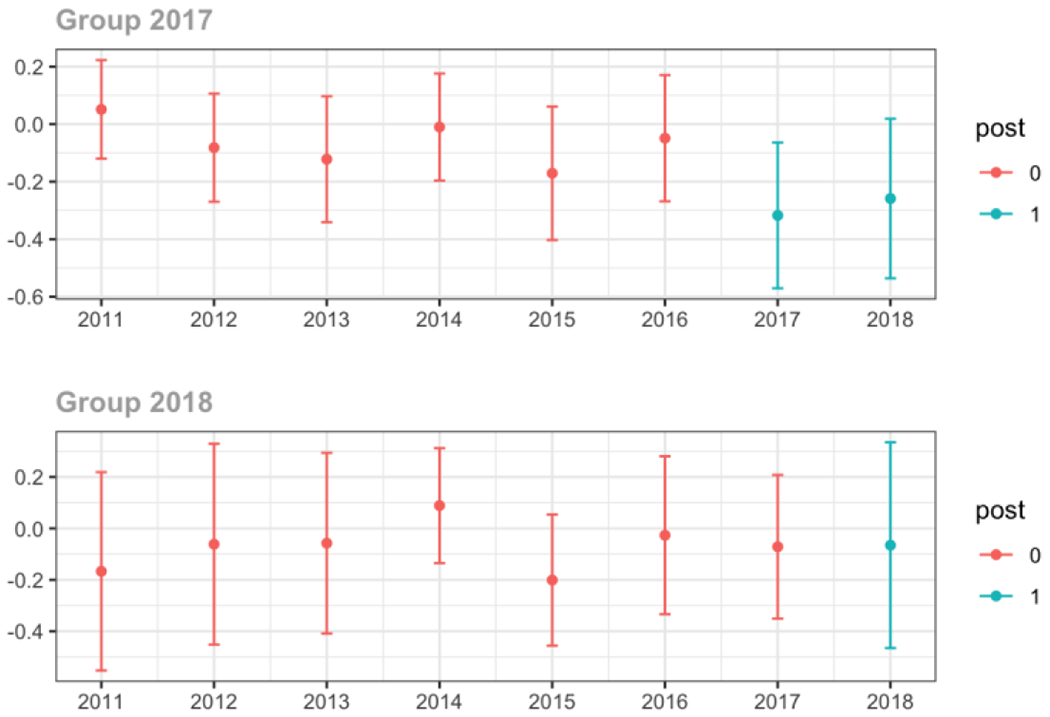
Average MME per day, per provider’s patient panel prescribed opioids, per year
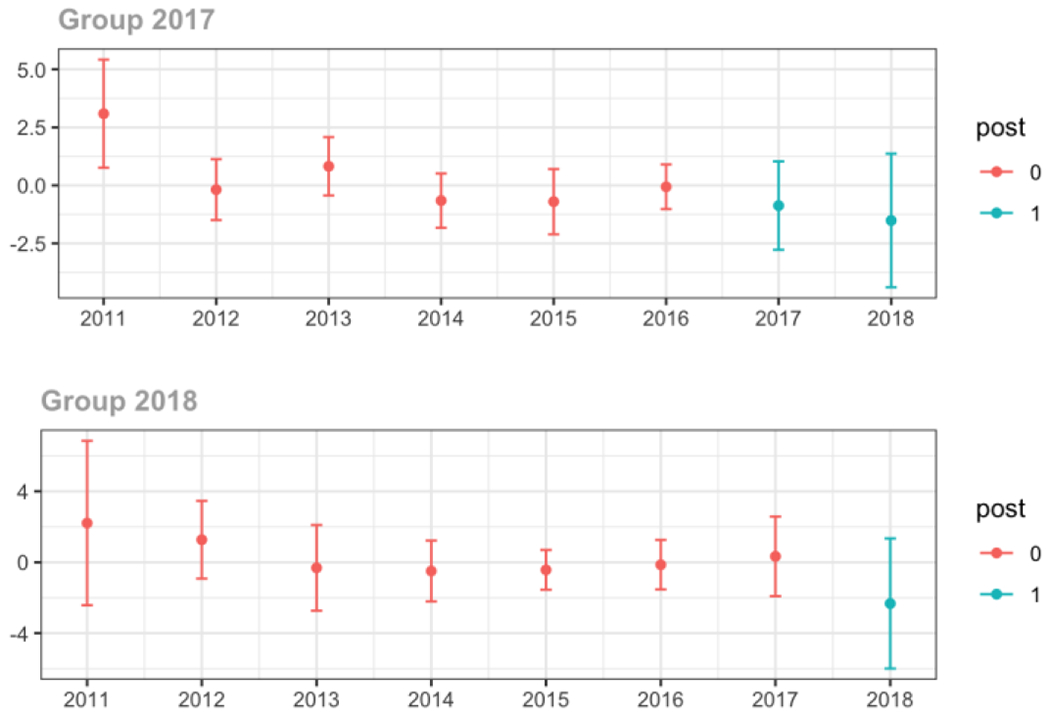
Pain Specialist
Average proportion of provider’s patient panel prescribed an opioid, per year
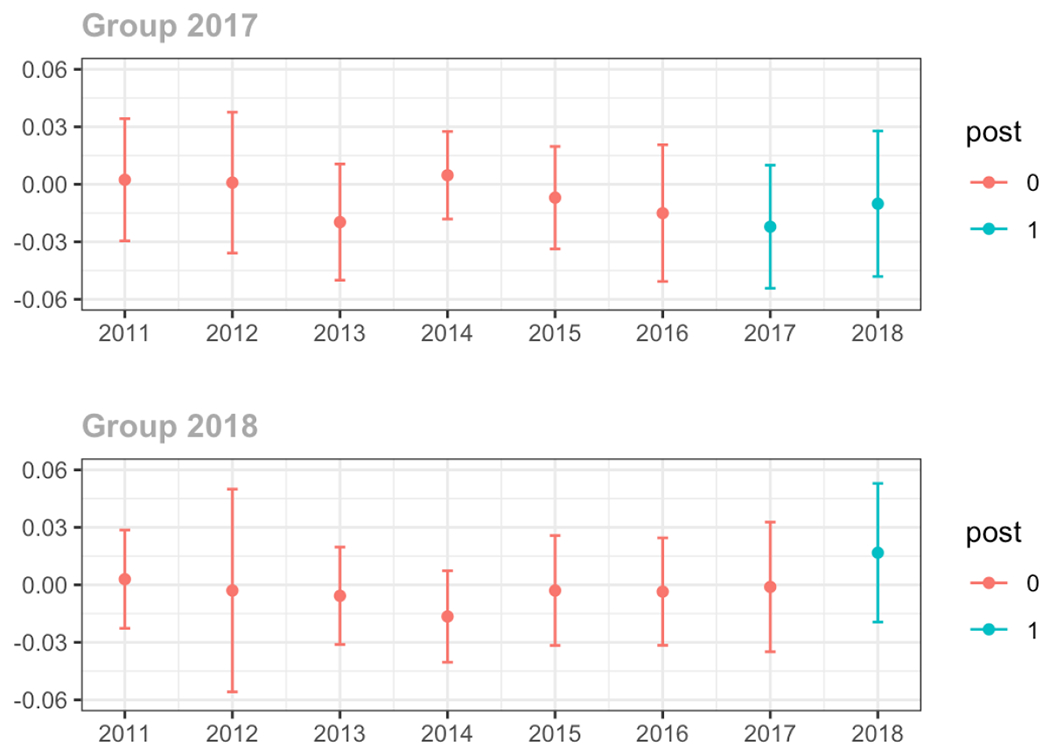
Average proportion of provider’s patient panel prescribed an opioid with days’ supply ≥ 7 days, per year
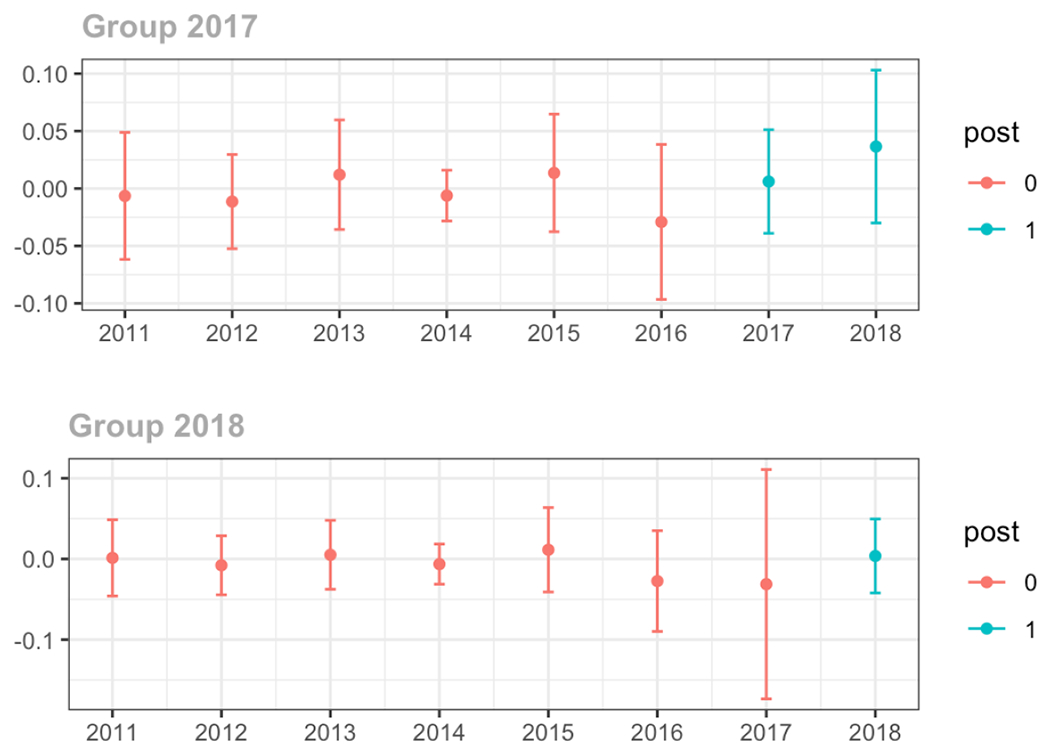
Average proportion of provider’s patient panel with an opioid prescription with MME ≥ 50 per day, per year
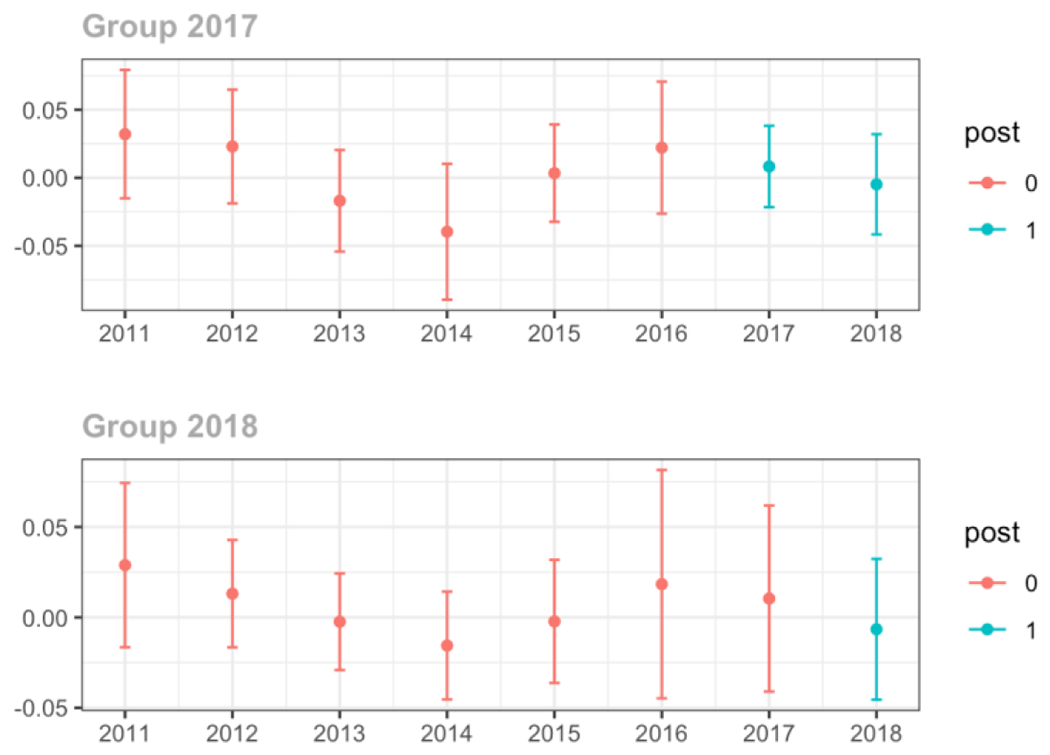
Average days’ supply of opioid prescriptions, per provider’s patient panel prescribed opioids, per year

Average MME per day, per provider’s patient panel prescribed opioids, per year
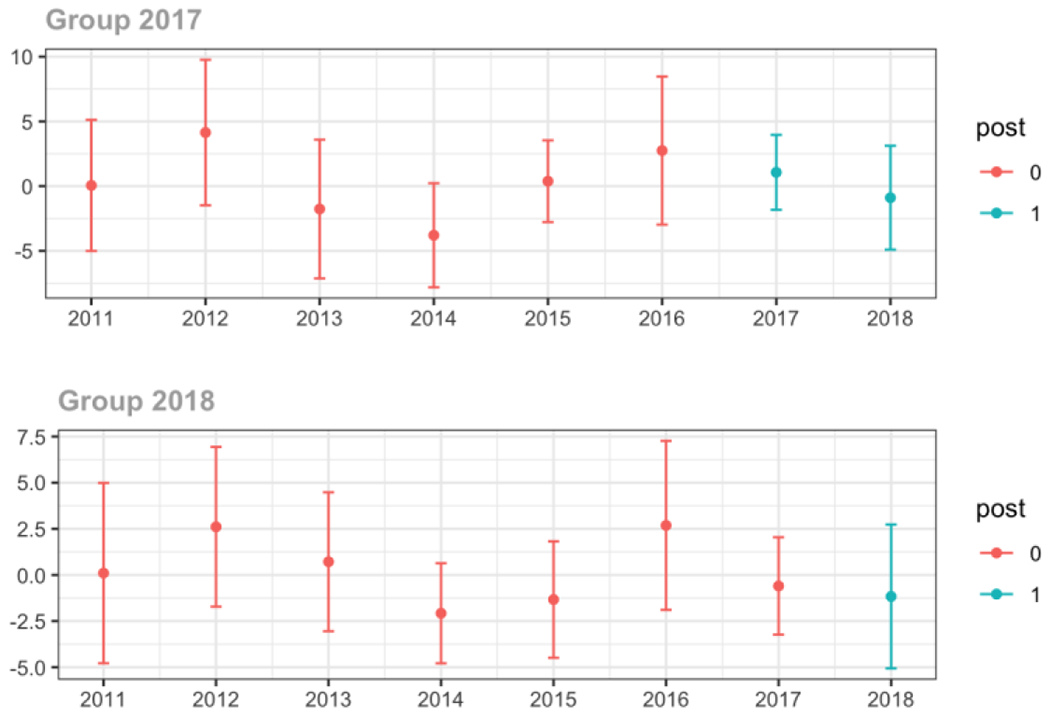
Anesthesiology/Neurology/Physical Medicine & Rehabilitation
Average proportion of provider’s patient panel prescribed an opioid, per year
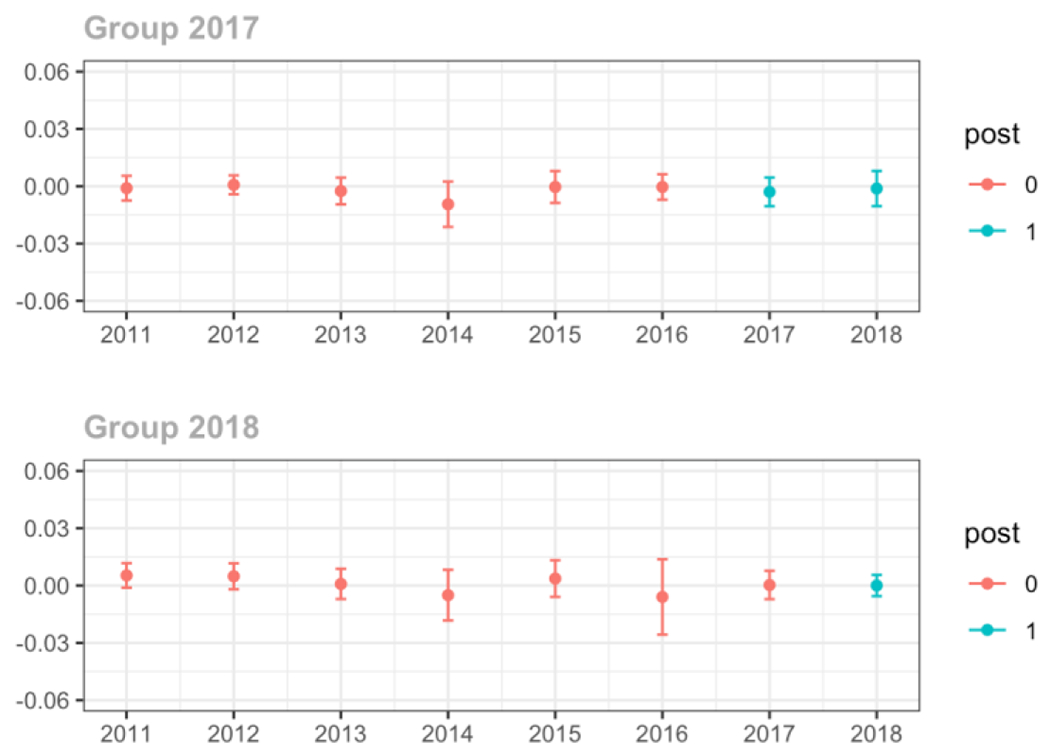
Average proportion of provider’s patient panel prescribed an opioid with days’ supply ≥ 7 days, per year
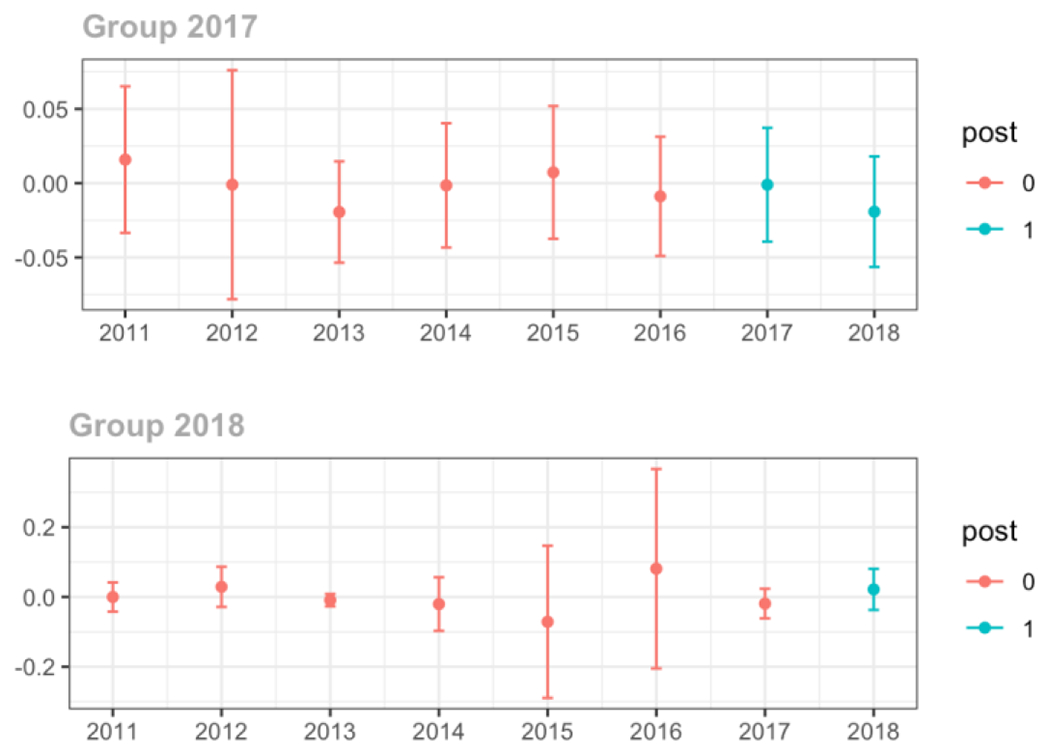
Average proportion of provider’s patient panel with an opioid prescription with MME ≥ 50 per day, per year
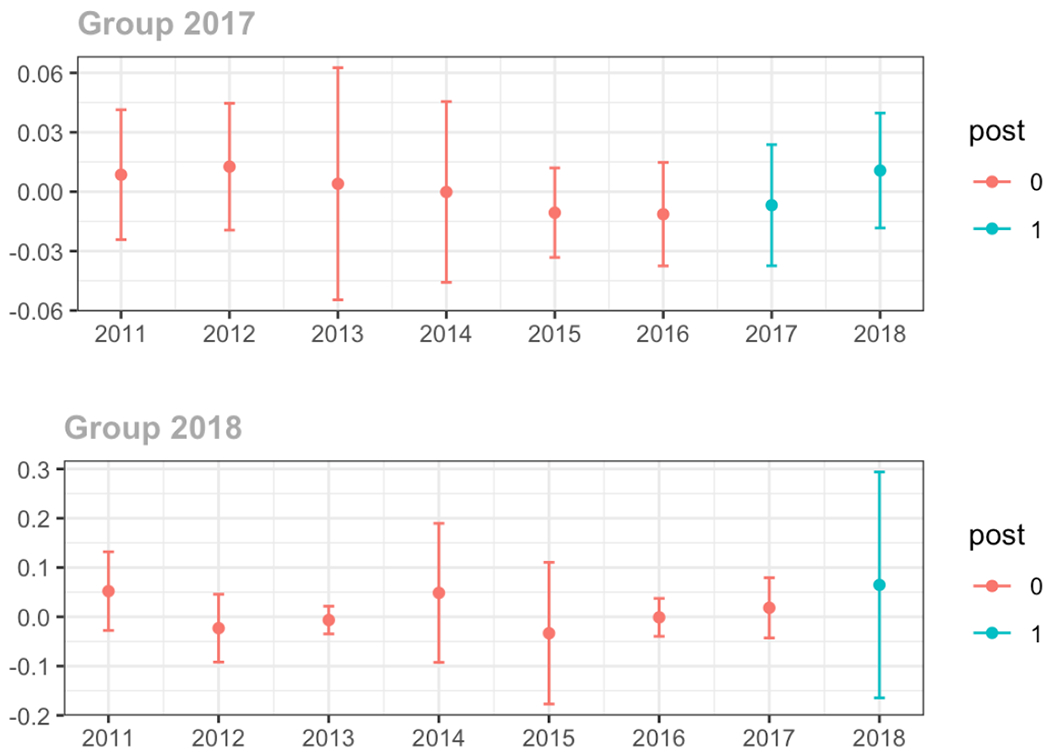
Average days’ supply of opioid prescriptions, per provider’s patient panel prescribed opioids, per year
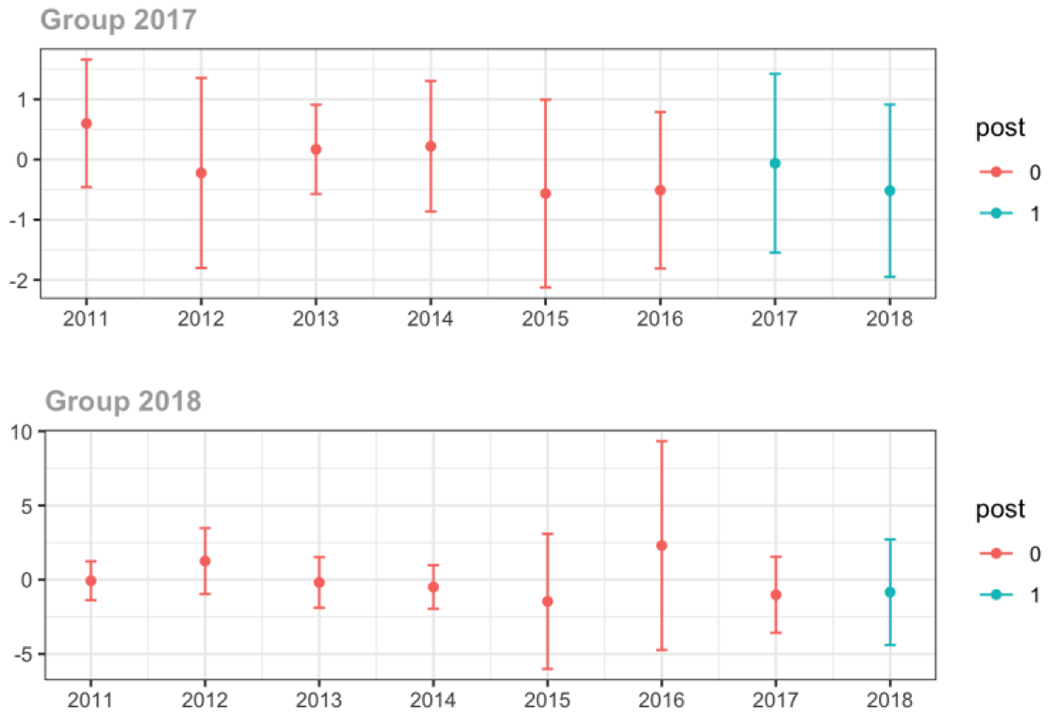
Average MME per day, per provider’s patient panel prescribed opioids, per year
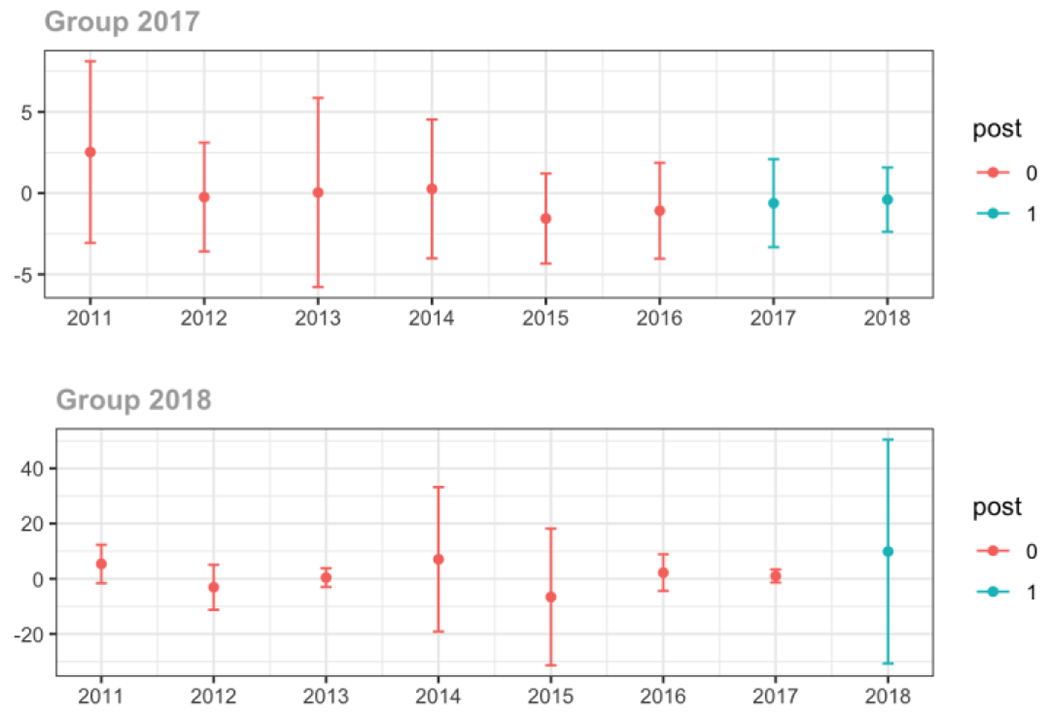
C.4. Patient insurer
Private
Average proportion of provider’s patient panel prescribed an opioid, per year
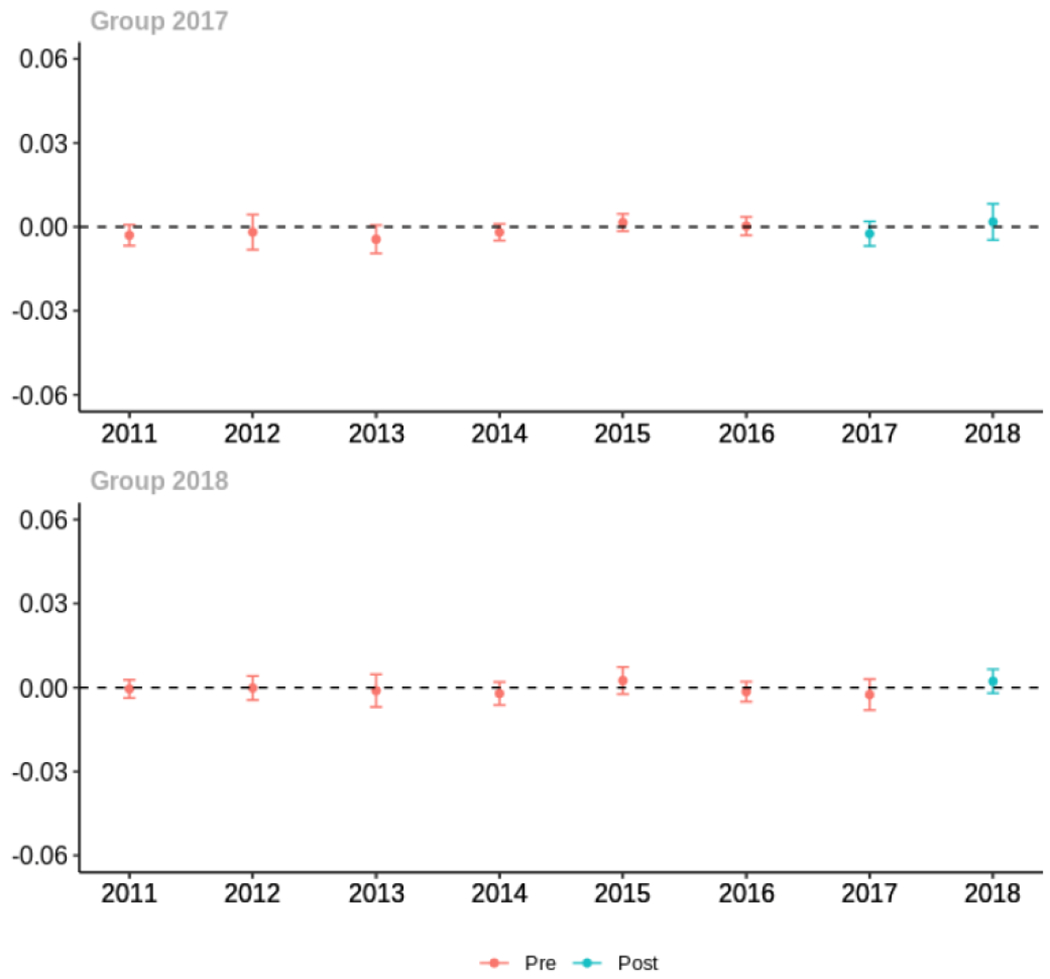
Average proportion of provider’s patient panel prescribed an opioid with days’ supply ≥ 7 days, per year
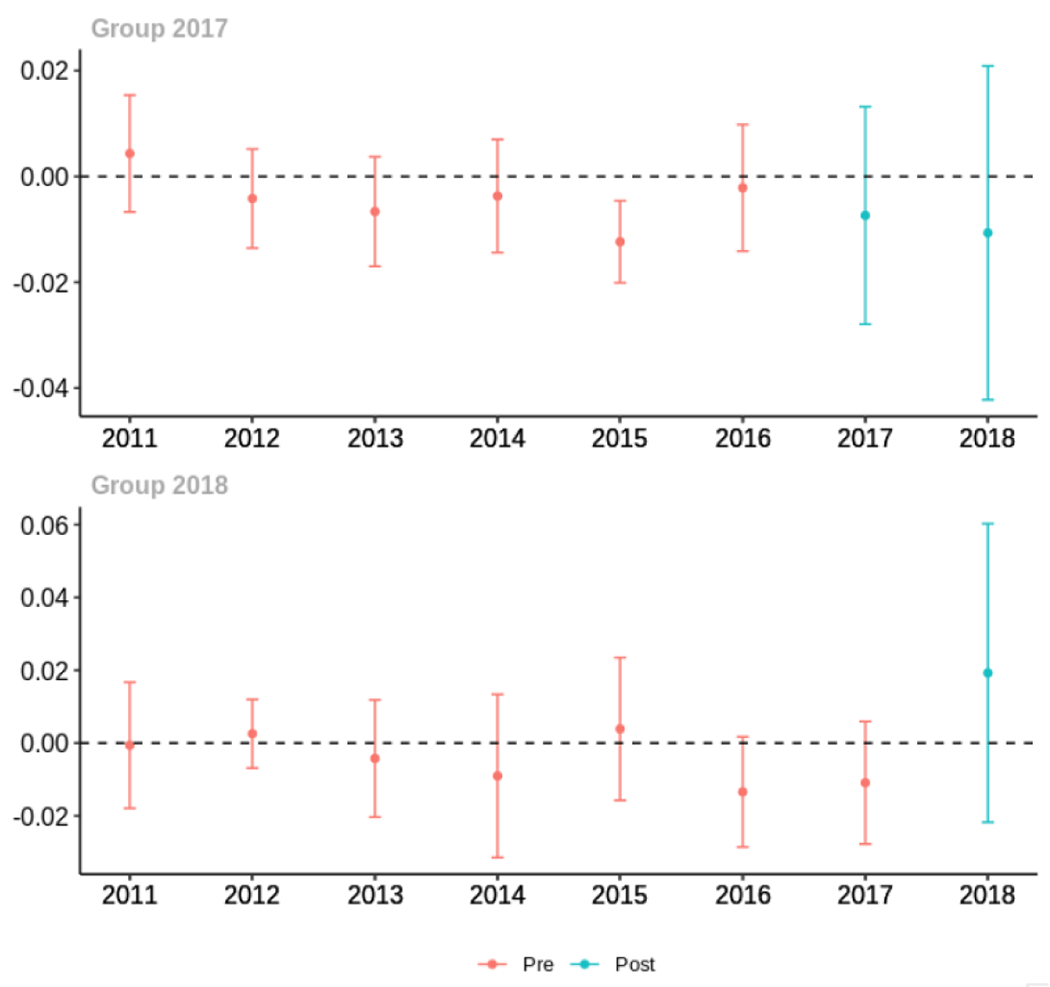
Average proportion of provider’s patient panel with an opioid prescription with MME ≥ 50 per day, per year

Average days’ supply of opioid prescriptions, per provider’s patient panel prescribed opioids, per year
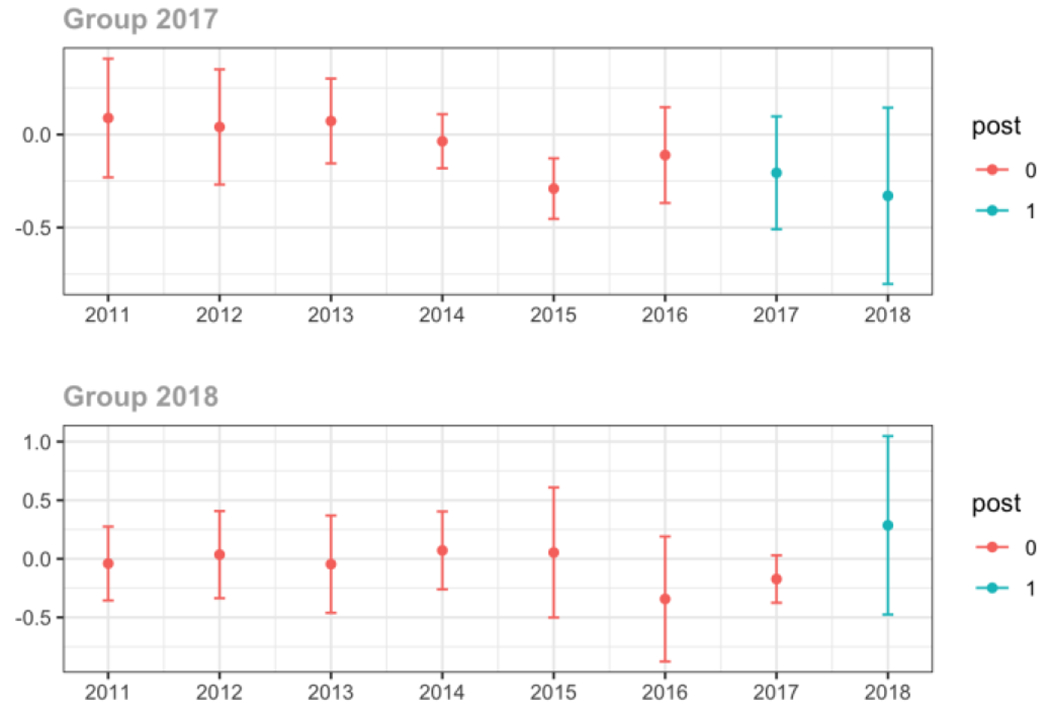
Average MME per day, per provider’s patient panel prescribed opioids, per year
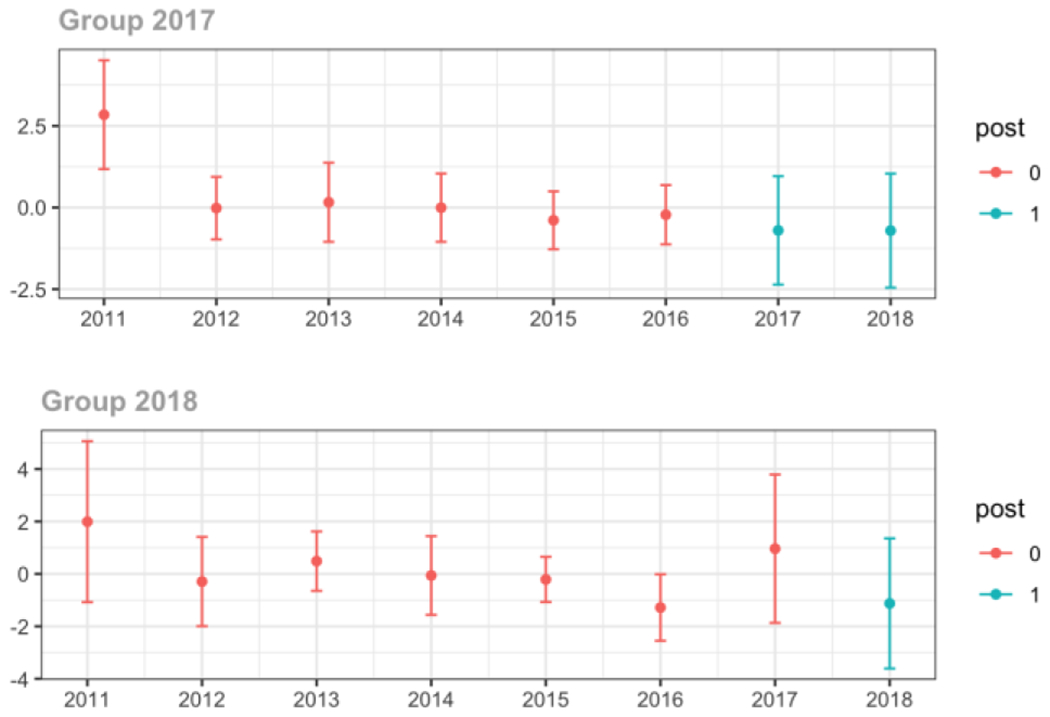
Medicare
Average proportion of provider’s patient panel prescribed an opioid, per year
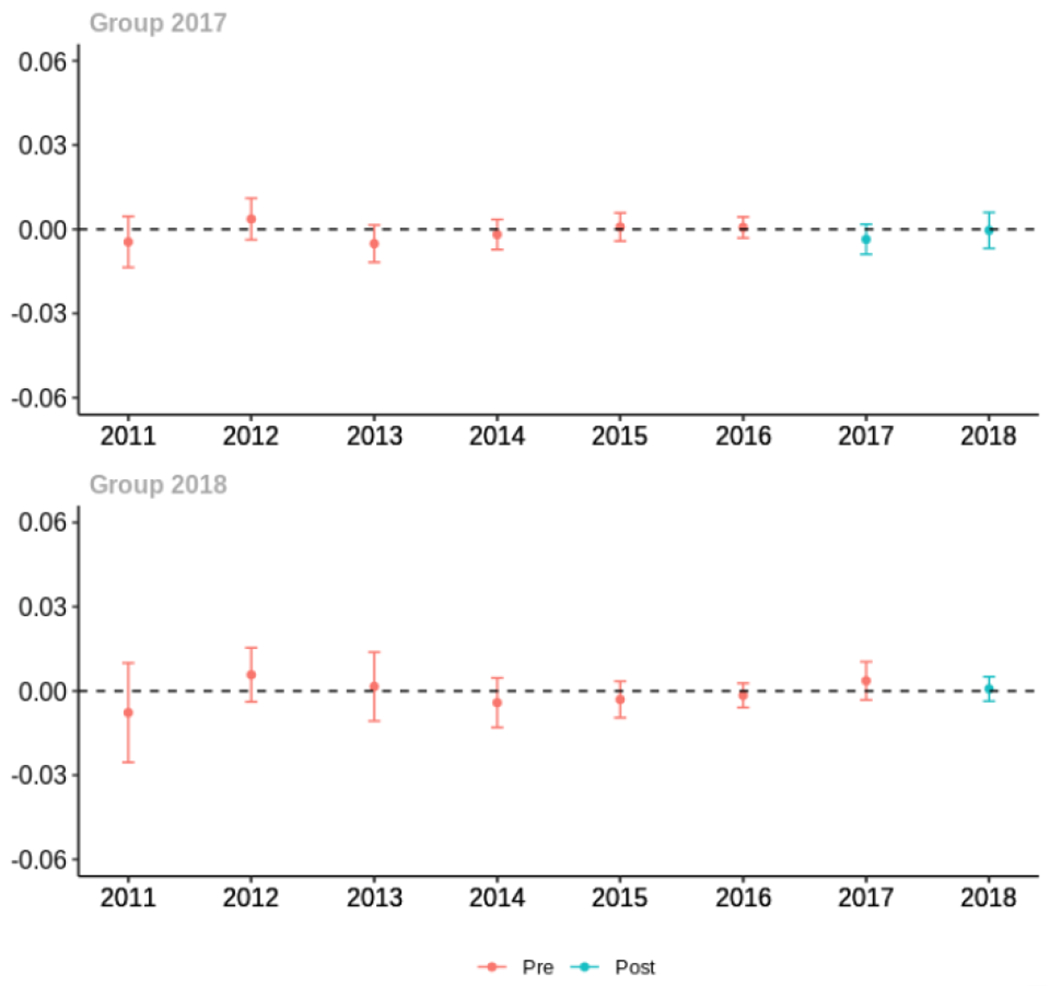
Average proportion of provider’s patient panel prescribed an opioid with days’ supply ≥ 7 days, per year
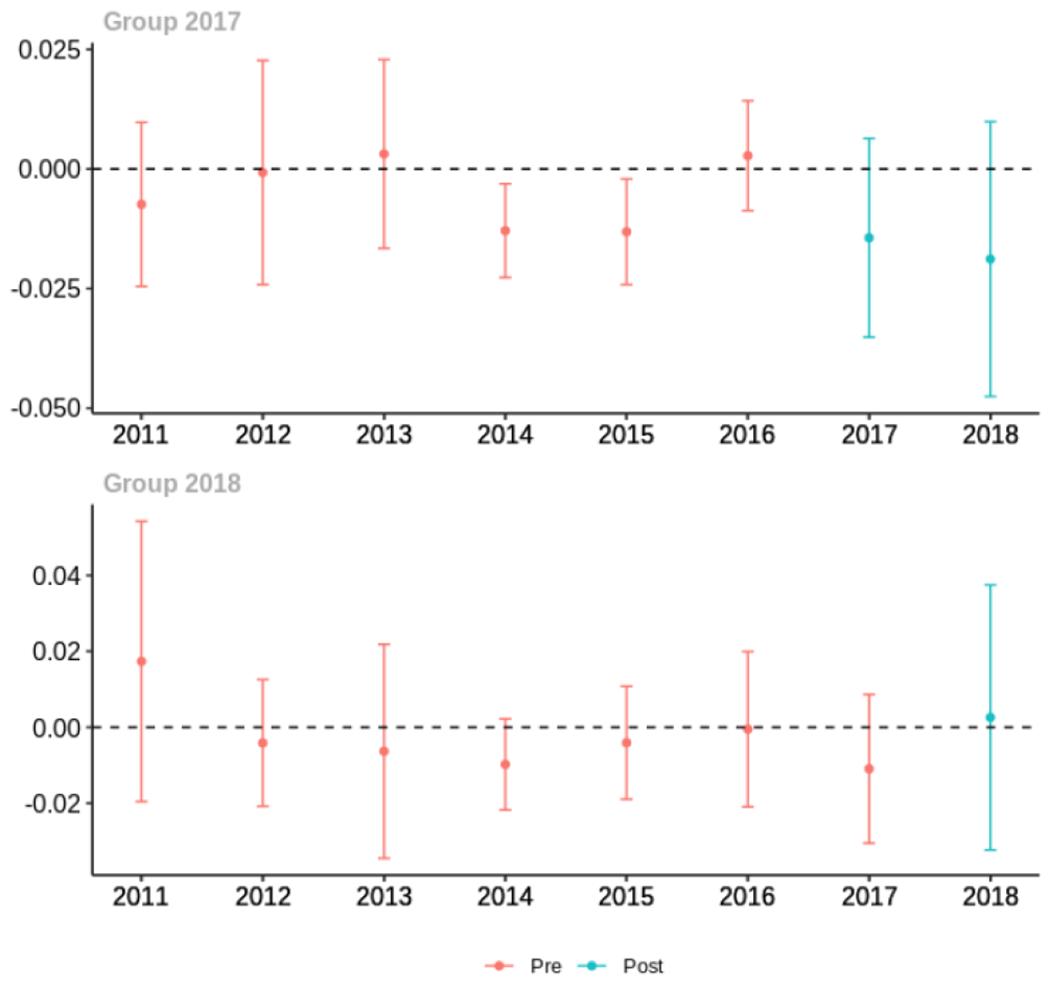
Average proportion of provider’s patient panel with an opioid prescription with MME ≥ 50 per day, per year
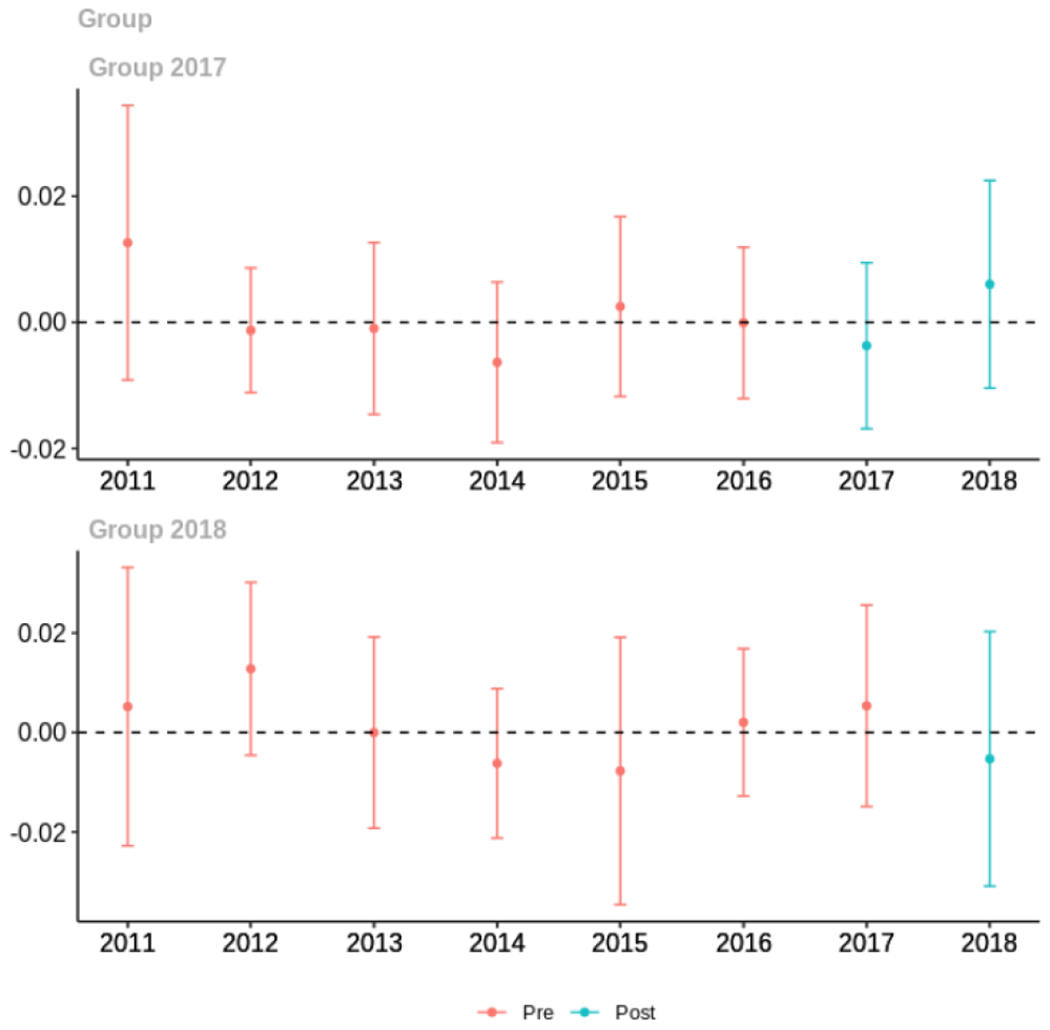
Average days’ supply of opioid prescriptions, per provider’s patient panel prescribed opioids, per year
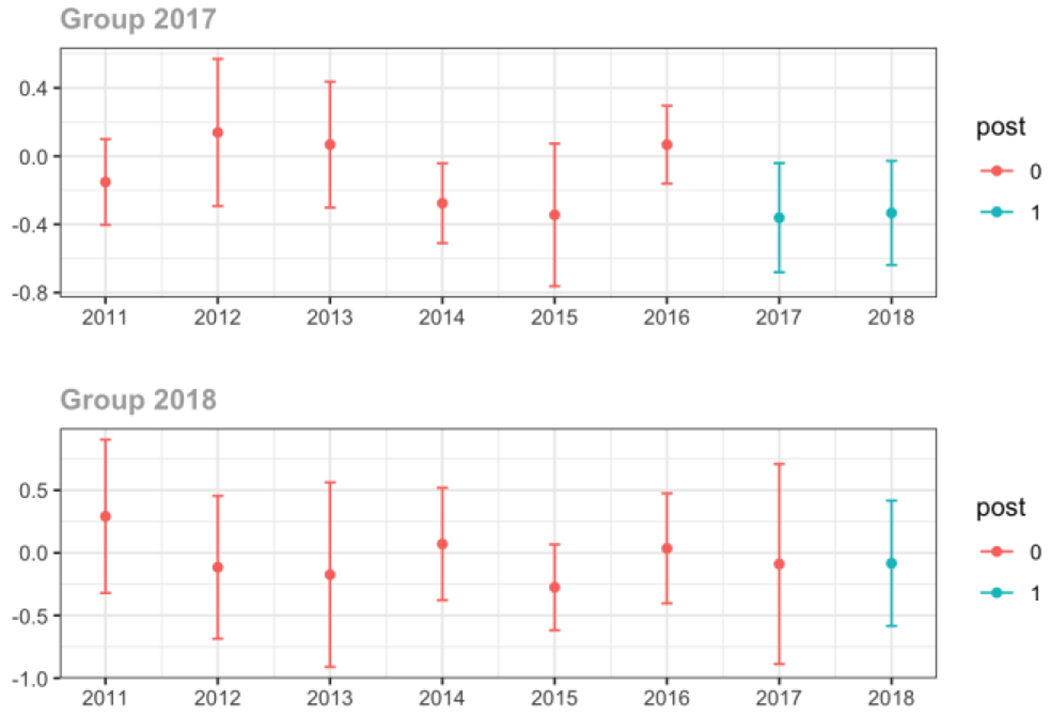
Average MME per day, per provider’s patient panel prescribed opioids, per year

Medicaid
Average proportion of provider’s patient panel prescribed an opioid, per year
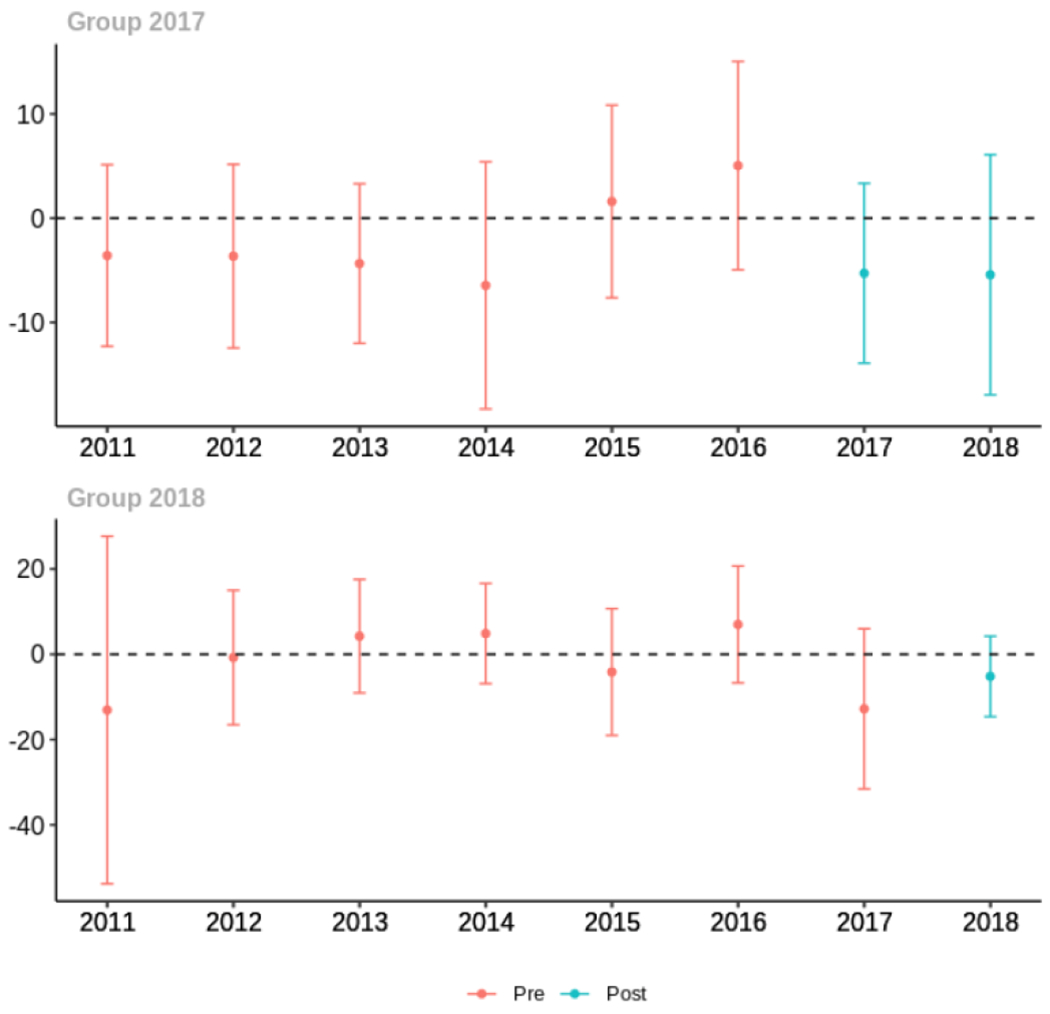
Average proportion of provider’s patient panel prescribed an opioid with days’ supply ≥ 7 days, per year
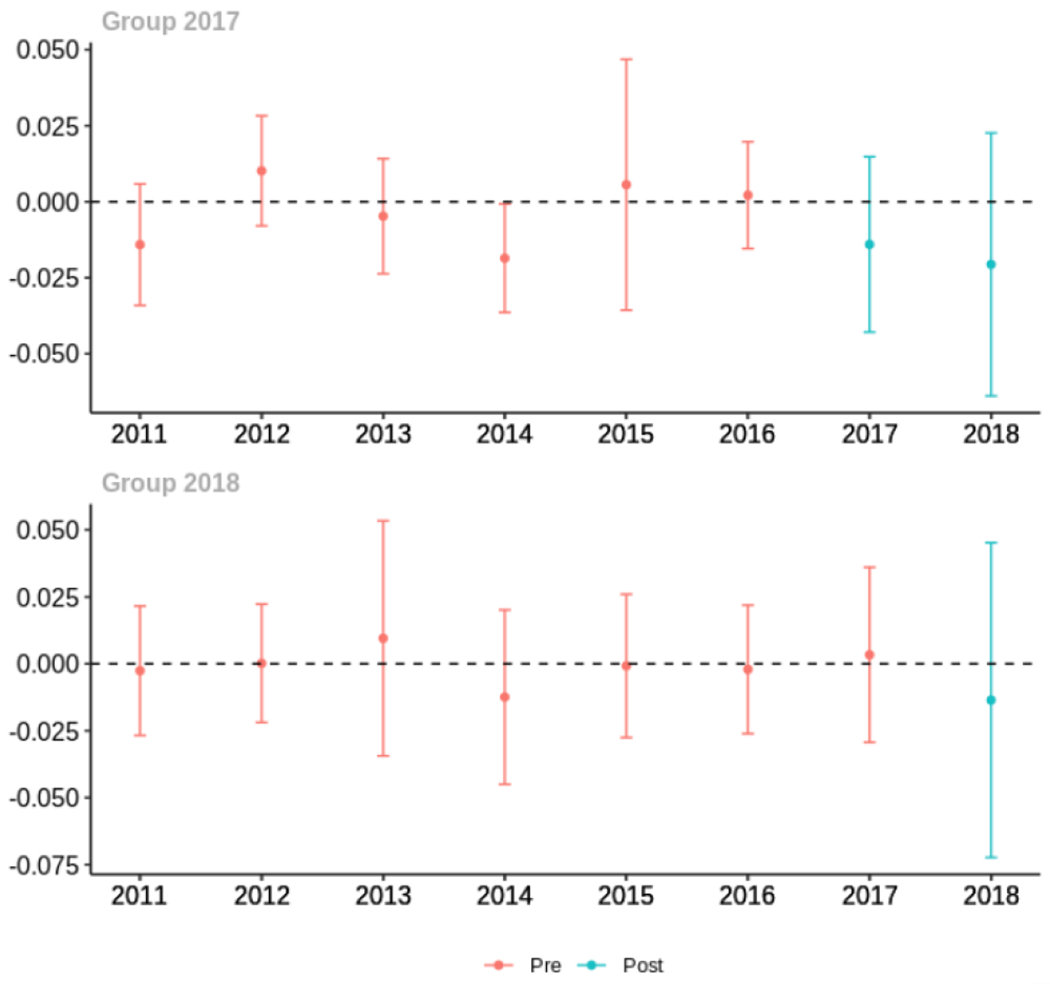
Average proportion of provider’s patient panel with an opioid rx with MME ≥ 50 per day, per year
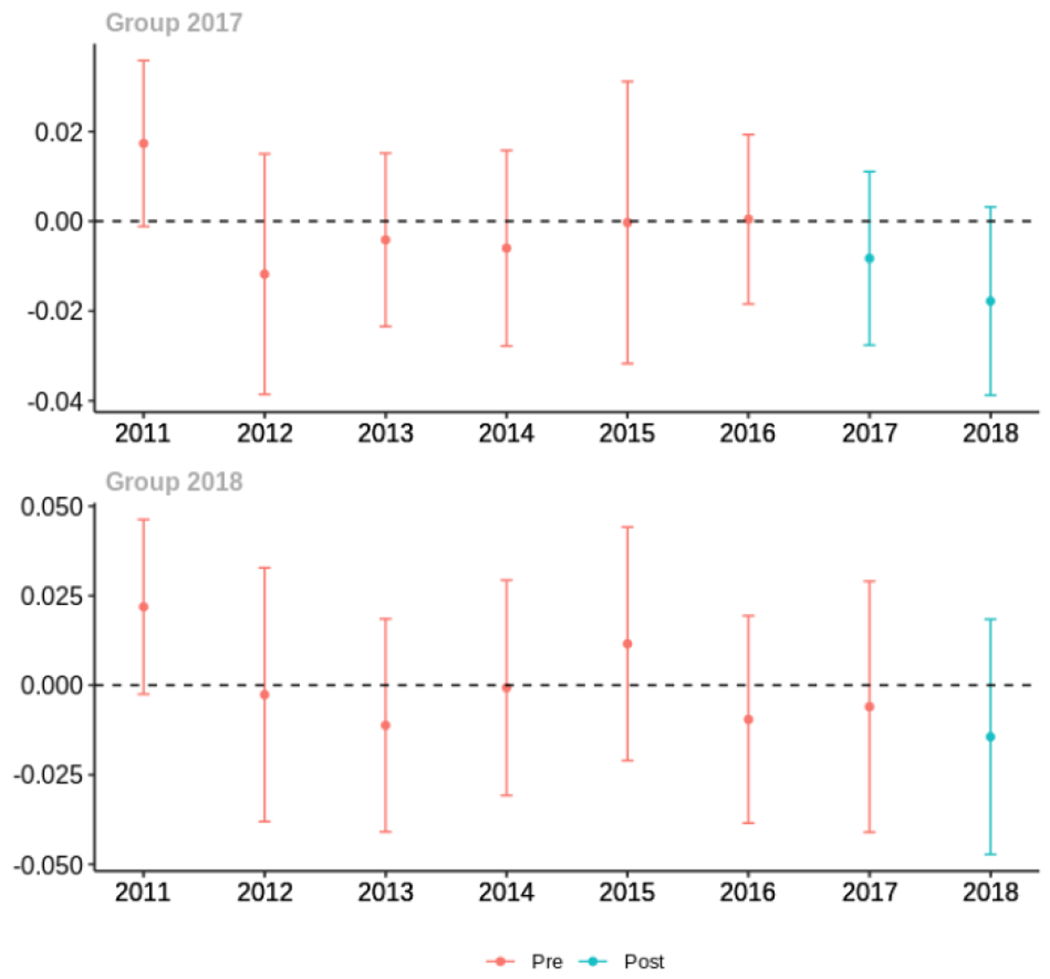
Average days’ supply of opioid prescriptions, per provider’s patient panel prescribed opioids, per year
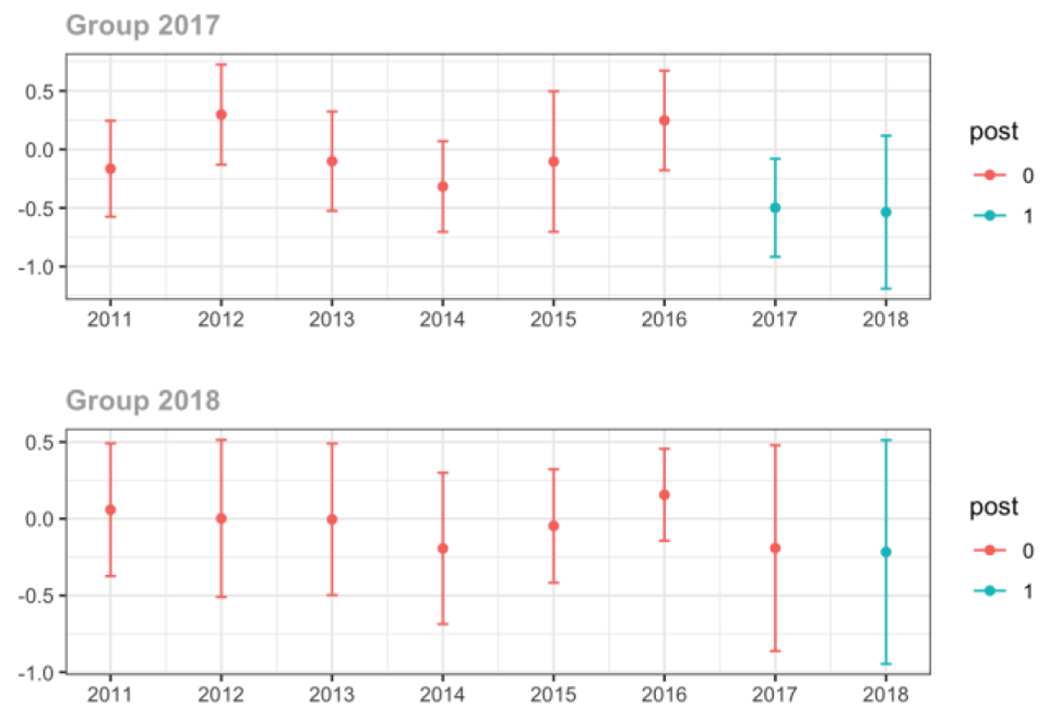
Average MME per day, per provider’s patient panel prescribed opioids, per year
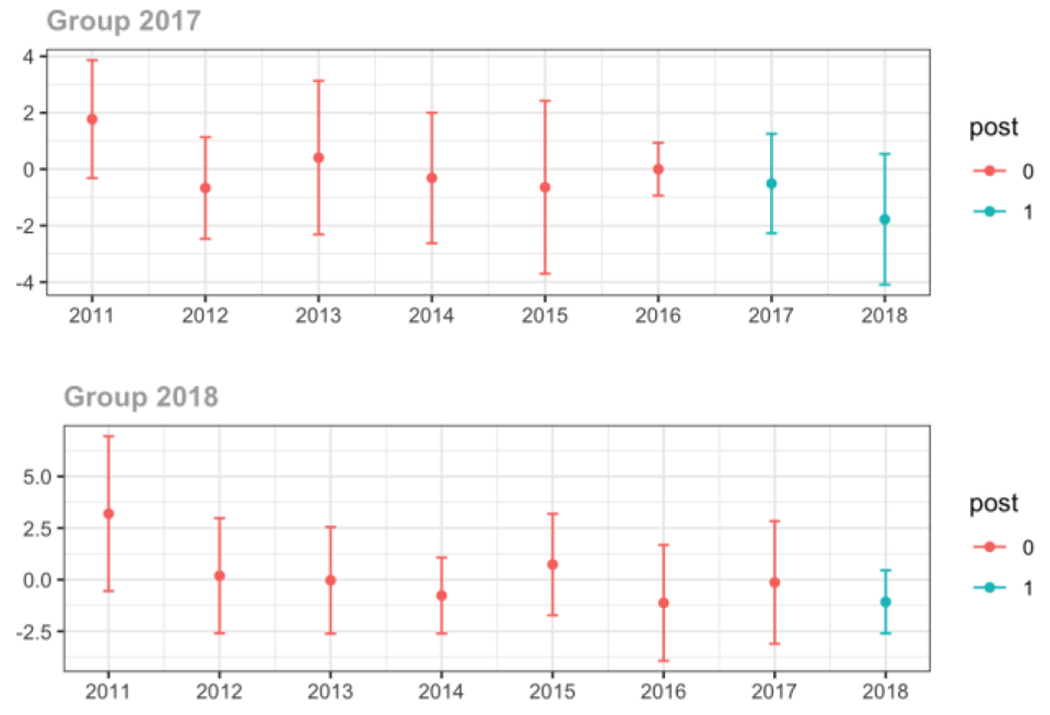
Cash
Average proportion of provider’s patient panel prescribed an opioid, per year
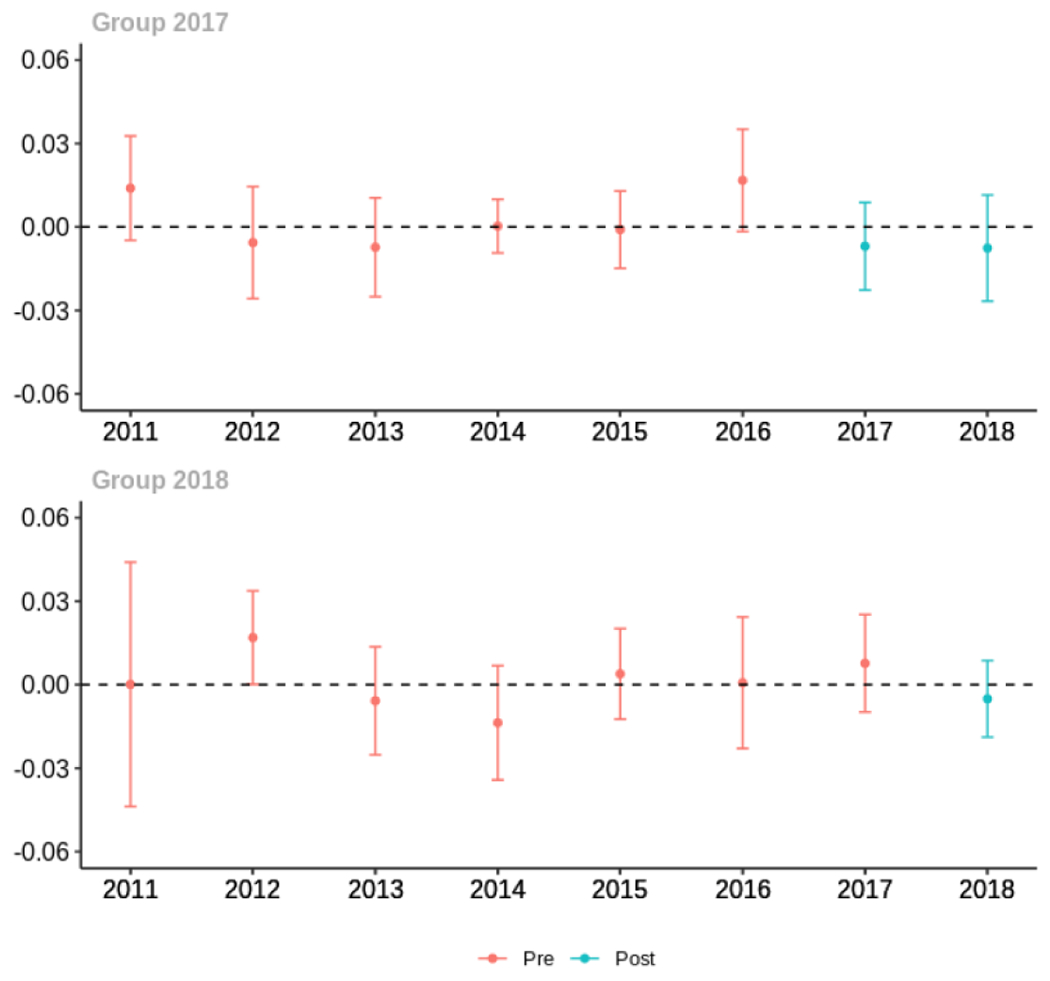
Average proportion of provider’s patient panel prescribed an opioid with days’ supply ≥ 7 days, per year
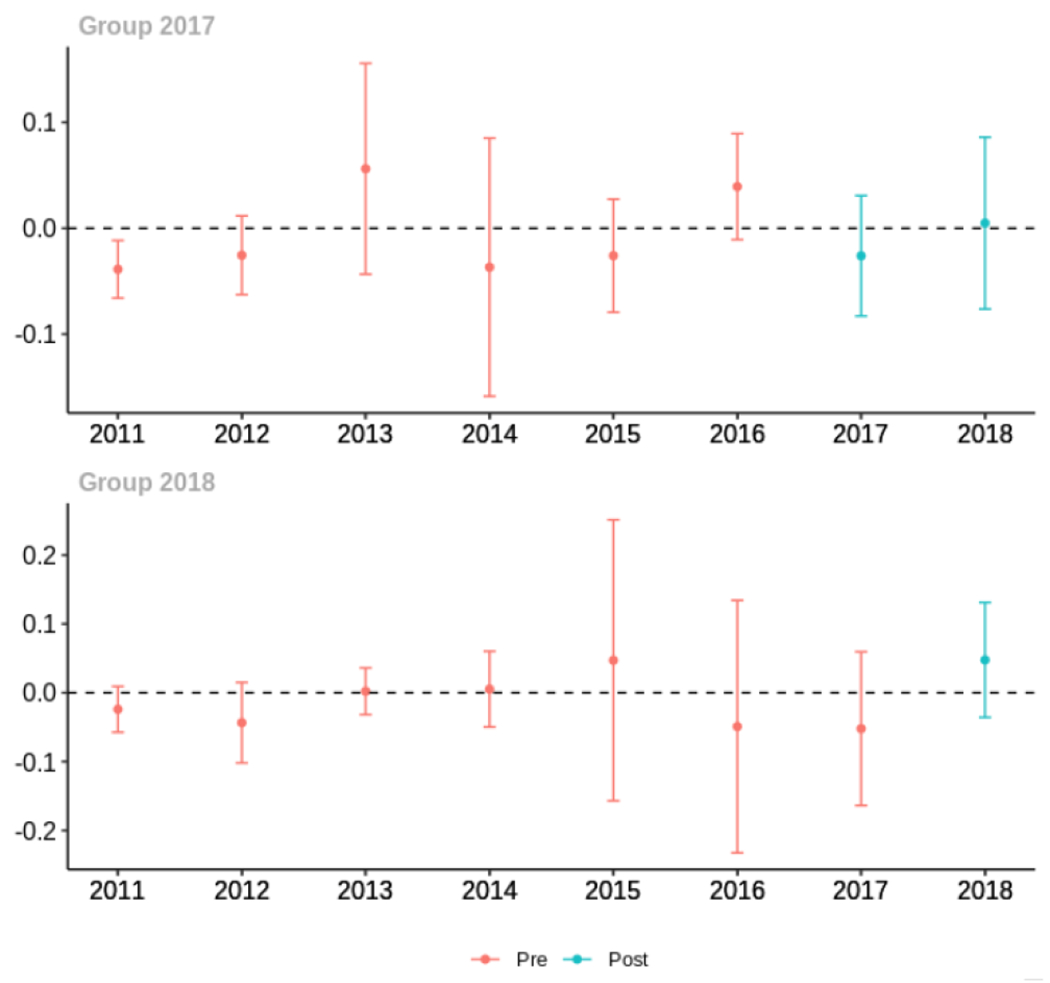
Average proportion of provider’s patient panel with an opioid prescription with MME ≥ 50 per day, per year

Average days’ supply of opioid prescriptions, per provider’s patient panel prescribed opioids, per year
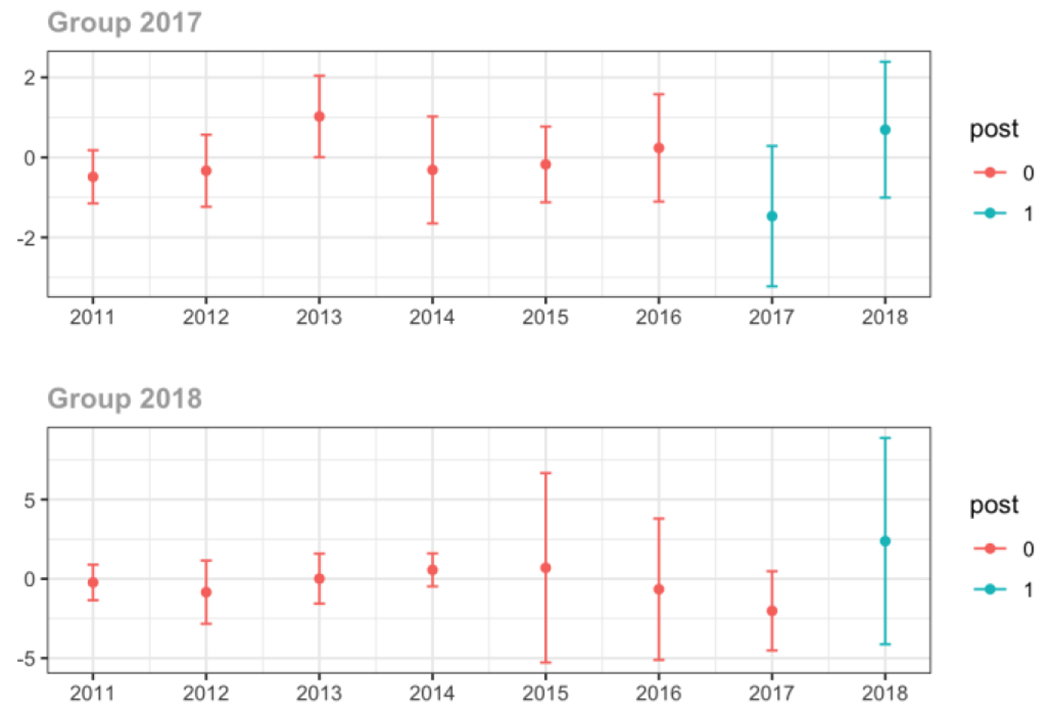
Average MME per day, per provider’s patient panel prescribed opioids, per year
Appendix D. Unadjusted models for mean days’ supply and MME per day outcomes
The exhibits below present results from unadjusted balanced models for the outcomes: mean days’ supply and mean morphine milligram equivalents (MME) per day per provider’s patient panel prescribed opioids, per year.
1. All providers and high volume prescribers
2. Provider specialty
3. Patient insurer
Appendix E. Unadjusted models stratified by chronic non-cancer pain condition
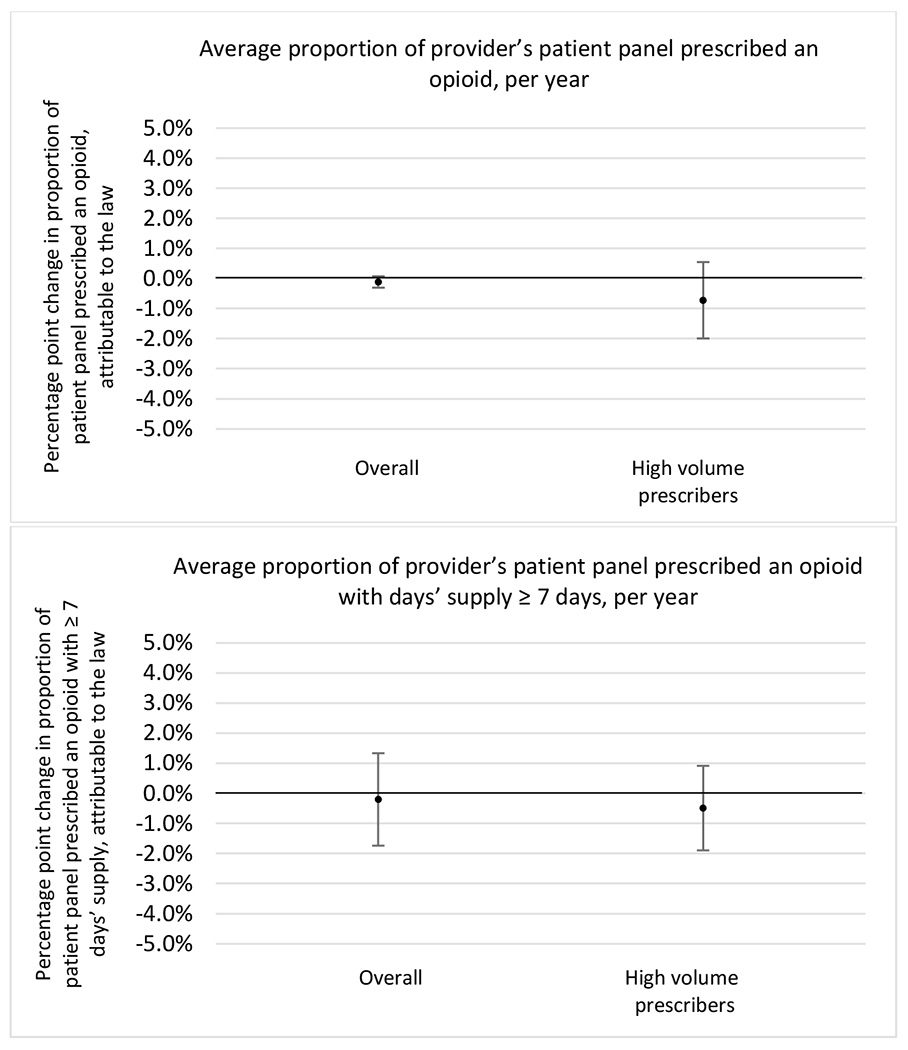
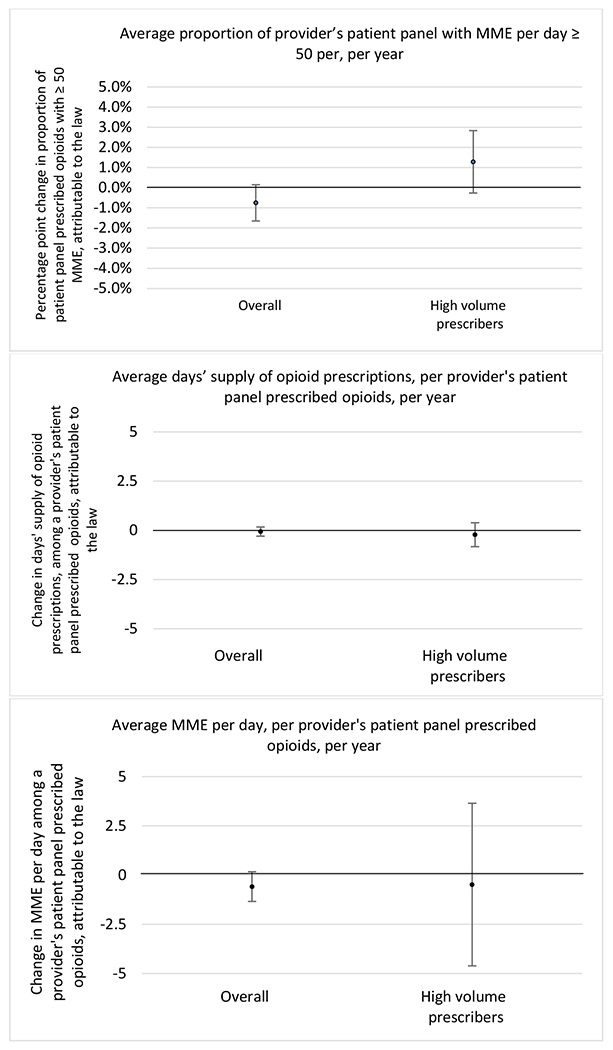
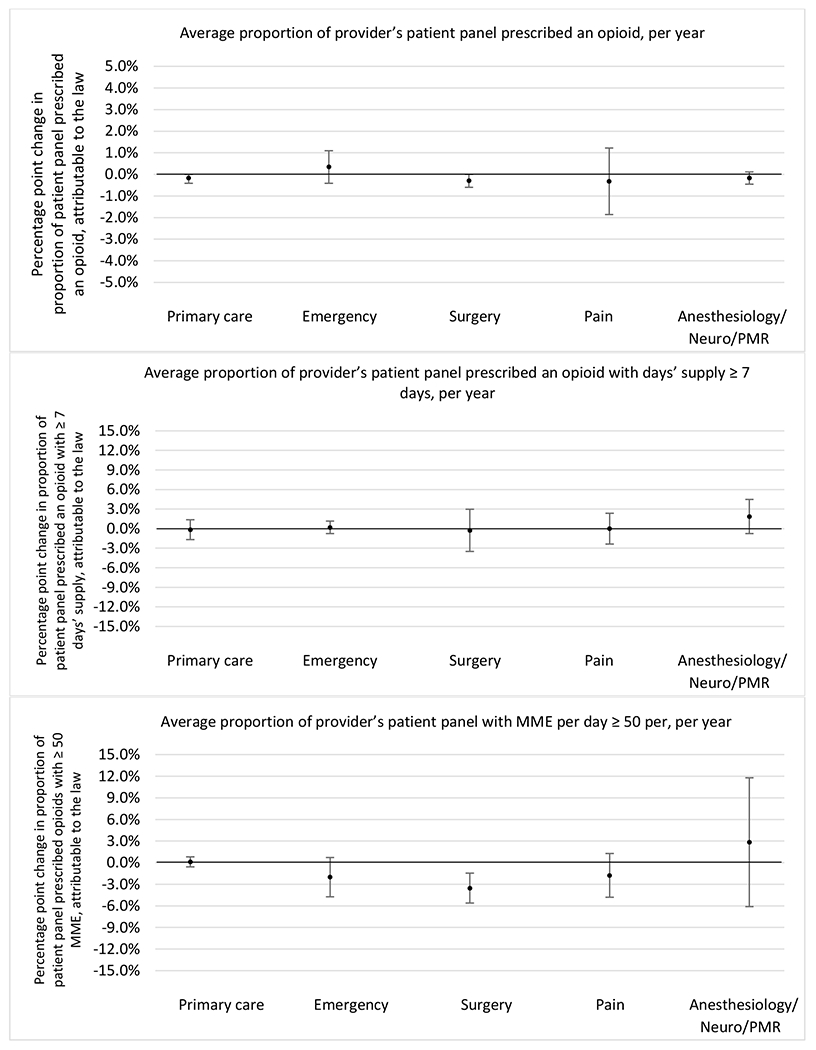
The exhibits below present results from unadjusted balanced models stratified by each of the three chronic pain conditions.
E.1. Low back pain
All providers and high volume prescribers
Provider specialty
Patient insurer
E.2. Fibromyalgia
All providers and high volume prescribers
Provider specialty
Patient insurer
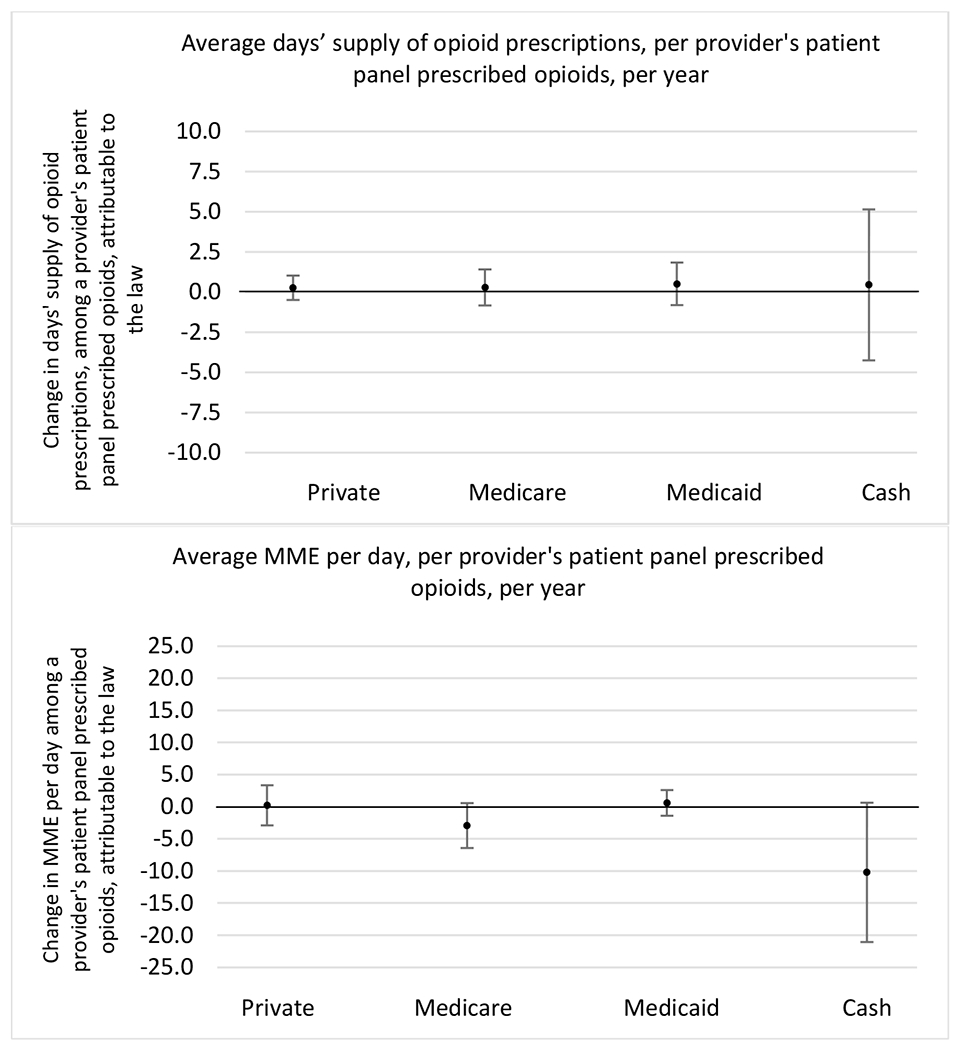
E.3. Headache
All providers and high volume prescribers
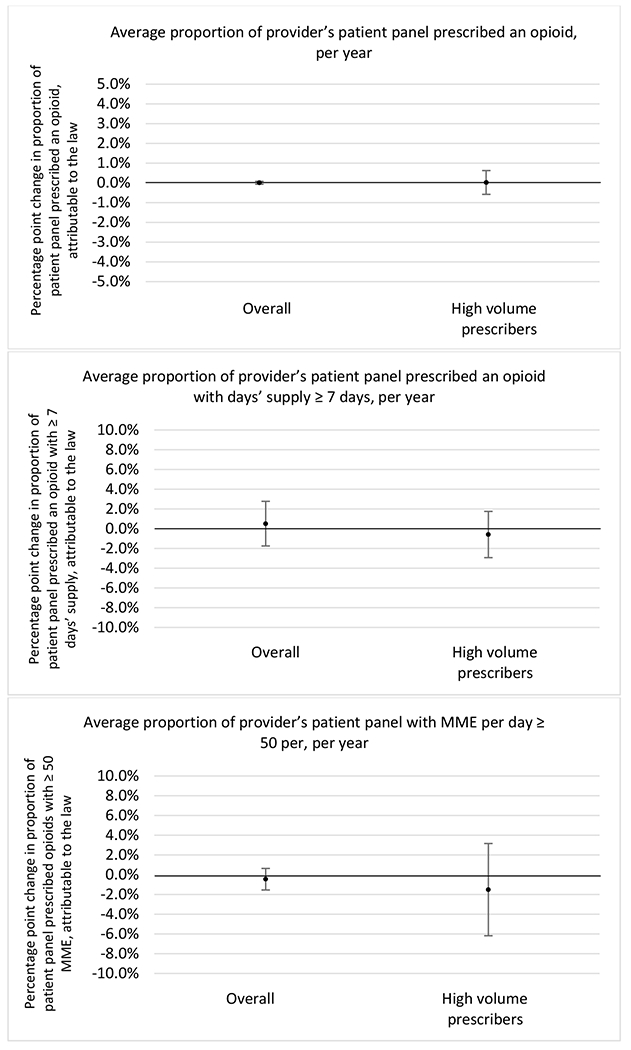
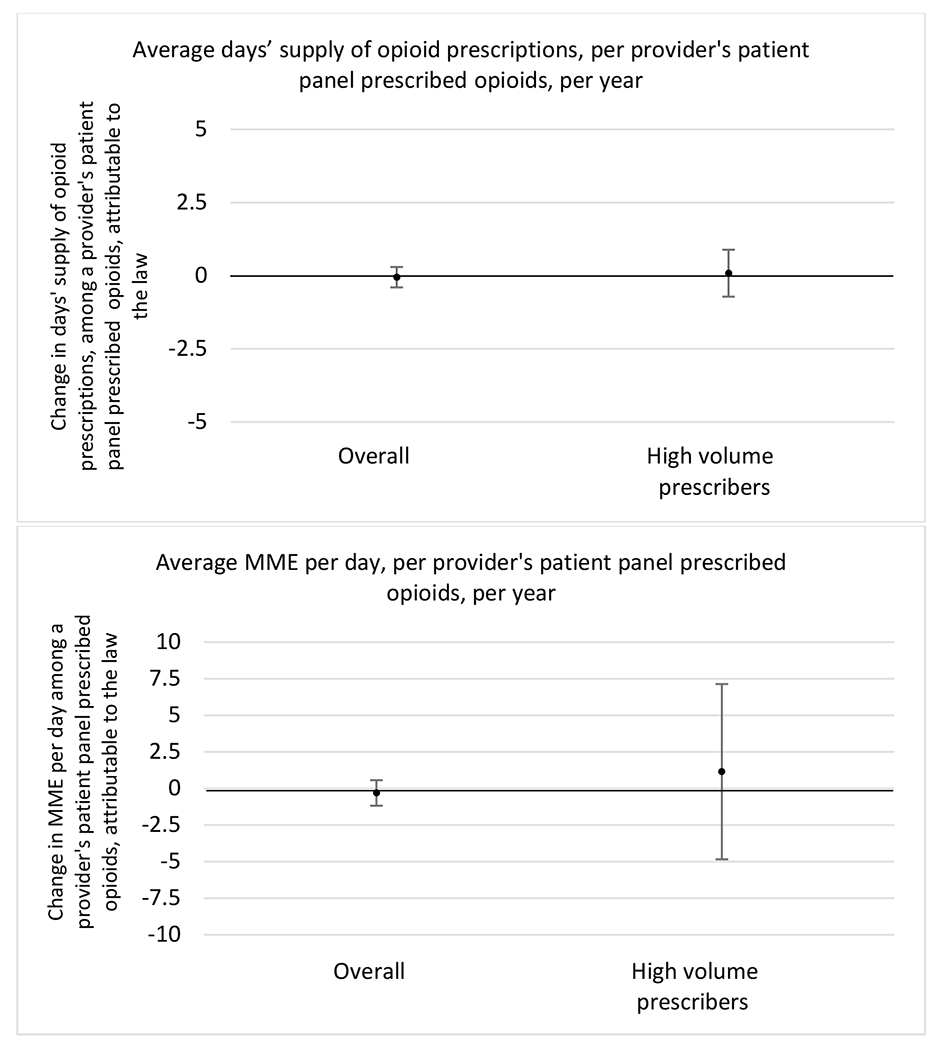
Provider Specialty
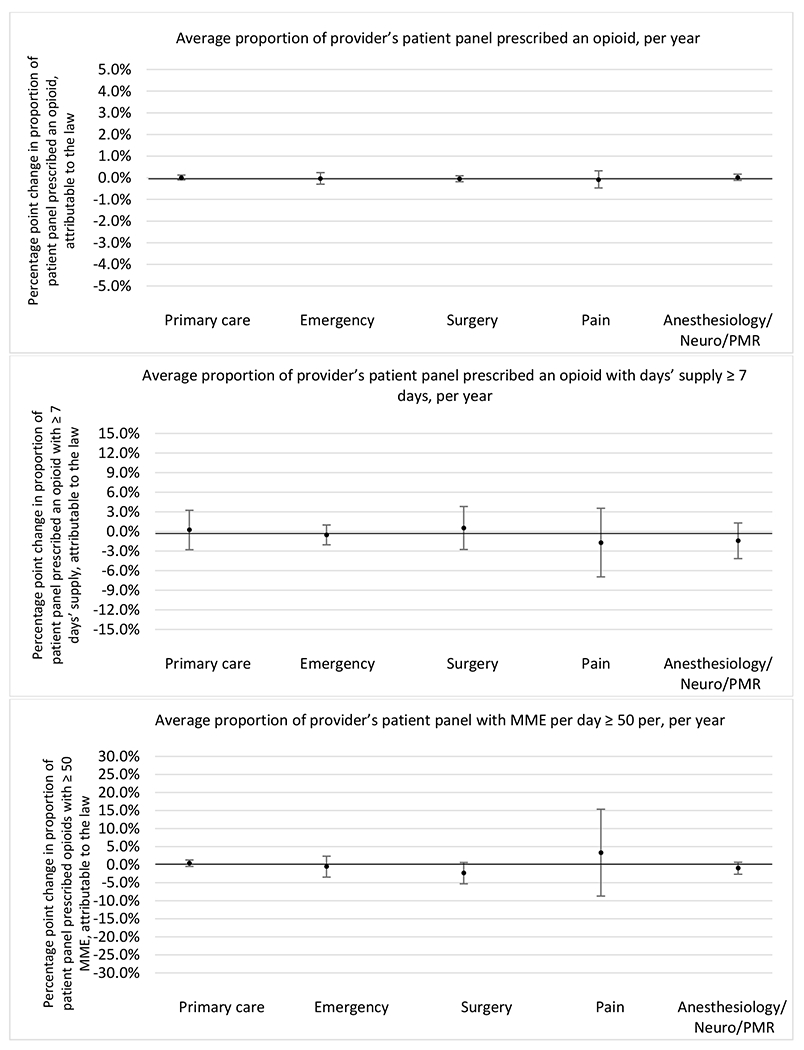
Patient insurer
Appendix F. Adjusted models
F.1. All providers and high volume prescribers
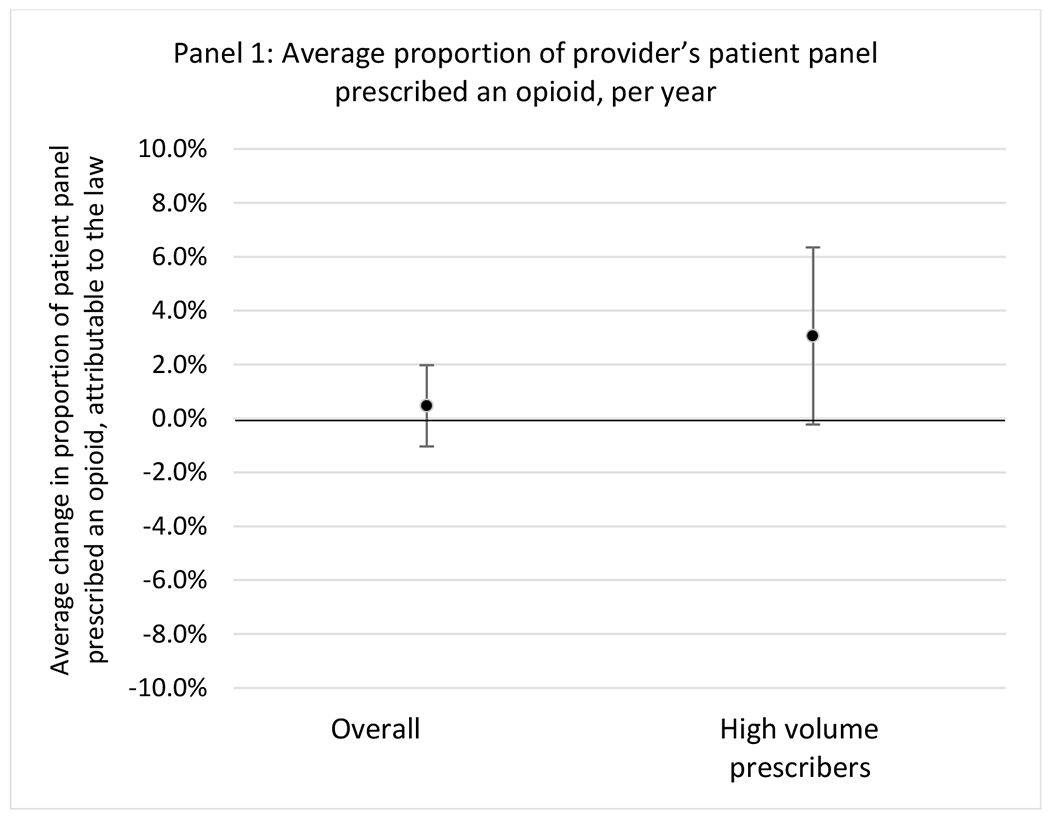
The exhibits below present results from balanced models adjusted for patient sex, age, proportion with a substance use disorder diagnosis, and proportion with mental illness. Models also adjust for provider specialty. For adjusted models, we utilized a doubly robust (DR) estimation approach.
Changes in opioid prescribing for chronic non-cancer pain patients, per year, attributable to implementation of a state opioid prescribing cap law, among all prescribers and high-volume opioid prescribers.
F.2. Provider specialty
The exhibits below present results from unadjusted models stratified by provider specialty.
Changes in opioid prescribing for chronic non-cancer pain patients, per year, attributable to implementation of a state opioid prescribing cap law, by provider specialty
F.3. Patient insurer
The exhibits below present results from balanced models adjusted for patient sex, age, proportion with a substance use disorder diagnosis, and proportion with mental illness. Models also adjust for provider specialty. For adjusted models, we utilized a doubly robust (DR) estimation approach.
Changes in opioid prescribing for chronic non-cancer pain patients, per year, attributable to implementation of a state opioid prescribing cap law, by insurance type.
Appendix G. Alternative comparison pools
G.1. Comparison pool: states that never implemented a prescribing cap law
The exhibits below present results from where the comparison pool only included states that have never implemented a prescribing cap law: DC, MN, WY, TX, MT, AL, CA, GA, IA, ID, KS, ND, NE, NM, OR, SD, WI.
G.1.a. All providers and high-volume prescribers
G.1.b. Provider specialty
G.1.c. Patient insurer
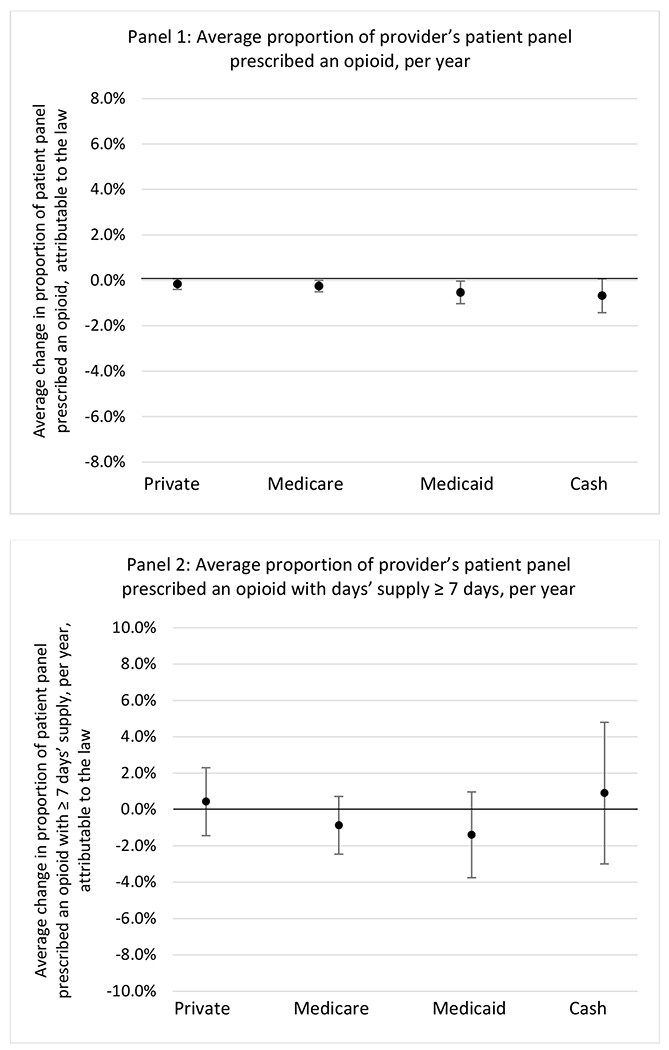
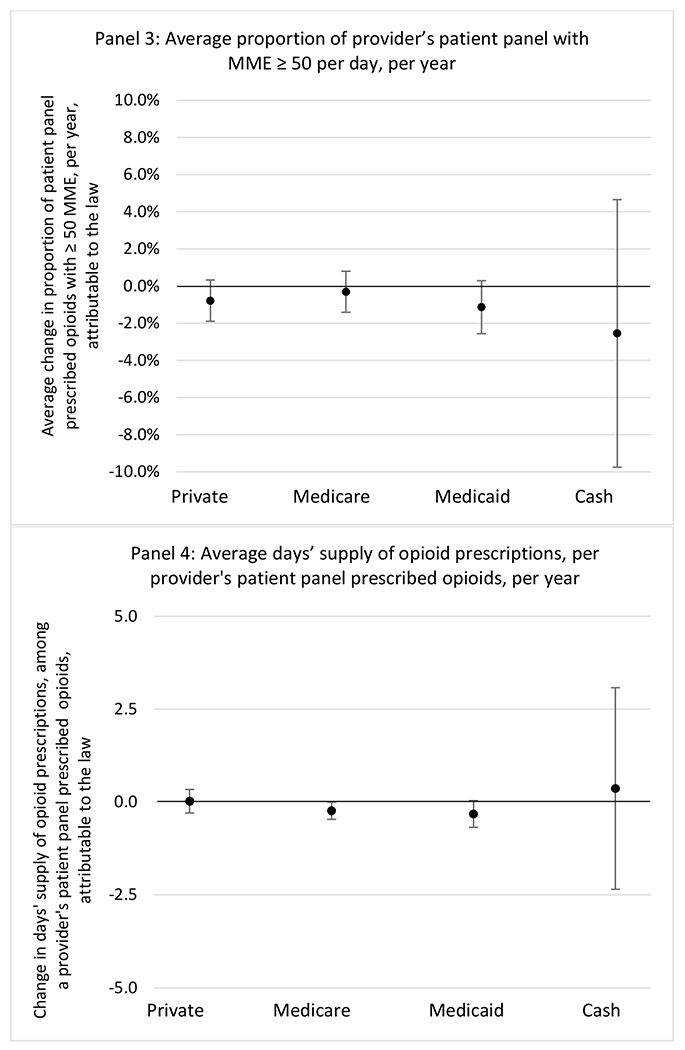
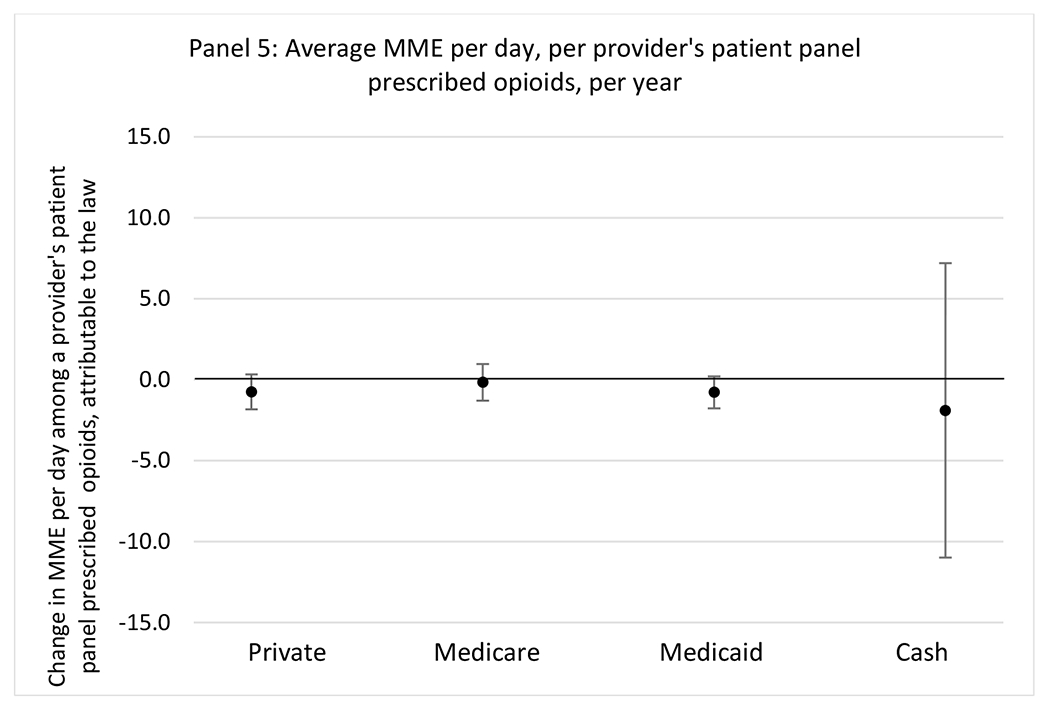
G.2. Comparison pool: states that eventually implemented a prescribing cap law
The exhibits below present results from where the comparison pool only included states that have eventually implemented a prescribing cap law: FL, MI, TN, AR, MO, MS, OK, WA.
G.2.a. All providers and high-volume prescribers
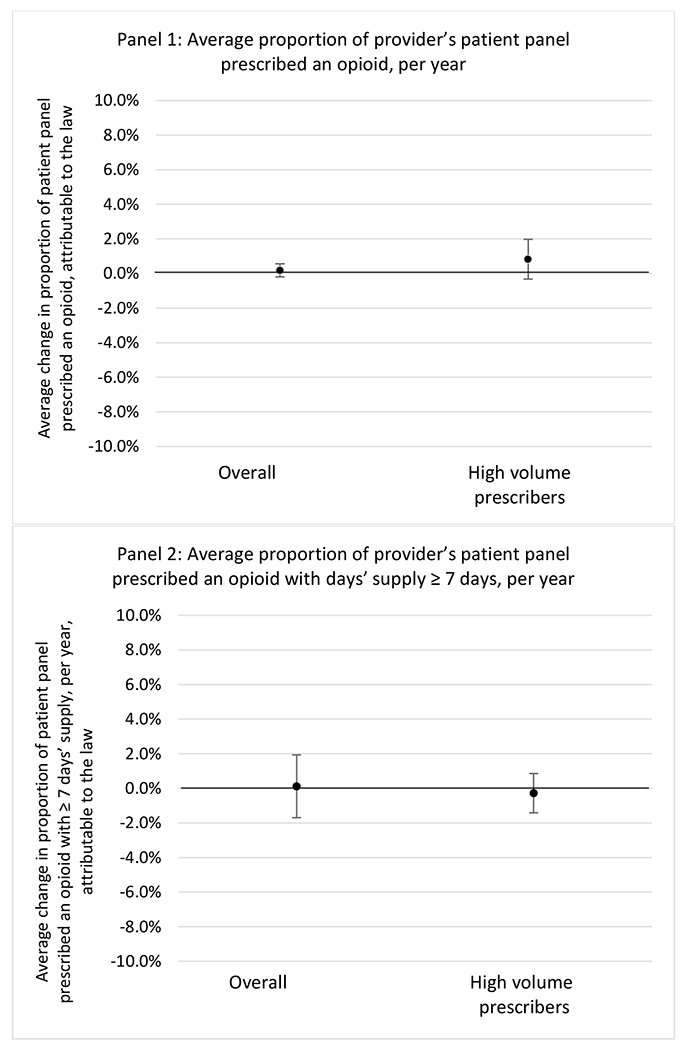
G.2.b. Provider specialty
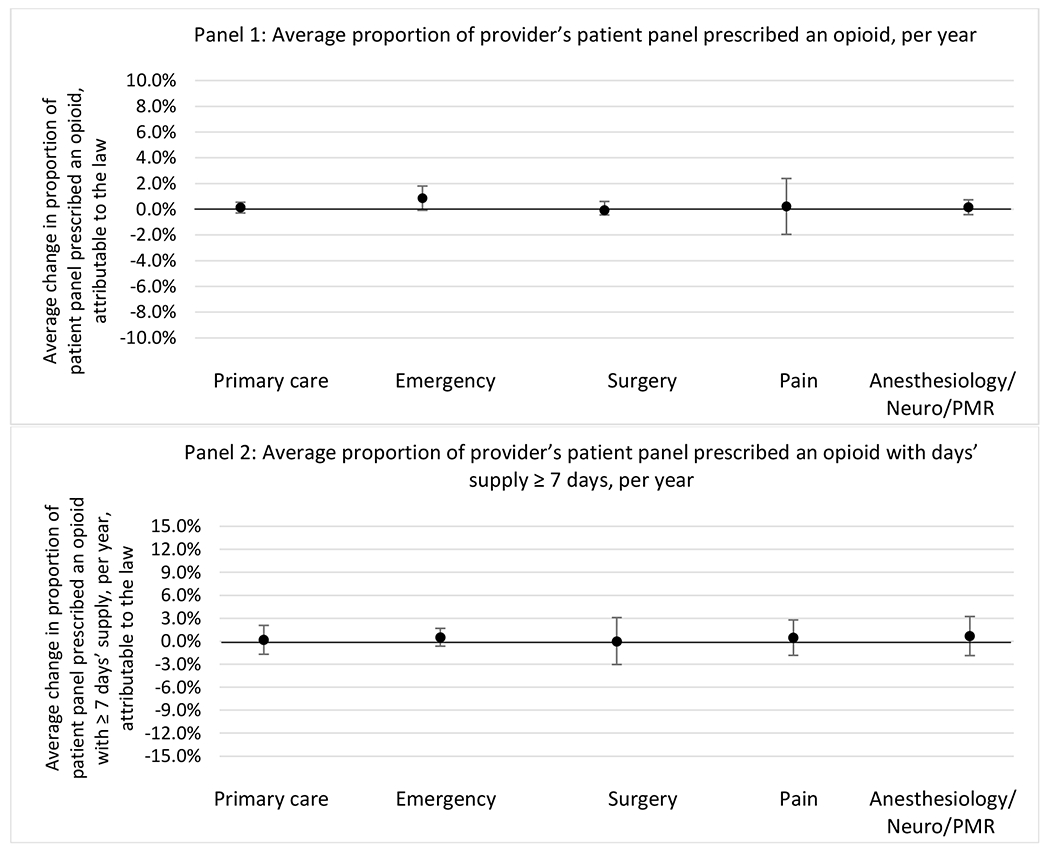
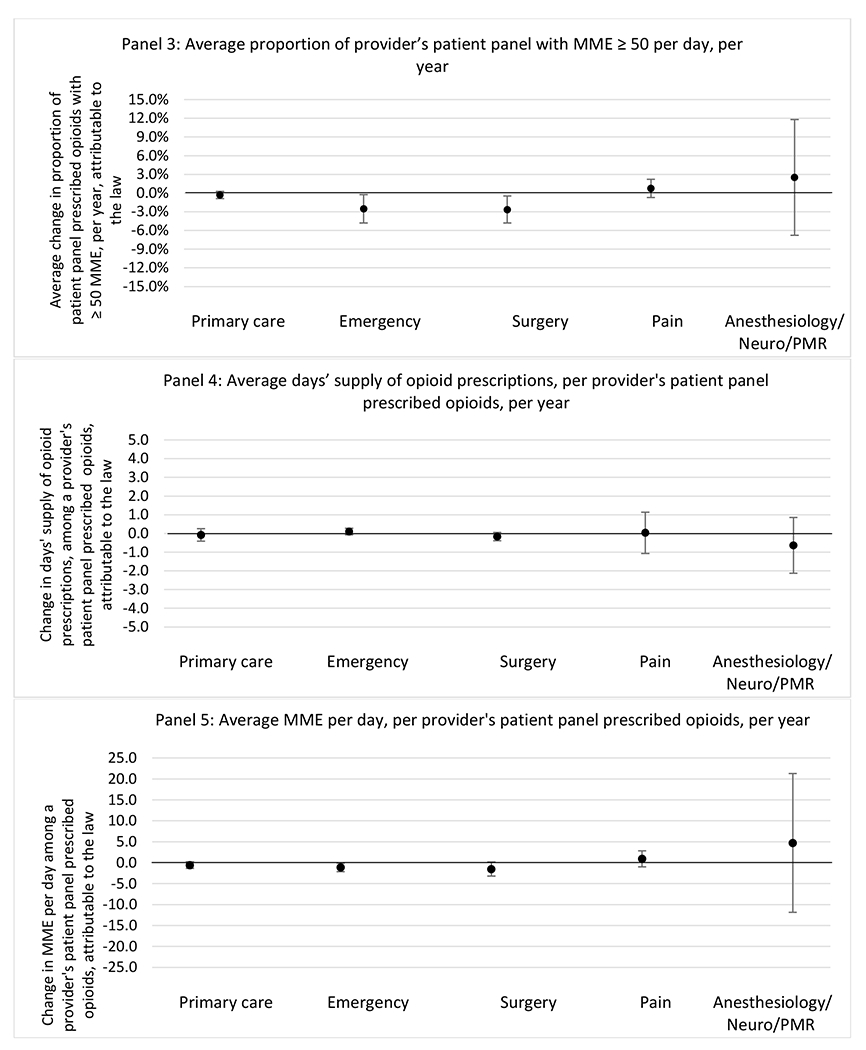
G.2.c. Patient insurer
Appendix H. Unadjusted models with policy states with and without professional judgement exemptions
The exhibits below present results from unadjusted balanced models where treatment states are limited to those with a state opioid prescribing cap law that 1)includes a professional judgement exemption and 2) do not include a professional judgement exemption.
H.1. All providers and high-volume prescribers
States with a professional judgement exemption
States without a professional judgement exemption
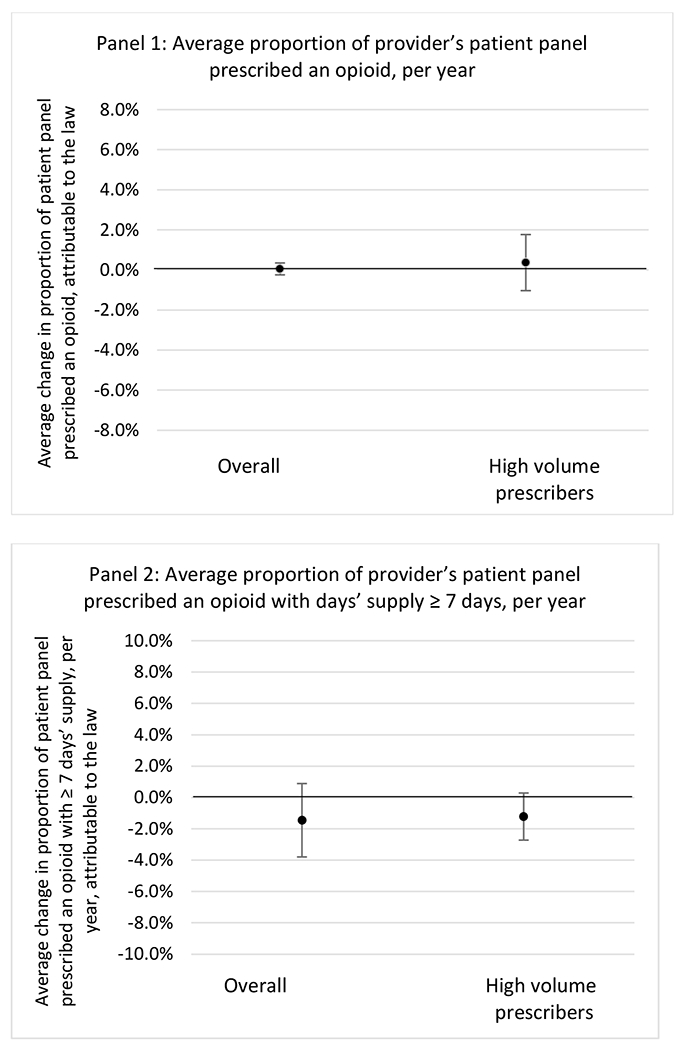
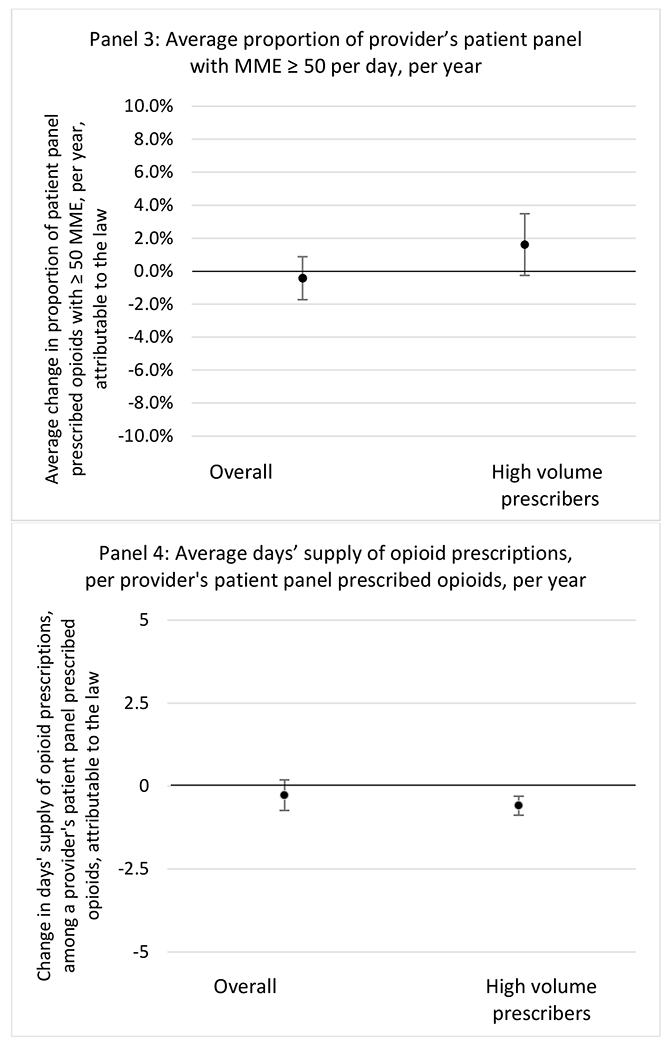
H.2. Provider specialty
States with a professional judgement exemption
States without a professional judgement exemption
H.3. Patient insurer
States with a professional judgement exemption
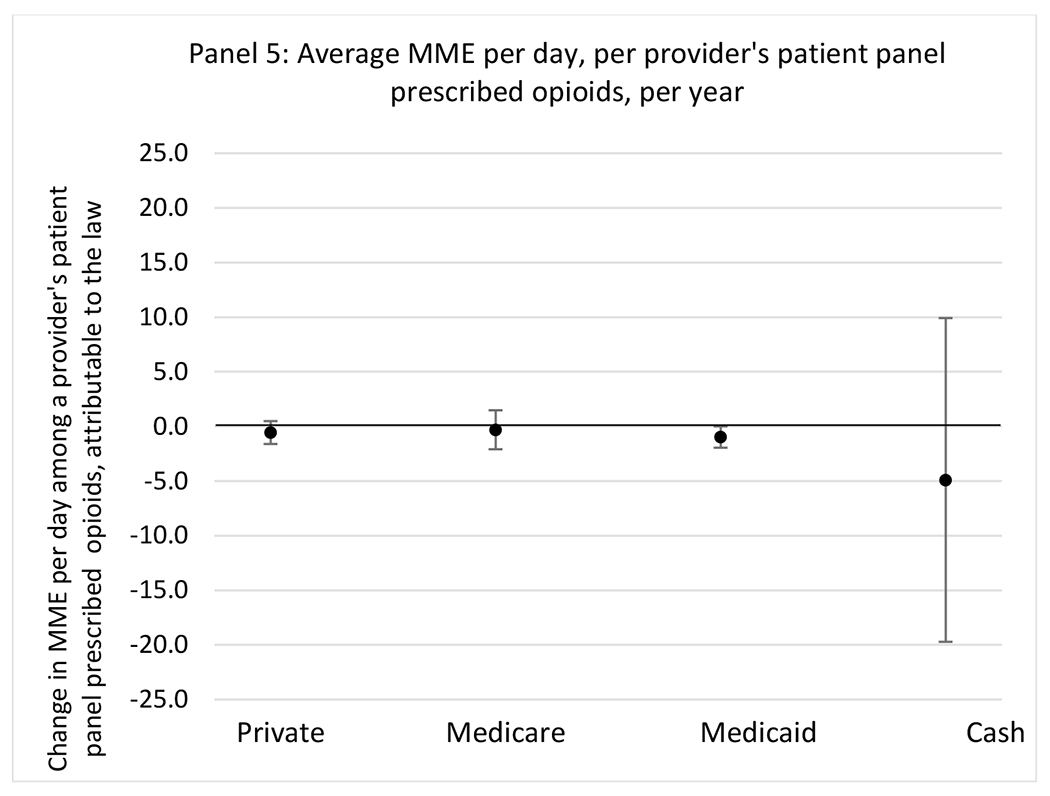
States without a professional judgement exemption

Footnotes
Publisher's Disclaimer: This is a PDF file of an unedited manuscript that has been accepted for publication. As a service to our customers we are providing this early version of the manuscript. The manuscript will undergo copyediting, typesetting, and review of the resulting proof before it is published in its final form. Please note that during the production process errors may be discovered which could affect the content, and all legal disclaimers that apply to the journal pertain.
Declaration of Interest Statement: Drs. Tormohlen, White, Bandara, McCourt, Davis, and McGinty have no financial disclosures. Dr. Bicket reports past service as a consultant for Axial Healthcare, unrelated to the submitted work.
References
- 1.Schuchat A, Houry D, Guy GP. New Data on Opioid Use and Prescribing in the United States. JAMA. 2017;318(5):425. doi: 10.1001/jama.2017.8913 [DOI] [PMC free article] [PubMed] [Google Scholar]
- 2.Dowell D, Haegerich TM, Chou R. CDC Guideline for Prescribing Opioids for Chronic Pain — United States, 2016. MMWR Recomm Rep. 2016;65(1):1–49. doi: 10.15585/mmwr.rr6501e1 [DOI] [PubMed] [Google Scholar]
- 3.Bohnert ASB, Valenstein M, Bair MJ, et al. Association Between Opioid Prescribing Patterns and Opioid Overdose-Related Deaths. JAMA. 2011;305(13):1315–1321. doi: 10.1001/jama.2011.370 [DOI] [PubMed] [Google Scholar]
- 4.Dowell D. CDC Clinical Practice Guideline for Prescribing Opioids for Pain — United States, 2022. MMWR Recomm Rep. 2022;71. doi: 10.15585/mmwr.rr7103a1 [DOI] [PMC free article] [PubMed] [Google Scholar]
- 5.Fitzcharles MA, Ste-Marie PA, Goldenberg DL, et al. 2012 Canadian Guidelines for the Diagnosis and Management of Fibromyalgia Syndrome: Executive Summary. Pain Research and Management. 2013; 18(3): 119–126. doi: 10.1155/2013/918216 [DOI] [PMC free article] [PubMed] [Google Scholar]
- 6.Loder E, Weizenbaum E, Frishberg B, Silberstein S. Choosing Wisely in Headache Medicine: The American Headache Society’s List of Five Things Physicians and Patients Should Question. Headache: The Journal of Head and Face Pain. 2013;53(10):1651–1659. doi: 10.1111/head.12233 [DOI] [PubMed] [Google Scholar]
- 7.Qaseem A, Wilt TJ, McLean RM, Forciea MA. Noninvasive Treatments for Acute, Subacute, and Chronic Low Back Pain: A Clinical Practice Guideline From the American College of Physicians. Ann Intern Med. 2017;166(7):514–530. doi: 10.7326/M16-2367 [DOI] [PubMed] [Google Scholar]
- 8.Wenger HC, Cifu AS. Treatment of Low Back Pain. JAMA. 2017;318(8):743. doi: 10.1001/jama.2017.9386 [DOI] [PubMed] [Google Scholar]
- 9.Sharp MJ, Melnik TA. Poisoning Deaths Involving Opioid Analgesics — New York State, 2003–2012. MMWR Morb Mortal Wkly Rep. 2015;64(14):377–380. [PMC free article] [PubMed] [Google Scholar]
- 10.Control C for D, Prevention. Overdose deaths involving prescription opioids among Medicaid enrollees-Washington, 2004–2007. MMWR: Morbidity and mortality weekly report. 2009;58(42): 1171–1175. [PubMed] [Google Scholar]
- 11.Guy GP, Zhang K. Opioid Prescribing by Specialty and Volume in the U.S. Am J Prev Med. 2018;55(5):e153–e155. doi: 10.1016/j.amepre.2018.06.008 [DOI] [PMC free article] [PubMed] [Google Scholar]
- 12.Chang HY, Lyapustina T, Rutkow L, et al. Impact of prescription drug monitoring programs and pill mill laws on high-risk opioid prescribers: A comparative interrupted time series analysis. Drug and Alcohol Dependence. 2016;165:1–8. doi: 10.1016/j.drugalcdep.2016.04.033 [DOI] [PMC free article] [PubMed] [Google Scholar]
- 13.Heins SE, Sorbero MJ, Jones CM, Dick AW, Stein BD. High-Risk Prescribing to Medicaid Enrollees Receiving Opioid Analgesics: Individual- and County-Level Factors. Subst Use Misuse. 2018;53(10):1591–1601. doi: 10.1080/10826084.2017.1416407 [DOI] [PMC free article] [PubMed] [Google Scholar]
- 14.Davis CS, Lieberman AJ, Hernandez-Delgado H, Suba C. Laws limiting the prescribing or dispensing of opioids for acute pain in the United States: A national systematic legal review. Drug and Alcohol Dependence. 2019;194:166–172. doi: 10.1016/j.drugalcdep.2018.09.022 [DOI] [PubMed] [Google Scholar]
- 15.Davis CS, Lieberman AJ. Laws limiting prescribing and dispensing of opioids in the United States, 1989–2019. Addiction. 2021;116(7):1817–1827. doi: 10.1111/add.15359 [DOI] [PubMed] [Google Scholar]
- 16.Rubin R. Limits on opioid prescribing leave patients with chronic pain vulnerable. JAMA. 2019;321(21):2059–2062. [DOI] [PubMed] [Google Scholar]
- 17.Lagisetty PA, Healy N, Garpestad C, Jannausch M, Tipirneni R, Bohnert ASB. Access to Primary Care Clinics for Patients With Chronic Pain Receiving Opioids. JAMA Network Open. 2019;2(7):e196928. doi: 10.1001/jamanetworkopen.2019.6928 [DOI] [PMC free article] [PubMed] [Google Scholar]
- 18.McCourt AD, Tormohlen KN, Schmid I, et al. Effects of Opioid Prescribing Cap Laws on Opioid and Other Pain Treatments Among Persons with Chronic Pain. Journal of General Internal Medicine. 2023;38(4):929–937. doi: 10.1007/s11606-022-07796-8 [DOI] [PMC free article] [PubMed] [Google Scholar]
- 19.Ringwalt C, Gugelmann H, Garrettson M, et al. Differential Prescribing of Opioid Analgesics According to Physician Specialty for Medicaid Patients with Chronic Noncancer Pain Diagnoses. Pain Research and Management. 2014;19(4):179–185. doi: 10.1155/2014/857952 [DOI] [PMC free article] [PubMed] [Google Scholar]
- 20.Available IQVIA Data. Accessed October 4, 2022. https://www.iqvia.com/insights/the-iqvia-institute/available-iqvia-data
- 21.Institute of Medicine (US) Committee on Advancing Pain Research, Care, and Education. Relieving Pain in America: A Blueprint for Transforming Prevention, Care, Education, and Research. National Academies Press (US); 2011. Accessed September 28, 2022. http://www.ncbi.nlm.nih.gov/books/NBK91497/ [PubMed] [Google Scholar]
- 22.Tormohlen KN, McCourt AD, Schmid I, et al. State prescribing cap laws’ association with opioid analgesic prescribing and opioid overdose. Drug and Alcohol Dependence. 2022;240:109626. doi: 10.1016/j.drugalcdep.2022.109626 [DOI] [PMC free article] [PubMed] [Google Scholar]
- 23.Wagenaar AC, Burris SC. Public Health Law Research: Theory and Methods. John Wiley & Sons; 2013. [Google Scholar]
- 24.Callaway B, Sant’Anna PHC. Difference-in-Differences with multiple time periods. Journal of Econometrics. Published online December 17, 2020. doi: 10.1016/j.jeconom.2020.12.001 [DOI] [Google Scholar]
- 25.Stone EM, Tormohlen KN, McCourt AD, et al. Association Between State Opioid Prescribing Cap Laws and Receipt of Opioid Prescriptions Among Children and Adolescents. JAMA Health Forum. 2022;3(8):e222461. doi: 10.1001/jamahealthforum.2022.2461 [DOI] [PMC free article] [PubMed] [Google Scholar]
- 26.Schmid I, Stuart EA, McCourt AD, et al. Effects of state opioid prescribing cap laws on opioid prescribing after surgery. Health Services Research. 2022;57(5):1154–1164. doi: 10.1111/1475-6773.14023 [DOI] [PMC free article] [PubMed] [Google Scholar]
- 27.CDC. Data Resources: Analyzing Opioid Prescription Data and Oral Morphine Milligram Equivalents (MME). Published 2010. Accessed July 29, 2021. https://www.cdc.gov/opioids/data-resources/index.html
- 28.ACGME Program Requirements for Graduate Medical Education in Pain Medicine. https://www.acgme.org/globalassets/pfassets/programrequirements/530_painmedicine_2022.pdf
- 29.Callaway B, Sant’Anna PHC. did: Difference in Differences. Published online 2020. https://bcallaway11.github.io/did/
- 30.Bicket MC, Murimi IB, Mansour O, Wu CL, Alexander GC. Association of new opioid continuation with surgical specialty and type in the United States. The American Journal of Surgery. 2019;218(5):818–827. doi: 10.1016/j.amjsurg.2019.04.010 [DOI] [PubMed] [Google Scholar]
- 31.McCourt AD, Tormohlen KN, Schmid I, et al. Effects of opioid prescribing cap laws on opioid and other pain treatments among persons with chronic pain. Journal of Internal Medicine. Published online In press. [DOI] [PMC free article] [PubMed] [Google Scholar]
- 32.Stone EM, Rutkow L, Bicket MC, Barry CL, Alexander GC, McGinty EE. Implementation and enforcement of state opioid prescribing laws. Drug and Alcohol Dependence. 2020;213:108107. doi: 10.1016/j.drugalcdep.2020.108107 [DOI] [PMC free article] [PubMed] [Google Scholar]
- 33.Johnson MJ, May CR. Promoting professional behaviour change in healthcare: what interventions work, and why? A theory-led overview of systematic reviews. BMJ Open. 2015;5(9):e008592. doi: 10.1136/bmjopen-2015-008592 [DOI] [PMC free article] [PubMed] [Google Scholar]
- 34.Zeldow B, Hatfield LA. Confounding and regression adjustment in difference-in-differences studies. Health Services Research. 2021;56(5):932–941. doi: 10.1111/1475-6773.13666 [DOI] [PMC free article] [PubMed] [Google Scholar]


