Abstract
Background
Concern exists that noninvasive ventilation (NIV) may promote ventilation-induced lung injury(VILI) and worsen outcome in acute hypoxemic respiratory failure (AHRF). Different individual ventilatory variables have been proposed to predict clinical outcomes, with inconsistent results.
Mechanical power (MP), a measure of the energy transfer rate from the ventilator to the respiratory system during mechanical ventilation, might provide solutions for this issue in the framework of predictive, preventive and personalized medicine (PPPM). We explored (1) the impact of ventilator-delivered MP normalized to well-aerated lung (MPWAL) on physio-anatomical and clinical responses to NIV in COVID-19-related AHRF and (2) the effect of prone position(PP) on MPWAL.
Methods
We analyzed 216 noninvasively ventilated COVID-19 patients (108 patients receiving PP + NIV and 108 propensity score-matched patients receiving supine NIV) with moderate-to-severe(paO2/FiO2 ratio < 200) AHRF enrolled in the PRO-NIV controlled non-randomized study (ISRCTN23016116).
Quantification of differentially aerated lung volumes by lung ultrasonography (LUS) was validated against CT scans. Respiratory parameters were hourly recorded, ABG were performed 1 h after each postural change. Time-weighed average values of ventilatory variables, including MPWAL, and gas exchange parameters (paO2/FiO2 ratio, dead space indices) were calculated for each ventilatory session. LUS and circulating biomarkers were assessed daily.
Results
Compared with supine position, PP was associated with a 34% MPWAL reduction, attributable largely to an absolute MP reduction and secondly to an enhanced lung reaeration.
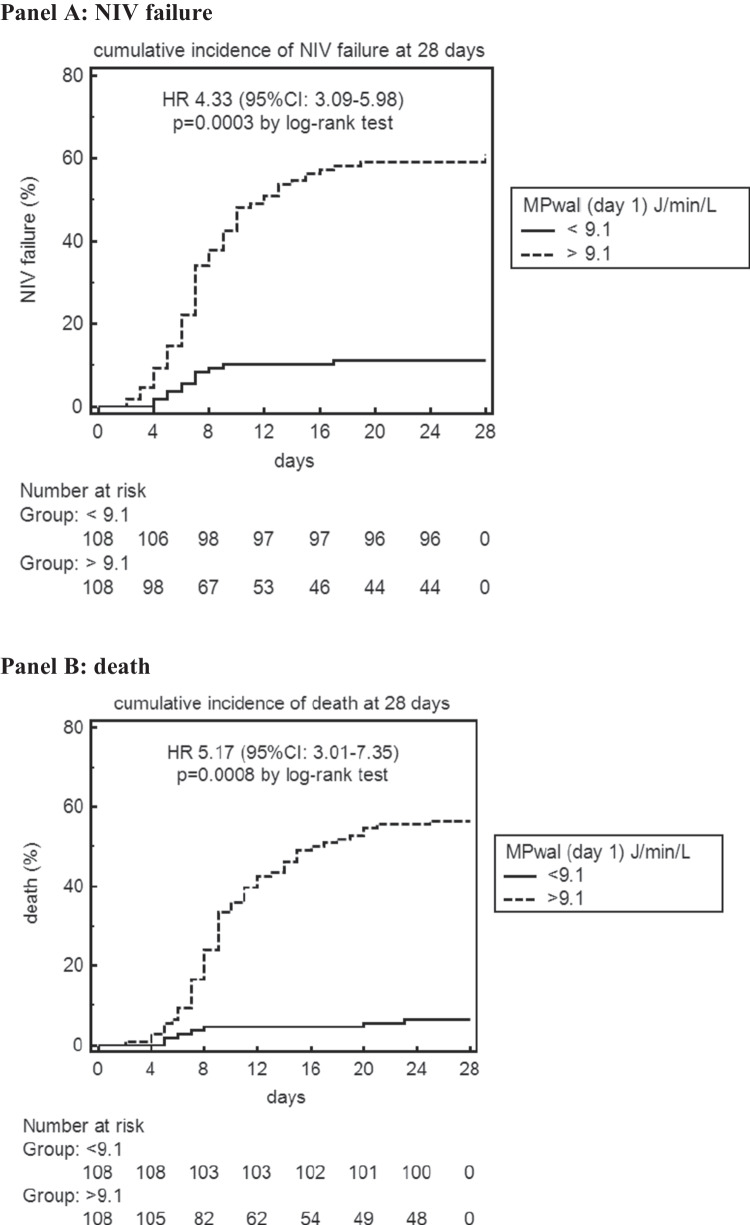
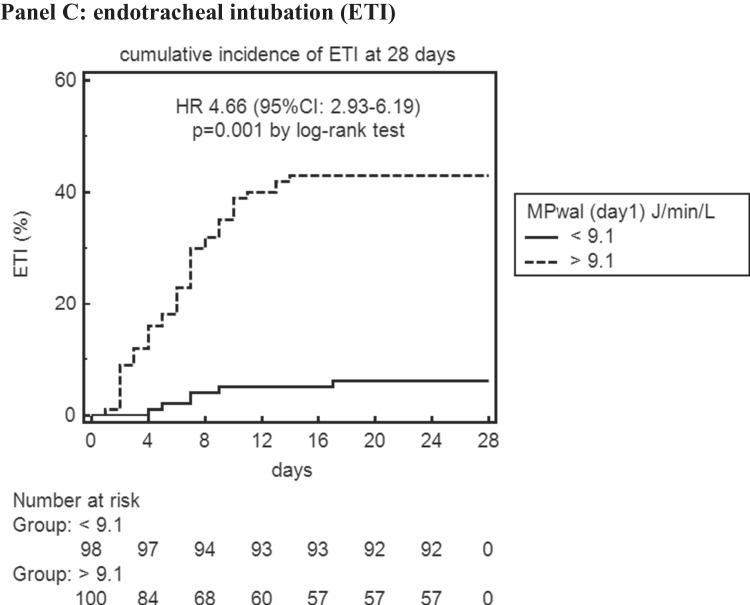
Patients receiving a high MPWAL during the 1st 24 h of NIV [MPWAL(day 1)] had higher 28-d NIV failure (HR = 4.33,95%CI:3.09 − 5.98) and death (HR = 5.17,95%CI: 3.01 − 7.35) risks than those receiving a low MPWAL(day 1).
In Cox multivariate analyses, MPWAL(day 1) remained independently associated with 28-d NIV failure (HR = 1.68,95%CI:1.15–2.41) and death (HR = 1.69,95%CI:1.22–2.32).
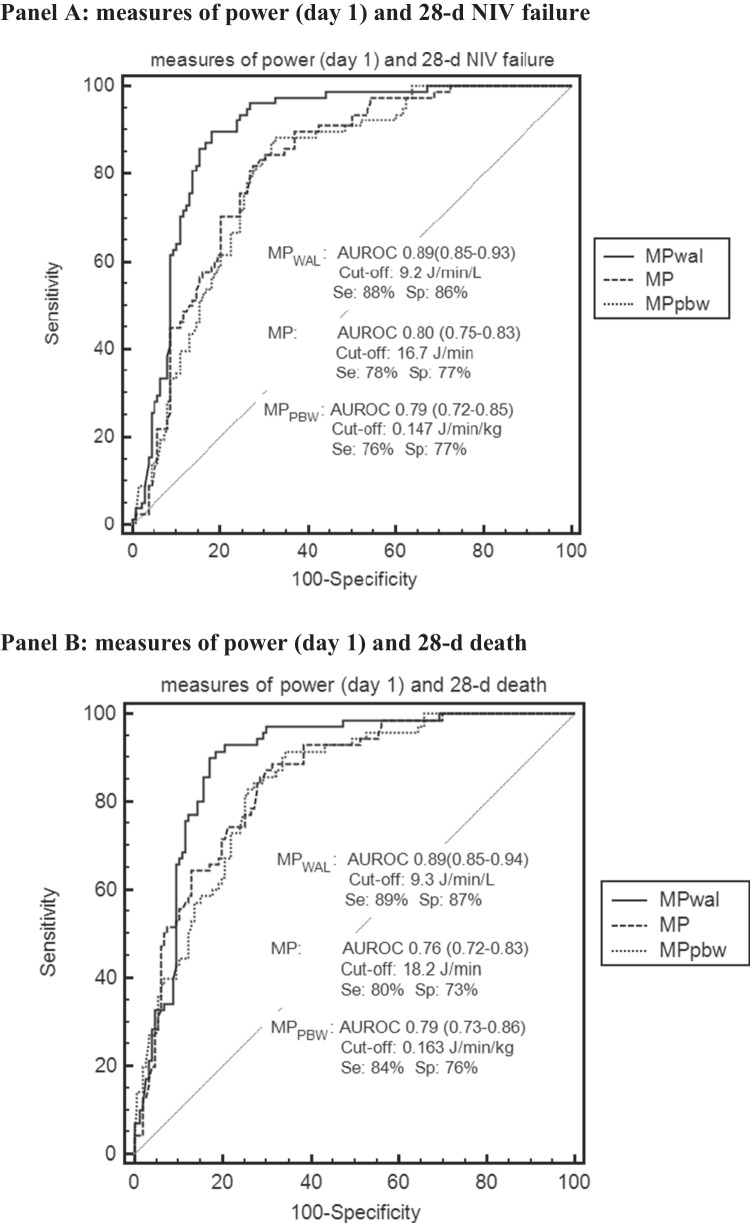
MPWAL(day 1) outperformed other power measures and ventilatory variables as predictor of 28-d NIV failure (AUROC = 0.89;95%CI:0.85–0.93) and death (AUROC = 0.89;95%CI:0.85–0.94).
MPWAL(day 1) predicted also gas exchange, ultrasonographic and inflammatory biomarker responses, as markers of VILI, on linear multivariate analysis.
Conclusions
In the framework of PPPM, early bedside MPWAL calculation may provide added value to predict response to NIV and guide subsequent therapeutic choices i.e. prone position adoption during NIV or upgrading to invasive ventilation, to reduce hazardous MPWAL delivery, prevent VILI progression and improve clinical outcomes in COVID-19-related AHRF.
Supplementary Information
The online version contains supplementary material available at 10.1007/s13167-023-00325-5.
Keywords: Predictive preventive personalized medicine (PPPM / 3PM), COVID-19, Hypoxemic respiratory failure, Individual outcomes, Differentially aerated lung volume, Predictive model, Noninvasive ventilation, Therapeutic choice, Lung ultrasound, Mechanical power, Well-aerated lung, Prone position
Introduction
The unmet need for accurate early predictors of treatment failure and death during noninvasive ventilation (NIV)
NIV is being increasingly used as first-line ventilatory support in de novo (i.e., not due to exacerbation of chronic lung disease or cardiac failure) acute hypoxemic respiratory failure (AHRF). However, concern has been raised that mechanical ventilation may exacerbate lung injury (i.e., ventilation-induced lung injury, VILI) and worsen outcome in spontaneously breathing patients with AHRF [1]. Different ventilatory variables have been proposed to contribute to VILI progression, including high tidal volume [2], minute ventilation [3] and inspiratory effort [4]: these parameters have been separately addressed in clinical studies, but data in noninvasively ventilated patients are scarce, inconsistent and inconclusive, at least in part due to the difficulty in controlling and monitoring time-varying individual ventilatory parameters in spontaneously breathing patients.
Potential contribution of Mechanical Power (MP) to clinical prediction in the framework of PPPM
Predictive, Preventive, and Personalized Medicine (PPPM) is an effective integrative approach, which has been promoted by the European Association for Predictive, Preventive and.
Personalized Medicine (EPMA, http://www.epmanet.eu/) [5]. It contains three aspects: individual predisposition prediction, targeted preventive measures and personalized treatment algorithms [6].
In recent years, a unifying patho-physiological theory, based on thermodynamic principles, has been proposed to underlie VILI: this theory attributes lung injury to the energy transfer from the ventilator to the pulmonary parenchyma, with energy dissipation within the lungs leading to heat production, cell integrity and extracellular matrix disruption, and inflammatory cell recruitment [7-9]. Consistently, mechanical power (MP), a measure of the energy transfer rate from the ventilator to the respiratory system, predicted mortality in invasively ventilated ARDS patients, irrespective of the combination of each ventilatory component [10-13].
Whether the energy delivered to the respiratory system during noninvasive ventilation (NIV) affects clinical outcomes in AHRF is unexplored. During COVID-19 pandemic, NIV intensity and duration were linked to an increased mortality in COVD-19-related AHRF [14-16], but no individual ventilatory parameter, including respiratory drive and inspiratory effort, was able to predict clinical outcomes [17-20]. Furthermore, clinical benefits from awake prone position (PP) during NIV have been reported by several, but not all studies, through still unclear mechanisms [21, 22].
Working hypothesis
We hypothesized the energy delivered by noninvasive ventilatory assistance to the respiratory system could contribute to physio-anatomical and clinical responses to NIV in Severe Acute Respiratory Syndrome Corona Virus 2 (SARS‐CoV‐2) pneumonia-related AHRF, and that the clinical benefits of awake PP in these patients could be at least in part mediated by a reduced MP delivery during prone NIV. We therefore investigated:
the effect of prone position (PP) on different measures of MP during NIV.
the contribution of MP measures delivered early during either supine or prone NIV to physio-anatomical and clinical outcomes in COVID-19 pneumonia
Methods
In this secondary analysis of the non-randomized, controlled Prone position in NonInvasive Ventilation (PRO-NIV) study(study ID: ISRCTN23016116) [23], we studied 216 SARS‐CoV‐2 pneumonia patients with acute (i.e. symptom onset < 14 days of hospital admission) moderate-to-severe AHRF(paO2/FiO2 ratio < 200 mmHg while on a FiO2 50% Venturi mask or a non-rebreather reservoir bag mask): 108 patients treated with NIV (CPAP or PSV) plus early PP and 108 matched controls treated with supine NIV) at HUMANITAS Gradenigo COVID Subintensive Care Unit between June 1st 2020 and June 30th 2021.
In both groups, NIV was initiated within 24 h of admission to Subintensive Care Unit and delivered continuously for ≥ 48 h or until discharge or death; full-face mask was the initial interface of choice. PP was initiated within 24 h of admission in the PP group. NIV and PP duration, equipment, settings, standard care, monitoring, treatment failure criteria were protocolized a priori before patients enrollment (see supplementary text, Supplementary Fig. 1, Supplementary Table 1) [23].
Measurements
Respiratory parameters
NIV duration, posture, ventilatory settings and parameters (spO2, RR, VTe, MV) were continuously monitored and recorded on an hourly basis on a predefined form.
ABGs were performed during NIV, every 24 h and ≥ 1 h after each postural change, after achievement of ventilatory stability (defined by a ≤ 10% variation in RR and VTe and air leaks < 10% for ≥ 30 min).
The following gas exchange parameters were calculated from ABG: paO2/FiO2 ratio and dead space indices (DSIs) [Ventilatory Ratio (VR) and corrected Minute Ventilation (MVcorr)]
The energy delivered by ventilatory assistance to respiratory system per time unit (mechanical power, MP) was estimated via Becher formula [24], which was already evaluated in noninvasively ventilated patients and was recommended to improve noninvasive ventilatory support monitoring in COVID-19 pneumonia [14, 25]. In this formula, ∆Pinsp was replaced by ∆Paw(airway pressure over PEEP) to reflect the energy imparted by ventilator during inspiration [1, 26].
Since NIV isa dynamic process, to reflect the power delivered during the entire ventilatory sessions, time weighted–average of hourly MP values during each NIV session (supine/prone) was calculated as the area under the parameter–versus–time plot (detailed in supplementary text) [27]. The same procedure was followed to calculate time weighted–average values of RR, VTe, and MV for each ventilator session and for each day.
For MV, we also planned to verify consistency between time-averaged values and those obtained at the time of ABGs, which were used to calculate DSIs.
The primary exposure variable of interest was MP normalized by the volume of well-aerated lung (MPWAL), to reflect the “intensity” of the power, i.e., the volume of well-aerated lung exposed to energy load during mechanical ventilation, during the 1st 24 h of NIV [MPWAL(day 1)].
We also normalized MP by predicted body weight (MPPBW) to account for individual lung size variation.
Lung imaging
All patients underwent a lung CT scan on admission: the nature and extent of parenchymal involvement were scored using a validated index [28] and the volume of well-aerated lung (WAL), of poorly aerated lung (PAL) and of non-aerated lung (NAL) were quantified on CT scans via a validated open-source software (3D Slicer ver.4.13.2) (see supplementary text) [29].
Lung ultrasound was performed daily from admission (day 0) to day 7 by three intensivists with expertise in lung and cardiac recording and interpretation (each operator having performed at least 50 supervised procedures and at least 200 non-supervised procedures) [30] using the same equipment (HM70A Samsung, Seoul, Korea), the same convex-array probe and the same setting.
The accuracy of ultrasound examinations in staging lung disease severity was preliminarily evaluated at baseline against the CT scan (double-blinded operators, LUS performed within 24 h of CT examination).
The severity and extent of parenchymal involvement of each of 6 lung regions (2 anterior, 2 lateral, 2 dorsal) were scored (range 0–3) [31] and recorded on a predefined form and the following indices were calculated (supplementary text):
regional and global lung ultrasound score (LUS);
regional and global LUS reaeration score, a validated index of lung recruitment (i.e., change from consolidated, non-aerated tissue to aerated tissue) [32, 33];
additionally, using software-based lung parenchyma segmentation and analysis function [29], each lung was divided into six areas to mirror as much as possible the regions explored by ultrasound, and regional and global LUS-derived WAL volume (i.e. lung volume with LUS score 0–1), PAL (i.e. lung volume with LUS score 2) and NAL (i.e. lung volume with LUS score 3) were derived from admitting LUS scan examinations as previously described in ARDS [34]. Global LUS-derived WAL volume, a predictor of COVID-19 pneumonia outcome [24], was then calculated from daily LUS scans through day 0–7(detailed in supplementary text).
The agreement between regional LUS score and regional CT classification was assessed with Cohen’s kappa coefficient, and the association between regional CT-derived gas/tissue content and regional LUS categories was assessed by simple linear regression and Spearman’s rank correlation (rs).
Details on full derivations are provided in supplementary text.
The PEEP at which each LUS examination was made was recorded.
Circulating biomarkers: eighteen circulating inflammatory and procoagulative biomarkers were measured daily from admission to discharge or death [35].
Definitions and timepoints
We adopted the following definitions:
day 0 (baseline): the time of NIV initiation;
day 1: first 24 h after NIV initiation;
day 7: day 7 after NIV initiation;
timepoint sp0: supine position. In PP group, the session preceded the first PP session. ABG was performed ≥ 1 h after supine NIV initiation, after achieving ventilatory stability;
timepoint pp1: first PP session in PP group. ABG was performed ≥ 1 h after prone NIV initiation, after achieving ventilatory stability;
timepoint sp1: supine position; ABG was performed ≥ 1 h after resupination following the first PP session in the PP group and 24 h after NIV initiation in the supine group, after achieving ventilatory stability;
This schedule allowed comparing all groups in the supine position, after 24 h of NIV, while taking into account the effect of the first PP session (pp1) in the PP group.
Further definitions are provided in legends to Table 1 and in a study scheme (Supplementary Fig. 1).
Table 1.
Baseline, treatment-related parameters and clinical outcomes of supine and PP group; within each treatment group, patients were divided according to median values of Mechanical PowerWAL during the 1st 24 h of NIV (MPWAL at day 1) into High MPwal (MPwal ≥ 9.1 J/min/L) or Low MPwal (MPwal < 9.1 J/min/L)(n = 216)
| Panel A: baseline parameters | ||||||||
| Parameter | Supine | PP | ||||||
|
All (n = 108) |
High MPwal (n = 66) |
Low MPwal (n = 42) |
P high vs. low |
All (n = 108) |
High MPwal (n = 41) |
Low MPwal (n = 67) |
P high vs. low |
|
| Age(yr) | 67(62, 75) | 68(62, 75) | 66(57, 74) | 0.592 | 66(56, 73) | 69(65, 75) | 65(56, 73) | 0.839 |
| Male sex(n, %) | 73(68%) | 41(62%) | 22(52%) | 0.812 | 75(69%) | 29(70%) | 46(61%) | 0.631 |
| White, non-hispanic(n, %) | 98(91%) | 60(90%) | 38(90%) | 0.892 | 97(90%) | 38(93%) | 59(88%) | 0.713 |
| Time from symptom onset to hospital admission(d)* | 7(5, 9) | 6(5, 8) | 7(5, 9) | 0.899 | 7(5, 9) | 7(5, 9) | 7(5, 9) | 0.638 |
|
Time from hospital admission to NIV (hrs) |
20(7, 56) | 20(7, 56) | 20(5, 62) | 0.802 | 20(7, 64) | 20(6, 61) | 20(7, 64) | 0.739 |
| BMI(kg/m2) |
27.8 (25.9, 31.2) |
27.7 (25.4, 30.2) |
28.1 (26.2, 30.7) |
0.782 |
28.0 (26.3, 30.5) |
27.9 (26.4, 30.1) |
28.2 (26.3, 30.5) |
0.631 |
| Obesity(BMI ≥ 30 kg/m2) n(%) | 36(33%) | 22(33%) | 14(33%) | 0.639 | 38(35%) | 13(32%) | 25(37%) | 0.412 |
| Type 2 diabetes mellitus n(%) | 26(24%) | 15(23%) | 11(26%) | 0.713 | 28(26%) | 13(31%) | 15(22%) | 0.492 |
| Hypertension n(%) | 60(56%) | 37(56%) | 23(52%) | 0.639 | 56(52%) | 22(54%) | 34(51%) | 0.579 |
| Chronic lung disease | ||||||||
| COPD | 12(11%) | 7(10%) | 5(12%) | 0.824 | 10(10%) | 4(10%) | 6(9%) | 0.902 |
| Asthma | 3(3%) | 1(1%) | 2(5%) | 0.538 | 3(3%) | 1(2%) | 2(3%) | 0.727 |
| Coronary artery disease n(%) | 3(5%) | 2(5%) | 1(5%) | 0.902 | 4(6%) | 2(7%) | 2(6%) | 0.859 |
| Chronic atrial fibrillation n(%) | 5(4%) | 3(4%) | 2(4%) | 0.572 | 6(6%) | 3(4%) | 3(4%) | 0.711 |
| Chronic kidney disease n(%) | 9(8%) | 5(8%) | 4(10%) | 0.713 | 10(9%) | 4(10%) | 6(9%) | 0.631 |
| Immunocompromised state | 1(1%) | 1(1%) | 0(0%) | 0.782 | 1(0%) | 0(0%) | 1(0%) | 0.972 |
| Smoking status: | ||||||||
|
former(%) current(%) |
10(10%) 10(10%) |
7(10%) 7(10%) |
3(8%) 3(8%) |
0.721 0.386 |
9(8%) 6(6%) |
4(10%) 2(5%) |
5(8%) 4(6%) |
0.598 0.383 |
| Do-not-Intubate (DNI) n(%) | 10(9%) | 6(9%) | 4(10%) | 0.739 | 8(8%) | 3(7%) | 5(8%) | 0.811 |
| ISARIC 4 C mortality score | 14(11, 17) | 14(11, 17) | 13(10, 16) | 0.593 | 14(10, 18) | 14(12, 18) | 13(10, 15) | 9.739 |
| SAPS II score | 36(32, 39) | 36(31, 39) | 35(30, 40) | 0.538 | 35(30, 41) | 36(32, 41) | 34(30, 39) | 0.513 |
| Lung CT scan volumes | ||||||||
|
WAL)(L) WAL(%) -Normally aerated (%) -Hyperynflated(%) PAL(L) PAL(%) NAL(L) NAL(%) |
2.0(1.5, 2.5) 49(43, 62) 46(44,55) 3(1, 4) 1.9(1.6, 2.3) 44(39, 50) 0.4(0.3, 0.5) 8(6, 10) |
2.0(1.6, 2.4) 49(44, 61) 50(45,55) 3(1, 4) 1.9(1.6, 2.3) 44(39, 50) 0.4(0.3, 0.5) 8(6, 10) |
1.9(1.6, 2.5) 50(41, 61) 51(44, 56) 3(2, 5) 1.2(1.0, 1.4) 36(30, 41) 0.5(0.4, 0.8) 9(7, 12) |
0.497 0.672 0.589 0.713 0.639 0.485 0.738 0.591 |
1.9(1.5, 2.4) 49(45, 58) 49(44, 55) 2(1, 4) 1.2(1.0, 1.4) 36(30, 41) 0.5(0.4, 0.7) 9(8, 13) |
1.9(1.6, 2.3) 50(39, 60) 49(42, 55) 4(2, 4) 1.7(1.1, 2.1) 44(40, 48) 0.4(0.4, 0.6) 9(8, 12) |
1.9(1.5, 2.4) 49(45, 58) 50(43, 54) 2(1, 4) 1.2(1.0, 1.4) 36(30, 41) 0.5(0.4, 0.7) 9(8, 13) |
0.725 0.539 0.582 0.798 0.607 0.361 0.811 0.496 |
| Lung global CT severity score | 46(31, 63) | 45(31, 63) | 47(31, 61) | 0.621 | 47(31, 62) | 46(32, 65) | 47(31, 62) | 0.639 |
| Lung global LUS severity score | 25(22, 28) | 25(22, 28) | 24(23, 28) | 0.838 | 25(22, 29) | 25(23, 28) | 25(22, 28) | 0.729 |
| C-reactive protein (mg/dL) | 13.9(10.5, 18.5) | 13.7(10.2,18.9) | 14.3(10.9,19.0) | 0.817 | 13.5(10.5,19.2) | 13.2(10.6,18.9) | 13.9(10.5,19.2) | 0.813 |
| Temperature(°C) |
36.6 (36.1, 36.9) |
36.6 (36.1, 36.9) |
36.5 (36.0, 36.9) |
0.713 |
36.6 (36.2, 37.0) |
36.5 (36.1, 36.9) |
36.6 (36.2, 37.0) |
0.712 |
| Sys BP (mmHg) |
130 (120, 141) |
130 (120, 141) |
130 (118, 140) |
0.630 |
133 (119, 142) |
130 (116, 140) |
133 (119, 142) |
0.767 |
| Dia BP (mmHg) | 75(65, 80) | 75(65, 80) | 75(68, 89) | 0.784 | 75(68, 89) | 75(68, 89) | 75(68, 89) | 0.784 |
| Heart Rate (beats/min) | 85(71, 96) | 85(71, 96) | 81(70, 99) | 0.837 | 83(75, 98) | 81(70, 99) | 83(75, 98) | 0.698 |
| NRS (Dyspnoea)# | 3(2,5) | 3(2,5) | 4(2,6) | 0.528 | 4(2,6) | 3(2,6) | 4(2,6) | 0.612 |
| WOB scale# | 3(2, 3) | 3(2, 3) | 3(2, 3) | 0.582 | 3(2, 3) | 3(2, 3) | 3(2, 3) | 0.812 |
| RR(breaths/min)# | 26(24, 30) | 27(24, 30) | 25(22, 30) | 0.219 | 26(24, 30) | 27(24, 30) | 25(22, 30) | 0.227 |
| PaO2/FiO2 ratio# | 104(78, 137) | 102(78, 137) | 105(76, 140) | 0.429 | 103(79, 136) | 102(80, 139) | 104(79, 136) | 0.728 |
| PaO2/FiO2 ratio category n(%)# | ||||||||
|
150–199 100–149 < 100 |
17(16%) 35 (32%) 56(52%) |
10(15%) 22 (33%) 35(53%) |
7(17%) 13(31%) 21(50%) |
0.439 0.580 0.479 |
16(15%) 35 (32%) 57(53%) |
6(15%) 15 (37%) 21(51%) |
10(15%) 20 (30%) 36(54%) |
0.913 0.294 0.683 |
| paCO2 (mmHg)# | 34(31, 37) | 34(31, 37) | 35(32, 39) | 0.713 | 36(31, 40) | 35(31, 38) | 36(31, 40) | 0.602 |
| paCO2 > 45 mmHg# n(%) | 1(1%) | 1(1%) | 0(0%) | 0.912 | 0(0%) | 0(0%) | 0(0%) | 0.983 |
| Arterial pH# |
7.47 (7.45, 7.49) |
7.47 (7.45, 7.49) |
7.46 (7.44, 7.49) |
0.734 |
7.45 (7.42, 7.49) |
7.47 (7.44, 7.49) |
7.45 (7.42, 7.49) |
0.691 |
| Adiuvant therapies | ||||||||
| Dexamethasone 6 mg/d | 108 (100%) | 66 (100%) | 42(100%) | 0.999 | 108(100%) | 41(100%) | 67(100%) | 0.999 |
| Antivirals | ||||||||
|
Remdesivir Lopinavir/ritonavir |
1(1%) 0 |
1(1%) 0 |
1 0 |
0.999 0.999 |
1 0 |
0 0 |
(1%) 0 |
0.999 0.999 |
| Hydroxychloroquine | 0 | 0 | 0 | 0.999 | 0 | 0 | 0 | 0.999 |
| Tocilizumab | 3(3%) | 2(6%) | 1(2%) | 0.712 | 0 | 0 | 0 | 0.999 |
| Convalescent plasma | 1(1%) | 1(1%) | 0 | 0.999 | 0 | 0 | 0 | 0.999 |
|
Enoxaparin Prophylactic dose Intermediate dose# Anticoagulant dose |
104(96%) 49(45%) 13(/12%) 42 (39%) |
63(96%) 30(45%) 8(/12%) 26 (39%) |
40(96%) 18(42%) 8(19%) 16 (37%) |
0.631 0.610 0.583 0.325 |
104(96%) 49(45%) 13(/12%) 42 (39%) |
39(96%) 18(45%) 5(12%) 16(39%) |
64(96%) 28(42%) 13(19%) 25 (37%) |
0.731 0.615 0.592 0.435 |
| Warfarin/DOACs | 4(4%) | 2(3%) | 2(5%) | 0.531 | 4(4%) | 1(2%) | 3(4%) | 0.612 |
| SARS-CoV-2 vaccine | 0(0%) | 0(0%) | 0(0%) | 0.999 | 0(0%) | 0(0%) | 0(0%) | 0.999 |
| Panel B: treatment-related parameters | ||||||||
| Supine | PP | |||||||
|
All (n = 108) |
High MPwal (n = 66) |
Low MPwal (n = 42) |
P high vs. low |
Low MPwal (n = 67) |
High MPwal (n = 41) |
Low MPwal (n = 67) |
P high vs. low |
|
| Duration of the 1st PP session (hrs) | – | – | – | – | 11.8(10.1, 13.9) | 12.1(10.1, 14.0) | 11.8(10.1, 13.9) | 0.571 |
|
Daily hours of PP therapy at 28 days |
– | – | – | – | 16.0( 13.9, 18.1) | 16.9(14.7, 18.9) | 16.0( 13.9, 18.1) | 0.439 |
| Days of PP therapy | – | – | – | – | 5(4, 7) | 5(4, 7) | 5(4, 7) | 0.312 |
| Patients completing ≥ 1 PP session/day for ≥ 2 consecutive days (n, %) | – | – | – | – | 108(100%) | 41(100%) | 67(100%) | 0.999 |
| Dexmedetomidine infusion during NIV (n, %) | 38(35%) | 24(36%) | 14(33%) | 0.712 | 82(76%) | 32 (78%) | 50(75%) | 0.813 |
| Daily hours of NIV | ||||||||
|
Day 1 Day 0–7§ |
24(24, 24) 21.2(20.0, 22.9) |
24(24, 24) 21.6(20.4,22.9) |
24(24, 24) 19.7(18.4,22.5) |
0.999 0.513 |
24(24, 24) 20.6(19.6,22.8) |
24(24, 24) 21.5(20.4,22.7) |
24(24, 24) 20.2(18.6,22.8) |
0.999 0.495 |
| Days of NIV | 8(6, 11) | 8(6, 11) | 7(6, 10) | 0.316 | 7(6, 10) | 7(6, 10) | 7(6, 10) | 0.316 |
| Ventilatory mode(%): | ||||||||
| CPAP/PSV | ||||||||
|
Day 0 Day 1 Day 7 |
52%/48% 52%/48% 58%/42% |
57%/43% 57%/43% 59%/41% |
58%/42% 58%/42% 61%/39% |
0.417 0.417 0.327 |
52%/48% 52%/48% 60%/40% |
56%/44% 56%/44% 59%/41% |
57%/43% 57%/43% 71%/40% |
0.649 0.649 0.472 |
| Interface(%): | ||||||||
| Full-face mask/helmet | ||||||||
|
Day 0 Day 1 day 7 |
100%/0% 100%/0% 96%/4% |
100%/0% 100%/0% 94/6% |
100%/0% 100%/0% 98%/2% |
0.999 0.893 0.831 |
100%/0% 100%/0% 96%/4% |
100%/0% 100%/0% 93%/7% |
100%0% 100%/0% 97%/3% |
0.999 0.999 0.749 |
| PEEP (cmH2O) | ||||||||
|
Day 0 Day 1 Day 0–7§ |
8(8, 9) 8(8, 9) 8(7, 10) |
8(8, 9) 8(8, 9) 9(8, 10) |
8 (7,8) 8(7,8) 8(7.8) |
0.813 0.821 0.192 |
7 (7, 9) 7(7, 9) 7(6. 8) |
8(7, 9) 8(7, 9) 8(7,9) |
7 (6, 8) 7(6, 8) 7(6. 7) |
0.612 0.297 0.103 |
| Pressure Support(Ps) during PSV (mH2O) | ||||||||
|
Day 0 Day 1 Day 0–7§ |
4(3, 5) 4(3, 5) 4(3, 5) |
4(3, 5) 4(3, 5) 4(3, 5)) |
3(3, 4) 3(3, 4) 3(3, 5) |
0.649 0.418 0.214 |
4(3, 5) 4(3, 5) 4(3, 5) |
4(3, 5) 4(3, 5) 4(3, 5) |
3(3, 4) 3(3, 4) 3(3, 5) |
0.492 0.317 0.118 |
| NRS (Dyspnoea) | ||||||||
|
Day 0 Day 1 Day 0–7§ |
2(0,3) 2(0,4) 2(1, 3) |
2(0,3) 2(0,4) 3(1, 4) |
2(0,3) 2(0,3) 1(0, 2) |
0.712 0.429 0.034 |
2(0,3) 2(0,3) 2(0, 4) |
2(0,3) 2(0,4) 3(1, 4) |
2(0,3) 2(0,3) 1(0, 2) |
0.839 0.736 0.021 |
| WOB scale | ||||||||
|
Day 0 Day 1 Day 0–7§ |
2(1, 3) 2(1,3) 3(2, 4) |
2(1, 3) 2(1,3) 3(2, 4) |
2(1, 3) 2(1,3) 1(1, 2) |
0.629 0.582 0.035 |
2(1, 3) 2(1,3) 1(1, 2) |
2(1, 3) 2(1,3) 3(2,4) |
2(1, 3) 2(1,3) 1(1, 2) |
0.412 0.493 0.022 |
| FiO2 | ||||||||
|
Day 0 Day 1 Day 0–7§ |
0.50(0.45, 0.70) 0.50(0.45, 0.70) 0.50(0.40, 0.60) |
0.50(0.45,0.70) 0.50(0.45,0.70) 0.60(0.50,0.75) |
0.50(0.45,0.70) 0.50(0.45,0.70) 0.40(0.35,0.50) |
0.783 0.698 0.028 |
0.50(0.45,0.70) 0.50(0.45,0.70) 0.45(0.35,0.50) |
0.50(0.50,0.70) 0.50(0.50,0.70) 0.50(0.50,0.70) |
0.50(0.45,0.70) 0.50(0.40,0.70) 0.40(0.35,0.50) |
0.712 0.512 0.031 |
| VTe (ml/kg prBW) | ||||||||
|
Day 0 Day 1 Day 0–7§ |
7.6 (7.1, 8.4) 7.6(7.2, 8.8) 7.7(7.3, 8.3) |
8.0(7.6, 8.1) 7.8(7.2, 8.8) 8.0 (7.2, 8.8) |
7.3(6.5, 8.4) 7.2(6.7, 8.6) 7.4(6.8, 8.6) |
0.412 0.272 0.231 |
7.5(6.7, 8.5) 7.4(6.6, 8.5) 7.6 (6.8, 8.6) |
7.7(6.9, 8.6) 7.6(7.1, 8.4) 7.9 (7.1, 8.6) |
7.4(6.5, 8.5) 7.2(6.6, 8.4) 7.6 (6.8, 8.6) |
0.595 0.384 0.611 |
| RR(breaths/min) | ||||||||
|
Day 0 Day 1 Day 0–7§ |
25(22, 30) 24(22, 26) 26(22, 28) |
27(24, 30) 26(22, 28) 26(22, 28) |
24(22, 28) 22(20, 24) 21(20, 25) |
0.712 0.39 0.018 |
25(22, 30) 24(20, 27) 22(20, 25) |
25(22, 30) 26(22, 28) 26(22, 27) |
24(22, 26) 22(20, 25) 21(20, 25) |
0.837 0.391 0.021 |
| MV (L/min) | ||||||||
|
Day 0 Day 1 Day 0–7§ |
14.2(11.1, 16.1) 13.6(12.6, 15.2) 14.0(11.4, 16.1) |
14.2(11.1,16.1) 13.9(12.6,15.4) 14.4(11.9,16.1) |
13.4(11.0,16.9) 13.1(10.6,15.3) 13.0(10.2,15.6) |
0.817 0.534 0.159 |
13.6(11.1,16.7) 13.3(10.9,15.3) 13.9(12.1,15.9) |
13.9(11.9,15.6) 13.8(11.9,15.7) 13.9(12.1,15.9) |
13.6(11.1,16.7) 13.1(10.6,15.3) 11.9(11.1,15.9) |
0.412 0.239 0.118 |
| Time from NIV initiation to 1st PP session(hrs) | – | – | – | – | 3(2, 4) | 3(2, 4) | 3(2, 4) | - |
| MPsp0 (J/min) | 17.5(11.3,20.0) | 29.7(20.5,28.7) | 9.1(6.9,13.4) | < 0.001 | 18.3(15.4,24.9) | 29.9(25.5,33.9) | 13.1(10.1,16.9) | < 0.001 |
| MPPBW sp0 (J/min/kg) | 0.21(0.13,0.26) | 0.24(0.16,0.28) | 0.13(0.10,0.27) | < 0.001 | 0.20(0.16,0.27) | 0.25(0.17,0.29) | 0.17(0.11,0.24) | < 0.001 |
| MPWALsp0 (J/min/L) | 9.9(8.0, 13.2) | 15.8(10.9,28.0) | 6.1(4.4, 8.9) | < 0.001 | 9.8(8.1, 13.1) | 17.1(11.2,21.7) | 8.1(501, 11.9) | < 0.001 |
| MP (J/min) | ||||||||
|
Day 1 Day 2 Day 1–7 |
16.7(10.5,19.2) 16.1(10.8,19.8) 16.6(10.1,19.5) |
27.8(24.5,31.9) 28.1(24.9,32.2) 27.6(24.1,31.5) |
8.7(6.3,10.2)8.8(6.6,10.1) 9.1(8.2, 10.4) |
< 0.001 < 0.001 < 0.001 |
16.9(10.8,19.3) 17.2(10.4,21.1) 16.8(10.2,20.4) |
27.5(25.1,31.9) 27.8(25.0,32.2) 27.4(24.2,33.1) |
8.5(6.5,9.2) 8.9(6.8,9.6) 8.8(6.4, 9.4) |
< 0.001 < 0.001 < 0.001 |
| MPPBW (J/min/kg) | ||||||||
|
Day 1 Day 2 Day 1–7 |
0.19(0.10, 0.23) 0.18(0.12, 0.23) 0.19(0.10, 0.20) |
0.23(0.17,0.26) 0.23(0.17,0.26) 0.23(0.12,0.26) |
0.12(0.10,0.29) 0.13(0.11,0.29) 0.13(0.11,0.21) |
< 0.001 < 0.001 < 0.001 |
0.18(0.16,0.22) 0.19(0.15,0.22) 0.18(0.15,0.24) |
0.23(0.17,0.27) 0.22(0.16,0.27) 0.23(0.20,0.29) |
0.12(0.10,0.29) 0.12(0.12,0.29) 0.12(0.11,0.22) |
< 0.001 < 0.001 < 0.001 |
| MPWAL (J/min/L) | ||||||||
|
Day 1 Day 2 Day 1–7 |
9.3(5.7,21.2) 9.0(5.1,20.6) 8.6(4.7,18.9) ‡ |
15.7(12.1,27.1) 15.6(12.1,29.0) 18.5(14.7,22.9) ‡ |
5.3(4.1, 7.4) 5.1(3.7, 7.1) 4.6(3.6, 6.2) ‡ |
< 0.001 < 0.001 < 0.001 |
8.9(5.5,20.0) 8.9(5.2, 19.4) 9.9(6.7,18.9) ‡ |
16.2(13.8,23.9) 16.0(12.9,22.1) 20.6(16.1,26.3) ‡ |
4.9(4.2, 7.9) 4.7(4.1, 7.9) 4.5(3.6,5.9) ‡ |
< 0.001 < 0.001 < 0.001 |
| pH | ||||||||
|
Day 0 Day 1 Day 0–7§ |
7.48(7.45, 7.50) 7.46(7.44, 7.48) 7.46(7.43, 7.49) |
7.47(7.45,7.49) 7.46(7.44,7.47) 7.46(7.43,7.49) |
7.47(7.42,7.48) 7.46(7.41,7.49) 7.43(7.40,7.46) |
0.471 0.413 0.394 |
7.47(7.45,7.49) 7.46(7.41,7.47) 7.45(7.43,7.47) |
7.46(7.42,7.50) 7.45(7.42,7.48) 7.44(7.40,7.48) |
7.47(7.44,7.48) 7.45(7.41,7.47) 7.42(7.40,7.46) |
0.498 0.479 0.309 |
| paCO2 nnHg | ||||||||
|
Dat 0 Day 1 Day 0–7§ |
35(33, 39) 35(35, 40) 36(35, 40) |
35(33, 39) 35(35, 40) 36(35, 40) |
35(34, 40) 34(32, 39) 35(32, 40) |
0.391 0.437 0.562 |
35(34, 40) 34(32, 39) 35(32, 39) |
35(33, 39) 35(34, 40) 35(34, 39) |
35(34, 40) 34(32, 39) 37(32, 39) |
0.713 0.316 0.513 |
| PaO2/FiO2 ratio | ||||||||
|
sp0 sp1 sp0-7 § |
147(116, 218) 155(135, 219) 178(142, 197) ‡ |
149(115, 220) 143(122,193) 150(127, 199) |
142(110, 205) 168(130, 233) ‡ 185(168, 221) ‡ |
0.562 0.009 0.002 |
142(116, 192) 181(139, 219) ‡ 198(159,231) ‡‡ |
143(114, 192) 152(118, 180) 155(128, 192) |
141(119, 193) 198(152, 232) ‡ 220(163, 273) ‡‡ |
0.629 0.001 < 0.001 |
|
O2 responders n (%) (paO2/FiO2 sp0-1 > 0) |
42(39%) | 16(34%) | 26(62%) | 0.009 | 71(66%)∏ | 17(41%) | 54(81%) | 0.002 |
| VR≠ | ||||||||
|
sp0 sp1 sp0-7§ |
1.9(1.5, 2.4) 1.9(1.6, 2.3) 1.9(1.5, 2.4) |
1.9(1.6, 2.3) 2.2(1.9, 2.3) ‡ 2.3(1.8, 2.4) ‡ |
2.0(1.4, 2.4) 1.6(1.2, 2.3) ‡ 1.6(1.0–2.2) ‡ |
0.735 0.010 0.008 |
1.9(1.5, 2.3) 1.6(1.4, 2.0) ‡ 1.5(1.1–1.9) ‡ |
1.9(1.5, 2.3) 1.9(1.6, 2.3) 1.9(1.6, 2.3) |
1.9(1.6, 2.3) 1.5(1.3, 2.0) ‡ 1.4(0.9, 1.7) ‡‡ |
0.512 0.009 < 0.001 |
| MVcorr (L/min)≠ | ||||||||
|
sp0 sp1 sp0-7§ |
12.1(10.1, 13.7) 12.5(10.2, 14.9) 12.5(10.2, 15.1) |
12.2(10.1,13.7) 12.7(10.2,14.9) ‡ 13.2(11.2,15.3) ‡ |
11.9(10.1,13.7) 10.9(9.3, 12.6) ‡ 10.9(9.0, 12.3) ‡ |
0.638 0.009 < 0.001 |
11.9(10.1,13.7 11.0(9.8, 12.6) ‡ 11.1(9.9, 12.3) ‡ |
12.3(11.4,13.4) 12.1(10.5,13.5) 12.2(10.4,14.0) |
11.9(10.1,13.7) 10.8(9.3, 12.6) ‡ 10.5(8.9, 12.3) |
0.638 0.009 < 0.001 |
|
CO2 responders n(%) (VR sp0-1 < 0) |
32(30%) | 11(16%) | 21(50%) ≠ | 0.004 | 47/66(71%)∏ | 12(29%) | 47(71%) ≠ | < 0.001 |
| Ventral LUS | ||||||||
|
score Day 0 Day 1 Day 0–7§ |
6(5, 9) 6(5,7) 6(5,7) |
7(5, 9) 7(5,9) 7(5,9) |
6(4, 8) 5(5, 7) 4(3, 7) |
0.496 0.514 0.138 |
7(5, 8) 7(5, 8) 8(4, 7) |
7(5, 8) 7(5, 8) 8(5, 7) |
7(5, 8) 7(5, 8) 7(4, 7) |
0.496 0.514 0.138 |
| Lateral LUS | ||||||||
|
score Day 0 Day 1 Day 0–7§ |
8(7, 9) 8(7, 9) 8(7, 10) |
8(7, 9) 8(7, 9) 8(7, 10) |
8(7,9) 7(6, 8) 7(6, 8) |
0.839 0.010 0.028 |
8(7,9) 7(7, 8) 6(5, 7) |
8(7, 9) 8(7, 9) 6(5, 10) ‡ |
8(7,9) 6(7, 8) ‡ 6(5, 7) ‡ |
0.839 0.010 < 0.001 |
| Dorsal LUS score | ||||||||
|
Day 0 Day 1 Day 0–7§ |
10(9, 11) 10(9, 11) 10(9, 12) |
10(9, 11) 11(9, 12) 11(9, 13) |
10(9, 11) 10(7, 11) 10(8, 12) |
0.735 0.041 0.010 |
10(9, 11) 8(7, 10) ‡ 6(5, 8) ‡‡ |
10(9, 11) 10(9, 11) 8(6, 10) ‡ |
10(9, 11) 8(7, 10) ‡ 6(5, 8) ‡‡ |
0.735 0.009 < 0.001 |
| Global LUS score | ||||||||
|
Day 0 Day 1 Day 0–7§ |
24(22, 28) 24(20, 27) 24(20, 27) |
25(22, 27) 26(21, 27) 26(21, 28) |
24(22, 28) 22(18, 25) ‡ 21(18, 24) ‡ |
0.851 0.004 < 0.001 |
25(21, 28) 22(19, 26) ‡ 21(18, 24) ‡‡ |
25(22, 28) 25(22, 28) 22(20, 26) ‡ |
25(21, 28) 21(18, 24) ‡ 19(16, 22) ‡‡ |
0.719 0.006 < 0.001 |
| Global LUS reaeration score | ||||||||
|
Day 1 Day 1–7§ |
0(-4, 1) -1(-5, 1) |
0(-7, -2) -6(-9, -4) |
1(-1, 4) 5(2, 8) |
0.021 0.008 |
4(3, 8) 8(4, 11) |
2(-1, 5) 5(2, 8) |
6(5, 10) 10(6, 14) ‡‡ |
0.009 < 0.001 |
| Global LUS reaeration score ≥ 8 (n,%) | ||||||||
|
Day 1 Day 1–7§ |
9(8%) 20(19%) |
0(0%) 0(0%) |
9(21%) 19(45%)‡ |
0.002 < 0.001 |
26(24%) 59(55%)‡‡ |
1(2%) 11(26%) |
25(37%) 48(71%) ‡‡ |
0.008 < 0.001 |
| WAL (%) | ||||||||
|
Day 0 Day 1 Day 0–7§ |
50(43, 59) 48(41, 60) 49(38, 62) |
50(46, 61) 46(41, 57) 38(34, 56) ‡‡ |
50(41, 61) 50(42, 62) 59(49, 69) ‡‡ |
0.629 0.012 < 0.001 |
49(41, 59) 55(46, 62) ‡ 58(52,64) ‡‡ |
49(39, 60) 49(40, 60) 51(42, 62) |
49(45, 59) 57(51, 64) ‡ 64(55, 70) ‡‡ |
0.798 0.009 < 0.001 |
| Blood lactate (mmol/L) | ||||||||
|
day 0 day1 day 0–7 § |
1.0 (0.9, 1.1) 1.1(1.0, 1.2) 1.2(1.0, 1.3) |
1.0 (0.9, 1.1) 1.1(1.0, 1.2) 1.2(1.0, 1.3) |
1.0 (0.9, 1.1) 1.1(1.0, 1.2) 1.1(1.0, 1.2) |
0.734 0.513 0.317 |
1.0 (0.9, 1.2) 1.1(1.0, 1.2) 1.1(1.0, 1.2) |
1.0 (0.9, 1.2) 1.1(1.0, 1.2) 1.2(1.1, 1.3) |
1.0 (0.9, 1.2) 1.1(1.0, 1.2) 1.1(1.0, 1.2) |
0.712 0.462 0.479 |
| C-reactive protein (mg/dL) | ||||||||
|
day 0 day1 day 0–7§ |
14.5(10.5, 19.0) 13.4(9.9, 18.9) 11.7(6.2, 14.1) ‡ |
14.7(10.2,18.9) 15.2(10.5,19.2) 13.9(10.2,16.4) |
14.2(10.9,19.0) 11.5(7.5,14.5)‡ 7.4(2.1, 9.0) ‡‡ |
0.817 0.011 < 0.001 |
13.5(10.5,19.2) 9.8(7.5, 12.5) ‡ 4.5(3.1, 8.0) ‡‡ |
13.2(10.6,18.9) 12.1(8.8, 19.1) 9.8(7.3, 16.1) |
13.9(10.5,19.2) 8.4(4.6, 12.3) ‡ 1.5(3.1, 1.0) ‡‡ |
0.813 < 0.001 < 0.001 |
| Procalcitonin (ng/mL)†† | ||||||||
|
day 0 day1 day 0–7 § |
0.52(0.40, 0.62) 0.41(0.31, 0.69) 0.31(0.17, 0.45) ‡ |
0.54(0.40,0.62) 0.51(0.41,0.69) 0.51(0.17,0.65) |
0.58(0.41,0.67) 0.35(0.15,0.55) ‡ 0.10(0.02,0.20) ‡‡ |
0.612 0.007 < 0.001 |
0.57(0.41,0.67) 0.35(0.15,0.55)‡ 0.25(0.12,0.37) ‡‡ |
0.56(0.40,0.65) 0.49(0.42,0.63) 0.46(0.39,0.61) |
0.58(0.41,0.67) 0.15(0.05,0.25) ‡ 0.05(0.02,0.10) ‡‡ |
0.612 0.002 < 0.001 |
| D-dimer (mg/L) | ||||||||
|
day 0 day 1 day 0–7§ |
3.1(1.5, 3.9) 3.1(1.9, 4.0) 1.9(1.0, 4.9) ‡ |
3.1(1.7, 3.9) 3.5(1.9, 4.1) 3.9(2.0, 4.9) |
2.9(1.9, 3.8) 2.5(1.8, 3.2) 0.9(0.3, 1.4) ‡ |
0.629 0.215 0.002 |
2.8(1.4, 3.4) 2.6(1.4, 3.2) 1.0(9.3, 1.9) ‡‡ |
2.9(1.7, 3.8) 3.0(1.8, 3.9) 2.9(1.5, 3.9) |
2.7(1.4, 3.4) 2.4(1.4, 3.2) 0.7(0.3, 0.9) ‡‡ |
0.712 0.215 0.002 |
| Panel C: Clinical outcomes | ||||||||
| Supine | PP | |||||||
|
All (n = 108) |
High MPwal (n = 66) |
Low MPwal (n = 42) |
P high vs. low |
All (n = 108) |
High MPwal (n = 41) |
Low MPwal (n = 67) |
P high vs. low |
|
| NIV failure at 28 d | 56 (52%) | 47(70%) | 9(21%) ≠ | < 0.001 | 20(19%)∏ | 17(42%) | 3(4%) ≠ | < 0.001 |
| Days to NIV failure | 7(6, 7) | 7(6, 7) | 8(7, 8) | 0.713 | 8(7, 8) | 7(6,7) | 8(7, 8) | 0.227 |
| Death at 28 d | 52(48%) | 45(67%) | 7(17%) | < 0.001 | 16(15%)∏ | 15(37%) | 1(2%) ≠ | < 0.001 |
| Days to death | 12(9, 15) | 12(9, 15) | 15(14, 18) | 0.213 | 15(14, 18) | 13(11, 15) | 15(14, 18) | 0.139 |
| ETI at 28 d |
38/99 (38%) |
34/62 (55%) |
4/37(11%) | 0.004 | 11/97 (11%) | 9/36(25%) | 2/61 (3%)** | 0.011 |
| Days to ETI | 7(6, 7) | 7(6, 7) | 8(7, 8) | 0.529 | 8(7, 8) | 7(6,7) | 8(7, 8) | 0.239 |
| Death at 60 d | 52(48%) | 45(67%) | 7(17%) | < 0.001 | 17(15%)∏ | 16(37%) | 1(2%) ≠ | < 0.001 |
| Days in ICU | 9(2, 16) | 9(2, 16) | 6(2, 10) | 0.129 | 6(2, 10) | 8(2, 12) | 6(2, 10) | 0.198 |
For each parameter median (IQR) is indicated, unless otherwise specified
The P values refer to comparison between low MPWAL and high MPWAL group within supine and PP treatment groups (statistically significant p-values are written in bold characters). Data are expressed as median (IQR) or as n(%) values, unless otherwise specified
*P < 0.05 vs. High MPWAL (day 1), within the same treatment group (PP or supine)
** P < 0.01 vs. High MPWAL (day 1), within the same treatment group (PP or supine)
≠ P < 0.001 vs. High MPWAL (day 1), within the same treatment group (PP or supine)
ǁ P < 0.05 vs. supine group
¶ P < 0.01 vs. supine group
∏P < 0.001 vs. supine group
† P < 0.01 vs. timepoint sp0
‡ P < 0.01 vs. day 0
‡‡ P < 0.001 vs. day 0
# on admission, while on a FiO2 50% Venturi mask or a non-rebreather reservoir bag mask
## prophylactic dose twice daily
†† patients with documented infection (n = 4 within each group) were excluded from this analysis
Abbreviations: ABG: arterial blood gas analysis; DOAC: direct oral anticoagulants; ISARIC: International Severe Acute Respiratory Infection Consortium; MP: mechanical power; MPPBW: mechanical power corrected for predicted body weight; MPWAL: mechanical power corrected for well-aerated lung volume; NAL: non-aerated lung volume; NIV: noninvasive ventilation; NRS: numeric rating scale; PAL: poorly aerated lung volume; PP: prone position; RR: respiratory rate; SAPS: Simplified acute physiology score; WAL: well-aerated lung volume; WOB( work of breathin scale, as determined by Apigo scale
For each parameter median (IQR) is indicated, unless otherwise specified
The P values value refer to comparison between groups at baseline, at the end of follow-up and to comparison in changes during the follow-up, respectively (statistically significant p-values are written in bold characters). Data are expressed as mean ± SEM
Definitions:
Baseline: day of enrollment, before NIV initiation
§Day 0: baseline, i.e. the time of NIV initiation in both treatment groups
§Day 1: the first 24 h of NIV in both (PP and supine) treatment groups
§Day 7: day 7 after NIV initiation in both (PP and supine) treatment groups
§Day 0–7: mean value through day 0–7. Between-group comparison was made with repeated measures two-factor (within subject and between group) ANOVA, after log-transformation of non-normal variables
sp0: ≥ 1 h since (supine) NIV initiation on day 0
sp1: 24 h after NIV initiation in both (PP and supine) treatment groups
O2 response: change in paO2/FiO2 ratio during NIV in supine position at day 1 (timepoint sp1) as compared with timepoint sp0
A positive O2 response is defined by: pO2/FiO2sp1—pO2/FiO2sp0 > 0, or ∆paO2/FiO2sp0-1 > 0
CO2 response: an increase in CO2 clearance, defined by a reduction in dead space indices (VR and MVcorr, tested separately) at sp1 as compared with timepoint sp0
A positive CO2 response is defined by: VRsp1-VRsp0 < 0 (or ∆VRsp0-1 < 0) and by MVcorrsp1 – MVcorrsp0 < 0 (or ∆MVcorrsp0-1 < 0)]
This schedule allowed comparing gas exchange responses among groups every day, in the same (supine) position, after taking into account the effect of the overnight PP session in the PP groups
For VTe, RR, MV, MP measures, time weighted–average of hourly values during each session are presented
For MV, we verified consistency between time-average MV values and values obtained at the time of ABG (which were used to calculate Dead Space Indices): the comparison confirmed a good agreement between the two values, with p-value > 0.6 for comparison at all timepoints (not shown)
Ventral LUS (lung ultrasound) score: the score is the sum of individual scores for region L1, L2, R1, R2 (ranging 0–12)
Lateral LUS score: the score is the sum of individual scores for region L3, L4, R3, R4
Dorsal LUS score: the score is the sum of individual scores for region L5, L6, R5, R6
Global LUS score: the score is the sum of ventral, lateral and dorsal region scores (the sum of the 12 regions’ score, ranging 0–36)
LUS reaeration score, global: the sum of ventral, lateral and dorsal reaeration scores, calculated according to the method proposed and validated by Bouhemad et al
WAL(%): well-aerated lung volume as % total lung volume, resulting from the sum f regional WAL volumes assessed by LUS and validated against CT scan (see online supplement)
Outcomes
Primary outcomes were the occurrence of.
NIV failure within 28 days of enrolment, defined as intubation OR death;
death, censored at 28 days after enrollment.
Secondary outcomes were:
endotracheal intubation (ETI) at 28 days (after excluding patients with a do-not-intubate, DNI, order);
60-day death
O2-response: paO2/FiO2sp1–paO2/FiO2sp0 (or ∆paO2/FiO2sp0-1).
CO2-response: ∆VRsp0-1;
C-reactive protein (CRP) response: ∆CRP0-1;
global LUS response at day 1: ∆global LUS0-1;
global reaeration score at day 1: global reaeration score1;
change in LUS- assessed WAL (%) at day 1 (∆WAL0-1)
Statistical analyses
Sample size calculation and propensity score (PS)-matching of PP and supine group.
Sample size calculation and PS-matching of PP and supine groups for relevant baseline covariates are detailed in supplementary text.
Descriptive statistics
Data are given as median (IQR) or n (%) as appropriate.
We used chi-square test or Fisher´s exact test for categorical variables, T-Test for normally distributed and Kruskal–Wallis test for non-normal continuous variables.
Time change in continuous variables was assessed by computing the AUC with the trapezoid method [36].
Repeated measures two-factor (within subject and between group) ANOVA was used to compare continuous variables assessed at multiple timepoints (i.e., respiratory and biochemical parameters), after log-transformation of non-normal variables.
To explore the effect of early MPWAL delivery on clinical outcomes, the whole cohort was split into 2 groups according to median MPWAL values at day 1. The probability of 28-day NIV failure, death and ETI in low vs high MPWAL group at day 1 was compared using Kaplan–Meier procedure and log-rank test. Data were analyzed on an intention-to-treat basis.
Beside categorizing patients into low/high MPWAL, we explored dose–response relationship between early power delivery and clinical outcomes by dividing the entire cohort into quartiles of power measures at day 1. Comparison between quartiles was made by ANOVA with post-hoc comparison from the first quartile performed using the Tukey test. We planned to assess also reciprocal relationship between MP, MPPBW and MPWAL at day 1 by univariate analysis and Spearman correlation coefficient (rs).
Multivariable Cox proportional regression analysis adjusting for imbalanced covariates between groups was used to assess the effect of confounders on 28-d NIV failure, death and ETI in the whole cohort, with the maximum number of covariates allowed in each model set at (event rate x N)/10, where N is the sample size [37]. The allocation assignment (PP or supine) was entered as a predefined covariate into the models. Calendar month of admission was forced into all models to account for unmeasured temporal disease trends during the pandemic.
Anticipating high collinearity between ventilatory variables, in all (Cox and linear) multivariable models we used a combination of backward procedure and exclusion of highly collinear variables through model-dependent Variance Inflation Factor(VIF) cut-off values to select covariates [38].
MP, MPPBW and MPWAL at day 1 were included into all backward multivariate models to assess relative robustness of the association of each power measure (MP, MPPBW, MPWAL) with outcomes.
We also explored the predictive performance of each power measure and of other ventilatory variables at day 1 for 28-day NIV failure and death and the optimal cut-offs using the area under receiver operating characteristic curve (AUROC) analysis and Youden index.
Comparison between AUROC curves was made by DeLong’s method.
In the physio-anatomical analysis, we explored dose–response relationship between the power delivered at day 1 by the ventilator to the respiratory system and gas exchange, ultrasonographic and circulating biomarker changes after the 1st 24 h of NIV by univariable and multivariable regression analysis, after log transformation of skewed parameters; the best fit among four predictive models (linear, exponential, logarithmic, binomial) was searched using R2 values.
Two-tailed p values < 0.05 were considered statistically significant (MedCalc 19.7, Ostend, Belgium).
Results
Characteristics at Inclusion
We analyzed 216 COVID-19 patients (108 treated with PP and 108 with supine NIV) (Table 1, Supplementary Fig. 2). Pre-post-matching SMDs, PS density and logit(PS) distribution plots revealed good balance between PP and supine groups in selected covariates (Supplementary Fig. 3, Supplementary Table 2).
Baseline demographics, pharmacological therapies, clinical-radiological features, and respiratory parameters of patients treated with PP or supine NIV, subgrouped according to median MPWAL at day 1, were similar across groups; NRS (dyspnea), WOB score [39] and RR showed no evidence for increased respiratory drive, while lung CT scans showed largely predominant ground-glass opacities (Table 1).
LUS lung aeration assessment
The median (IQR) global LUS severity score was 25 (21, 30), closely correlating with global CT severity score (rs = 0.83; p < 0.001: Supplementary Fig. 4).
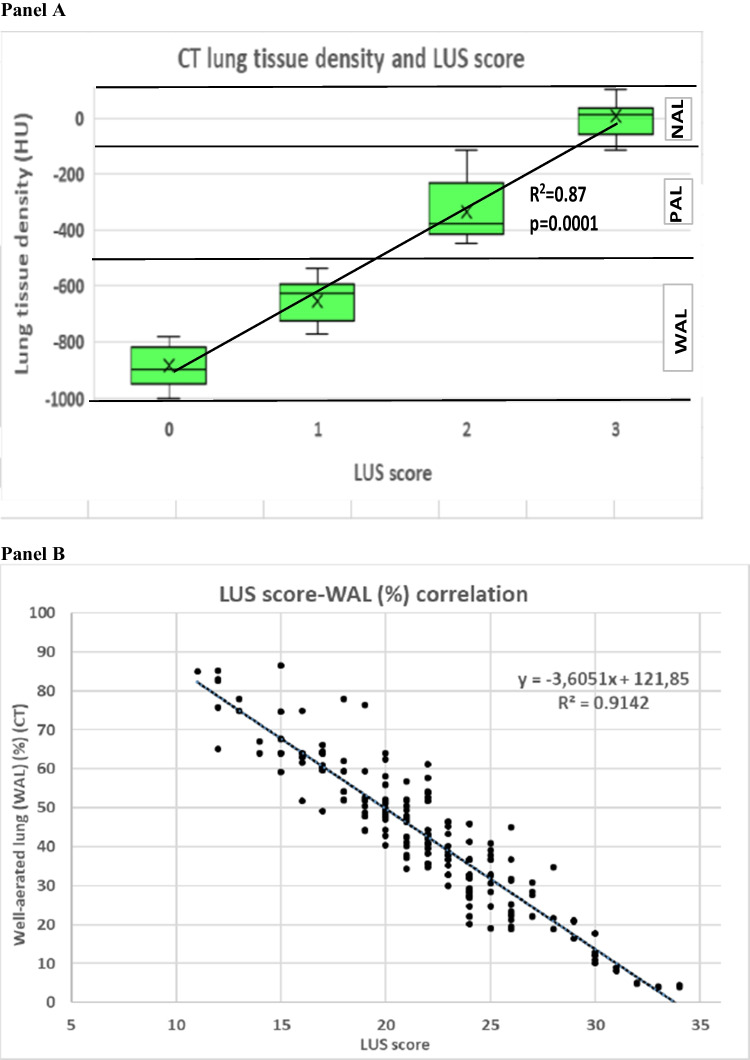
Regional LUS categorization closely correlated with CT-assessed gas/tissue density, with each step increase of LUS score being associated with a significant increase in lung tissue density (Fig. 1 panel A): CT-LUS agreement was almost complete for WAL (k = 0.91; 95%CI: 0.85–0.97), substantial for PAL(k = 0.61; 95%CI: 0.57–0.66) and moderate (k = 0.55; 95%CI: 0.51–0.60) for NAL (Supplementary Table 3A–B), consistent with previous reports in ARDS [34].
Fig. 1.
Panel A: categorization of individual lung regions with different CT-assessed gas/tissue density in relation to their LUS score. Panel B: correlation between WAL(%) assessed by software-based analysis of CT scans and WAL(%) as estimated by global lung ultrasound (LUS) score in the 216 COVID-19 pneumonia patients included in the study. The Spearman correlation coefficient (rs) with its 95%CI and statistical significance are shown. Abbreviations: CT: computed tomography; HU: Hounsfield Units; LUS: lung ultrasound; NAL: non-aerated lung volume; PAL: poorly aerated lung volume; WAL: well-aerated lung volume
Based on these findings, an equation was developed to predict WAL(%) from global LUS score (Fig. 1 panel B).
Treatment-related parameters and outcomes
No patient was lost to follow-up and there were no missing data for evaluated end-points.
Patients initiated NIV and PP within 24 h of admission to the Subintensive Care Unit. Over the initial 48 h of treatment, NIV was delivered continuously or until intubation and only brief interruptions were allowed for eventual adjustments and nursing care, lasting no more than few minutes; subsequently, daily breaks, lasting no more than 2 h, were allowed for meals and nursing care, depending on patient clinical condition and tolerance.
In PP and supine groups, ventilatory settings were similar among groups at baseline and remained unchanged from timepoints sp0 to sp1 (Table 1).
Daily hours of NIV and PP, the duration of the longest PP session, daily PP sessions and days of PP therapy are reported in Table 1.
Compared with supine group, PP therapy was associated with improved gas exchange and ultrasonographic parameters and clinical outcomes (Supplementary Fig. 5–6, Supplementary Table 4).
Effect of PP therapy on MPWAL
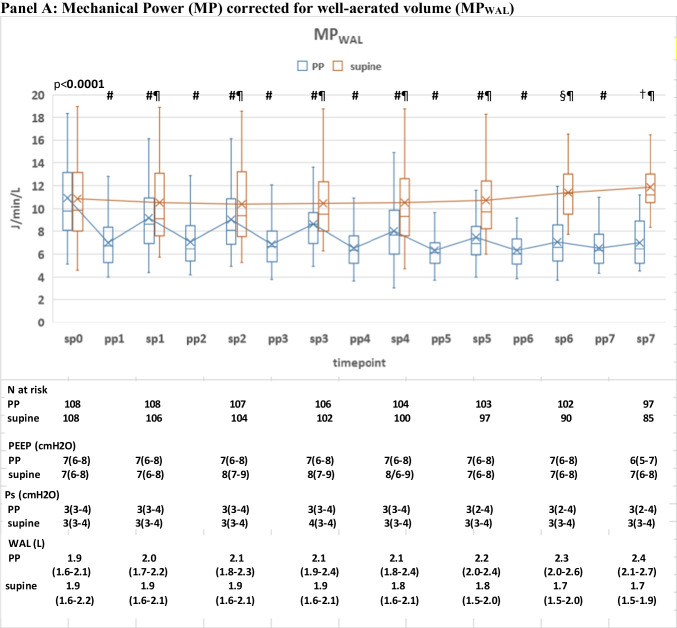
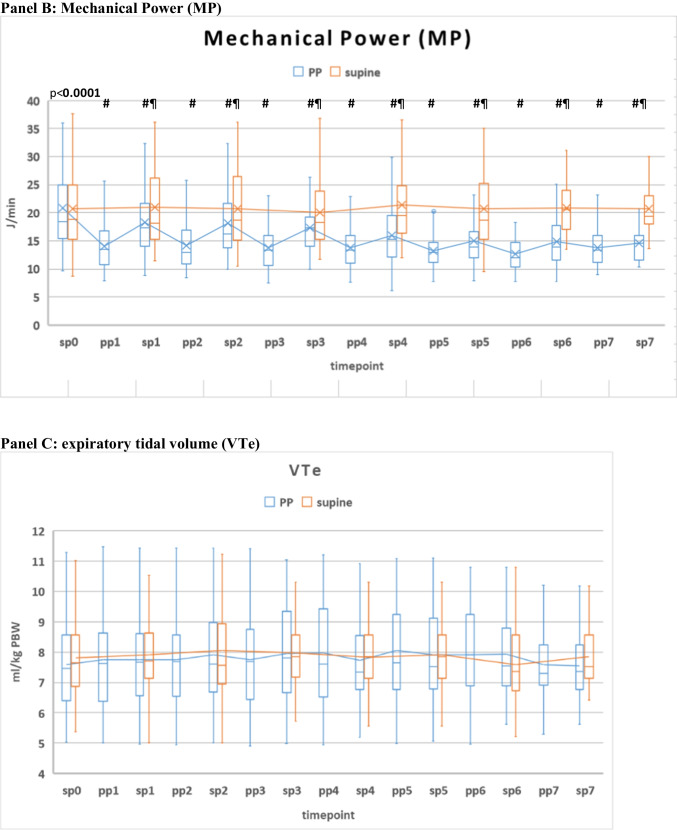
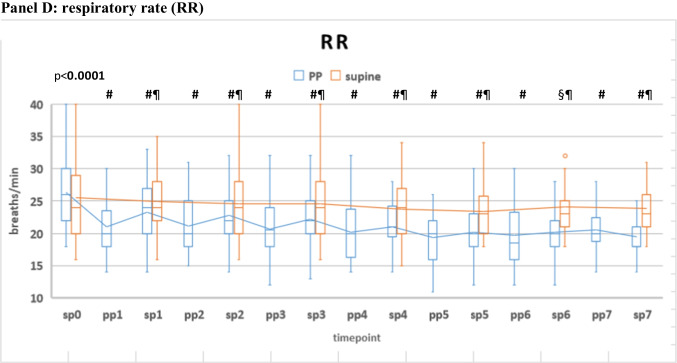
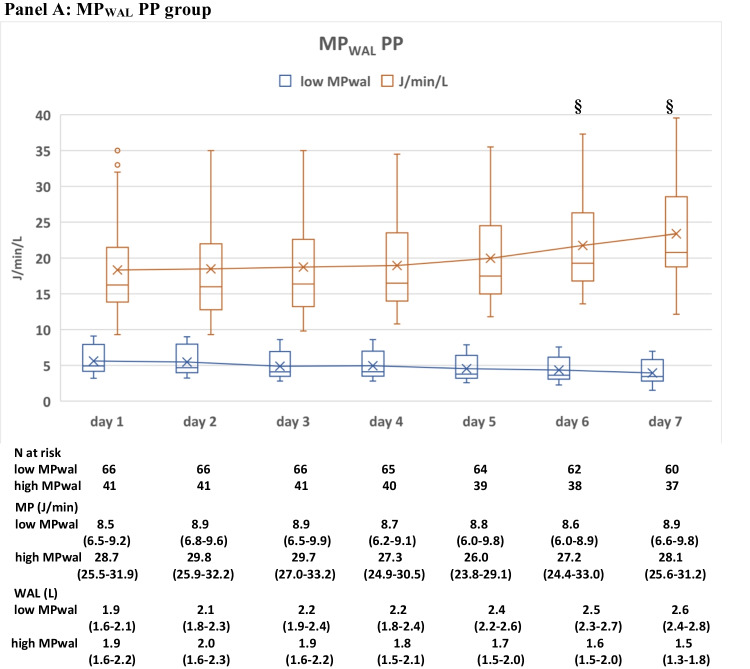
PP therapy was associated with a significant MPWAL reduction: MPWAL decreased by a median 34% (IQR: 30–38%) during the first PP session (timepoint pp1) as compared with pre-proning values (timepoint sp0) (Fig. 2 panel A–D). MPWAL reduction during 1st PP session was driven mainly by a RR decrease and secondly by a modest (5%; 2–7%) WAL increase (Fig. 2A–D). The magnitude of WAL % increase during 1st PP session was consistent with recent reports [40-42].
Fig. 2.
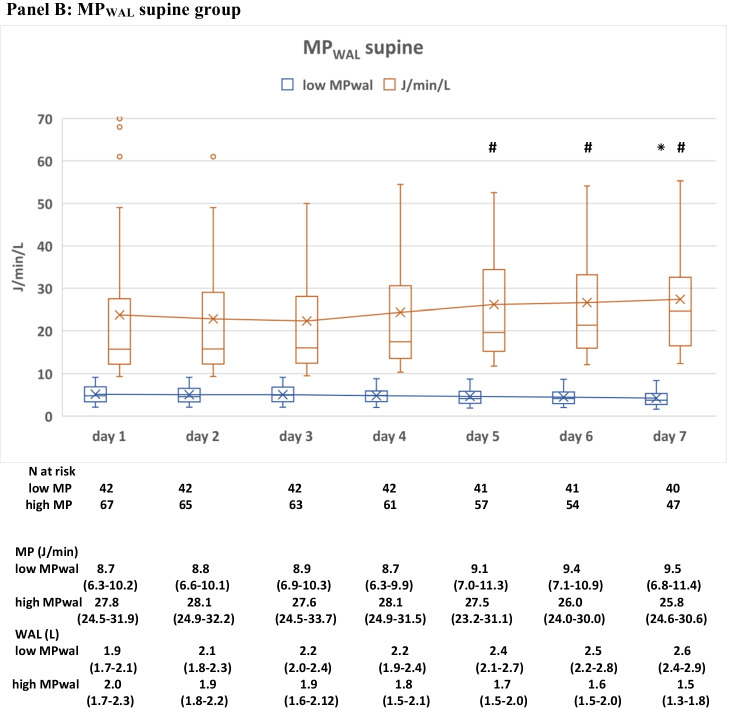
Panel A–D: time course of MPWAL, MP and their components during the initial 7 days of NIV in the PP (n = 108) and supine (n = 108) group. N at risk and median (IQR) values of PEEP, Pressure support (Ps) and well-aerated lung volume (WAL) are shown at the bottom of panel A. # P < 0.01 vs. baseline (same group); § P < 0.01 vs. baseline (both groups) † P < 0.001 vs. baseline (both groups) ǁ P < 0.01 between PP and supine groups ¶ P < 0.001 between PP and supine groups. In the box plots the middle line represents the median observed value, boxes represent the interquartile range (IQR), whiskers extend to the most extreme observed values with 1.5 times the interquartile range of the nearer quartile, and dots represent observed values outside that range. The connecting line connects the mean values within each box plot at different time points. For VTe, RR, MV, MP, MPWAL time weighted–average of hourly values during each session (supine/prone) of NIV are presented. For MV, we verified consistency between time-average MV values and values obtained at the time of ABG (which were used to calculate Dead Space Indices): the comparison confirmed a good agreement between the two values, with p-value > 0.7 for comparison at all timepoints (not shown). The timepoints are indicated as follows: sp0: supine position timepoint 0 (baseline, after NIV initiation).In PP group, the session preceded the first PP session. ABGs were performed ≥ 1 h after supine NIV initiation, after achieving ventilatory stability; pp1: first PP session in PP group. ABGs were performed ≥ 1 h after prone NIV initiation, after achieving ventilatory stability; sp1: supine position timepoint 1 (after the initial 24 h of NIV); in the PP group this corresponded to the resupination after the 1st PP session) on day 1. pp2: during the 2nd PP session; sp2: supine position timepoint 2 (after the 2nd day of NIV, in the PP group this also corresponded to the resupination after the 2nd PP session on day 2; pp3 during the 3rd PP session; sp3 supine position timepoint 3 (after the 3rd day of NIV, in the PP group this also corresponded to the resupination after the 3rd PP session on day 3. pp4 during the 4th PP sessionx; sp4 supine position timepoint 4 (after the 4th day of NIV, in the PP group this also corresponded to the resupination after the 4th PP session on day 4. pp5 during the 5th PP session; sp5 supine position timepoint 5 (after the 5th day of NIV, in the PP group this also corresponded the 5th PP session on day 5. pp6 during the 6th PP session; sp6 supine position timepoint 6 (after the 6th day of NIV, in the PP group this also corresponded to the resupination after the 6th PP session on day 6. pp7 during the 7th PP session; sp7 supine position timepoint 7 (after the 7th day of NIV, in the PP group this also corresponded to the resupination after the 7th PP session on day 7. This schedule allowed comparing gas exchange responses among group at day 1, after 24 h of NIV, in the same (supine) position, after taking into account the effect of the first overnight PP session (timepoint pp1) in the PP groups
Daily MPWAL swings between prone and supine position subsided after day 5(timepoint pp5)(P supine vs. prone > 0.05), suggesting no additional effect on MPWAL from further PP days (Fig. 2A).
Relationship of early (day 1) power measures with clinical outcomes
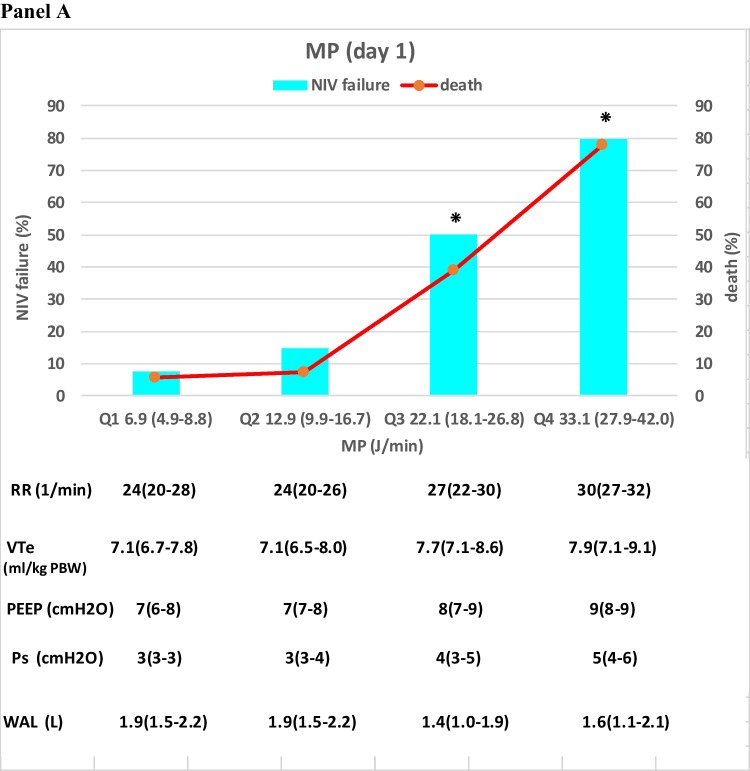
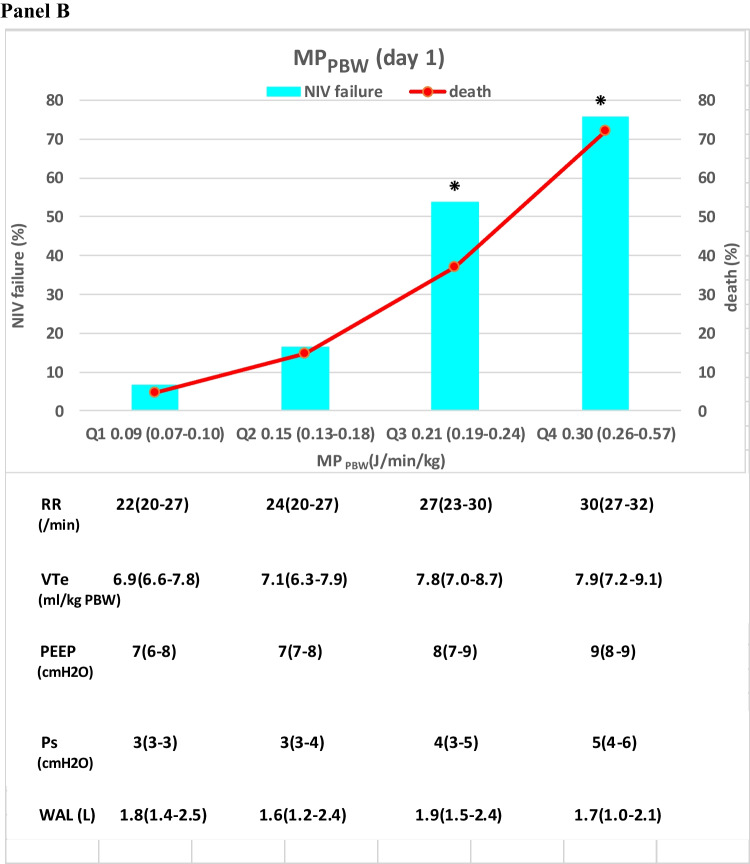
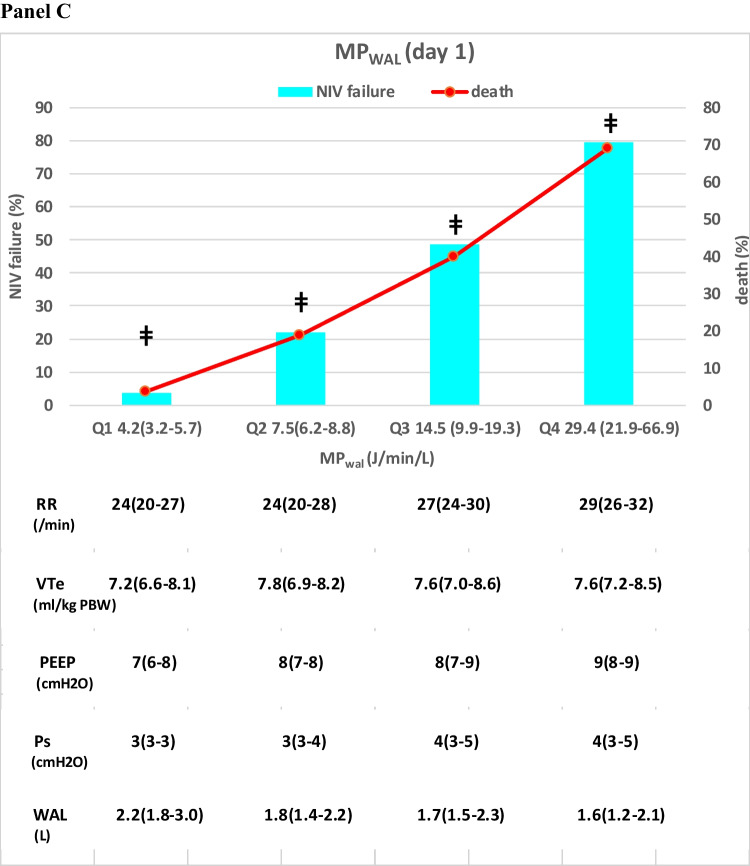
We first assessed the relationship between different power measures at day 1 and clinical outcomes (NIV failure, death) (Fig. 3A–C): we observed a progressive, linear, statistically significant increase in NIV failure and death rates across each MPWAL quartile, but not across MP and MPPBW quartiles, which rather showed a steep increase in the rate of clinical outcomes in the 3-4th quartile as compared with the lower 2 quartiles.
Fig. 3.
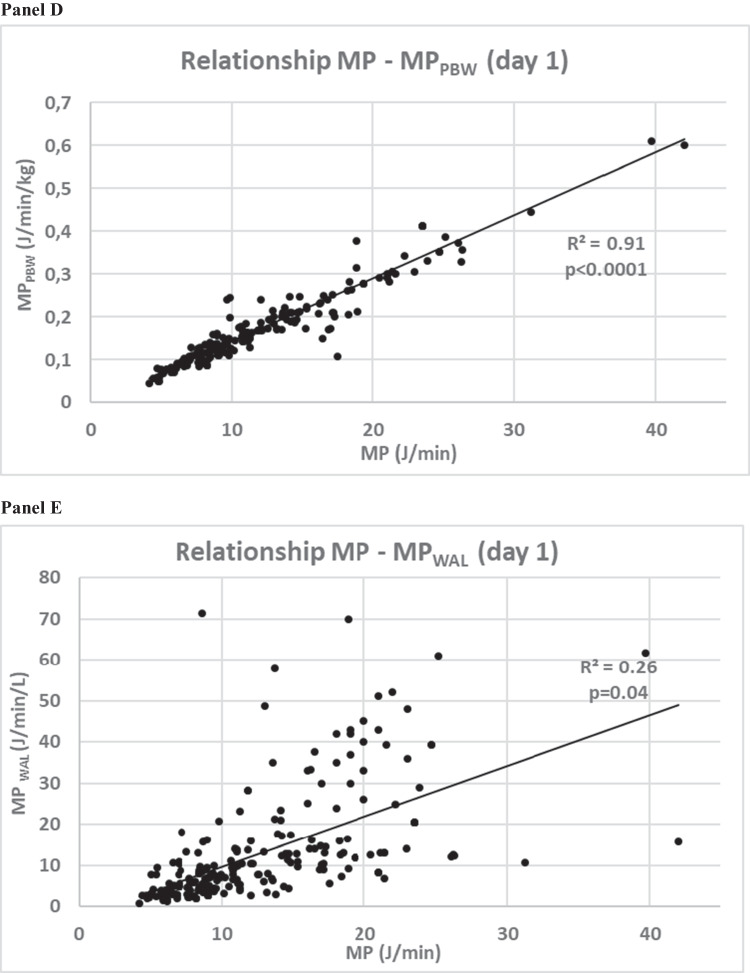
Panel A–B: relationship between MP, MPPBW and MPWAL during day 1 of NIV in the whole study population (n = 216). Panel C–D: quartiles of MP (Panel A), MPPBW (Panel B) and MPWAL (Panel C) and 28-d NIV failure and death(%) in the whole study population (n = 216). Median (range) of MP, of components of MP and of well aerated lung (WAL) volumes are displayed at the bottom of each graph. ⁕p < 0.05 vs. other quartiles for NIV failure and death; ǂp < 0.001 vs other quartiles for NIV failure and death
The investigation of mutual relationship between MP, MPPBW and MPWAL at day 1 disclosed a the weak correlation between MPWAL and the other power measures, indicating for any given value of MP delivered by NIV to the respiratory system, the energy per unit volume of WAL varied widely (Fig. 3D–E).
Early (day 1) MPWAL is independently associated with clinical outcomes
We then categorized the whole study population based on median MPWAL delivered during the initial 24 h of NIV (day 1) into high MPWAL (i.e. MPWAL ≥ 9.1 J/min/L) or low MPWAL (i.e., MPWAL < 9.1 J/min/L): patients receiving a low MPWAL(day 1) showed lower 28-d NIV failure, intubation and death rates than those receiving a high MPWAL(day 1) (Table 1, Fig. 4).
Fig. 4.
Cumulative incidence of Noninvasive Ventilation (NIV) failure (Panel A), death (Panel B) and endotracheal intubation (Panel C) at 28 days after enrollment in patients grouped according to high (≥ 9.1 J/min/L) vs low (< 9.1 J/min/L) MPWAL at day 1. In the endotracheal intubation group, patients with a Do-Not-Intubate (DNI) disposition were excluded
In Cox proportional multivariable models, MPWAL (day 1) predicted 28-d NIV failure (HR 1.682; 95%CI: 1.147–2.412, p = 0.003), intubation (HR 1.521; 95%CI: 1.193–2.314, p = 0.009) and death (HR 1.697; 95%CI: 1.217–2.313, p = 0.002) independently of baseline illness and lung disease severity and of other ventilatory variables (Table 2).
Table 2.
Cox multivariable analysis of predictors of 28-d NV failure, death and endotracheal intubation (ETI) (n = 216)
| 28-d NIV failure | |||
| SAPS II | 1.027 | 0.983 to 1.272 | 0.293 |
| PP therapy (1 = yes, 0 = No) | 0.581 | 0.392 to 0.772 | 0.009 |
| Baseline pO2/FiO2* | 0.982 | 0.734 to 1.696 | 0.128 |
| Baseline WAL (L) | 1.044 | 0.891 to 1.986 | 0.319 |
| RR (day 1) | 1.186 | 0.892 to 1.539 | 0.146 |
| VTe(day 1) (ml/kgPBW) | 1.017 | 0.749 to 2.013 | 0.318 |
| PEEP(day 1)(mmHg) | 1.179 | 0.874 to 1.528 | 0.412 |
| MPWAL (day 1)(J/min/L) | 1.682 | 1.147 to 2.412 | 0.005 |
| 28-d death | |||
| Parameter | HR | 95%CI | P |
| Age | 1.088 | 1.0426 to 1.198 | 0.028 |
| ISARIC 4C score | 1.026 | 0.947 to 1.192 | 0.334 |
| PP therapy | 0.629 | 0.271 to 0.812 | 0.010 |
| Baseline paO2/FiO2* | 0.999 | 0.894 to 1.166 | 0.296 |
| Baseline WAL (L) | 1.039 | 0.792 to 1.893 | 0.427 |
| RR (day 1) | 1.116 | 0.975 to 1.428 | 0.239 |
| MPWAL (day 1) | 1.697 | 1.217 to 2.316 | 0.002 |
| 28-d endotracheal intubation | |||
| SAPS II | 1.021 | 0.872 to 1.812 | 0.513 |
| PP therapy (1 = yes, 0 = No) | 0.598 | 0.283 to 0.781 | 0.007 |
| Baseline pO2/FiO2* | 0.992 | 0.621 to 1.769 | 0.389 |
| Baseline WAL (L) | 1.028 | 0.891 to 1.986 | 0.319 |
| RR (day 1) | 1.112 | 0.783 to 1.702 | 0.192 |
| VTe(day 1) (ml/kgPBW) | 1.132 | 0.649 to 2.913 | 0.413 |
| MPWAL (day 1)(J/min/L) | 1.682 | 1.147 to 2.412 | 0.005 |
Statistically significant p-values are written in bold characters
ISARIC international severe acute respiratory infection consortium, NIV noninvasive ventilation, SAPS simplified acute physiology score, PEEP positive end-expiratory pressure, MPWAL, mechanical power normalized to well-aerated lung volume, CI confidence interval, PBW predicted body weight
*on admission, while on a FiO2 50% Venturi mask or a non-rebreather reservoir bag mask
Predictive performance of MPWAL(day 1) for clinical outcomes
Each ventilatory variable at day 1 was regressed on NIV failure and mortality in the whole study population: MPWAL(day 1) showed the highest AUROC for predicting 28-d NIV failure (AUROC 0.89; 95%CI: 0.85–0.93, p < 0.001) and death (AUROC 0.89; 95%CI: 0.85–0.94, p < 0.001), outperforming all other ventilatory parameters and WAL (p < 0.011 for both comparisons by DeLong’s test) (Table 3, Fig. 5). Additionally, MPWAL (day 1) optimal thresholds for both NIV failure and death overlapped.
Table 3.
Discrimination of ventilator parameters measured during the 1st 24 h of NIV)(day 1) in predicting 28-d NIV failure and death in the whole study population (n = 216)
| NIV failure at 28 days | Death at 28 days | |||||||
|---|---|---|---|---|---|---|---|---|
| Parameter | Cut-off | Se(%) | Sp(%) | AUROC (95%CI) |
Cut-off | Se(%) | Sp(%) | AUROC (95%CI) |
|
MPWAL (day 1) (J/min/L) |
9.2 | 88 | 86 | 0.89 (0.85–0.93) *# | 9.3 | 89 | 87 |
0.89 (0.85–0.94) *# |
|
MP (day 1) (J/min) |
16.7 | 78 | 77 |
0.80 (0.72–0.85) * |
20.9 | 80 | 73 |
0.76 (0.72–0.83) * |
|
MPPBW (day 1) (J/min/kg) |
0.147 | 76 | 77 |
0.79 (0.72–0.85) * |
0.169 | 84 | 76 |
0.79 (0.73–0.86) * |
|
VTe(day 1) (ml/kg) |
7.9 | 64 | 72 | 0.66 (0.58–0.73) | 9.6 | 65 | 78 | 0.67 (0.59–0.74) |
|
RR(day 1) (breaths/min) |
28 | 75 | 61 | 0.65 (0.58–0.72) | 31 | 69 | 60 | 0.64 (0.56–0.70) |
|
PEEP(day 1) (cmH2O) |
9 | 36 | 74 | 0.54 (0.47–0.61) | 10 | 46 | 78 | 0.63 (0.55–0.70) |
|
Ps(day 1) (cmH2O) |
4 | 65 | 50 | 0.58 (0.47–0.68) | 6 | 74 | 53 | 0.64 (0.53–0.74) |
|
WAL(day 1) (L) |
1.7 | 66 | 72 | 0.70 (0.62–0.78) | 1.0 | 81 | 45 | 0.63 (0.55–0.71) |
* p < 0.001 vs VTe, RR, PEEP, Ps, WAL at day 1 by DeLong test
# p < 0.01 vs. MP or MPPBW at day 1 by DeLong test
ISARIC international severe acute respiratory infection consortium, NIV noninvasive ventilation, SAPS simplified acute physiology score, PEEP positive end-expiratory pressure, MPWAL mechanical power normalized to well-aerated lung volume, MP mechanical power, AUROC area under receiver operating characteristic curve, CI confidence interval, PBW predicted body weight
Fig. 5.
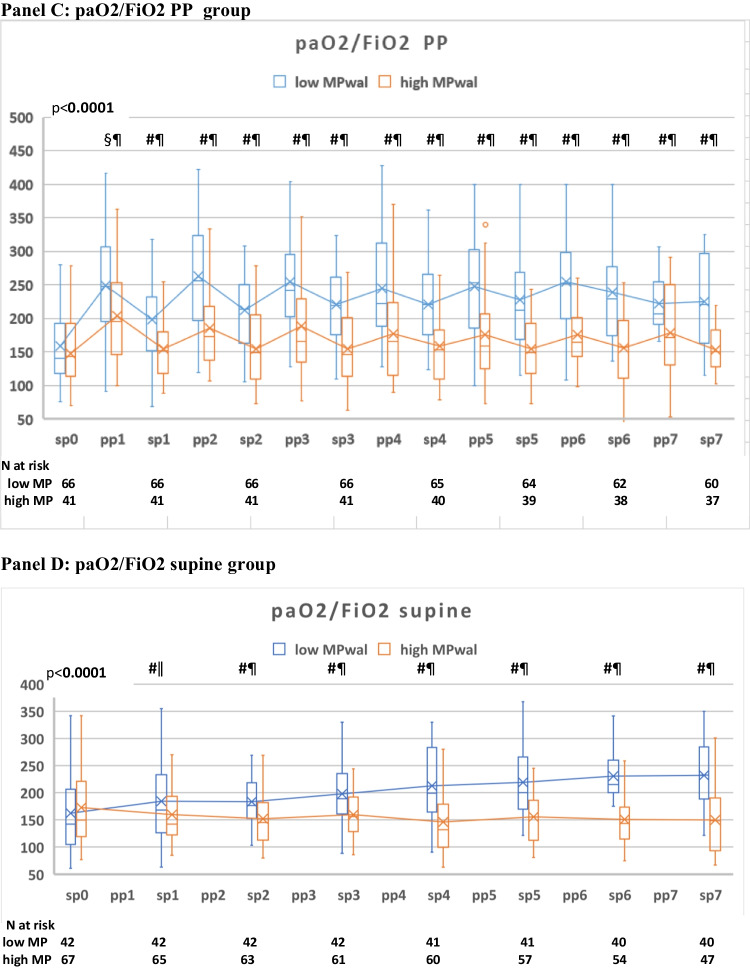
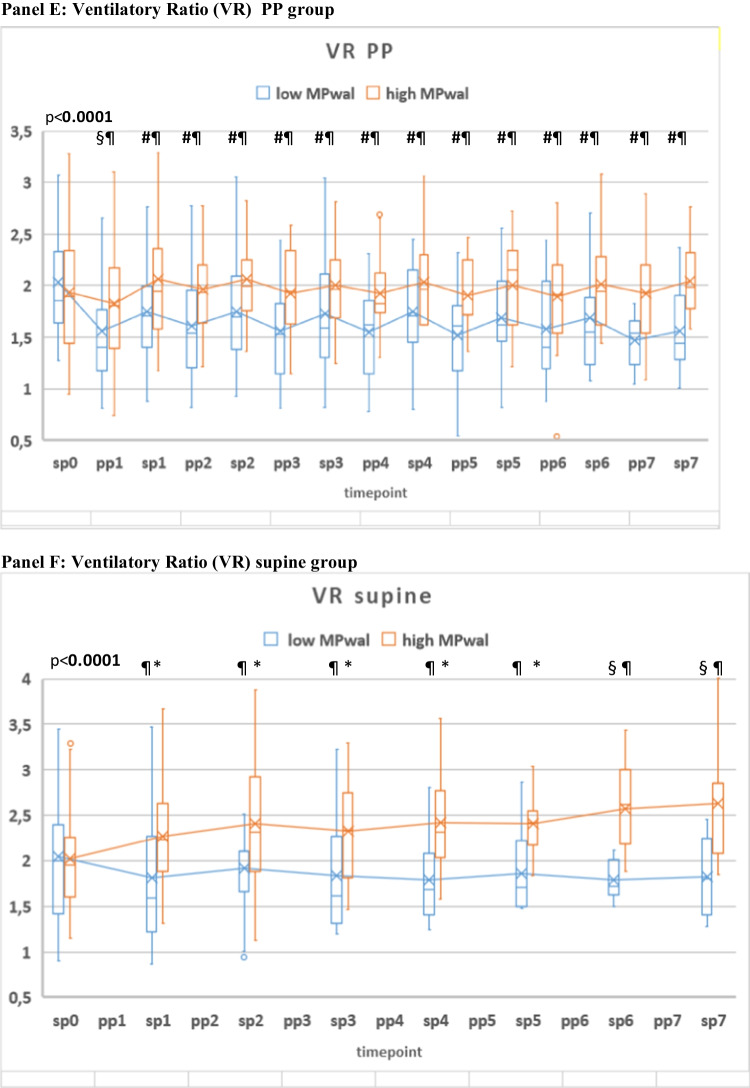
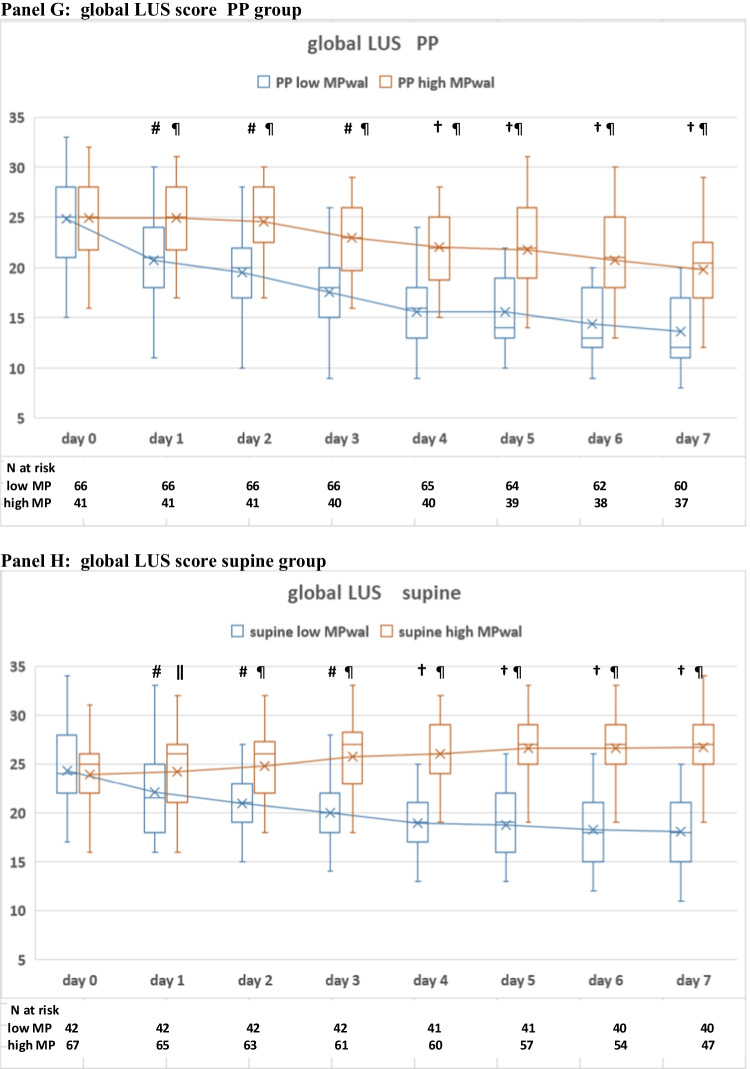
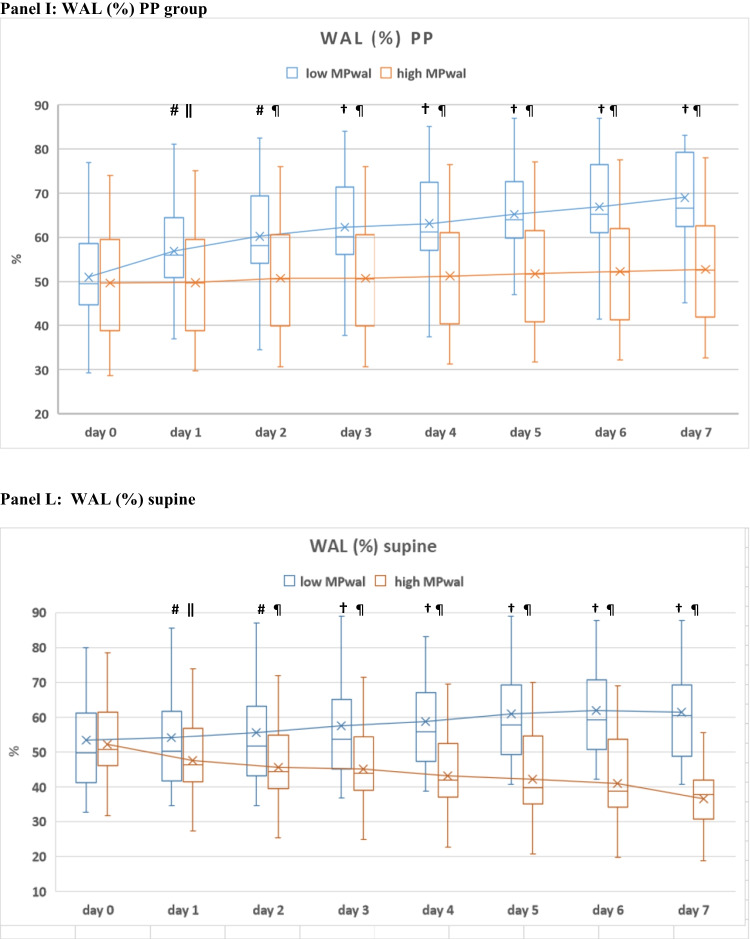
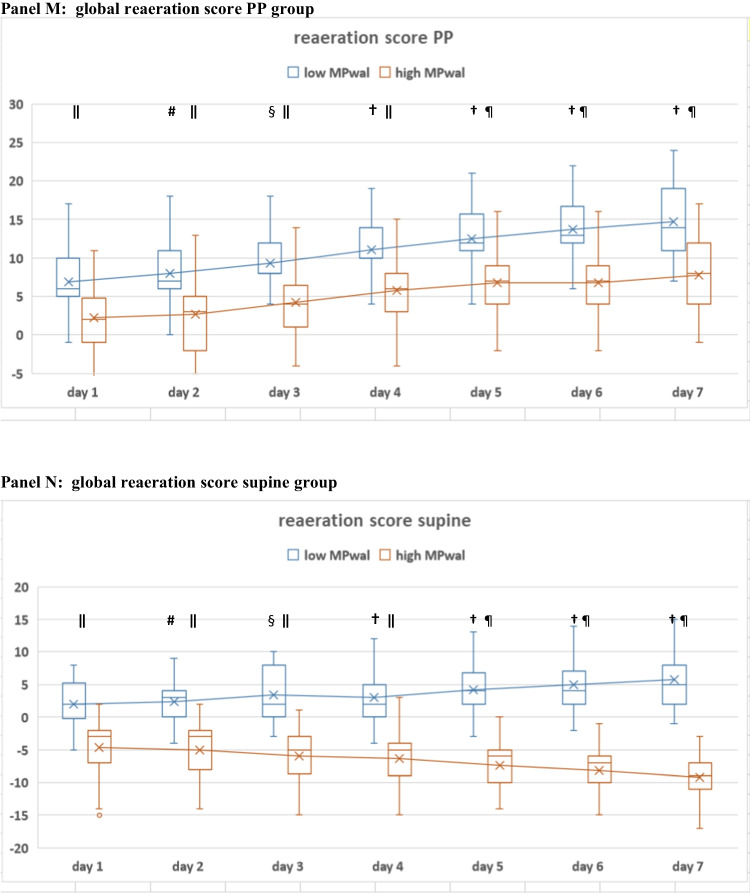
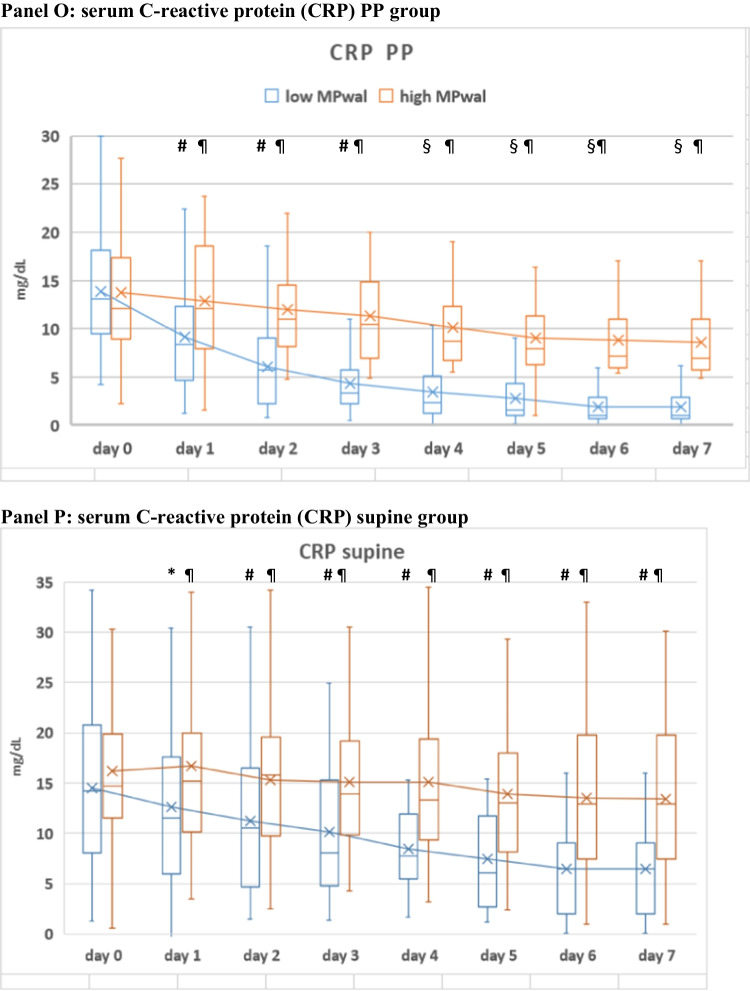
Time-course of different ventilatory (Panel A-B), gas exchange(Panel C-F), ultrasonographic (Panel G-N) and inflammatory (Panel O-P) parameters during the initial 7 days of NIV in the PP and supine groups, grouped according to low MPWAL or high MPWAL during the 1st 24 h of NIV (day 1) (n = 216). * P < 0.05 vs baseline (same group) # P < 0.01 vs. baseline (same group) § P < 0.01 vs. baseline (both groups) † P < 0.001 vs. baseline (both groups) ǁ P < 0.01 between groups ¶ P < 0.001 between groups # P < 0.001 ‡
Time course of ventilatory and other physio-anatomical variables during the initial 7 days of NIV
Over the initial 7 days there were missing data in the physiological parameters due to the occurrence of NIV failure or success and subsequent Unit discharge. Because these data were not missing at random but due to the consequence of treatment effect, we did not perform multiple imputation and excluded missing values from analyses.
Figure 6 shows time course of different ventilatory, ultrasonographic and inflammatory parameters in PP and supine patients receiving either high or low MPWAL(day 1).
Fig. 6.
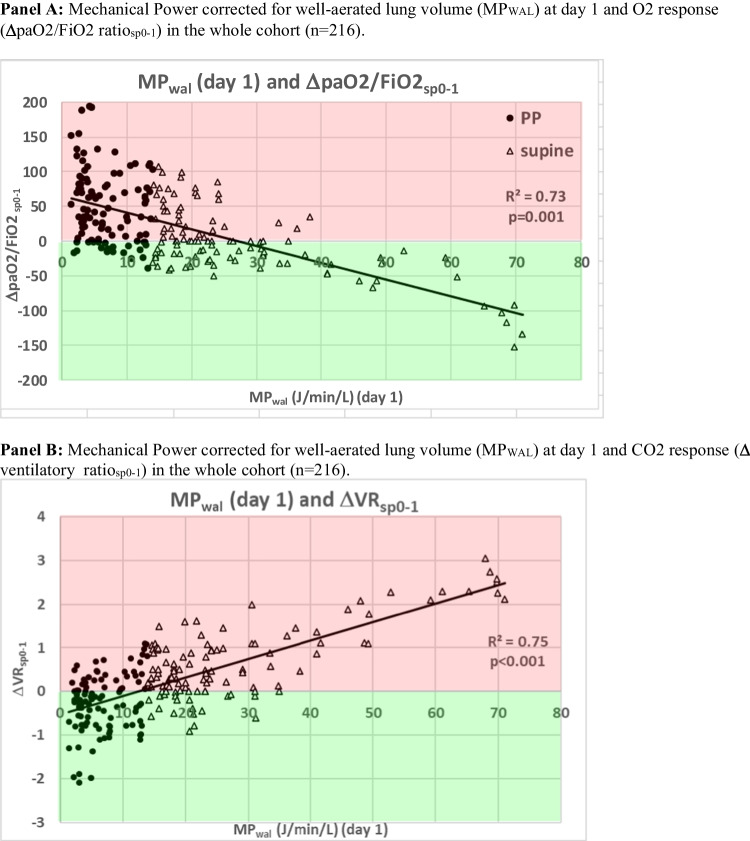
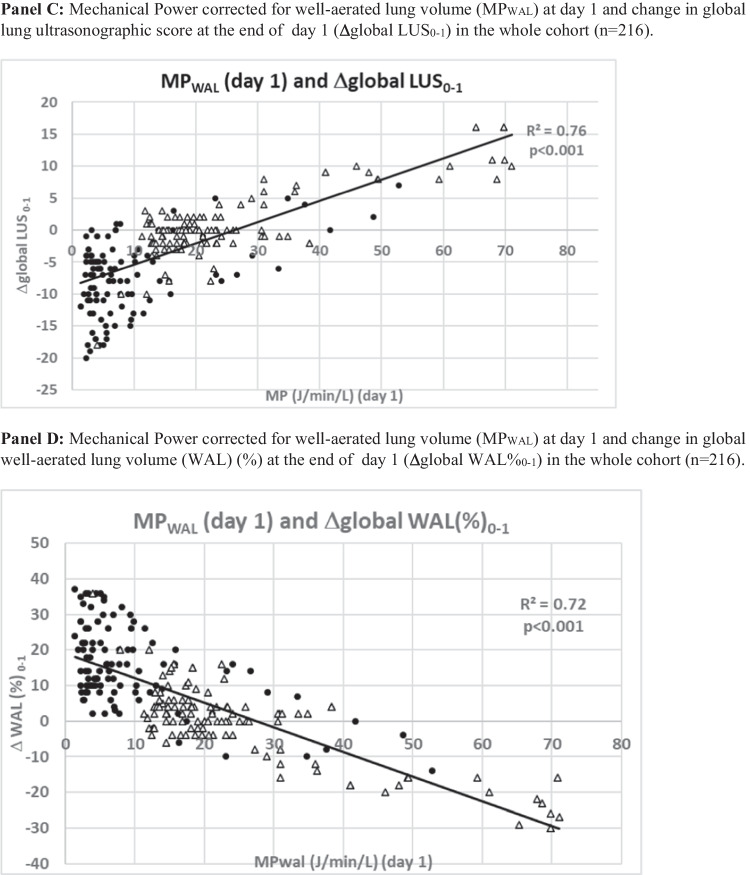
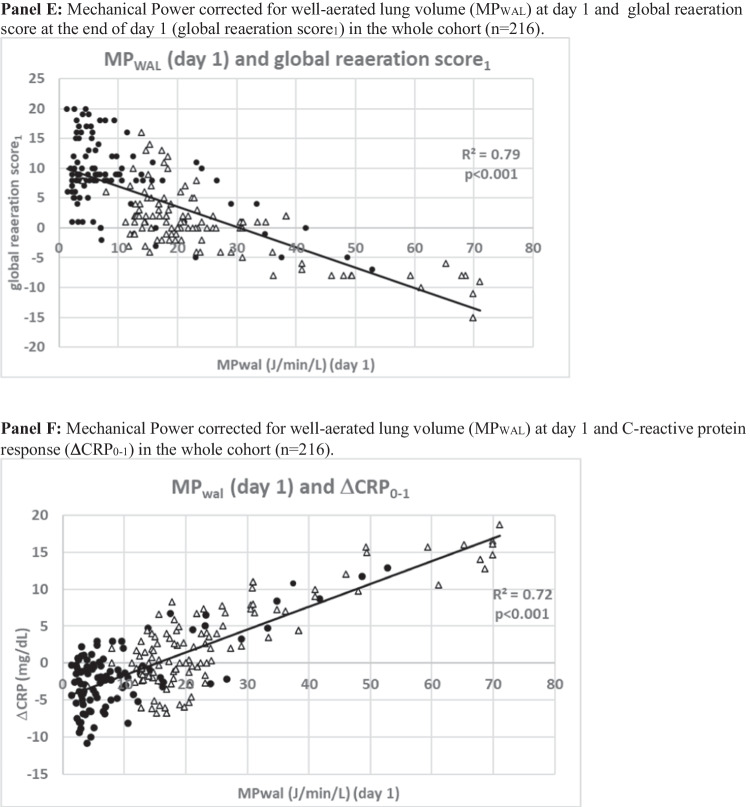
Dose–response relationship between Mechanical Power normalized to well-aerated lung volume during the 1st 24 h of NIV [MP WAL(day 1)] and physio-anatomical responses after the 1st 24 h of NIV(∆sp0-1) in the whole study population (n = 216). PP patients are represented by black full dots, supine patients are represented by empty triangles. In the plots, the green area denotes a positive gas exchange (O2 or CO2) response, the red area a negative gas exchange response. -O2 response: an increase in paO2/FiO2 ratio during NIV in supine position at day 1 (timepoint sp1) as compared with NIV supine at timepoint sp0: i.e., pO2/FiO2sp1—pO2/FiO2sp0 > 0, or ∆paO2/FiO2sp0-1 > 0. -CO2 response: an increase in CO2 clearance, defined by a reduction in dead space indices (VR and MVcorr, tested separately) at sp1 as compared with timepoint sp0 [VRsp1-VRsp0 < 0 (or ∆VRsp0-1 < 0)]
Within each treatment group (PP or supine), median daily MPWAL remained relatively constant during initial days of NIV (Fig. 6A–B); gas exchange parameters (paO2/FiO2 ratio, VR, MVcorr), ultrasonographic parameters (global LUS score, global reaeration score, WAL %) and inflammatory biomarkers (CRP, procalcitonin) improved significantly over the initial 24 h of NIV (day 1, timepoint sp0-1) only in patients receiving a low MPWAL, but not in those receiving a high MPWAL (Table 1, Fig. 6C–P). The differences between low and high MPWAL group observed at day 1 were magnified during the initial 7 days of NIV (Table 1, Fig. 6).
Impact of early (day 1) MPWAL on physio-anatomical responses
We next explored potential mechanisms underlying the association of MPWAL(day 1) with the observed clinical outcomes.
In the whole study population, early MPWAL(day 1) correlated significantly with O2 response, CO2 response ultrasonographic responses and C-reactive protein changes at resupination (timepoint sp1) in univariate analysis (Fig. 7). The observed associations were confirmed by multivariable analysis, where MPWAL(day 1) independently predicted ∆VRsp0-1(β = 0.43, p = 0.011), ∆global LUSsp0-1(β = 0.41, p = 0.018), global reaeration scoresp1(β = -0.49, p = 0.009), ∆WALsp0-1(β = 0.41, p = 0.018) and ∆C-reactive proteinsp0-1(β = 0.38, p = 0.029) (Table 4).
Fig. 7.
Dose–response relationship between Mechanical Power normalized to well-aerated lung volume during the 1st 24 h of NIV [MP WAL(day 1)] and physio-anatomical responses after the 1st 24 h of NIV(∆sp0-1) in the whole study population (n = 216). PP patients are represented by black full dots, supine patients are represented by empty triangles. Green area denotes a positive response, red area a negative one
Table 4.
Multivariable linear regression analysis of predictors of CO2-response (by ventilatory ratio, VR), ultrasonographic response and C-reactive protein responses in the whole study population(n = 216)
| O2-response (∆paO2sp0-1) | ||||||
| Parameter | β | SE | P | VIF | R2 | R2adj |
| MPWAL (day 1) | 0.46 | 0.006 | 0.009 | 1.51 | 0.66 | 0.62 |
| Duration of 1st PP session (hours) | 0.42 | 0.010 | 0.019 | 1.49 | ||
| Not included in the model | ||||||
| paO2/FiO2sp0 | –0.29 | 0.312 | 0.312 | 1.47 | ||
| PEEP (day 1) | 0.18 | 0.192 | 0.287 | 1.31 | ||
| VTe (day 1 | –0.27 | 0.216 | 0.312 | 1.21 | ||
| RR (day 1) | –0.15 | 0.189 | 0.193 | 1.77 | ||
| CO2-response (∆VRsp0-1) | ||||||
| Parameter | β | SE | P | VIF | R2 | R2adj |
| MPWAL(day 1) | 0.44 | 0.011 | 0.010 | 1.59 | 0.69 | 0.61 |
| Duration of 1st PP session (hours) | –0.41 | 0.008 | 0.028 | 1.45 | ||
| Not included in the model | ||||||
| VRsp0 | –0.31 | 0.128 | 0.398 | 1.18 | ||
| PEEP (day 1) | –0.13 | 0.139 | 0.151 | 1.01 | ||
| RR(day 1) | 0.29 | 0.146 | ||||
| Global LUS response: ∆ global LUSsp0-1 | ||||||
| Parameter | β | SE | P | VIF | R2 |
R2 adj |
| MPWAL (day 1) | 0.41 | 0.009 | 0.018 | 0.06 | 0.68 | 0.63 |
| global LUSsp0 | -0.37 | 0002 | 0.009 | 1.89 | ||
| Not included in the model | ||||||
| RR (day 1) | -0.19 | 0.318 | 0.573 | 1.47 | ||
| PEEP (day 1) | -0.13 | 0.128 | 0.398 | 0.47 | ||
| Global reaeration scoresp1 | ||||||
| Parameter | β | SE | P | VIF | R2 |
R2 adj |
| Duration of 1st PP session (hours) | 0.51 | 0.004 | 0.012 | 1.72 | 0.63 | 0.60 |
| MPWAL (day 1) | –0.49 | 0006 | 0.009 | 1.59 | ||
| Not included in the model | ||||||
| global LUSsp0 | 0.29 | 0.612 | 0.138 | 1.29 | 0.65 | 0.64 |
| PEEP (day 0) | 0.16 | 0.316 | 0.479 | 1.13 | ||
| Well-aerated volume response: ∆WAL(%)sp0-1 | ||||||
| Parameter | β | SE | P | VIF | R2 |
R2 adj |
| global LUSsp0 | 0.51 | 0.004 | 0.012 | 1.72 | 0.65 | 0.63 |
| MPWAL (day 1) | –0.49 | 0006 | 0.010 | 1.59 | ||
| Not included in the model | ||||||
| WAL (day 0) | 0.29 | 0.612 | 0.138 | 1.29 | ||
| PEEP (day 1) | 0.16 | 0.316 | 0.479 | 1.13 | ||
| C-reactive protein response: ∆ CRPsp0-1 | ||||||
| Parameter | β | SE | P | VIF | R2 |
R2 adj |
| CRPsp0 | –0.59 | 0.009 | 0.011 | 1.71 | 0.62 | 0.57 |
| MPWAL (day 1) | 0.38 | 0.005 | 0.029 | 1.12 | ||
| Not included in the model | ||||||
| Obesity | 0.31 | 0.269 | 0.513 | 1.19 | ||
| PEEP (day 0) | 0.28 | 0.214 | 0.395 | 1.12 | ||
Statistically significant p-values are written in bold characters
Discussion
In the first report exploring MPWAL in COVID-19 AHRF treated with prone or supine NIV, we found that.
PP was associated with a significant MPWAL reduction, attributable mainly to an absolute MP reduction and secondly to a relief in the “intensity” of the power delivered to the aerated lung through enhanced lung reaeration (Fig. 2).
MPWAL delivered during the first 24 h of NIV [MPWAL(day 1)] outperformed other power measures and ventilatory variables in clinical and pathophysiological outcome prediction.
MPWAL(day 1) independently predicted different markers of VILI, including gas exchange parameters, ultrasonographic and inflammatory biomarkers, in both supine and proning patients.
Diferent mechanical ventilatory variables have been proposed to affect clinical outcomes and to contribute to VILI, all of which have been separately addressed in experimental or clinical studies [1-3]. The MP represents the energy delivered to the respiratory system by mechanical ventilation, which results from a combination of ventilatory variables. Therefore, MP might have a higher predictive value for patient-centered outcomes, as different combinations of its components may yield a similar damage to the lung [4-8]. The ability to combine the effect of time-varying ventilatory variables seems particularly attractive in spontaneously breathing patients.
Our findings suggest MP delivered early after NIV initiation predicts both NIV failure and mortality. However, the power should be normalized to the size of for the size of well-inflated lung to get an optimal cut-off that could be used in clinical practice, as VILI originates from the interaction between the MP delivered to the respiratory system by the ventilation and the anatomical and pathophysiological characteristics of the latter. Notably, we demonstrated that bedside LUS could be used to accurately estimates WAL size, consistent with data from nonCOVID-19 ARDS [29].
Lastly, we showed that early PP may reduce MPWAL while improving oxygenation and CO2 clearance during NIV. Therefore, early PP therapy may be a more “energetically” advantageous strategy to relieve hypoxemia than PEEP uptitration, which may overdistend the lung and increase MP and lung injury when it does not recruit atelectatic lung tissue [8, 35]. The association of PEEP levels and NIV duration with COVID-19 pneumonia severity and mortality is consistent with this view [11-13].
Our analysis may have several clinical implications for noninvasive AHRF management.
First, it suggests PP can effectively reduce MP delivery. Second, they suggest early MPWAL calculation may help define the trade-offs between the benefits and risks of noninvasive ventilatory support, helping to titrate NIV to the least possible energy to achieve oxygenation and enhancing prompt NIV up-grade to invasive mechanical ventilation (IMV) to prevent VILI progression. Both these issues warrant evaluation in future ad hoc trials enrolling different AHRF etiologies.
Strengths and limitations
Strengths of our report are the thorough patient assessment, the hourly ventilatory data collection, which reflect actual power delivery during each ventilatory session more accurately than once daily data, and the separate assessment of supine and prone ventilatory modality. Limitations of our analysis include its post hoc nature and the absence of randomization in the original study. Furthermore, we focused on ventilator-delivered energy and did not assess the energy transferred from respiratory muscles to the lung during inspiration. However, consistent with COVID-19 literature. our patients had no clinical-radiological evidence for increased inspiratory effort or reduced lung compliance [14-17], and Pes swings, an index of inspiratory effort, are unrelated to disease course and unaffected by PP [43], while MPWAL predicted physio-anatomical and clinical outcomes in our patient population.
Conclusions and expert recommendations
Concern has been raised that mechanical ventilation may promote VILI and worsen outcome in spontaneously breathing patients with AHRF. Different ventilatory variables have been proposed to contribute to VILI progression, but no effective predictive, preventive and patient-centered model has been developed [44-48].
Based on our findings we suggest early quantitation of well-aeraled lung volume before NIV initiation in each patient with AHRF candidate to NIV, through CT scan analysis or at least through lung ultrasound, which in our series was at least as accurate for WAL quantitation as free open source software.
After NIV initiation, the value of MP delivered to the patient by NIV could be estimated from routine ventilatory parameters using available formulas and adjusted for individual WAL volume to estimate MPWAL: if patient’s MPWAL exceeds suggested safey threshold (9.1 J/min/L), VILI could be prevented by implementing PP, which reduced MPWAL by an average of 34% in our series.
If PP fails to reduce MPWAL below safety threshold, NIV upgrade to invasive ventilation should be considered to achieve complete ventilatory control and reduce MPWAL and the risk of VILI.
The added value of this approach in noninvasively ventilated AHRF patients is to provide an accurate tool for early prediction of the risk of VILI and adverse outcomes(i.e., MPWAL at day 1), an effective mean to prevent or reduce the risk of VILI (i.e., prone position adoption). Furthermore, this approach should be personalized, i.e. the MP delivered by the ventilator to patient’s respiratory system should be adjusted for individual WAL size, which varies widely across AHRF patients and could be calculated by lung imaging techniques.
This integrated approach, which showed accuracy in our study, needs prospective validation in independent cohorts of patients with AHRF of diverse etiologies.
Electronic supplementary material
Below is the link to the electronic supplementary material.
Abbreviations
- ABG
Arterial blood gas
- AHRF
Acute hypoxemic respiratory failure
- CPAP
Continuous positive airway pressure
- DSI
Dead space index
- ETI
Endotracheal intubation
- ISARIC
International Severe Acute Respiratory Infection Consortium
- LUS
Lung ultrasound score
- MV
Minute ventilation
- MVcorr
Corrected MV
- NAL
Non-aerated lung volume
- NIV
Noninvasive ventilation
- NRS
Numeric rating scale
- PBW
Predicted body weight
- PEEP
Positive end-expiratory pressure
- PP
Prone position
- PRO-NIV
Prone position in NonInvasive Ventilation
- Ps
Pressure support
- PS
Propensity score
- PSV
Pressure support ventilation
- RR
Respiratory rate
- SAPS
Simplified acute physiology score
- MP
Mechanical power
- MPWAL
Mechanical power normalized to well-aerated lung
- PAL
Poorly aerated lung volume
- SMD
Standardized mean difference
- VILI
Ventilation-induced lung injury
- VR
Ventilatory ratio
- VTe
Expiratory tidal volume
- WAL
Well-aerated lung volume
- WOB
Work of breathing
Appendix
PPPM Innovation highlights
Working hypothesis in the framework of PPPM
Concern has been raised that mechanical ventilation may promote lung injury (so called ventilation-induced lung injury, VILI) and worsen outcome in spontaneously breathing patients with acute hypoxemic respiratory failure (AHRF).
Different ventilatory variables have been proposed to contribute to VILI progression, but data in noninvasively ventilated patients are scarce, inconsistent and inconclusive and no valuable outcome predictor currently exists.
Mechanical power (MP), a measure of the energy transfer rate from the ventilator to the respiratory system, predicted mortality in invasively ventilated ARDS patients, but its role in noninvasively ventilated AHRF is unexplored.
Innovation towards the
predictive approach,
Mechanical Power normalized to the volume of well-aerated lung (MPWAL) delivered during the initial 24 h of noninvasive ventilation (NIV) independently predicts NIV failure intubation and death and affects physio-anatomical markers of VILI (i.e., gas exchange, lung reaeration by lung ultrasound, and inflammatory biomarkers), outperforming all other ventilatory variables in outcome prediction.
-
4.
targeted prevention
We found prone position during noninvasive ventilation is an effective tool to reduce mechanical power delivered during NIV.
-
5.
personalization of medical services
Bedside MPWAL calculation during the 1st day of NIV may guide NIV delivery, help define the tradeoffs between the benefits of noninvasive support and the risks of VILI, and enhance prompt escalation to invasive mechanical ventilation to minimize lung injury progression.
How does the presented innovation go beyond
Early bedside MPWAL calculation is a useful parameter that can predict NIV outcome, suggest the need to adopt prone position to reduce MP delivery during NIV, and help decide when to stop NIV and upgrade treatment to invasive ventilation to more effectively preventi VILI progression.
Authors’ contributions
Giovanni Musso: conceived and designed the study, analyzed the results, drafted the article, gave final approval.
Claudio Taliano: acquired data, critically analyzed the results, contributed to the draft of the article, gave final approval.
Marco De Iuliis: acquired data, critically analyzed the results, contributed to the draft of the article, gave final approval.
Elena Paschetta: acquired data, critically analyzed the results, contributed to the draft of the article, gave final approval.
Caterina Fonti: acquired data, critically analyzed the results, contributed to the draft of the article, gave final approval.
Andrea Ferraris: acquired data, critically analyzed the results, contributed to the draft of the article, gave final approval.
Marta Druetta: acquired data, critically analyzed the results, contributed to the draft of the article, gave final approval.
Ines Sarah Vianou: acquired data, critically analyzed the results, contributed to the draft of the article, gave final approval.
Francesca Ranghino: acquired data, critically analyzed the results, contributed to the draft of the article, gave final approval.
Federica Riedo: acquired data, critically analyzed the results, contributed to the draft of the article, gave final approval.
Davide Deangelis: acquired data, critically analyzed the results, contributed to the draft of the article, gave final approval.
Gloria Tirabassi: acquired data, critically analyzed the results, contributed to the draft of the article, gave final approval.
Data availability
Individual, de-identified participant data will be shared upon request to the corresponding author by email till up to 2 years after publication of the article.
Declarations
Ethics approval
Ethics approval was granted by the Comitato Etico Interaziendale A.O.U. Città della Salute e della Scienza di Torino (prot. N. 0046392) on Dec 15th, 2020 as an ancillary study to the PRO-NIV study (ISRCTN23016116) and this study was performed in accordance with Helsinki declaration. All patients gave informed consent to participate.
Consent for publication
All authors gave their consent for publication.
Competing interests
no author has any present or past conflict of interest or financial and/or non-financial competing interest to disclose
Footnotes
Publisher's note
Springer Nature remains neutral with regard to jurisdictional claims in published maps and institutional affiliations.
References
- 1.Gattinoni L, Marini JJ, Collino F, Maiolo G, Rapetti F, Tonetti T, et al. The future of mechanical ventilation: lessons from the present and the past. Crit Care. 2017;21:183. doi: 10.1186/s13054-017-1750-x. [DOI] [PMC free article] [PubMed] [Google Scholar]
- 2.Frat JP, Ragot S, Coudroy R, Constantin JM, Girault C, Prat G, et al. Predictors of intubation in patients with acute hypoxemic respiratory failure treated with a noninvasive oxygenation strategy. Crit Care Med. 2018;46:208–215. doi: 10.1097/CCM.0000000000002818. [DOI] [PubMed] [Google Scholar]
- 3.Carteaux G, Millan-Guilarte T, De Prost N, Razazi K, Abid S, Thille AW, Schortgen F, et al. Failure of noninvasive ventilation for de novo acute hypoxemic respiratory failure: role of tidal volume. Crit Care Med. 2016;44:282–290. doi: 10.1097/CCM.0000000000001379. [DOI] [PubMed] [Google Scholar]
- 4.Tonelli R, Fantini R, Tabbì L, Castaniere I, Pisani L, Pellegrino MR, et al. Early inspiratory effort assessment by esophageal manometry predicts noninvasive ventilation outcome in de novo respiratory failure. A pilot study. Am J Respir Crit Care Med. 2020;202:558–567. doi: 10.1164/rccm.201912-2512OC. [DOI] [PMC free article] [PubMed] [Google Scholar]
- 5.Golubnitschaja O, Baban B, Boniolo G, Wang W, Bubnov R, Kapalla M, et al. Medicine in the early twenty-first century: paradigm and anticipation - EPMA position paper 2016. EPMA J. 2016;7:23. doi: 10.1186/s13167-016-0072-4. [DOI] [PMC free article] [PubMed] [Google Scholar]
- 6.Golubnitschaja O, Costigliola V. Predictive, preventive and personalised medicine as the medicine of the future: Anticipatory scientific innovation and advanced medical services. In: Nadin M (ed). Anticipation and medicine. Cham, Springer, Switzerland; 2017. pp. 69–85.
- 7.Tonetti T, Cressoni M, Collino F, Maiolo G, Rapetti F, Quintel M, Gattinoni L. Volutrauma, atelectrauma, and mechanical power. Critical Care Med. 2017;45:e327–e328. doi: 10.1097/CCM.0000000000002193. [DOI] [PubMed] [Google Scholar]
- 8.Xie Y, Zheng H, Mou Z, Wang Y, Li X. High Expression of CXCL10/CXCR3 in Ventilator-Induced Lung Injury Caused by High Mechanical Power. Biomed Res Int. 2022;2022:6803154. doi: 10.1155/2022/6803154. [DOI] [PMC free article] [PubMed] [Google Scholar]
- 9.Xie Y, Wang Y, Liu K, Li X. Correlation analysis between mechanical power, transforming growth factor-(1, and connective tissue growth factor levels in acute respiratory distress syndrome patients and their clinical significance in pulmonary structural remodeling. Medicine (Baltimore) 2019;98:e16531. doi: 10.1097/MD.0000000000016531. [DOI] [PMC free article] [PubMed] [Google Scholar]
- 10.Guérin C, Papazian L, Reignier J, Ayzac L, Loundou A, Forel JM, et al. Effect of driving pressure on mortality in ARDS patients during lung protective mechanical ventilation in two randomized controlled trials. Crit Care. 2016;20:384. doi: 10.1186/s13054-016-1556-2. [DOI] [PMC free article] [PubMed] [Google Scholar]
- 11.Serpa Neto A, Deliberato RO, Johnson A, Bos LD, Amorim P, Pereira SM, et al. Mechanical power of ventilation is associated with mortality in critically ill patients: an analysis of patients in two observational cohorts. Intensive Care Med. 2018;44:1914–1922. doi: 10.1007/s00134-018-5375-6. [DOI] [PubMed] [Google Scholar]
- 12.Coppola S, Caccioppola A, Froio S, Formenti P, De Giorgis V, Galanti V, et al. Effect of mechanical power on intensive care mortality in ARDS patients. Crit Care. 2020;24:246. doi: 10.1186/s13054-020-02963-x. [DOI] [PMC free article] [PubMed] [Google Scholar]
- 13.Zhu Y, Peng W, Zhen S, Jiang X. Mechanical power normalized to predicted body weight is associated with mortality in critically ill patients: a cohort study. BMC Anesthesiol. 2021;21:278. doi: 10.1186/s12871-021-01497-1. [DOI] [PMC free article] [PubMed] [Google Scholar]
- 14.Wu MA, Lopez G, Nebuloni M, Ottolina D, Montomoli J, Carsana L, et al. Lung histopathologic clusters in severe COVID-19: a link between clinical picture and tissue damage. Crit Care. 2021;25:423. doi: 10.1186/s13054-021-03846-5. [DOI] [PMC free article] [PubMed] [Google Scholar]
- 15.COVID-ICU group, for the REVA network, COVID-ICU investigators. Benefits and risks of noninvasive oxygenation strategy in COVID-19: a multicenter, prospective cohort study (COVID-ICU) in 137 hospitals. Crit Care. 2021;25:421. [DOI] [PMC free article] [PubMed]
- 16.Le Terrier C, Sigaud F, Lebbah S, et al. Early prone positioning in acute respiratory distress syndrome related to COVID-19: a propensity score analysis from the multicentric cohort COVIDICU network-the ProneCOVID study. Crit Care. 2022;26:71. doi: 10.1186/s13054-022-03949-7. [DOI] [PMC free article] [PubMed] [Google Scholar]
- 17.Tonelli R, Busani S, Tabbì L, Fantini R, Castaniere I, Biagioni E, et al. Inspiratory Effort and Lung Mechanics in Spontaneously Breathing Patients with Acute Respiratory Failure due to COVID-19: A Matched Control Study. Am J Respir Crit Care Med. 2021;204:725–728. doi: 10.1164/rccm.202104-1029LE. [DOI] [PMC free article] [PubMed] [Google Scholar]
- 18.Alhazzani W, Møller MH, Arabi YM, Loeb M, Gong MN, Fan E, et al. Surviving sepsis campaign: guidelines on the management of critically Ill adults with coronavirus disease 2019 (COVID-19) Crit Care Med. 2020;48:e440–e469. doi: 10.1097/CCM.0000000000004363. [DOI] [PMC free article] [PubMed] [Google Scholar]
- 19.Chiumello D, Chiodaroli E, Coppola S, CappioBorlino S, Granata C, Pitimada M, Wendel Garcia PD. Awake prone position reduces work of breathing in patients with COVID-19 ARDS supported by CPAP. Ann Intensive Care. 2021;11:179. doi: 10.1186/s13613-021-00967-6. [DOI] [PMC free article] [PubMed] [Google Scholar]
- 20.Coppola S, Chiumello D, Busana M, Giola E, Palermo P, Pozzi T, et al. Role of total lung stress on the progression of early COVID-19 pneumonia. Intensive Care Med. 2021;47:1130–1139. doi: 10.1007/s00134-021-06519-7. [DOI] [PMC free article] [PubMed] [Google Scholar]
- 21.Rosén J, von Oelreich E, Fors D, JonssonFagerlund M, Taxbro K, Skorup P, et al. Awake prone positioning in patients with hypoxemic respiratory failure due to COVID-19: the PROFLO multicenter randomized clinical trial. Crit Care. 2021;25:209. doi: 10.1186/s13054-021-03602-9. [DOI] [PMC free article] [PubMed] [Google Scholar]
- 22.Kaur R, Vines DL, Mirza S, Elshafei A, Jackson JA, Harnois LJ, et al. Early versus late awake prone positioning in non-intubated patients with COVID-19. Crit Care. 2021;25:340. doi: 10.1186/s13054-021-03761-9. [DOI] [PMC free article] [PubMed] [Google Scholar]
- 23.Musso G, Taliano C, Molinaro F, Fonti C, Veliaj D, Torti D, et al. Early prolonged prone position in noninvasively ventilated patients with SARS-CoV-2-related moderate-to-severe hypoxemic respiratory failure: clinical outcomes and mechanisms for treatment response in the PRO-NIV study. Crit Care. 2022;26:118. doi: 10.1186/s13054-022-03937-x. [DOI] [PMC free article] [PubMed] [Google Scholar]
- 24.Chiumello D, Gotti M, Guanziroli M, Formenti P, Umbrello M, Pasticci I, et al. Bedside calculation of mechanical power during volume- and pressure-controlled mechanical ventilation. Crit Care. 2020;24:417. doi: 10.1186/s13054-020-03116-w. [DOI] [PMC free article] [PubMed] [Google Scholar]
- 25.Pelosi P, Tonelli R, Torregiani C, Baratella E, Confalonieri M, Battaglini D, et al. Different Methods to Improve the Monitoring of Noninvasive Respiratory Support of Patients with Severe Pneumonia/ARDS Due to COVID-19: An Update. J Clin Med. 2022;11:1704. doi: 10.3390/jcm11061704. [DOI] [PMC free article] [PubMed] [Google Scholar]
- 26.Musso G, Taliano C, Paschetta E, De Iuliis M, Fonti C, Vianou IS, et al. Mechanical power delivered by noninvasive ventilation contributes to physio-anatomical and clinical responses to early vs. late proning in COVID-19 pneumonia. Critical Care Med. 2023;in press. 10.1097/CCM.0000000000005915 [DOI] [PubMed]
- 27.Coopersmith CM, Antonelli M, Bauer SR, et al. The Surviving Sepsis Campaign: Research Priorities for Coronavirus Disease 2019 in Critical Illness. Crit Care Med. 2021;49:598–622. doi: 10.1097/CCM.0000000000004895. [DOI] [PubMed] [Google Scholar]
- 28.Salaffi F, Carotti M, Tardella M, Borgheresi A, Agostini A, Minorati D, et al. The role of a chest computed tomography severity score in coronavirus disease 2019 pneumonia. Medicine (Baltimore) 2020;99:e22433. doi: 10.1097/MD.0000000000022433. [DOI] [PMC free article] [PubMed] [Google Scholar]
- 29.Colombi D, Bodini FC, Petrini M, Maffi G, Morelli N, Milanese G, et al. Well-aerated lung on admitting chest CT to predict adverse outcome in COVID-19 pneumonia. Radiology. 2020;296:E86–E96. doi: 10.1148/radiol.2020201433. [DOI] [PMC free article] [PubMed] [Google Scholar]
- 30.Arbelot C, Neto FLD, Gao Y. Lung ultrasound in emergency and critically Ill patients number of supervised exams to reach basic competence. Anesthesiology. 2020;132:899–907. doi: 10.1097/ALN.0000000000003096. [DOI] [PubMed] [Google Scholar]
- 31.Steinberg I, Pasticci I, Busana M, et al. Lung ultrasound and electrical impedance tomography during ventilator-induced lung injury. Crit Care Med. 2022;50:e630–e637. doi: 10.1097/CCM.0000000000005479. [DOI] [PubMed] [Google Scholar]
- 32.Chiumello D, Mongodi S, Algieri I, Vergani GL, Orlando A, Via G, et al. Assessment of lung aeration and recruitment by CT scan and ultrasound in acute respiratory distress syndrome patients. Crit Care Med. 2018;46:1761–1768. doi: 10.1097/CCM.0000000000003340. [DOI] [PubMed] [Google Scholar]
- 33.Rousset D, Sarton B, Riu B, Bataille B, Silva S; of the PLUS study group. Bedside ultrasound monitoring of prone position induced lung inflation. Intensive Care Med. 2021;47:626–628 [DOI] [PMC free article] [PubMed]
- 34.Soummer A, Perbet S, Brisson H, Arbelot C, Constantin JM, Lu Q, et al; Lung Ultrasound Study Group. Ultrasound assessment of lung aeration loss during a successful weaning trial predicts postextubation distress*. Crit Care Med. 2012;40:2064–72. [DOI] [PubMed]
- 35.Zhao X, Wang K, Zuo P, et al. Early decrease in blood platelet count is associated with poor prognosis in COVID-19 patients—indications for predictive, preventive, and personalized medical approach. EPMA J. 2020;11:139–145. doi: 10.1007/s13167-020-00208-z. [DOI] [PMC free article] [PubMed] [Google Scholar]
- 36.Matthews JN, Altman DG, Campbell MJ, Royston P. Analysis of serial measurements in medical research. BMJ. 1990;300:230–235. doi: 10.1136/bmj.300.6719.230. [DOI] [PMC free article] [PubMed] [Google Scholar]
- 37.Long JS Regression Models for categorical and limited dependent variables. Sage Publications. 1997, Thousand Oaks, CA, US.
- 38.Craney TA, Surles JG, Values M-D. Qual Eng. 2002;14(3):391–403. doi: 10.1081/QEN-120001878. [DOI] [Google Scholar]
- 39.Apigo M, Schechtman J, Dhliwayo N, Al Tameemi M, Gazmuri RJ. Development of a work of breathing scale and monitoring need of intubation in COVID-19 pneumonia. Crit Care. 2020;24:477. doi: 10.1186/s13054-020-03176-y. [DOI] [PMC free article] [PubMed] [Google Scholar]
- 40.Camporota L, Sanderson B, Chiumello D, Terzi N, Argaud L, Rimmelé T, et al. Prone position in COVID-19 and -COVID-19 acute respiratory distress syndrome: An international multicenter observational comparative study. Crit Care Med. 2022;1(50):633–643. doi: 10.1097/CCM.0000000000005354. [DOI] [PMC free article] [PubMed] [Google Scholar]
- 41.Fossali T, Pavlovsky B, Ottolina D, Colombo R, Basile MC, Castelli A, et al. Effects of prone position on lung recruitment and ventilation-perfusion matching in patients with COVID-19 acute respiratory distress syndrome: A combined CT scan/electrical impedance tomography study. Crit Care Med. 2022;50:723–732. doi: 10.1097/CCM.0000000000005450. [DOI] [PMC free article] [PubMed] [Google Scholar]
- 42.Cardinale M, Boussen S, Cungi PJ, Esnault P, Mathais Q, Bordes J, et al. Lung-dependent areas collapse, monitored by electrical impedance tomography, may predict the oxygenation response to prone ventilation in COVID-19 acute respiratory distress syndrome. Crit Care Med. 2022;50:1093–1102. doi: 10.1097/CCM.0000000000005487. [DOI] [PMC free article] [PubMed] [Google Scholar]
- 43.Terzi N, Bayat S, Noury N, Turbil E, Habre W, Argaud L, et al. Comparison of pleural and esophageal pressure in supine and prone positions in a porcine model of acute respiratory distress syndrome. J Appl Physiol. 2020;128:1617–1625. doi: 10.1152/japplphysiol.00251.2020. [DOI] [PMC free article] [PubMed] [Google Scholar]
- 44.Chaari L, Golubnitschaja O. Covid-19 pandemic by the “real-time” monitoring: the Tunisian case and lessons for global epidemics in the context of 3PM strategies. EPMA J. 2020;11:133–138. doi: 10.1007/s13167-020-00207-0. [DOI] [PMC free article] [PubMed] [Google Scholar]
- 45.Skladany L, Koller T, AdamcovaSelcanova S, et al. Challenging management of severe chronic disorders in acute pandemic situation: Chronic liver disease under COVID-19 pandemic as the proof-of-principle model to orchestrate the measures in 3PM context. EPMA J. 2021;12:1–14. doi: 10.1007/s13167-021-00231-8. [DOI] [PMC free article] [PubMed] [Google Scholar]
- 46.Radanliev P, De Roure D, Walton R, et al. COVID-19 what have we learned? The rise of social machines and connected devices in pandemic management following the concepts of predictive, preventive and personalized medicine. EPMA J. 2020;11:311–332. doi: 10.1007/s13167-020-00218-x. [DOI] [PMC free article] [PubMed] [Google Scholar]
- 47.Saffaran S, Das A, Laffey JG, Hardman JG, Yehya N, Bates DG. Utility of driving pressure and mechanical power to guide protective ventilator settings in two cohorts of adult and pediatric patients with acute respiratory distress syndrome: A computational investigation. Crit Care Med. 2020;48:1001–1008. doi: 10.1097/CCM.0000000000004372. [DOI] [PubMed] [Google Scholar]
- 48.Marini JJ, Gattinoni L. Time course of evolving ventilator-induced lung injury: the "shrinking baby lung". Crit Care Med. 2020;48:1203–1209. doi: 10.1097/CCM.0000000000004416. [DOI] [PMC free article] [PubMed] [Google Scholar]
Associated Data
This section collects any data citations, data availability statements, or supplementary materials included in this article.
Supplementary Materials
Data Availability Statement
Individual, de-identified participant data will be shared upon request to the corresponding author by email till up to 2 years after publication of the article.


