

Abstract
Objective:
To develop a deep-learning-based multi-task (DMT) model for joint tumor enlargement prediction (TEP) and automatic tumor segmentation (TS) for vestibular schwannoma (VS) patients using their initial diagnostic contrast-enhanced T1-weighted (ceT1) magnetic resonance images (MRIs).
Methods:
Initial ceT1 MRIs for VS patients meeting the inclusion/exclusion criteria of this study were retrospectively collected. VSs on the initial MRIs and their first follow-up scans were manually contoured. Tumor volume and enlargement ratio were measured based on expert contours. A DMT model was constructed for jointly TS and TEP. The manually segmented VS volume on the initial scan and the tumor enlargement label (≥20% volumetric growth) were used as the ground truth for training and evaluating the TS and TEP modules, respectively.
Results:
We performed 5-fold cross-validation with the eligible patients (n = 103). Median segmentation dice coefficient, prediction sensitivity, specificity, accuracy, and area under the receiver operating characteristic curve (AUC) were measured and achieved the following values: 84.20%, 0.68, 0.78, 0.72, and 0.77, respectively. The segmentation result is significantly better than the separate TS network (dice coefficient of 83.13%, p = 0.03) and marginally lower than the state-of-the-art segmentation model nnU-Net (dice coefficient of 86.45%, p = 0.16). The TEP performance is significantly better than the single-task prediction model (AUC = 0.60, p = 0.01) and marginally better than a radiomics-based prediction model (AUC = 0.70, p = 0.17).
Conclusion:
The proposed DMT model is of higher learning efficiency and achieves promising performance on TEP and TS. The proposed technology has the potential to improve VS patient management.
Keywords: deep learning, image segmentation, multi-task learning, tumor enlargement prediction, vestibular schwannoma
INTRODUCTION
Management of newly diagnosed, small, sporadic vestibular schwannoma (VS) generally follows the “wait-and-scan” approach, in which the knowledge of tumor growth behavior is unknown. Because not all tumors grow after diagnosis, imaging surveillance provides additional information, assisting in determining appropriate follow-up intervals and if therapeutic intervention should be involved.1–3 In current clinical practice, VS enlargement is determined by measuring the greatest tumor linear dimension on serial magnetic resonance (MR) imaging with a fixed interval.2,3 However, this linear measurement strategy is not the most sensitive method for characterizing VS growth, and the relatively uniform time intervals for imaging surveillance may lead to delayed treatment for fast-growing tumors or over-imaging for slow-or non-growing tumors.1,4,5
Volumetric measurement of VS has demonstrated higher accuracy (ACC) and sensitivity (SEN) for tumor enlargement detection than the linear measurement in several studies.6–8 And attempts have been made to alleviate the labor-intensive process of volumetric tumor delineation using semi-automatic or automatic tumor segmentation (TS) methods based on deep learning.9–13 These approaches showed promising performance in both VS segmentation ACC on separate MR scans from different patients and measurement stability across longitudinal scans for the same patient, which are helpful for efficient VS enlargement detection.
Different from tumor enlargement detection which is based on tumor size measurement on follow-up images, tumor enlargement prediction (TEP) methods predict the probability of significant tumor volume growth in the early stage of VS diagnosis. Recent works have shown that VS MRI radiomic feature analysis with machine learning methods is predictive for TEP, which has the potential to be used as a basis for individualized treatment planning.14–16 However, these studies focus on TEP for post-radiosurgery VS only, and 3D delineation of VS is needed as a prerequisite for radiomic feature extraction. Recently, the advent of multi-task learning methods in the area of artificial intelligence (AI) provides efficient ways to jointly image segment and labeling/prediction.17 Integration of two or multiple tasks (e.g., TS and response prediction) into one network has been reported to have better prediction performance and adequate segmentation ACC in several medical-related tasks.17–19 In these approaches, a multi-task model learns from multiple training tasks simultaneously. It leverages the parameters of the shared model structures for different tasks, which help the model to exploit the inherent correlation between tasks and reduce the overfitting problem of deep learning.
In the present study, we sought to build a deep multi-task (DMT) model to automatically segment VS and identify VS patients at risk of fast tumor growth, based on MR images acquired at the initial diagnosis. We hypothesize that the DMT model can outperform the single-task tumor growth prediction model and TS model. To the best of our knowledge, this study is the first to develop a multi-task deep learning framework for VS to aid in personalized patient management.
MATERIALS AND METHODS
Data Collection and Pre-processing
This study was approved by our Institutional Review Board (STU 112016–004), and all methods were performed in accordance with the relevant guidelines and regulations. We retrospectively collected a random assortment of VS patients MRI data from our internal database, and a 1:1 fashion was taken for selecting patient with and without significant tumor growth (2 mm increase in tumor size as the threshold) according to the clinical reports. These imaging data include the first gadolinium-enhanced T1-weighted MR scans acquired with 1.5 T or 3 T magnet strength for VS diagnosis and their follow-up MRI scans obtained at least 5 months after the initial MRI. We excluded patients under 18 years old, who had any surgery or radiotherapy before or between these two scans, or diagnosed with neurofibromatosis type 2 for this study. Two observers (one neurotologist and one medical student) manually delineated the tumors using Velocity AI version 4.0 software (Varian Medical Systems, Palo Alto, CA). A total of 103 patients were included in this study. The median follow-up duration between the first and second MR scan was 7.2 months (interquartile range [IQR]: 6.3–12.1 months). The median manually contoured VS volume was 321.02 mm3 (IQR: 156.67–1018.79 mm3) and 450.47 mm3 (IQR: 183.43–1289.29 mm3) on the initial scans and follow-up scans, respectively. Based on the volumetric VS enlargement definition (≥20% volume growth), 62 tumors (60.19%) demonstrated tumor enlargement. The basic patient characteristics are summarized in Table I, of which the age, size, gender, laterality, race, and ethnicity distributions are representative of the general population of VS patients in the United States.20–23 Detailed information about patient inclusion, imaging protocol, and tumor delineation can be found in Supplemental Digital Content 1–3, respectively.
TABLE I.
Patient characteristics.
| Characteristic | Number |
|---|---|
|
| |
| Patients (n) | 103 |
| Age (y) | 62.54 (IQR: 54.95–69.14) |
| Sex | |
| Male | 51 (49.5%) |
| Female | 52 (50.5%) |
| Race | |
| White | 87 (84.5%) |
| Black or African American | 5 (4.9%) |
| Asian | 3 (2.9%) |
| Some other race | 4 (3.9%) |
| Unavailable/Unknown | 4 (3.9%) |
| Ethnicity | |
| Hispanic | 8 (7.8%) |
| Non-Hispanic | 90 (87.4%) |
| Unavailable/Unknown | 5 (4.9%) |
| Side of tumor | |
| Left | 46 (44.7%) |
| Right | 57 (55.3%) |
| Volume (mm3) | 321.02 (IQR: 156.67–1018.79) |
IQR = interquartile range.
Then, we loaded these scans and segmentation masks to Python version 3.8 (https://www.python.org) for data pre-processing, comprising image resampling, image cropping, image standardization, tumor volume measurement and enlargement labeling. All the images were resized to the same voxel spacing (0.45 × 0.45 × 3.0mm3), and we centered cropped these 3D images to size of 384 × 384 × 16, which covers the whole brain transversely and includes the tumor and its surrounding slices axially as the model input. We selected the target voxel size based on the median value of pixel spacing (0.45 mm) and slice thickness (3.0 mm) of MR images in our dataset. VS volumes on both the initial and follow-up MRIs were measured and recorded. Volumetric tumor enlargement was defined as volume change ≥20% between initial scan and follow-up scan following the established volumetric VS enlargement criteria.1,6 Z-score image standardization method was applied on the initial scans to address the image intensity variability problem of MRI.24
Deep Multi-task Model
The workflow of the DMT model is shown in Figure 1, and the model structure is shown in Figure 2. The model consists of two parts: a 3D-UNet structure TS module for automatic deep segmentation, and an AlexNet-style TEP module for deep learning-based prediction.25 After image pre-processing, the segmentation module is used to detect tumor volume from the initial contrast-enhanced T1-weighted (ceT1) MRI scan and generate attention maps (deep features), which identify tumor and its surrounding region relevant for VS enlargement prediction. The attention maps here are from different layers of the ‘decoder’ part of 3D-UNet. With the input MR image and generated deep features maps from segmentation module, the TEP module is used to identify tumor in risk of fast growth (≥20% volumetric enlargement). The manually segmented VS volumes on initial scans were used as the ground truth for training and evaluation of the TS module, although the tumor enlargement labels were used as the ground truth for constructing and evaluation the TEP module. These two modules were trained simultaneously, and the loss function is defined as follows:
where x is the 3D initial ceT1 MR image, and are the mask and predicted mask of tumor volume, y and y′ are the VS enlargement label and predicted enlargement probability. The DiceLoss was used to evaluate similarities in overlap between the ground truth and model-predicted masks. The BCELoss was used to measure the binary cross entropy between the tumor enlargement label and the TEP output. β is a weighting parameter to balance the importance of TE module and TEP module during model training, and it was set as 1.0 in our experiment.
Fig. 1.

Framework of the proposed deep multi-task (DMT) approach for joint vestibular schwannoma (VS) enlargement prediction and segmentation.
Fig. 2.
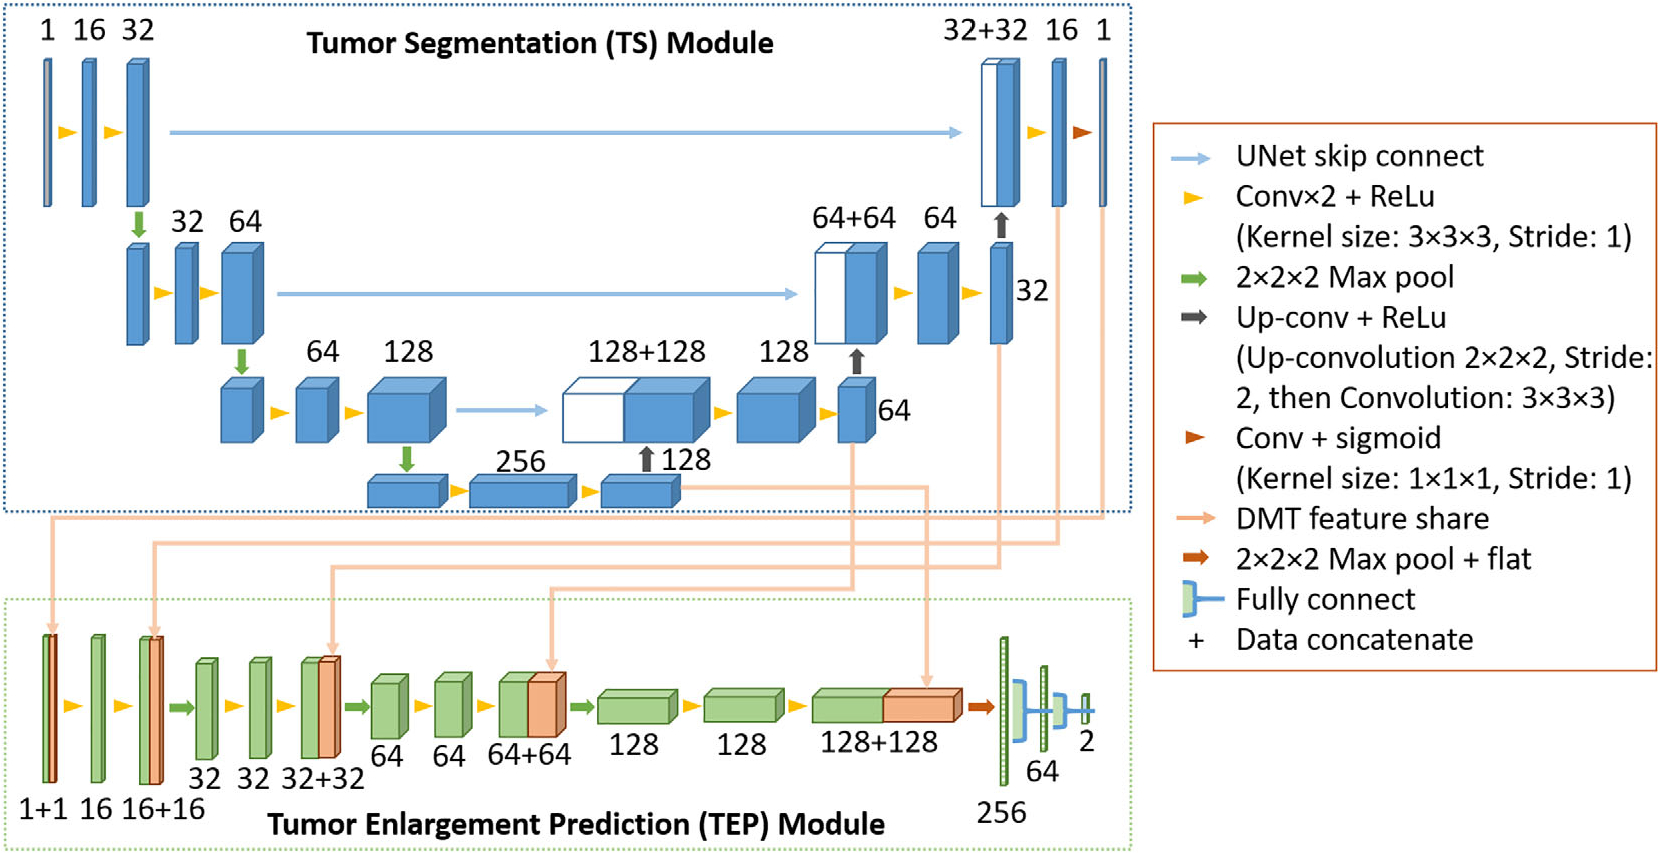
The architecture of the deep multi-task (DMT) network. The boxes represent feature maps, their surrounding numbers denote the number of channels in each layer.
The network implementation is based on the 3D U-Net proposed by Çiçek et al.25 We implemented it with PyTorch version 1.8 (https://pytorch.org) and the model training processing was performed with a 24 GB NVIDIA GeForce RTX 3090 Graphics Card (NVIDIA, Santa Clara, CA). The details about model structure are shown in Figure 2. We randomly initialized weights as the starting point for model training and trained the DMT model using Adam optimizer with a batch size of 16 for 100 epochs. The initial learning rate was set as 10−3, and it would decrease by a factor of 10 if the validation dice coefficient stopped improving for 5 epochs. Three image augmentation operations were used in our experiment: (1) random rotation in the axial plane between [−15, 15] degrees; (2) random shifting of the image in the axial plane within [−32, 32] voxels; and (3) adding zeros-mean, 0.01 standard deviation Gaussian noise on the whole image. The dropout rate was set as 0.5 during model training.
Model Evaluation and Statistical Analysis
Five-fold cross-validation was performed to train and evaluate our method. All the patients were randomly split into 1 of 5 folds, and the training and validation cohorts followed a 4:1 fashion.
We used dice coefficient to evaluate the VS segmentation module in DMT model. A separate 3D-UNet with the same structure as our TS module, and a state-of-the-art nnU-Net model were trained specifically for VS segmentation using the same 5-fold cross-validation partition. The implementation of nnU-Net is based on the open-source code released by Isensee et al.26 The same image pre-processing method, data augmentation method, implementation software, and hardware platform were used. Their segmentation results were recorded and compared with DMT model. Paired t-tests were used to evaluate the statistical significance of segmentation dice coefficients.
For TEP, we applied common binary classification evaluation metrics to evaluate the performance of the proposed DMT model, including prediction SEN, specificity (SPE), ACC, and area under the receiver operating characteristic (ROC) curve (AUC). A sample with a probability value larger than 0.5 was predicted to have tumor enlargement. Two separate tumor growth prediction models, a radiomics-based model and a 3D-AlexNet model, were trained and tested following the same data splitting as DMT model for comparison. The radiomics model used 3D radiomics features extracted from the delineated tumor area for model construction, radiomic feature extraction was performed using an open-source radiomics package that is compliant with the Image Biomarker Standardization Initiative (pyradiomics, version 3.0), and the model structure followed a multi-classifier binary prediction model.27,28 The extracted radiomic features comprise 9 intensity features, 8 geometry features and 240 texture features. We used minimum redundancy maximum relevance (mRMR) selection method for radiomic feature pre-selection and immune algorithm for iterative feature selection and radiomic model construction.28,29 The 3D-AlexNet used the same input and network structure of the TEP module in DMT model except for the deep feature-sharing mechanism. We used DeLong test to compare the ROC curves acquired from combining the validation cohorts in the 5-fold cross-validation using these prediction methods.30 All evaluation and statistics were performed using Python version 3.8, and p < 0.05 was defined as statistically significant. Definitions or explanations about the related machine learning and statistics glossary are summarized in Supplemental Digital Content 4. Detailed information about the extracted radiomics features can be found in Supplemental Digital Content 5.
RESULTS
The manually delineated VS contour and predicted contours from the single-task 3D-UNet segmentation model and the proposed DMT model are shown in Figure 3. The distribution of dice coefficients between manual segmentation masks and deep learning model-predicted VS masks were shown in Figure 4. Power calculated for this study is summarized in Supplemental Digital Content 6. All the automatic VS segmentation models were in good agreement with the experts’ delineations. The median dice coefficient from 3D-UNet model was 83.13% (IQR: 74.38%–87.27%), the median dice coefficient from nnU-Net model was 86.45% (IQR: 81.89%–90.04%), and the median dice coefficient from DMT model was 84.20% (IQR: 77.47%–87.42%). Comparing with the segmentation dice coefficient distribution of DMT model using paired t-test, the separate 3D-UNet model has significantly lower segmentation performance (p = 0.03), and the nnU-Net model has marginally better performance (p = 0.16). The mean computational time of DMT model for each testing patient was 2.68 sec (standard deviation 0.05 s).
Fig. 3.

Visualization of segmentation results on samples of different volume levels. Input image with cropped regions of interest (in the red box), ground truth masks, predicted masks from the segmentation-specialized 3D-UNet, the segmentation-specialized nnU-Net, and the proposed deep multi-task (DMT) model were listed for comparison (A, B, C, D, E in the figure for different patients, respectively).
Fig. 4.

Boxplot demonstrating the range of the dice coefficients between expert contoured tumor masks and automatically predicted tumor masks using different deep segmentation models.
Table II and Figure 5 both demonstrate the merged 5-fold cross-validation performance of TEP using different models. The proposed DMT model has the best performance on SPE, ACC, and AUC, which are 0.78, 0.72, and 0.77, respectively. The radiomics model has the best SEN (0.75). We used 0.5 as the probability threshold to calculate SPE, SEN, and ACC. When comparing the ROC curves of different models, the proposed DMT model reached statistical significance when compared with single-task deep prediction model (AlexNet, AUC = 0.60, p = 0.01), but it is marginally better than the radiomics model (AUC = 0.70, p = 0.17).
TABLE II.
Tumor enlargement prediction performance of different models.
| Model | Sensitivity | Specificity | Accuracy | AUC | p-value (To Multi-task) |
|---|---|---|---|---|---|
|
| |||||
| Multi-task | 0.68 | 0.78 | 0.72 | 0.77 | ---- |
| AlexNet | 0.63 | 0.58 | 0.61 | 0.60 | 0.01 |
| Radiomics | 0.75 | 0.58 | 0.68 | 0.70 | 0.17 |
The bold values indicate the best results of the related metrics.
Fig. 5.

The receiver operating characteristic (ROC) curves of different VS enlargement prediction models.
DISCUSSION
In this study, we first proposed a multi-task learning framework for VS enlargement prediction based on the initial diagnosis imaging. The presented method achieved accurate prediction of VS volumetric enlargement after diagnosis (AUC = 0.77), which significantly outperformed single task model with similar structure as initially hypothesized (AUC = 0.60, p = 0.01) but did not reach significance when compared to the radiomics model (AUC = 0.70, p = 0.17). This may help identify VS patients who have higher risk of fast tumor growth in early stage, encouraging treatment, and avoiding unnecessary imaging surveillance for patients having stable VS. Our model implementation based on PyTorch is available on https://github.com/wangkaiwan/VS-Growth-Prediction.
The proposed DMT model also allows automatic VS segmentation in addition to TEP. The on average 2.68 ± 0.05 sec automatic TS speed for each patient is promising to assist in clinic, versus minutes to manually delineate a tumor by human experts. Although the segmentation performance of the DMT model (median dice coefficient of 84.20%) was lower than the state-of-the-art model nnU-Net (p = 0.16) dedicated to image segmentation task only, it is significantly better than the single-task TS model which has very similar structure as the TS module in the DMT model (p = 0.03). From the segmentation result samples shown in Figure 3, the lower dice coefficients of the segmentation masks generated with the proposed DMT model may be caused by inaccurate prediction of tumor boundary, when compared with the predicted tumor masks from nnU-Net. As the primary goal of this study is to predict VS enlargement, it is important to clarify that the TS module in the DMT framework is mainly used to identify all relevant regions that contribute to the enlargement prediction performance. As such, the TS module may have included some nearby surrounding tissues of VS tumors, resulting in lower performance of segmentation measured by dice coefficient.
Of note, some researchers have demonstrated over 90% dice score performance on VS segmentation based on ceT1 scans using deep learning methods.9,13 Apart from the reason we explained above, we believe the following two factors may contribute the gap between our results and previous publications: (1) number of patients and (2) difference in the patient population and tumor volume size. We used ceT1 MR scans of 103 patients in this study, although the number of included patients is 243 in the study of Shapey et al. (dice coefficient of 93.43%) and 214 in the study reported by Neve et al., (dice coefficient of 92%), respectively.9,13 As the performance of deep learning based methods is related to the size of training dataset, the gap between the model performance is expected. Furthermore, the patient population and tumor size distribution could contribute more to the gap between our model and other studies. In this work, we used the initial diagnosis MR scans for TEP, and all of the patients followed the ‘wait-and-scan’ protocol. The median volume of VS tumors was 321.02 mm3 (IQR: 156.67–1018.79 mm3). However, in the work reported by Shapey et al., all the patients had a single sporadic VS treated with Gamma Knife stereotactic radiosurgery, and the median tumor volume is 1360 mm3 (IQR: 630–3150 mm3), which is much larger than the tumor volumes in our study. Neve et al., did not report the tumor volume, but they showed the tumor size instead. Among the 134 patients with VS, 87 patients (64.9%) have tumor size bigger than 11 mm, although the median tumor size in our patient cohort is 11.2 mm.12,13 For smaller tumors/structures, it will be more challenging to segment and achieve higher Dice coefficient.
We compared the VS enlargement prediction performance with a TEP-specific network which has the same structure as the TEP module in the DMT model. The result showed that the TS module was actually critical for TEP, as the DMT model achieved significantly higher VS enlargement prediction AUC (AUC = 0.77) than the single-task model (AUC = 0.60). The most important reason for the performance difference between these two models could be the intrinsic high-data-efficiency and low-overfitting properties of multi-task learning method.
Recently, radiomics-based methods combined with traditional machine learning techniques have been applied to different prediction tasks for VS.14,15,31–33 Although promising prediction performance was achieved for post-radiosurgery response/enlargement prediction and active treatment requirement prediction, none of these methods provides end-to-end prediction, because tumor delineation is a prerequisite for MRI radiomics feature extraction. In contrast to a radiomics-based strategy, the proposed DMT framework combines TS and enlargement prediction in one model, generating a prediction result from the diagnostic images, which is more clinically efficient. For comparison, we also built a radiomics-based model using the radiomic features extracted from manually contoured tumors. The result showed that the TEP performance using radiomics (AUC = 0.70) is lower than the segmentation guided VS enlargement prediction (AUC = 0.77). One possible reason is that VS boundary and surrounding structures which can be detected by the TS module provided additional information for TEP. The similar findings have been verified in the tumor biology and treatment outcome prediction research using imaging features from peritumoral region.34,35 From this angle, the TS module in the DMT model is necessary for detecting the region of interest for prediction and making the prediction process more reliable and efficient. Nevertheless, the DMT model did not achieve statistically significant better performance in terms of AUC as compared to radiomics model. This could be caused by the relatively small sample size of our study.
We reviewed our study according to the checklist for AI in Medical Imaging (CLAIM, please check the details in Supplemental Digital Content 7), which is a guidelines for reporting evaluation of machine learning models designed for medical applications.36 There are also some limitations in this study. First, the small sample size of this study, single institution, and the retrospective nature of the dataset make the constructed DMT model subject to potential selection bias. Additionally, our study did not meet the CLAIM criteria 30–32 (robustness analysis and external validation) and 35–36 (performance evaluation on all data partitions), because the effect of different imaging protocol or patient management method across institution cannot be analyzed. The generalizability and clinical efficacy of the proposed model should be further investigated via larger multicenter cohort validation and prospective study. Second, the patient selection criteria were broad, and we did not perform subclass analysis with respect to tumor characteristics, such as volumetric size, tumor position, and type of growth, due to the limitation of sample size. Further research is warranted to determine if our strategy is more appropriate for certain VS subclasses. Finally, deep learning techniques are still under rapid growth, recently proposed transformer network structure and its variations have shown better segmentation and classification performance than CNN-based ones on lots of computer vision applications, including medical-related tasks, due to their intrinsic global attention mechanism.37–39 Incorporating these novel techniques in our multi-task framework may further improve its performance for VS enlargement prediction and segmentation and further validation is warranted in a future work.
CONCLUSION
We presented a DMT framework to predict VS enlargement and segmentation mask simultaneously using the initial ceT1 MRI. The results show that the proposed DMT model is promising and worthy of prospective investigation on a larger cohort of patients.
Supplementary Material
Acknowledgment
Nicholas A. George-Jones is supported by NIH grant 5T32DC000040–27.
Footnotes
The authors have no other funding, financial relationships, or conflicts of interest to disclose.
Additional supporting information may be found in the online version of this article.
Level of Evidence: NA
Contributor Information
Kai Wang, The Department of Radiation Oncology, University of Texas Southwestern Medical Center, Dallas, Texas, USA.
Nicholas A. George-Jones, The Department of Otolaryngology-Head and Neck Surgery, University of Texas Southwestern Medical Center, Dallas, Texas, USA; The Department of Otolaryngology-Head and Neck Surgery, University of Iowa Hospitals and Clinics, Iowa City, Iowa, USA..
Liyuan Chen, The Department of Radiation Oncology, University of Texas Southwestern Medical Center, Dallas, Texas, USA.
Jacob B. Hunter, The Department of Otolaryngology-Head and Neck Surgery, University of Texas Southwestern Medical Center, Dallas, Texas, USA.
Jing Wang, The Department of Radiation Oncology, University of Texas Southwestern Medical Center, Dallas, Texas, USA.
BIBLIOGRAPHY
- 1.Marinelli JP, Schnurman Z, Killeen DE, et al. Long-term natural history and patterns of sporadic vestibular schwannoma growth: a multi-institutional volumetric analysis of 952 patients. Neuro-Oncology. 2021;24(8):1298–1306. [DOI] [PMC free article] [PubMed] [Google Scholar]
- 2.Carlson ML, Link MJ. Vestibular schwannomas. N Engl J Med. 2021;384(14):1335–1348. [DOI] [PubMed] [Google Scholar]
- 3.Macielak RJ, Driscoll CL, Link MJ, Haynes DS, Lohse CM, Carlson ML. Vestibular schwannoma practice patterns: an international cross-specialty survey. Otol Neurotol. 2020;41(10):e1304–e1313. [DOI] [PubMed] [Google Scholar]
- 4.Shapey J, Barkas K, Connor S, et al. A standardised pathway for the surveillance of stable vestibular schwannoma. Ann R Coll Surgeons England. 2018;100(3):216–220. [DOI] [PMC free article] [PubMed] [Google Scholar]
- 5.Kondziolka D, Mousavi SH, Kano H, Flickinger JC, Lunsford LD. The newly diagnosed vestibular schwannoma: radiosurgery, resection, or observation? Neurosurg Focus. 2012;33(3):E8. [DOI] [PubMed] [Google Scholar]
- 6.Selleck AM, Rodriguez JD, Brown KD. Vestibular schwannoma measurements—is volumetric analysis clinically necessary? Otol Neurotol. 2021;42(6):906–911. [DOI] [PubMed] [Google Scholar]
- 7.Varughese J, Wentzel-Larsen T, Vassbotn F, Moen G, Lund-Johansen M. Analysis of vestibular schwannoma size in multiple dimensions: a comparative cohort study of different measurement techniques. Clin Otolaryngol. 2010;35(2):97–103. [DOI] [PubMed] [Google Scholar]
- 8.Tang S, Griffin AS, Waksal JA, et al. Surveillance after resection of vestibular schwannoma: measurement techniques and predictors of growth. Otol Neurotol. 2014;35(7):1271–1276. [DOI] [PubMed] [Google Scholar]
- 9.Shapey J, Wang G, Dorent R, et al. An artificial intelligence framework for automatic segmentation and volumetry of vestibular schwannomas from contrast-enhanced T1-weighted and high-resolution T2-weighted MRI. J Neurosurg. 2019;1(aop):1–9. [DOI] [PMC free article] [PubMed] [Google Scholar]
- 10.McGrath H, Li P, Dorent R, et al. Manual segmentation versus semi-automated segmentation for quantifying vestibular schwannoma volume on MRI. Int J Comput Assist Radiol Surg. 2020;15(9):1445–1455. [DOI] [PMC free article] [PubMed] [Google Scholar]
- 11.Lee W-K, Wu C-C, Lee C-C, et al. Combining analysis of multi-parametric MR images into a convolutional neural network: precise target delineation for vestibular schwannoma treatment planning. Artif Intell Med. 2020;107:101911. [DOI] [PubMed] [Google Scholar]
- 12.George-Jones NA, Wang K, Wang J, Hunter JB. Automated detection of vestibular schwannoma growth using a two-dimensional U-net convolutional neural network. Laryngoscope. 2020;131(2):e619–e624. [DOI] [PubMed] [Google Scholar]
- 13.Neve OM, Chen Y, Tao Q, et al. Fully automated 3D vestibular schwannoma segmentation with and without gadolinium-based contrast material: a multicenter, multivendor study. Radiol Artif Intell. 2022;4(4):e210300. [DOI] [PMC free article] [PubMed] [Google Scholar]
- 14.Langenhuizen PPJH, Zinger S, Leenstra S, et al. Radiomics-based prediction of Long-term treatment response of vestibular schwannomas following stereotactic radiosurgery. Otol Neurotol. 2020;41(10):e1321–e1327. [DOI] [PubMed] [Google Scholar]
- 15.George-Jones NA, Wang K, Wang J, Hunter JB. Prediction of vestibular schwannoma enlargement after radiosurgery using tumor shape and MRI texture features. Otol Neurotol. 2021;42(3):e348–e354. [DOI] [PubMed] [Google Scholar]
- 16.Yang H-C, Wu C-C, Lee C-C, et al. Prediction of pseudoprogression and long-term outcome of vestibular schwannoma after gamma knife radiosurgery based on preradiosurgical MR radiomics. Radiother Oncol. 2021;155:123–130. [DOI] [PubMed] [Google Scholar]
- 17.Zhang Y, Yang Q. A survey on multi-task learning. IEEE Trans Knowl Data Eng. 2021;34(12):5586–5609. [Google Scholar]
- 18.Jin C, Yu H, Ke J, et al. Predicting treatment response from longitudinal images using multi-task deep learning. Nat Commun. 2021;12(1):1–11. [DOI] [PMC free article] [PubMed] [Google Scholar]
- 19.Chen L, Dohopolski M, Zhou Z, et al. Attention guided lymph node malignancy prediction in head and neck cancer. Int J Radiat Oncol Biol Phys. 2021;110(4):1171–1179. [DOI] [PubMed] [Google Scholar]
- 20.Schnurman Z, Nakamura A, McQuinn MW, Golfinos JG, Roland JT, Kondziolka D. Volumetric growth rates of untreated vestibular schwannomas. J Neurosurg. 2019;133(3):742–748. [DOI] [PubMed] [Google Scholar]
- 21.Marinelli JP, Schnurman Z, Killeen DE, et al. Long-term natural history and patterns of sporadic vestibular schwannoma growth: a multi-institutional volumetric analysis of 952 patients. Neuro-Oncology. 2022;24(8):1298–1306. [DOI] [PMC free article] [PubMed] [Google Scholar]
- 22.Carlson ML, Marston AP, Glasgow AE, et al. Racial differences in vestibular schwannoma. Laryngoscope. 2016;126(9):2128–2133. [DOI] [PubMed] [Google Scholar]
- 23.Ostler B, Killeen DE, Reisch J, et al. Patient demographics influencing vestibular schwannoma size and initial management plans. World Neurosurg. 2020;136:e440–e446. [DOI] [PubMed] [Google Scholar]
- 24.Carré A, Klausner G, Edjlali M, et al. Standardization of brain MR images across machines and protocols: bridging the gap for MRI-based radiomics. Sci Rep-Uk. 2020;10(1):1–15. [DOI] [PMC free article] [PubMed] [Google Scholar]
- 25.Çiçek Ö, Abdulkadir A, Lienkamp SS, Brox T, Ronneberger O. 3D U-Net: learning dense volumetric segmentation from sparse annotation. Paper presented at: International conference on medical image computing and computer-assisted intervention. 2016. [Google Scholar]
- 26.Isensee F, Jaeger PF, Kohl SA, Petersen J, Maier-Hein KH. nnU-net: a self-configuring method for deep learning-based biomedical image segmentation. Nat Methods. 2021;18(2):203–211. [DOI] [PubMed] [Google Scholar]
- 27.Van Griethuysen JJ, Fedorov A, Parmar C, et al. Computational radiomics system to decode the radiographic phenotype. Cancer Res. 2017;77(21):e104–e107. [DOI] [PMC free article] [PubMed] [Google Scholar]
- 28.Wang K, Zhou Z, Wang R, et al. A multi-objective radiomics model for the prediction of locoregional recurrence in head and neck squamous cell cancer. Med Phys. 2020;47(10):5392–5400. [DOI] [PubMed] [Google Scholar]
- 29.Peng H, Long F, Ding C. Feature selection based on mutual information criteria of max-dependency, max-relevance, and min-redundancy. IEEE T Pattern Anal. 2005;27(8):1226–1238. [DOI] [PubMed] [Google Scholar]
- 30.DeLong ER, DeLong DM, Clarke-Pearson DL. Comparing the areas under two or more correlated receiver operating characteristic curves: a non-parametric approach. Biometrics. 1988;44(3):837–845. [PubMed] [Google Scholar]
- 31.Profant O, Bureš Z, Balogová Z, et al. Decision making on vestibular schwannoma treatment: predictions based on machine-learning analysis. Sci Rep-Uk. 2021;11(1):1–14. [DOI] [PMC free article] [PubMed] [Google Scholar]
- 32.Lee C-C, Lee W-K, Wu C-C, et al. Applying artificial intelligence to longitudinal imaging analysis of vestibular schwannoma following radiosurgery. Sci Rep-Uk. 2021;11(1):1–10. [DOI] [PMC free article] [PubMed] [Google Scholar]
- 33.Abouzari M, Goshtasbi K, Sarna B, et al. Prediction of vestibular schwannoma recurrence using artificial neural network. Laryngoscope Invest Otolaryngol. 2020;5(2):278–285. [DOI] [PMC free article] [PubMed] [Google Scholar]
- 34.Hao H, Zhou Z, Li S, et al. Shell feature: a new radiomics descriptor for predicting distant failure after radiotherapy in non-small cell lung cancer and cervix cancer. Phys Med Biol. 2018;63(9):095007. [DOI] [PMC free article] [PubMed] [Google Scholar]
- 35.Braman N, Prasanna P, Whitney J, et al. Association of peritumoral radiomics with tumor biology and pathologic response to preoperative targeted therapy for HER2 (ERBB2)–positive breast cancer. JAMA Netw Open. 2019;2(4):e192561. [DOI] [PMC free article] [PubMed] [Google Scholar]
- 36.Mongan J, Moy L, Kahn CE Jr. Checklist for artificial intelligence in medical imaging (CLAIM): a guide for authors and reviewers. Radiol Artif Intell. 2020;2(2):1–6. [DOI] [PMC free article] [PubMed] [Google Scholar]
- 37.Dosovitskiy A, Beyer L, Kolesnikov A, et al. An image is worth 16 × 16 words: transformers for image recognition at scale. Paper Presented at: International Conference on Learning Representations. 2020. [Google Scholar]
- 38.Liu Z, Lin Y, Cao Y, et al. Swin transformer: Hierarchical vision transformer using shifted windows. Paper presented at: Proceedings of the IEEE/CVF International Conference on Computer Vision. 2021. [Google Scholar]
- 39.Dai Y, Gao Y, Liu F. Transmed: transformers advance multi-modal medical image classification. Diagnostics. 2021;11(8):1384. [DOI] [PMC free article] [PubMed] [Google Scholar]
Associated Data
This section collects any data citations, data availability statements, or supplementary materials included in this article.