

Abstract
Background
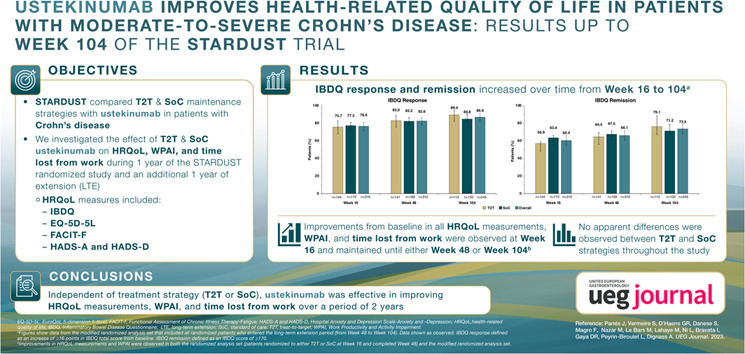
STARDUST is a phase 3b randomized controlled trial comparing two ustekinumab treatment strategies in patients with Crohn's disease (CD): treat‐to‐target (T2T) versus standard of care (SoC).
Objective
We investigated the effect of a T2T or SoC ustekinumab treatment strategy on health‐related quality of life (HRQoL) and work productivity and activity impairment (WPAI) over a 2‐year follow‐up period.
Methods
At Week 16, adult patients with moderate‐to‐severe active CD were randomized 1:1 to either T2T or SoC treatment groups. We assessed changes from baseline in HRQoL measures (Inflammatory Bowel Disease Questionnaire [IBDQ], EuroQoL 5‐dimension 5‐level [visual analogue scale and index], Functional Assessment of Chronic Illness Therapy‐Fatigue, Hospital Anxiety and Depression Scale‐Anxiety and ‐Depression) and the WPAI questionnaire in two patient populations: randomized analysis set (RAS, patients randomized to either T2T or SoC at Week 16 and completed Week 48) and modified RAS (mRAS, patients who entered the long‐term extension [LTE] period at Week 48).
Results
At Week 16, 440 patients were randomized to T2T (n = 219) or SoC (n = 221) arms; 366 patients completed Week 48. Of these, 323 patients entered the LTE and 258 patients completed 104 weeks of treatment. In the RAS population, percentages of patients achieving IBDQ response and remission were not significantly different between treatment arms at Weeks 16 and 48. In the overall mRAS population, IBDQ response and remission increased over time from Weeks 16–104. In both populations, improvements from baseline in all HRQoL measurements were observed at Week 16 and maintained until either Week 48 or Week 104, respectively. In both populations, improvements from baseline in T2T and SoC arms at Weeks 16, 48 or 104 in WPAI domains were observed.
Conclusion
Independent of treatment strategy (T2T or SoC), ustekinumab was effective in improving HRQoL measurements and WPAI over a period of 2 years.
Keywords: Crohn's disease, health‐related quality of life, standard of care, tight monitoring, treat‐to‐target, ustekinumab
Key summary.
Summarize the established knowledge on this subject
Crohn's disease has a significant negative impact on a patient's health‐related quality of life (HRQoL).
Data on the short‐ and long‐term effects of a treat‐to‐target approach on HRQoL, work productivity and activity impairment are lacking.
What are the significant and/or new findings of this study?
Independent of a treat‐to‐target or standard‐of‐care treatment strategy, ustekinumab treatment improves HRQoL outcomes and work productivity over a 2‐year period.
A treat‐to‐target strategy with an intensified treatment schedule and monitoring, did not negatively impact HRQoL measurements and work productivity and activity impairment (WPAI) outcomes of patients throughout the 2 years of follow‐up.
INTRODUCTION
Crohn's disease (CD) is a chronic condition with alternating periods of relapse and remission, which, if uncontrolled, may lead to bowel damage and progressive disability. 1 , 2 , 3 , 4 Key symptoms include diarrhoea, abdominal pain and fatigue. As a result, CD has a substantial negative impact on a patient's health‐related quality of life (HRQoL), including emotional and psychological issues such as anxiety and depression, social and family interactions, and work productivity. 4 , 5 , 6 , 7 , 8 In the last decade, patient‐reported outcomes (PROs) have become important treatment targets for patients with CD. 9 , 10 Recently, the STRIDE‐II consensus has recommended HRQoL as an important long‐term endpoint for disease management in inflammatory bowel disease (IBD) patients. 11
In CD treatment, both symptomatic improvement and endoscopic response are the current short‐term targets according to the STRIDE‐II consensus. 11 We believe that treating to target may result in better long‐term outcomes, including HRQoL. STARDUST was the first randomized controlled trial comparing a treat‐to‐target (T2T) approach using early endoscopic assessment, regular biomarker and clinical symptom monitoring, and dose intensification for persistent inflammatory activity with a clinically driven standard of care (SoC) maintenance strategy in patients with moderate‐to‐severe active CD receiving ustekinumab. 12 We previously reported that the primary endpoint of this trial, endoscopic response, and other endpoints were not significantly different between the two treatment strategies. 12 After the completion of the first year of treatment, patients entering the long‐term extension (LTE) period were evaluated until Week 104, with algorithm‐driven dose escalation/de‐escalation available for all patients regardless of whether patients were in the T2T or SoC treatment arms.
Here, we investigate the effect of a T2T versus SoC ustekinumab treatment strategy on HRQoL and work productivity in patients with moderate‐to‐severe CD over a period of 2 years in the STARDUST study.
METHODS
STARDUST study overview
The STARDUST study design and primary outcomes, including the safety data, have been reported previously. 12 In brief, the STARDUST trial (NCT03107793) is an open‐label, multicentre, randomized phase 3b trial conducted in 12 European countries.
Adult patients (aged ≥18 years) with moderate‐to‐severe, active CD at baseline (i.e., CD Activity Index [CDAI] 220–450) and endoscopic activity (i.e., Simple Endoscopic Score for Crohn's Disease [Simple Endoscopic Score for Crohn Disease (SES‐CD)] ≥3), who were unresponsive to conventional therapy and/or one biological were enroled in the study. Enroled patients received intravenous weight‐based ustekinumab ∼6 mg/kg at Week 0 and then subcutaneous (SC) ustekinumab 90 mg at Week 8. At Week 16, responders (patients with ≥70‐point reduction compared with baseline in CDAI) were randomized 1:1 to either T2T or SoC arms and received treatment through Week 48. From Week 16 to Week 48, patients assigned to the T2T arm received ustekinumab q12w or q8w based on SES‐CD improvement from baseline. Patients with ≥25% improvement in SES‐CD scores at Week 16 were assigned ustekinumab q12w dosing, while patients with <25% improvement at Week 16 were assigned ustekinumab q8w dosing. Patients could be escalated to every 4 weeks (q4w) dosing through Week 48 if prespecified treatment targets were missed. Patients assigned to the SoC arm received ustekinumab q12w or q8w; those receiving q12w ustekinumab treatment could escalate per European labelling (Supplementary Figure 1). From Week 48, eligible patients could enter the LTE period and continue to receive SC ustekinumab up to Week 104 with further protocol‐guided dose adjustment (Supplementary Figure 1).
The objective of this analysis was to evaluate the effect of a T2T versus SoC ustekinumab treatment strategy on HRQoL and work productivity in patients with moderate‐to‐severe CD, using the disease‐specific Inflammatory Bowel Disease Questionnaire (IBDQ), and the EuroQoL 5‐dimension 5‐level (EQ‐5D‐5L; visual analogue scale [VAS] and index), Functional Assessment of Chronic Illness Therapy‐Fatigue (FACIT‐F), Hospital Anxiety and Depression Scale‐Anxiety and ‐Depression (HADS‐A and HADS‐D) and Work Productivity and Activity Impairment (WPAI) questionnaires. 13 , 14 , 15 , 16 , 17 Time lost from work was also evaluated.
Data analysis
The effects of the T2T and SoC ustekinumab treatment strategies on HRQoL and WPAI were assessed separately in (i) patients who were randomized to either T2T or SoC at Week 16 (randomized analysis set (RAS), n = 440]) and (ii) patients who entered the LTE period at Week 48 (modified RAS [mRAS, n = 323]) (Supplementary Figure 2). The aim was to evaluate the effect of a T2T versus SoC dosing strategy on HRQoL and WPAI as a secondary objective of the STARDUST study, through analysis of the RAS population. The analysis of the mRAS population explored the effectiveness of ustekinumab treatment during the LTE, with this specific analysis focussing only on HRQoL measurements and WPAI outcomes.
Study assessments using patient‐reported outcome instruments
HRQoL was evaluated using the IBDQ, EQ‐5D‐5L (VAS and index), FACIT‐F, HADS‐A and HADS‐D questionnaires at baseline and at Weeks 16, 48 (in the RAS population) and Week 104 (in the mRAS LTE population). Improvements in HRQoL measures were reported as the mean change from the baseline score; improvement was indicated by a positive change for IBDQ and EQ‐5D‐5L (VAS and index), and by a negative change for HADS‐A and ‐D scores.
The percentage of patients with IBDQ response (defined as an increase of ≥16 points in IBDQ total scores from baseline) and remission (an IBDQ score of ≥170) at Weeks 16, 48 and 104 were determined. The potential impact of ustekinumab on patients' work, daily productivity and activities was assessed through the WPAI questionnaire (a 6‐item questionnaire with a 7‐day recall period 17 , 18 ) at Weeks 16, 48 and 104. The WPAI questionnaire generated four types of scores: the percentage of work time missed (absenteeism), percentage of impairment while working/reduced on‐the‐job effectiveness (presenteeism), percentage of overall work impairment/absenteeism and presenteeism combined (work productivity loss), and percentage of activity impairment. The percentage of patients with a 7‐point improvement in WPAI scores from baseline for each domain was calculated at Weeks 16, 48 and 104. The time lost from work (in days) due to CD in the last 4 weeks was also collected and assessed at Weeks 16, 48 and 104.
Statistical analyses
For patients in the RAS population, dichotomous endpoints were compared between treatment strategies using a two‐sided Cochran–Mantel–Haenszel χ2 test stratified by baseline biological history status (biologic‐naïve versus prior exposure to and unresponsive to one biologic), and baseline SES‐CD scores (≤16 vs. >16). Changes in continuous endpoints were analysed using analysis of covariance (ANCOVA) on van der Waerden normal scores, with baseline values and stratification factors as covariates. Statistical testing was performed at α = 0.050 (two‐sided) level of significance. For dichotomous endpoints (IBDQ response and remission), non‐responder imputation was used for patients with missing data (defined as those who terminated the study before, or who had a missing value at, the designated visit). For continuous variables (HRQoL PRO assessments and time lost from work), last observation carried forward was used for missing data imputation. Work productivity and activity impairment and 7‐point improvement in WPAI domain results for the RAS population are presented as observed, due to the nature of the WPAI questionnaire capturing absenteeism and presenteeism only if the patient is employed. 17
Owing to the exploratory nature of the LTE, no statistical testing was performed between the T2T and SoC arms in the mRAS population. All data (IBDQ response and remission, HRQoL PRO assessments, WPAI, 7‐point improvement in WPAI domains and time lost from work) were analysed as observed.
Study ethics and patient consent
This clinical trial (Protocol: CNTO1275CRD3005) was approved by relevant ethics committees or institutional review boards and conducted in compliance with the Declaration of Helsinki, the International Conference on Harmonization Good Clinical Practice guidelines and applicable local regulations. All patients provided written informed consent. All authors had access to the study data and reviewed and approved the final manuscript.
RESULTS
Patient disposition
Of 498 patients who were enroled, 440 patients were randomized to T2T (n = 219) or SoC (n = 221) at Week 16 (RAS). A total of 74 (T2T, n = 46; SoC, n = 28) patients discontinued before Week 48. Of the remaining 366 patients who completed Week 48, 43 (T2T, n = 26; SoC, n = 17) did not enter LTE. Of the 43 patients who discontinued, 15 received q4w ustekinumab and discontinued because of lack of efficacy and/or disease relapse. Of the 323 patients who entered the LTE (T2T, n = 147; SoC, n = 176), 258 patients (T2T, n = 121; SoC, n = 141) completed 104 weeks of treatment (mRAS) (Supplementary Figure 2A). Dosing regimens up to Week 104 are depicted in Supplementary Figure 2B.
The baseline demographic and disease characteristics at the induction baseline for the RAS population were similar in the two treatment arms and have been reported previously. 12 For the mRAS population, baseline disease characteristics are presented in Supplementary Table 1. Baseline disease characteristics between the T2T and SoC arms in the mRAS population were generally similar to those of the RAS population.
Health‐related quality of life measurements and work productivity and activity impairment outcomes in the randomized analysis set population
Inflammatory Bowel Disease Questionnaire response and remission at Weeks 16 and 48
In the RAS population at Week 16, the percentages of patients in the T2T and SoC arms with IBDQ response were 71.7% and 75.1%, and those with remission were 49.3% and 57.5%, respectively. At Week 48, the percentages of patients in the T2T and SoC arms with IBDQ response were 58.4% and 67.0%, and percentages with remission were 45.2% and 53.4%, respectively (Figure 1a). The percentage of patients with IBDQ response and remission between the two treatment groups at Week 16 or Week 48 was not statistically significant. Improvements in IBDQ domain scores from baseline were observed at Weeks 16 and 48 for each of the IBDQ domains: bowel symptoms, systemic symptoms, emotional function and social function. These changes relative to the baseline between the T2T and SoC groups were not statistically significant (Figure 2). Improvements were observed in the IBDQ score in both treatment arms at Week 16 and were maintained until Week 48, but were not statistically significant between the treatment arms (Figure 3).
FIGURE 1.
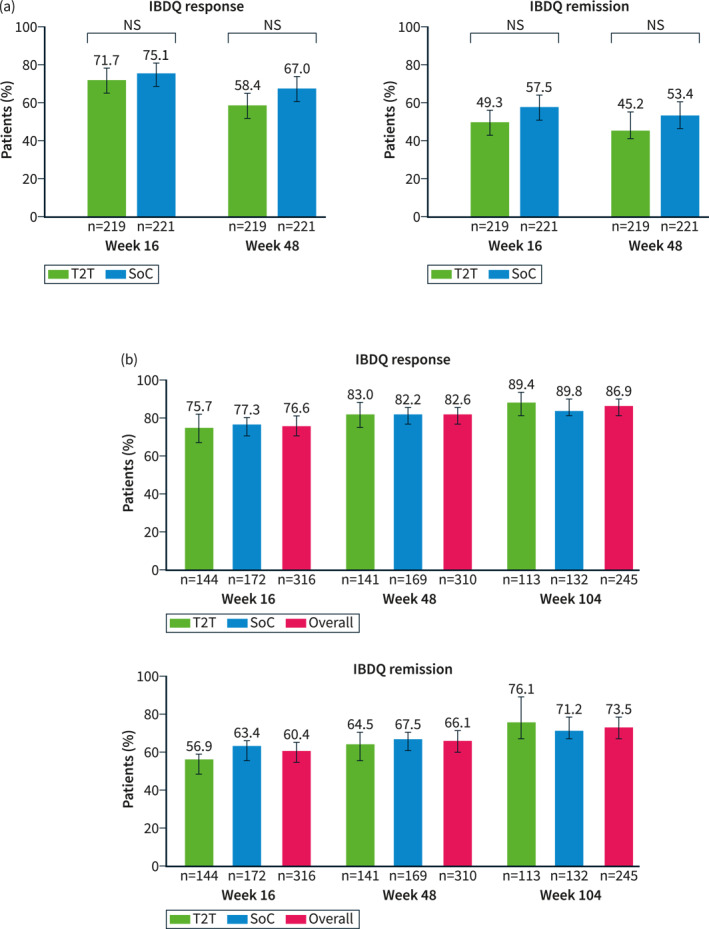
IBDQ response and remission at (a) Weeks 16 and 48 (RASa) and (b) Weeks 16, 48 and 104 (mRASb). Error bars represent 95% CI. IBDQ response: an increase in ≥16 points in IBDQ total scores from baseline; IBDQ remission: IBDQ score of ≥170. aThe RAS includes all patients who were randomized to either T2T or standard of care (SoC) at Week 16. Patients with missing IBDQ scores at respective visits were analysed as non‐responders. The p values (nominal) are based on the Cochran–Mantel–Haenszel test, 2‐sided α level of 0.05, stratified by baseline SES‐CD scores (≤16, >16) and prior exposure to biologics (none or 1). bThe mRAS includes all patients who entered the LTE period (from Week 48 to Week 104). Data shown are as observed. CI, confidence interval; IBDQ, Inflammatory Bowel Disease Questionnaire; LTE, long‐term extension; (m)RAS, (modified) randomized analysis set; NS, not significant; RAS, randomized analysis set; SES‐CD, Simple Endoscopic Score for Crohn's Disease; SoC, standard of care; T2T, treat to target.
FIGURE 2.
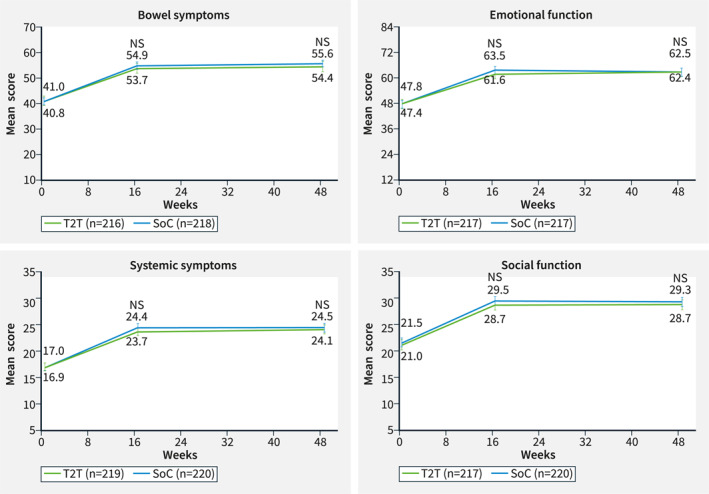
IBDQ domaina measurements at baseline and at Weeks 16 and 48 (RASb). Error bars represent 95% CI. aIBDQ domain measurements are composed of different numbers of items: bowel symptoms (10 items), emotional function (12 items), systemic symptoms (5 items), and social function (5 items). The response to each question is graded from 1 to 7. 13 bThe RAS includes all patients who were randomized to either T2T or standard of care (SoC) at Week 16. Missing data were imputed using the last observation carried forward. Nominal p‐values of intergroup comparison on changes versus baseline using ANCOVA test with baseline value and stratification factors SES‐CD score (≤16, >16) and prior exposure to biologics (none or 1) as covariates. ANCOVA, analysis of covariance; CI, confidence interval; IBDQ, Inflammatory Bowel Disease Questionnaire; NS, not significant; RAS, Randomized analysis set; SES‐CD, Simple Endoscopic Score for Crohn's Disease; SoC, standard of care; T2T, treat to target.
FIGURE 3.
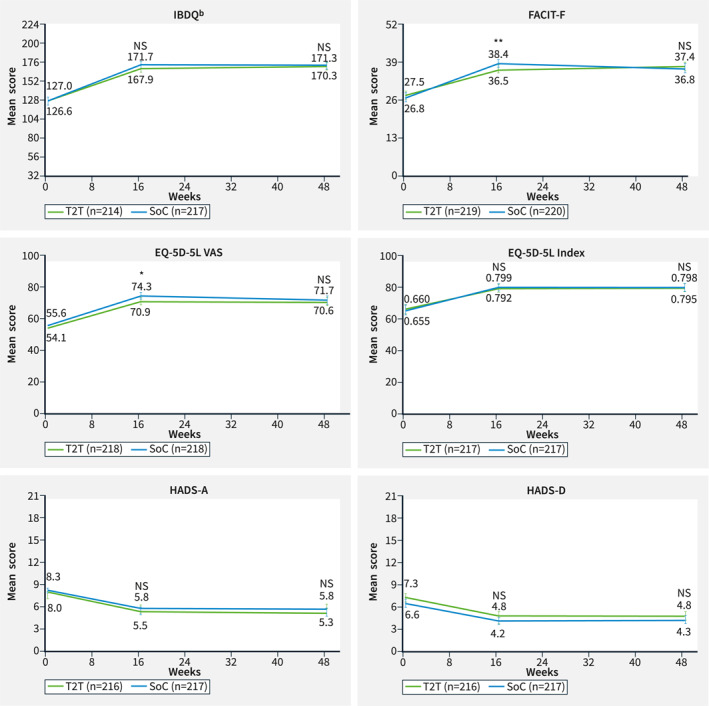
HRQoL measurements at baseline and Weeks 16 and 48 (RASa). *p value ≤ 0.05; **p value ≤ 0.01. Nominal p values of intergroup comparison on changes versus baseline using ANCOVA test with baseline value and stratification factors SES‐CD score (≤16, >16) and prior exposure to biologics (none or 1) as covariates. aThe RAS includes all patients who were randomized to either T2T or standard of care (SoC) at Week 16. Missing data were imputed using the last observation carried forward. Error bars represent 95% CI. Improvements are shown by an increase in IBDQ, FACIT‐F, EQ‐5D‐5L (VAS and index) and by a decrease in HADS‐A and ‐D scores. bIBDQ consists of 32 items graded on a seven‐point scale, in which 1 signifies worst function and 7 signifies best function. A higher score indicates a better quality of life. 13 ANCOVA, analysis of covariance; CI, confidence interval; EQ‐5D‐5L, EuroQoL 5‐Dimension 5‐Level Health Questionnaire; FACIT‐F, Functional Assessment of Chronic Illness Therapy‐Fatigue; HADS‐A (‐D); Hospital Anxiety and Depression Scale—Anxiety subscale (– Depression subscale); HRQoL, health‐related quality of life; IBDQ, Inflammatory Bowel Disease Questionnaire; NS, not significant; RAS, randomized analysis set; SES‐CD, Simple Endoscopic Score for Crohn's Disease; SoC, standard of care; T2T, treat to target; VAS, visual analogue scale.
General health‐related quality of life measurements at Week 16 and 48
In the RAS population, improvements from baseline were observed in all general HRQoL measurements (Figure 3). Improvements were observed in the T2T and SoC treatment arms at Week 16 for EQ‐5D‐5L Index and HADS‐A/HADS‐D. These improvements were maintained until Week 48; however, the improvements between arms were not statistically significant. Improvements at Week 16 in EQ‐5D‐5L VAS and FACIT‐F were slightly higher in SoC compared with T2T (p = 0.045 and p = 0.007, respectively), but those differences were no longer apparent at Week 48 (Figure 3).
Work productivity and activity impairment domains at Week 16 and 48
In the RAS population, non‐significant improvements from baseline at Weeks 16 and 48 in WPAI domains (absenteeism, presenteeism, work productivity loss and activity impairment) were observed in response to treatment with ustekinumab; these improvements were similar in the T2T and SoC treatment arms (Table 1). At Week 48, 62.7% and 72.3% of patients were in employment in the T2T and SoC arms, respectively (p = not significant [NS]), compared with 61.6% and 63.5%, respectively, at baseline. The proportions of patients with WPAI 7‐point improvements from baseline per domain between the treatment arms at Weeks 16 and 48 were not statistically significant (Supplementary Table 2).
TABLE 1.
Changes from baseline in work productivity and activity impairment (WPAI) domains at Weeks 16 and 48 (RAS a ).
| WPAI b at Week 16 | T2T | SoC | p value d | ||||
|---|---|---|---|---|---|---|---|
| Baseline c | Week 16 c | Change from baseline at Week 16 | Baseline c | Week 16 c | Change from baseline at Week 16 | ||
| Absenteeism | 21.8 (15.0; 28.7), n = 97 | 6.1 (2.2; 10.0), n = 86 | −12.9 (−19.6; −6.2), n = 86 | 21.0 (14.8; 27.2), n = 110 | 8.7 (4.0; 13.4), n = 96 | −12.5 (−18.8; −6.3), n = 96 | 0.8601 |
| Presenteeism | 44.1 (38.8; 49.3), n = 113 | 19.8 (15.7; 24.0), n = 105 | −23.3 (−28.7; −18.0), n = 105 | 47.4 (42.0; 52.9), n = 116 | 21.9 (17.1; 26.8), n = 104 | −26.2 (−32.0; −20.3), n = 104 | 0.8222 |
| Work productivity loss | 50.4 (44.0; 56.8), n = 90 | 22.6 (17.2; 28.0), n = 77 | −25.2 (−31.5; −18.9), n = 77 | 50.8 (44.6; 57.0), n = 96 | 25.3 (19.3; 31.4), n = 82 | −27.2 (−34.2; −20.2), n = 82 | 0.9504 |
| Activity impairment | 51.9 (48.4; 55.4), n = 212 | 27.2 (23.8; 30.5), n = 204 | −24.1 (−27.9; −20.4), n = 204 | 51.5 (48.0; 55.1), n = 215 | 24.3 (21.1; 27.4), n = 207 | −27.3 (−31.0; −23.7), n = 207 | 0.1334 |
| WPAI b at Week 48 | T2T | SoC | p value d | ||||
|---|---|---|---|---|---|---|---|
| Baseline c | Week 48 b | Change from baseline at Week 48 | Baseline b | Week 48 b | Change from baseline at Week 48 | ||
| Absenteeism | 21.8 (15.0; 28.7), n = 97 | 6.9 (1.7; 12.1), n = 60 | −13.9 (−22.7; −5.0), n = 60 | 21.0 (14.8; 27.2), n = 110 | 3.4 (0.5; 6.2), n = 77 | −14.8 (−21.6; −7.9), n = 77 | 0.6672 |
| Presenteeism | 44.1 (38.8; 49.3), n = 113 | 15.4 (10.6; 20.2), n = 78 | −30.0 (−37.2; −22.8), n = 78 | 47.4 (42.0; 52.9), n = 116 | 20.9 (15.9; 25.8), n = 92 | −26.0 (−32.0; −20.0), n = 92 | 0.2203 |
| Work productivity loss | 50.4 (44.0; 56.8), n = 90 | 18.4 (12.2; 24.5), n = 56 | −33.0 (−42.1; −23.9), n = 56 | 50.8 (44.6; 57.0), n = 96 | 20.8 (14.6; 27.0), n = 68 | −28.0 (−35.7; −20.4), n = 68 | 0.4149 |
| Activity impairment | 51.9 (48.4; 55.4), n = 212 | 22.5 (18.6; 26.4), n = 156 | −29.2 (−33.9; −24.5), n = 156 | 51.5 (48.0; 55.1), n = 215 | 25.3 (21.2; 29.3), n = 178 | −24.8 (−29.1; −20.5), n = 178 | 0.2116 |
Note: Only patients with a non‐missing baseline value and at least one non‐missing post‐baseline value during the main treatment period are included in the analysis. N at baseline and at Week 16 and Week 48 is the number of patients with a non‐missing value for the parameter at the specified time point. N for change from baseline is the number of patients with non‐missing values at both baseline and the post‐baseline time point. Data are mean (95%CI) unless otherwise indicated.
Abbreviations: ANCOVA, analysis of covariance; CI, confidence interval; RAS, randomized analysis set; SD, standard deviation; SES‐CD, Simple Endoscopic Score for Crohn Disease; SoC, standard of care; T2T, treat to target; WPAI, Work Productivity and Activity Impairment.
The RAS includes all patients who were randomized to either T2T or SoC at Week 16.
Data shown as observed.
Absolute value.
Nominal p value of intergroup comparison on changes versus baseline using ANCOVA test with baseline value and stratification factors SES‐CD score (≤16, >16) and prior exposure to biologics (none or 1) as covariates.
Time lost from work at Week 16 and 48
On average, patients in the T2T arm lost 1.7 and 1.8 days, and patients in the SoC arm lost 1.8 and 2.2 days compared with baseline (2.6 and 3.0 days), at Weeks 16 and 48, respectively (p = NS).
Health‐related quality of life measurements and work productivity and activity impairment outcomes in the mRAS population
Inflammatory Bowel Disease Questionnaire response and remission at Weeks 16, 48 and 104
In the mRAS population, IBDQ response and remission increased over time from Week 16 to Week 104. At Week 16, the percentage of patients on ustekinumab treatment in the overall population with IBDQ response was 76.6% (T2T, 75.7%; SoC, 77.3%) and percentage with remission was 60.4% (T2T, 56.9%; SoC, 63.4%). At Week 48, the percentage of patients in the overall population with IBDQ response was 82.6% (T2T, 83.0%; SoC, 82.2%) and the percentage with remission was 66.1% (T2T, 64.5%; SoC, 67.5%), respectively. At Week 104, the percentage of patients in the overall population with an IBDQ response was 86.9% (T2T, 89.4%; SoC, 84.8%) and percentages with remission was 73.5% (T2T, 76.1%; SoC, 71.2%) (Figure 1b). Patients in the T2T and SoC arms and overall population maintained increased IBDQ domain scores compared with baseline at Weeks 16, 48 and 104 (Figure 4, Supplementary Figure 3). In the mRAS population, IBDQ scores improved at Week 16 and were maintained until Week 104 (Figure 5).
FIGURE 4.
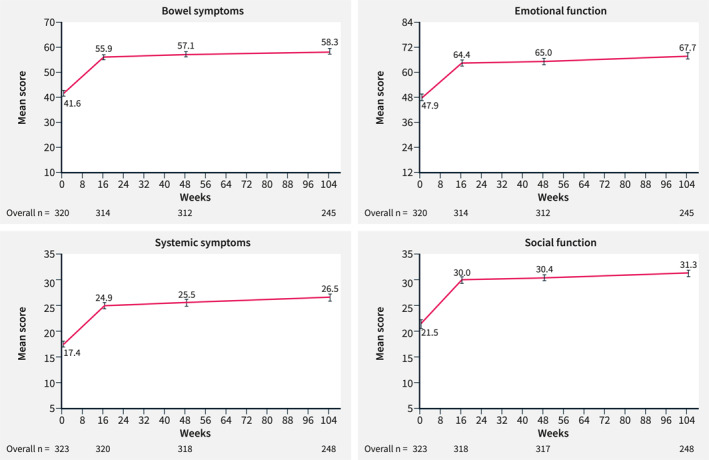
IBDQ domaina measurements at baseline and at Weeks 16, 48 and 104 in all patients (mRASb). Data shown are as observed. Error bars represent 95% CI. aIBDQ domain measurements are composed of different numbers of items: bowel symptoms (10 items), emotional function (12 items), systemic symptoms (5 items) and social function (5 items). Response to each question is graded from 1 to 7. 13 bThe mRAS includes all patients from the RAS population who entered the LTE period (from Week 48 to Week 104). CI, confidence interval; IBDQ, Inflammatory Bowel Disease Questionnaire; LTE, long‐term extension; (m)RAS, (modified) randomized analysis set.
FIGURE 5.
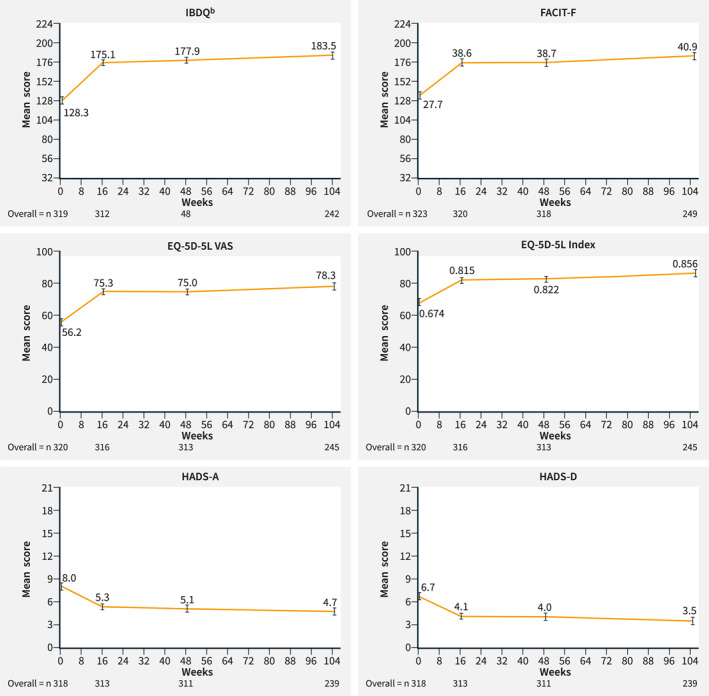
HRQoL measurements at baseline and Weeks 16, 48 and 104 in all patients (mRASa). aThe mRAS includes all patients from the RAS population who entered the LTE period (from Week 48 to Week 104). Data shown are as observed. Error bars represent 95% CI. Improvements are shown by an increase in ()IBDQ, FACIT‐F, EQ‐5D‐5L (VAS and index) and by a decrease in HADS‐A and ‐D scores. bIBDQ consists of 32 items graded on a seven‐point scale, in which 1 signifies worst function and 7 signifies best function. A higher score indicates a better quality of life. 13 CI, confidence interval; EQ‐5D‐5L, EuroQoL 5‐Dimension 5‐Level Health Questionnaire; FACIT‐F, Functional Assessment of Chronic Illness Therapy‐Fatigue; HADS‐A (‐D); Hospital Anxiety and Depression Scale—Anxiety subscale (– Depression subscale); HRQoL, health‐related quality of life; IBDQ, Inflammatory Bowel Disease Questionnaire; LTE, long‐term extension; mRAS, modified randomized analysis set; VAS, visual analogue scale.
General health‐related quality of life measurements at Weeks 16, 48 and 104
In the mRAS population, all general HRQoL measurements including EQ‐5D‐5L (VAS and index), FACIT‐F, HADS‐A and HADS‐D improved over time. Improvements were apparent as early as Week 16 and were maintained up to Week 48 and Week 104 (Figure 5, Supplementary Figure 4) in the T2T and SoC arms and overall population.
Work productivity and activity impairment domains at Weeks 16, 48 and 104
In the mRAS population, improvements from baseline at Weeks 16, 48 and 104 in the WPAI domains in all patients and in both treatment arms, were noted (Table 2 and Supplementary Table 3). At Week 104, 65.2% of all mRAS patients (T2T, 60.9%; SoC, 68.7%) were in employment versus 62.6% (T2T, 61.6%; SoC, 63.4%) at baseline. The WPAI 7‐point improvement from baseline in all domains was maintained in the overall population and in both treatment arms from Week 16 through Week 104 (Supplementary Table 4).
TABLE 2.
Changes from baseline in work productivity and activity impairment (WPAI) domains at Week 104 (mRAS a ).
| WPAI b | T2T | SoC | Overall | ||||||
|---|---|---|---|---|---|---|---|---|---|
| Baseline c | Week 104 c | Change from baseline | Baseline c | Week 104 c | Change from baseline | Baseline c | Week 104 c | Change from baseline | |
| Absenteeism |
23.1 (15.0; 31.2), n = 71 |
3.0 (−0.5; 6.4), n = 42 |
−15.5 (−26.0; −5.0), n = 42 |
19.6 (12.9; 26.3), n = 89 |
8.0 (2.5; 13.5), n = 51 |
−7.8 (−16.0; 0.5), n = 51 |
21.2 (16.0; 26.3), n = 160 |
5.7 (2.3; 9.1), n = 93 |
−11.2 (−17.7; −4.8), n = 93 |
| Presenteeism |
44.8 (38.5; 51.1), n = 81 |
12.1 (6.8; 17.4), n = 53 |
−28.7 (−37.6; −19.7), n = 53 |
47.6 (41.6; 53.6), n = 96 |
17.7 (11.9; 23.5), n = 60 |
−28.3 (−36.3; −20.3), n = 60 |
46.3 (42.0; 50.6), n = 177 |
15.0 (11.1; 19.0), n = 113 |
−28.5 (−34.4; −22.6), n = 113 |
| Work productivity loss |
54.4 (46.8; 62.0), n = 67 |
16.0 (8.9; 23.1), n = 41 |
−31.9 (−43.5; −20.4), n = 41 |
50.0 (43.0; 56.9), n = 79 |
19.7 (11.6; 27.7), n = 43 |
−25.6 (−36.3; −14.9), n = 43 |
52.0 (46.9; 57.1), n = 146 |
17.9 (12.6; 23.1), n = 84 |
−28.7 (−36.4; −21.0), n = 84 |
| Activity impairment |
51.1 (46.9; 55.4), n = 142 |
14.7 (10.6; 18.8), n = 110 |
−32.8 (−38.5; −27.2), n = 110 |
50.1 (46.0; 54.2), n = 171 |
19.1 (15.3; 22.9), n = 130 |
−30.1 (−35.1; −25.1), n = 130 |
50.5 (47.6; 53.5), n = 313 |
17.1 (14.3; 19.9), n = 240 |
−31.3 (−35.1; −27.6), n = 240 |
Note: Only patients with a non‐missing baseline value and at least one non‐missing post‐baseline value during the main treatment period are included in the analysis. N at baseline and at Week 104 is the number of patients with a non‐missing value for the parameter at the specified time point. N for change from baseline is the number of patients with non‐missing values at both baseline and the Week 104 time point. Data are mean (95% CI) unless otherwise indicated.
Abbreviations: CI, confidence interval; LTE, long‐term extension; mRAS, modified randomized analysis set; SoC, standard of care; T2T, treat to target; WPAI, Work Productivity and Activity Impairment.
The mRAS includes all patients who entered the LTE period (from Week 48 to Week 104).
Data shown as observed.
Absolute value.
Time lost from work at Weeks 16, 48 and 104
In total, patients, on average, lost 2.0, 1.9 and 2.3 (T2T, 1.9, 2.0 and 2.2; SoC, 2.0, 1.9 and 2.3) fewer days from work at Weeks 16, 48 and 104 compared with baseline, respectively.
DISCUSSION
Improving patients' HRQoL and work productivity are important treatment goals for patients with CD. STARDUST is the first ustekinumab efficacy study to use an algorithm‐driven dose adjustment in patients with CD, including de‐escalation. It has been previously reported that this T2T strategy with early endoscopy, regular biomarker and clinical symptom monitoring, and dose adjustment in the presence of persistent inflammatory activity did not result in significantly better endoscopic and other outcomes at Week 48 than the SoC maintenance strategy. 12 Following these results, in this analysis, we broadly observed no differences between the T2T and SoC groups with regard to HRQoL measurements and WPAI outcomes throughout the study. Improvements in PROs are expected to be driven by the overall efficacy of the treatment. As major differences in efficacy and safety between the T2T or SoC groups were not observed, it was not surprising to see no significant differences in HRQoL and WPAI measurements between the two groups. However, it is worth noting that patients in the T2T group were not adversely affected by the intensified treatment and close monitoring through 1 and 2 years of follow‐up.
In this study, patients were characterized by severe fatigue but otherwise mild‐to‐moderate HRQoL impairments at baseline. This could be attributed to patients in the RAS and mRAS population having moderately active disease and being in relatively early lines of treatment at baseline, despite a median disease duration of more than 5 years. Disease activity status has been linked with higher fatigue levels, previously. 19 In the RAS population, improvements were seen in FACIT‐F scores at Week 16 with ustekinumab treatment and these improvements were maintained until Week 48. Different biological therapies, including ustekinumab, have been shown to decrease fatigue in patients with IBD and our results support these findings. 20 With T2T and SoC treatment strategies, comparable improvements from baseline in all other HRQoL measurements were seen in patients with CD at Week 48 and the end of the LTE period. In a 1‐year study of ustekinumab versus adalimumab treatment in bio‐naïve CD patients (SEAVUE), patients treated with ustekinumab demonstrated improvement in IBDQ scores from baseline. 21 Other short‐term ustekinumab studies have demonstrated similar results. 22 , 23 , 24 Our results support these findings as we observed improvements in IBDQ individual domains and total scores over a period of 2 years. In the RAS population, improvements from baseline were also seen in EQ‐5D‐5L scores with ustekinumab treatment at Week 16 and were maintained until Week 48. Patients in the mRAS population showed improvements in EQ‐5D‐5L scores throughout 2‐year follow‐up compared with baseline. Our results support the findings from the PROSE study, a long‐term real‐world study, where ustekinumab treatment significantly improved EQ‐5D‐5L Index and EQ‐5D‐5L VAS values compared with baseline. 25
Previously, clinically meaningful improvements were seen in IBDQ response rates with ustekinumab treatment through Week 52 in the SEAVUE study and through Week 140 in the IM‐UNITI study in patients with moderate‐to‐severe CD. 21 , 26 Our results support these short‐ and long‐term findings.
This is the first study examining the impact of ustekinumab treatment on WPAI domains in CD patients. Although no significant differences were observed between the two treatment strategies, WPAI were improved with ustekinumab treatment at Weeks 16 and 48 and were maintained up to Week 104. We observed that the magnitude for improvement for the absenteeism subscale was lower than other WPAI domains. We can speculate that presenteeism is more common for patients with chronic diseases who may not take whole days off work (absenteeism), evidenced by the fact that baseline presenteeism was greater than absenteeism throughout this study; patients may be working with decreased productivity (presenteeism) rather than being absent from work due to economic or work factors and other pressures. 17 The decreased productivity may also be impacted by the trial protocol itself with physician appointments for monitoring and health checks, disrupting the patients' work schedule. Increased presenteeism compared to absenteeism has been previously reported in other IBD studies even in patients in clinical remission. 17 , 27 Although, patients in both treatment arms of the RAS and mRAS populations had high clinical remission rates, the employment rates in patients in both treatment arms up to Week 104 did not show improvement and remained relatively stable. 12 , 28 Interestingly, compared with their baseline scores, patients in the T2T and SoC groups lost a similar number of days from work throughout the 2‐year follow‐up period. However, it does not appear that this influenced employment status throughout the study. This suggests that complete loss of work productivity cannot be only represented by either absenteeism or presenteeism alone, given that both employment rates and days lost from work were relatively stable throughout the study. More studies examining the effect that ustekinumab treatment has on WPAI in patients with CD are still needed in the future.
The limitations of this study design have been described previously. 12 , 28 With regard to HRQoL measurements, owing to the exploratory nature of the LTE period, no statistical testing was performed between the T2T and SoC groups in the mRAS population and no additional subgroups were considered for further analysis. During the LTE treatment period, dose adjustments were performed based on set clinical, endoscopic and biomarker targets; thus, the correlation of clinical responders/non‐responders with HRQoL measures would be difficult to interpret.
In conclusion, there were no major differences between the T2T and SoC ustekinumab treatment regimens on HRQoL measurements and work productivity, as they both had substantial efficacy. This is in line with the previously reported clinical and endoscopic endpoints. 12 Both ustekinumab treatment strategies improved HRQoL (including fatigue, depression and anxiety scales) and work productivity in patients with moderate‐to‐severe CD throughout 2 years of follow‐up.
AUTHOR CONTRIBUTIONS
J. Panés, S. Vermeire, G.R. D’Haens, S. Danese, M. Nazar, M. Le Bars, M. Lahaye, L. Ni, I. Bravatà, L. Peyrin‐Biroulet and A. Dignass designed the study. J. Panés, S. Vermeire, G.R. D’Haens, S. Danese, F. Magro, D.R. Gaya, L. Peyrin‐Biroulet and A. Dignass were involved in data acquisition. M. Nazar and M. Lahaye verified the underlying data. All authors had full access to all the data in the study and accept responsibility for submission for publication. M. Lahaye analysed the data. All authors drafted the article or revised it critically for important intellectual content. All authors agreed to be accountable for all aspects of the work in ensuring that questions related to the accuracy or integrity of any part of the work are appropriately investigated and resolved.
CONFLICT OF INTEREST STATEMENT
J. Panés reports grants from AbbVie and Pfizer; consultancy fees/honoraria from AbbVie, Arena, Athos, Boehringer Ingelheim, Celgene, Genentech/Roche, GlaxoSmithKline, Janssen, Origo, Mirum, Morphic, Pandion, Pfizer, Progenity, Revolo Biotherapeutics, Takeda, Theravance and Wasserman; support for travel to meetings from AbbVie and Takeda, during the conduct of the study; payment for lectures including service on speaker bureaus from Abbott, Janssen, Pfizer and Takeda; and payment for development of educational presentations from Abbott, Janssen, Pfizer and Roche. S. Vermeire has received grants from AbbVie, J&J, Pfizer, Takeda and Galapagos; consulting and/or speaking fees from AbbVie, AbolerIS Pharma, AgomAb, Alimentiv, Arena Pharmaceuticals, AstraZeneca, Avaxia, BMS, Boehringer Ingelheim, Celgene, CVasThera, Cytoki Pharma, Dr Falk Pharma, Ferring, Galapagos, Genentech‐Roche, Gilead, GSK, Hospira, Imidomics, Janssen, J&J, Lilly, Materia Prima, MiroBio, Morphic, MrMHealth, Mundipharma, MSD, Pfizer, Prodigest, Progenity, Prometheus, Robarts Clinical Trials, Second Genome, Shire, Surrozen, Takeda, Theravance, Tillots Pharma AG, Zealand Pharma. G.R. D’Haens has served as advisor for AbbVie, Ablynx, Allergan, Alimentiv, Alpha Biomics, Amgen, Applied Molecular Therapeutics, Arena Pharmaceuticals, AstraZeneca, Bristol Myers Squibb, Boehringer Ingelheim, Celltrion, Dr Falk Pharma, Eli Lilly, Exeliom Biosciences, Ferring, Galapágos, Genentech/Roche, Gilead, GlaxoSmithKline, Gossamer Bio, Immunic, Johnson & Johnson, Kintai Therapeutics, Medtronics, Mitsubishi Pharma, MSD, Mundipharma, Pfizer, ProciseDx, Prodigest, Progenity, Prometheus Laboratories/Nestlé, Protagonist, RedHill, Samsung Bioepis, Sandoz, Seres, Setpoint, Takeda and Tillotts; and reports speaker fees from AbbVie, Biogen, Ferring, Johnson & Johnson, MSD, Mundipharma, Norgine, Pfizer, Samsung Bioepis, Shire, Millennium/Takeda, Tillotts and Vifor. S. Danese reports consultancy fees from AbbVie, Alimentiv, Allergan, Amgen, AstraZeneca, Athos Therapeutics, Biogen, Boehringer Ingelheim, Celgene, Celltrion, Dr Falk Pharma, Eli Lilly, Enthera, Ferring Pharmaceuticals Inc., Gilead, Hospira, Inotrem, Janssen, Johnson & Johnson, MSD, Mundipharma, Mylan, Pfizer, Roche, Sandoz, Sublimity Therapeutics, Takeda, TiGenix, UCB Inc. and Vifor; and lecture fees from AbbVie, Amgen, Ferring Pharmaceuticals Inc., Gilead, Janssen, Mylan, Pfizer and Takeda. F. Magro reports lecture fees from AbbVie, Falk, Ferring, Hospira, Lab Vitoria, MSD, OM Pharma, PharmaKern, Schering, Takeda and Vifor. M. Nazar is an employee of Janssen‐Cilag Polska Sp. z o.o and has restricted stocks. M. Le Bars was an employee of Janssen‐Cilag SARL and had restricted stocks. M. Lahaye is an employee of Janssen‐Cilag B.V. and has restricted stocks. L. Ni is an employee of Janssen‐Cilag Russia and has restricted stocks. I. Bravatà is an employee of Janssen‐Cilag S.p.A. and has restricted stocks. D.R. Gaya reports personal fees from AbbVie, Janssen and Takeda; and a travel grant from Vifor. L. Peyrin‐Biroulet reports personal fees from AbbVie, Alimentiv, Allergan, Amgen, Arena, Biogen, BMS, Celgene, Celltrion, Enthera, Ferring, Fresenius Kabi, Galapagos, Genentech, Gilead, Gossamer Bio, Index Pharmaceuticals, Inotrem, Janssen, Lilly, MSD, Mylan, Norgine, ONO Pharma, OSE Immunotherapeutics, Pandion Therapeutics, Pfizer, Roche, Samsung Bioepis, Sandoz, Takeda, Theravance, Thermo Fisher, Tillots, Viatris and Vifor; grants from AbbVie, Fresenius Kabi, MSD and Takeda; and stock options from CTMA. A. Dignass has received fees for participation in clinical trials and for review activities, such as data monitoring boards, statistical analysis and endpoint committees from Abivax, AbbVie, Arena, Celgene/Bristol Myers Squibb, Falk, Gilead, Janssen and Pfizer; consultancy fees from AbbVie, Amgen, Biogen, Boehringer‐Ingelheim, Celgene/Bristol Myers Squibb, Celltrion, Falk, Ferring, Fresenius Kabi, Galapagos, Gilead, Janssen, Lilly, MSD, Pfizer, Pharmacosmos, Roche/Genentech, Sandoz/Hexal, Takeda, Tillotts and Vifor; and payment for lectures including service on speaker bureaus from AbbVie, Amgen, Biogen, Celltrion, the Falk Foundation, Ferring, Gilead/Galapagos, Janssen, Lilly, MSD, Pharmacosmos, Pfizer, Takeda, Tillotts and Vifor.
ETHICS APPROVAL
This study complied with the ethical requirements specified by the Independent Ethics Committee/Institutional Review Board and by local regulations. Each participant signed a participation agreement/informed consent form in line with local regulations and trial sponsor policy before data collection.
Supporting information
Supplementary Information S1
ACKNOWLEDGEMENTS
Janssen‐Cilag Limited and the authors thank the patients who participated in STARDUST, and all study investigators and their research teams for their contributions. Under the direction of the authors and in accordance with Good Publication Practices, Pedro de Campos Silva, PhD, of Lumanity provided medical writing assistance. Janssen‐Cilag funded the study and participated in the study design, interpretation of data, review and approval of the publication. Medical writing and editorial support were provided by Lumanity, funded by Janssen.
Panés J, Vermeire S, D'Haens GR, Danese S, Magro F, Nazar M, et al. Ustekinumab improves health‐related quality of life in patients with moderate‐to‐severe Crohn's disease: Results up to Week 104 of the STARDUST trial. United European Gastroenterol J. 2023;11(5):410–22. 10.1002/ueg2.12384
Members of the STARDUST study group are listed in the supplementary information.
DATA AVAILABILITY STATEMENT
The data sharing policy of Janssen Pharmaceutical Companies of Johnson & Johnson is available at https://www.janssen.com/clinical‐trials/transparency. As noted on this site, requests for access to the study data can be submitted through the Yale Open Data Access Project site at http://yoda.yale.edu.
REFERENCES
- 1. Torres J, Mehandru S, Colombel JF, Peyrin‐Biroulet L. Crohn's disease. Lancet. 2017;389(10080):1741–55. 10.1016/s0140-6736(16)31711-1 [DOI] [PubMed] [Google Scholar]
- 2. Gomollon F, Dignass A, Annese V, Tilg H, Van Assche G, Lindsay JO, et al. European evidence‐based consensus on the diagnosis and management of Crohn's disease 2016: Part 1: diagnosis and medical management. J Crohns Colitis. 2017;11(1):3–25. 10.1093/ecco-jcc/jjw168 [DOI] [PubMed] [Google Scholar]
- 3. Colombel JF, Louis E, Peyrin‐Biroulet L, Sandborn WJ, Panaccione R. Deep remission: a new concept? Dig Dis. 2012;30(Suppl 3):107–11. 10.1159/000342732 [DOI] [PubMed] [Google Scholar]
- 4. van der Have M, van der Aalst KS, Kaptein AA, Leenders M, Siersema PD, Oldenburg B, et al. Determinants of health‐related quality of life in Crohn's disease: a systematic review and meta‐analysis. J Crohns Colitis. 2014;8(2):93–106. 10.1016/j.crohns.2013.04.007 [DOI] [PubMed] [Google Scholar]
- 5. Navabi S, Gorrepati VS, Yadav S, Chintanaboina J, Maher S, Demuth P, et al. Influences and impact of anxiety and depression in the setting of inflammatory bowel disease. Inflamm Bowel Dis. 2018;24(11):2303–8. 10.1093/ibd/izy143 [DOI] [PubMed] [Google Scholar]
- 6. Dur M, Sadlonova M, Haider S, Binder A, Stoffer M, Coenen M, et al. Health determining concepts important to people with Crohn's disease and their coverage by patient‐reported outcomes of health and wellbeing. J Crohns Colitis. 2014;8(1):45–55. 10.1016/j.crohns.2012.12.014 [DOI] [PMC free article] [PubMed] [Google Scholar]
- 7. Fu H, Kaminga AC, Peng Y, Feng T, Wang T, Wu X, et al. Associations between disease activity, social support and health‐related quality of life in patients with inflammatory bowel diseases: the mediating role of psychological symptoms. BMC Gastroenterol. 2020;20(1):11. 10.1186/s12876-020-1166-y [DOI] [PMC free article] [PubMed] [Google Scholar]
- 8. Parra RS, Chebli JM, Amarante HM, Flores C, Parente JM, Ramos O, et al. Quality of life, work productivity impairment and healthcare resources in inflammatory bowel diseases in Brazil. World J Gastroenterol. 2019;25(38):5862–82. 10.3748/wjg.v25.i38.5862 [DOI] [PMC free article] [PubMed] [Google Scholar]
- 9. Williet N, Sandborn WJ, Peyrin‐Biroulet L. Patient‐reported outcomes as primary end points in clinical trials of inflammatory bowel disease. Clin Gastroenterol Hepatol. 2014;12(8):1246–56.e6. 10.1016/j.cgh.2014.02.016 [DOI] [PubMed] [Google Scholar]
- 10. Calvino‐Suarez C, Ferreiro‐Iglesias R, Baston‐Rey I, Barreiro‐de Acosta M. Role of quality of life as endpoint for inflammatory bowel disease treatment. Int J Environ Res Public Health. 2021;18(13):7159. 10.3390/ijerph18137159 [DOI] [PMC free article] [PubMed] [Google Scholar]
- 11. Turner D, Ricciuto A, Lewis A, D’Amico F, Dhaliwal J, Griffiths AM, et al. STRIDE‐II: an update on the selecting therapeutic targets in inflammatory bowel disease (STRIDE) initiative of the international organization for the study of IBD (IOIBD): determining therapeutic goals for treat‐to‐target strategies in IBD. Gastroenterology. 2021;160(5):1570–83. 10.1053/j.gastro.2020.12.031 [DOI] [PubMed] [Google Scholar]
- 12. Danese S, Vermeire S, D'Haens G, Panés J, Dignass A, Magro F, et al. Treat to target versus standard of care for patients with Crohn's disease treated with ustekinumab (STARDUST): an open‐label, multicentre, randomised phase 3b trial. Lancet Gastroenterol Hepatol. 2022;7(4):294–306. [DOI] [PubMed] [Google Scholar]
- 13. Guyatt G, Mitchell A, Irvine E, Singer J, Williams N, Goodacre R, et al. A new measure of health status for clinical trials in inflammatory bowel disease. Gastroenterology. 1989;96(3):804–10. 10.1016/0016-5085(89)90905-0 [DOI] [PubMed] [Google Scholar]
- 14. Rencz F, Lakatos PL, Gulacsi L, Brodszky V, Kurti Z, Lovas S, et al. Validity of the EQ‐5D‐5L and EQ‐5D‐3L in patients with Crohn’s disease. Qual Life Res. 2019;28(1):141–52. 10.1007/s11136-018-2003-4 [DOI] [PubMed] [Google Scholar]
- 15. Webster K, Cella D, Yost K. The functional assessment of chronic illness therapy (FACIT) measurement system: properties, applications, and interpretation. Health Qual Life Outcome. 2003;1:79. 10.1186/1477-7525-1-79 [DOI] [PMC free article] [PubMed] [Google Scholar]
- 16. Snaith RP. The hospital anxiety and depression scale. Health Qual Life Outcome. 2003;1:29. 10.1186/1477-7525-1-29 [DOI] [PMC free article] [PubMed] [Google Scholar]
- 17. Reilly MC, Gerlier L, Brabant Y, Brown M. Validity, reliability, and responsiveness of the work productivity and activity impairment questionnaire in Crohn's disease. Clin Ther. 2008;30(2):393–404. 10.1016/j.clinthera.2008.02.016 [DOI] [PubMed] [Google Scholar]
- 18. Reilly MC, Zbrozek AS, Dukes EM. The validity and reproducibility of a work productivity and activity impairment instrument. Pharmacoeconomics. 1993;4(5):353–65. 10.2165/00019053-199304050-00006 [DOI] [PubMed] [Google Scholar]
- 19. Aluzaite K, Al‐Mandhari R, Osborne H, Ho C, Williams M, Sullivan MM, et al. Detailed multi‐dimensional assessment of fatigue in inflammatory bowel disease. Inflamm Intest Dis. 2019;3(4):192–201. 10.1159/000496054 [DOI] [PMC free article] [PubMed] [Google Scholar]
- 20. Borren NZ, Tan W, Colizzo FP, Luther J, Garber JJ, Khalili H, et al. Longitudinal trajectory of fatigue with initiation of biologic therapy in inflammatory bowel diseases: a prospective Cohort study. J Crohn's Colitis. 2020;14(3):309–15. 10.1093/ecco-jcc/jjz148 [DOI] [PubMed] [Google Scholar]
- 21. Loftus EV, Danese S, Panaccione R, Hoops T, Izanec JL, Ma T, et al. S770 health‐related quality of life with ustekinumab vs adalimumab for induction and maintenance therapy in biologic‐naïve patients with moderate‐to‐severe Crohn’s disease: IBDQ in the SEAVUE study. Official J Am Coll Gastroenterol. 2021;116(1):S355–7. 10.14309/01.ajg.0000776612.28121.af [DOI] [Google Scholar]
- 22. Marques‐Cami M, Robles Alonso V, Borruel N, Herrera de Guise C, Mayorga L, Casellas F. Normalization of long‐term quality of life in Crohn's disease patients receiving ustekinumab. Rev Esp Enferm Dig. 2021;113(5):313–17. [DOI] [PubMed] [Google Scholar]
- 23. Sands BE, Han C, Gasink C, Jacobstein D, Szapary P, Gao LL, et al. The effects of ustekinumab on health‐related quality of life in patients with moderate to severe Crohn's disease. J Crohns Colitis. 2018;12(8):883–95. 10.1093/ecco-jcc/jjy055 [DOI] [PubMed] [Google Scholar]
- 24. Cao Q, Chen C, Gao X, Chen Y, Hu N, Liang J, et al. Real‐world short‐term effectiveness of ustekinumab in Crohn’s disease: results from a multicenter, prospective study in China. Inflamm Bowel Dis. 2022;28(Suppl_2):S42–4. 10.1093/ibd/izac078 [DOI] [PubMed] [Google Scholar]
- 25. Forss A, Clements M, Myrelid P, Strid H, Soderman C, Wagner A, et al. Ustekinumab is associated with real‐world long‐term effectiveness and improved health‐related quality of life in Crohn's disease. Dig Dis Sci. 2022;68(1):65–76. (Epub ahead of print). 10.1007/s10620-022-07501-z [DOI] [PMC free article] [PubMed] [Google Scholar]
- 26. Sands BE, Han C, Gasink C, Bin Z, Stephen T, Sandborn WJ, et al. 690 ustekinumab maintained clinically meaningful improvement in health‐related quality of life in patients with moderate to severe Crohn's disease: results from the IM‐UNITI long‐term extension. Official J Am Coll Gastroenterol. 2019;114(1):S404. 10.14309/01.ajg.0000592296.98724.38 [DOI] [Google Scholar]
- 27. Zand A, van Deen WK, Inserra EK, Hall L, Kane E, Centeno A, et al. Presenteeism in inflammatory bowel diseases: a hidden problem with significant economic impact. Inflamm Bowel Dis. 2015;21(7):1623–30. 10.1097/mib.0000000000000399 [DOI] [PubMed] [Google Scholar]
- 28. Peyrin‐Biroulet L. Clinical and endoscopic outcomes with ustekinumab in patients with Crohn's disease: results from the long‐term extension period of STARDUST. Manuscript in progress. [DOI] [PubMed]
Associated Data
This section collects any data citations, data availability statements, or supplementary materials included in this article.
Supplementary Materials
Supplementary Information S1
Data Availability Statement
The data sharing policy of Janssen Pharmaceutical Companies of Johnson & Johnson is available at https://www.janssen.com/clinical‐trials/transparency. As noted on this site, requests for access to the study data can be submitted through the Yale Open Data Access Project site at http://yoda.yale.edu.