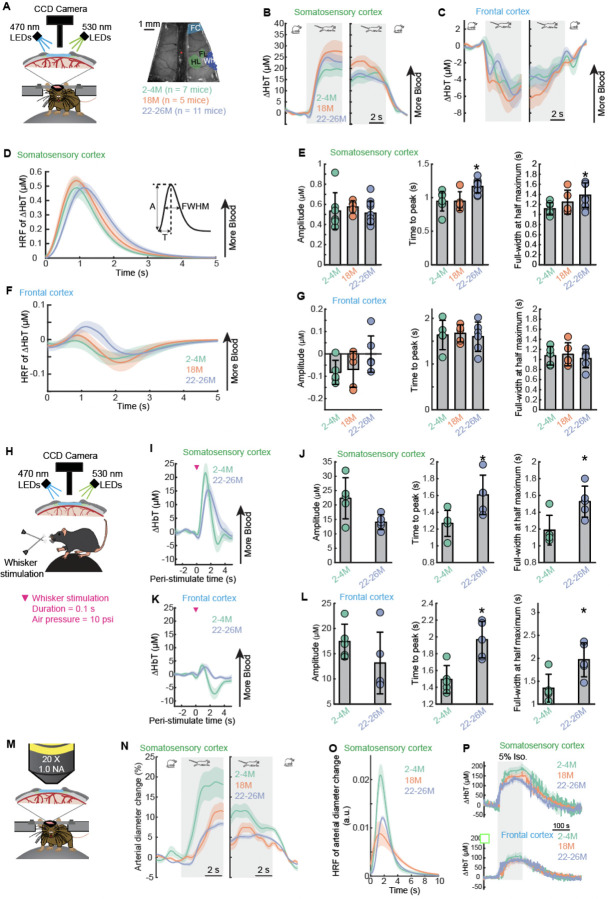
Figure 6. Delayed cortical hemodynamic responses to voluntary locomotion and whisker stimulation is delayed in normal aging.
(A) Left, schematic of the experimental setup for IOS imaging during voluntary locomotion. Right, an image of thin-skull window and corresponding anatomical reconstruction; scale bar = 1 mm. FC, frontal cortex; FL/HL, forelimb/hindlimb representation of the somatosensory cortex; Wh, vibrissae cortex. (B) Population average of locomotion onset (left) and offset (right) triggered average of ∆HbT responses in FL/HL across different age groups. (C) As in (B) but for FC. (D) Hemodynamic response function (HRF) of ∆HbT in the FL/HL across different age groups. (E) Quantification of HRF of ∆HbT in the FL/HL: amplitude (A, left), time to peak (T, middle), and full-width at half maximum (FWHM, right). (F) As in (D) but for FC. (G) As in (E) but for FC. (H) Schematic of the experimental setup for IOS imaging during whisker stimulation. (I) Average population responses of ∆HbT to contralateral whisker stimulation in the FL/HL across different age groups. (J) Quantification of the whisker stimulation evoked responses of ∆HbT in the FL/HL: amplitude (left), time to peak (middle), and full-width at half maximum (right). (K) As in (I) but for FC. (L) As in (J) but for FC. (M) Schematic of the experimental setup for 2PLSM imaging during locomotion. (N) Population average of locomotion onset (left) and offset (right) triggered average of arteriole diameter responses in FL/HL across different age groups. (O) Hemodynamic response function (HRF) of arteriole diameter changes in the FL/HL across different age groups. (P) Population average of ∆HbT responses to inhalation of 5% isoflurane in the FL/HL (top) and FC (bottom) across different age groups. Solid lines and shaded areas in (B, C, D, F, I, K, N, O, P) denote mean ± SEM, respectively. Data are shown as mean ± SD in all other graphs.

