Abstract
Purpose
High-frequency ultrasound elastography offers a tool to resolve the complex and heterogeneous deformation through the full thickness of the optic nerve head (ONH) and peripapillary sclera (PPS). Using this tool, we quantified the three-dimensional deformation of the ONH and PPS in human donor eyes and evaluated age-associated changes.
Methods
The ONH and PPS in 15 human donor globes were imaged with a 50-MHz ultrasound probe while increasing intraocular pressure (IOP) from 15 to 30 mm Hg. Tissue displacements were obtained using correlation-based ultrasound speckle tracking. Three-dimensional spherical strains (radial, circumferential, meridional, and respective shear strains) were calculated for the ONH and PPS volumes segmented from three-dimensional ultrasound images. Age-related trends of different strains in each region of interest were explored.
Results
The dominant form of IOP-induced deformation in the ONH and PPS was radial compression. High-magnitude localized out-of-plane shear strains were also observed in both regions. Most strains were concentrated in the anterior one-half of the ONH and PPS. The magnitude of radial and volumetric strains increased with age in the anterior ONH and anterior PPS, indicating greater radial compression and volume loss during IOP elevation in older age.
Conclusions
The age-associated increase of radial compression, the predominant form of IOP-induced deformation in anterior ONH and PPS, may underlie age-associated glaucoma risk. High-frequency ultrasound elastography offers a useful tool to quantify all types of deformation comprehensively in all regions of ONH and PPS, which may improve our understanding of the biomechanical factors contributing to glaucoma risk.
Keywords: high-frequency ultrasound, elastography, optic nerve head, peripapillary sclera, age
Glaucoma is a leading cause of irreversible blindness worldwide.1 It is a progressive optic neuropathy characterized by optic disc excavation and loss of retinal ganglion cell axons that transmit visual information from the eye to the brain. Clinical and experimental evidence suggests that the optic nerve head (ONH) is the primary site of injury in glaucoma.2 Elevated IOP is a well-documented glaucoma risk factor, and IOP-induced mechanical stresses and strains likely underlie the initial and ongoing insults at the ONH leading to progressive neural and connective tissue damage.3,4 However, factors influencing the biomechanical impact of the IOP on the ONH and mechanistic details of how these factors contribute to glaucoma risk remain poorly understood. Answers to these questions may lead to potential new diagnostics to better predict glaucoma progression and new therapeutic targets beyond lowering the IOP.5,6
Biomechanically, the ONH is a discontinuity in the collagenous sclera shell. There is a large contrast in tissue composition and properties between the ONH and the surrounding peripapillary sclera (PPS). The PPS is primarily composed of type I collagen and serves as the load-bearing tissue to resist the hoop stress created by IOP. The ONH is primary consisted of retinal ganglion cell axons supported by a collagenous lamina cribrosa (LC) and has a complex anatomy despite its small size. Material properties vary through the ONH thickness as the neurovascular tissue in the prelaminar region transitions to a combination of neural and connective tissues in the laminar region. Within the LC, there are sectorial differences in microstructure and properties.7 The heterogeneity in tissue structure and properties within and around the ONH predicts spatial variations of regional biomechanical responses to an elevated IOP. It is, thus, necessary to resolve the complex biomechanical interactions and responses through tissue thickness and across regions to better understand the biomechanical factors underlying glaucomatous damage.
Beside IOP, age is another established major risk factor for glaucoma. Glaucoma incidence increases significantly after the first six decades of life,8–10 and age is associated with many changes, including increased collagen cross-linking in connective tissue such as the PPS and LC. Previous studies have suggested PPS and LC stiffening in the in-plane direction (decreased in-plane tensile strains),11,12 possibly attributable to the age-associated increase in collagen cross-linking. However, whether such stiffening directly contributes to glaucoma risk remains unclear. ONH deformation responses are complex and vary regionally. The influences of PPS stiffening on ONH deformation have not been characterized. In addition, PPS is strongly anisotropic, and its age-associated changes may be different in different directions (i.e., in plane vs through thickness). A comprehensive quantification of all types of deformations in all directions throughout the tissue volume of ONH and PPS is needed to better understand how age-associated changes may underlie an increased glaucoma risk.
Various methods have been used to characterize ONH and PPS deformation, including histomorphometry,13 micro-computed tomography,14 electron speckle pattern interferometry,15 second harmonic generation imaging,16 digital image correlation,17 and in vivo optic coherence tomography.18–21 Our laboratory has developed a high-frequency ultrasound elastography method to quantify the deformation of ocular tissues such as the sclera,22,23 the cornea24–26 and the ONH.27–30 The main advantage of this technique is that it can simultaneously image through the thickness of PPS and ONH in intact whole globes, with an excellent spatial resolution and displacement sensitivity. It does not require tissue fixation and has a quick acquisition speed to obtain data in a range of pressure levels from the same eye. We have expanded the methodology from two-dimensional (2D) to three-dimensional (3D), which maps the 3D displacement field of tissue volumes and quantifies all six components of the strain tensor for a fine grid of imaged spatial points.31–33 We use a 50-MHz linear array transducer that provides an axial resolution of 35 microns and lateral resolution of 75 microns, and a penetration depth over 1 mm. Furthermore, the displacement sensitivity approaches 10s of nanometers owing to the advantage of radiofrequency (RF) analysis and interpolation.34 This technique thus offers a high-resolution tool with adequate penetration to fully characterize the complex 3D biomechanical responses of the ONH and PPS to IOP in the human globe.
In this study, we used this high-frequency ultrasound elastography technique to quantify and evaluate the mechanical responses of the ONH and PPS in human donor globes. We segmented the ONH and PPS using the high-resolution ultrasound images and analyzed the regional displacements and strains. With the comprehensive 3D characterization of the deformation response, we evaluated age-associated changes in different types of strains (tensile, compression, and shear) through the thickness of the ONH/PPS complex. This study was our first attempt to use the 3D high-frequency ultrasound elastography to characterize the biomechanical interactions and responses in human ONH and PPS. Our long-term goal is to obtain an in-depth understanding of the biomechanical drivers and mechanisms in glaucoma toward the development of new diagnostics and therapeutics for more effective management of this disease.
Methods
Donor Globe Preparation and Inflation Testing
Fifteen human donor globes without documented ocular diseases or surgeries were obtained from the Lion's Eye Bank of West Central Ohio (Dayton, OH, USA) in accordance with the Declaration of Helsinki. All globes were recovered within 12 hours postmortem and were tested within 36 hours postmortem. Prior to experimental use, the globes were stored in a moist container at 4°C.
Extraocular tissue was removed, and the optic nerve was trimmed to approximately 1 to 2 mm from the surface of the sclera. Ultrasound imaging was performed from the posterior side. Donor globes were secured to a custom-built holder with two spinal needles and immersed in PBS with the ONH facing up (Fig. 1A). Two 20G needles were inserted into the anterior chamber of the eye, one connected to a programmable syringe pump (PhD Ultra; Harvard Apparatus, Holliston, MA, USA) to control the IOP, and the other connected to a pressure sensor (P75; Harvard Apparatus) to continuously record and monitor the IOP.
Figure 1.
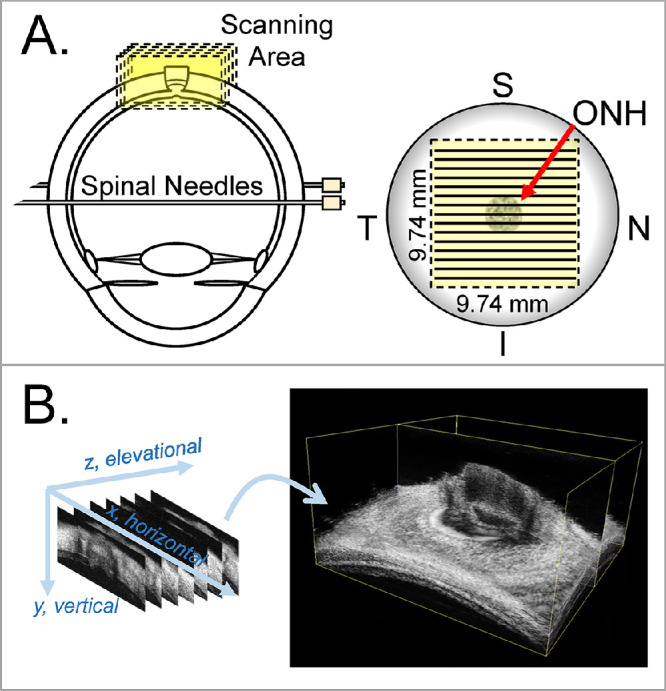
Experimental setup for inflation testing and 3D ultrasound scanning of human donor eyes. The globes were secured to a holder using two spinal needles during inflation. (A) 3D ultrasound scans were centered at the ONH. (B) Consecutive B-mode scans were used to build the 3D volume of the ONH and PPS. I, inferior; N, nasal; S, superior; T, temporal.
For the inflation testing, globes were first preconditioned with 20 pressure cycles from 15 to 30 mm Hg at 2 seconds per cycle and left to equilibrate at 15 mm Hg for 30 minutes. The inflation tests were then performed by increasing IOP from a baseline of 15 mm Hg to 17, 19, 22, 25, and 30 mm Hg with a 10-minute equilibration period between each step. At each IOP level, a 3D ultrasound scan was acquired by using a Vevo 2100 ultrasound imaging system (MS700, FujiFilm VisualSonics, Inc., Toronto, Ontario, Canada). A 50-MHz ultrasound probe was immersed in the PBS and placed above the globe and centered over the ONH. The probe was positioned in a way that the 2D B-mode scans were either in the nasal–temporal direction or inferior–superior direction (randomized for each eye). A customized LabView program (National Instruments, Austin, TX, USA) was designed to automate a linear motor to move the ultrasound probe perpendicular to the 2D imaging plane with a step size of 32 µm. RF data encoding the 2D B-mode scans of a 9.74 mm × 5 mm field of view was acquired at each step. A 3D volume of 9.74 mm × 9.74 mm × 5 mm was collated from the 307 consecutive 2D frames (Fig. 1B). Each automated 3D scan required 40 seconds to complete. The scanning pixel density is 1.5 µm in the axial direction (i.e., the direction of sound propagation, y), 19 µm in the lateral direction (i.e., the direction perpendicular to the sound propagation within the B-mode frame, x), and 32 µm in the elevational direction (i.e., the direction perpendicular to the B-mode frame, z).
Three-Dimensional Strain Mapping
A correlation-based 3D speckle tracking algorithm was used to compute tissue displacements, and the Green strain tensor in the Cartesian coordinate was calculated using 3D least-squares estimation.33 Strains in the spherical ordinate including three normal strains (radial, circumferential, and meridional) and three corresponding shear strains were obtained by coordinate transformation.31 Specifically, speckle tracking was performed at the level of the RF data, which are digitized voltage values corresponding to the amplitude of the received ultrasound signal. A region of interest (ROI) was defined within the scanned volume at the baseline IOP by fitting two concentric spheres that matched approximately the anterior and posterior surfaces of the PPS. Note that the retina was identified based on the lower intensity of this tissue in the ultrasound images and was excluded from the ROI. Within the ROI, the RF data were divided into rectangular kernels, each containing 51 (axial) × 31 (lateral) × 31 (elevational) voxels, or approximately 75 µm × 570 µm × 960 µm in size. The rectangular kernels were overlapped by 50% to improve the spatial resolution of the strain image.22 Our previous studies showed that this kernel size achieves the best combination of accuracy and signal-to-noise ratio for strain estimation in all directions.33 In total, there were approximately 23,000 kernels on average within the ROI of each eye, depending on the scleral thickness. To compute the displacements of each kernel, a normalized cross-correlation coefficient was computed to evaluate the similarity of speckle patterns between the reference kernels against the deformed kernels within a designated search window at successive IOPs. To track displacement between consecutive pressure steps, the kernel center corresponding with the maximum correlation coefficient was selected as the new location of the reference kernel in the deformed state. In addition, spline interpolation was used to achieve subvoxel resolution in displacement tracking. We have validated the accuracy of the calculated displacements based on 3D speckle tracking of the RF data previously. Using sclera-like digital phantoms with known displacements and strains, we generated synthetic RF data simulating ultrasound scans of anisotropic voxels (smaller in the axial direction) according to the experimental setup. Our results showed that axial direction had better accuracy (<0.05% error) than the other two directions, which is a well-known phenomenon in ultrasound elastography owing to the higher spatial resolution and denser sampling rate in the axial direction. The performance in the lateral and elevational directions were also good, showing a less than 0.2% error for tracking whole-pixel displacements or less than 1.2% for tracking subpixel displacements.33
The three orthogonal scanning axes, lateral (x), axial (y), and elevational (z), form a Cartesian coordinate system. Our 3D speckle tracking algorithm first computed the displacement vectors in this Cartesian coordinate with components denoted as Ui (i = x, y, z). The Green strain tensor in the Cartesian coordinate Ecar with components denoted as εij (i = x, y, z; j = x, y, z) were calculated as35:
| (1) |
| (2) |
where the displacement gradients (∂Ui/∂j) were obtained by a 3D least-squares method.31,36 Similarly, components of the Green strain tensor εyy, εzz, εxz, and εyz were calculated. The three principal strains were derived from the eigenvalues of the Green strain tensor and sorted in decreasing order with the first principal strain, ε1, being the largest positive strain. Using the principal strain components, the volume ratio (VR) was calculated as follows:
| (3) |
The 3D volumetric strain was calculated as follows:
| (4) |
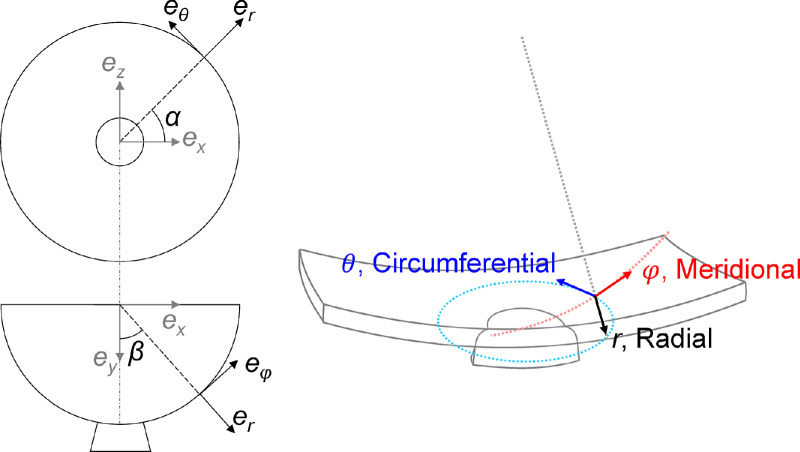
The center of the two fitted concentric spheres matching the anterior and posterior surfaces of the PPS was used at the origin of the spherical coordinate system with three orthogonal axes of radial (r), meridional (φ), and circumferential (θ). The conversion from the Cartesian strain tensor to the spherical strain tensor Esph was done via a transformation matrix [Esph] = [T][Ecar][TT].31,35 The transformation matrix is given by:
| (5) |
where α is the azimuth angle (in the θ direction) and β is the elevational angle (in the φ direction). The spherical coordinate system better represents the curved anatomy of the posterior eye and is more relevant to the interpretation of the deformation of ONH and surrounding PPS. Color maps were generated to visualize the 3D spatial distribution of the tissue strains including three normal strains, that is, radial εrr, meridional εφφ, and circumferential εθθ, and three shear strains, that is, εφr, εθr, and εθφ, as shown in Figure 2. We have previously validated the accuracy of coordinate transform using strain outputs from a finite element model simulating the posterior eye. Our results showed negligible errors (<10−11) between our coordinate transform calculations and model output.31
Figure 2.
Illustration of the base vectors ei (i = r, θ, φ) in the 3D spherical coordinate system for the scanned ONH and PPS volume.
Morphometric and Regional Deformation Analysis
The 3D scans obtained at the baseline IOP (i.e., 15 mm Hg) were used for segmentation and morphometric analyses. ONH and PPS were segmented manually in each scanned B-mode images, which were combined to form the segmented 3D volume for each eye. The segmented 3D volume within the fitted boundaries were used for analysis (Fig. 3). Four observers were asked to segment three volumes independently to evaluate the interobserver repeatability. The regional strains in ONH and PPS were calculated and compared, which showed excellent interobserver repeatability (Cronbach's alpha > 0.99). For each volume, the boundaries of the anterior Bruch's membrane opening (BMO) and the posterior scleral canal opening (PSCO) were also marked manually in each B-mode frame whenever the features were visible. The resulting set of marks for BMO or PSCO were fitted to circles to estimate the area and radii for both features.
Figure 3.
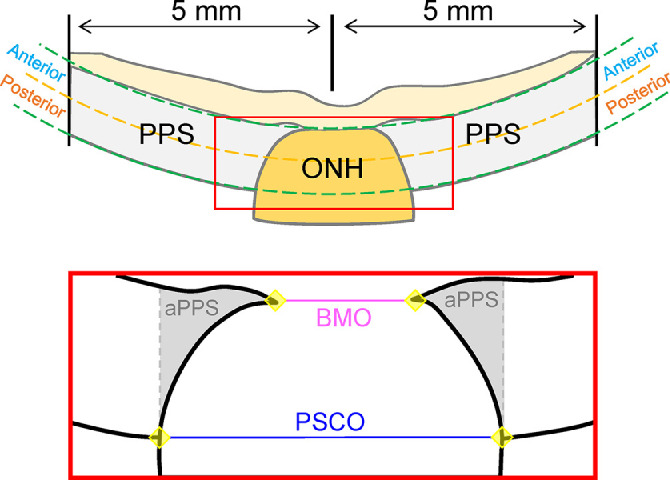
Ultrasound B-mode images were used to segment the 3D volume into PPS and ONH regions. Bruch's membrane opening (BMO) and posterior scleral canal opening (PSCO) were also delineated in ultrasound B-mode images for morphometric analysis. Points in the anterior and posterior PPS surface were used to fit two spheres that bound the regions of interest in the thickness direction. A subregion of the PPS adjacent to the ONH (adjacent PPS [aPPS]) was identified as the PPS from the PSCO line on either side.
The PPS and ONH were further divided into two equal-thickness anterior and posterior layers for evaluating depth-dependent changes. Additionally, a ring of scleral tissue immediately adjacent to the ONH up to the PSCO line was defined as the adjacent PPS (aPPS) region (Fig. 3). The mean and standard deviation for all kernels in each region were calculated at different IOP levels for each strain (εrr, εφφ, εθθ, εφr, εθr, and εθφ). For shear strains, the magnitude of the strain was used. For each strain at each tested IOP level, the differences between ONH and PPS and the difference between anterior and posterior layers of ONH/PPS were evaluated using paired t tests. The correlation of age with different regional strains was evaluated using Pearson correlation. A P value of 0.05 or less was considered statistically significant. All data analysis was conducted using SAS software (V9.4; SAS Institute Inc., Cary, NC, USA).
Results
Donors and Morphometric Data
Fifteen globes from 12 human donors were included in this study. Donor demographic information is provided in Table 1. The age of the donors ranged from 20 to 78 years old. At least 2 eyes from 1 or 2 donors were included in each decade of 20 to 30, 30 to 40, 50 to 60, 60 to 70, and 70 to 80. One eye was in the age range of 40 to 50 years. Morphometric parameters of these donor eyes based on high-resolution ultrasound images are summarized in Table 2.
Table 1.
Demographic Information of 12 Donors Used in This Study
| Donor | Age (Years) | Sex | Race | Eye | Scan Direction |
|---|---|---|---|---|---|
| 1 | 78 | Male | C | OD | NT |
| 2 | 58 | Male | C | OS | SI |
| 3 | 75 | Male | C | OD | NT |
| 4 | 55 | Male | C | OS | NT |
| 5 | 67 | Female | AA | OD, OS | NT, NT |
| 6 | 35 | Female | C | OD, OS | SI, SI |
| 7 | 24 | Female | C | OS | NT |
| 8 | 49 | Female | C | OS | SI |
| 9 | 59 | Female | C | OD | SI |
| 10 | 20 | Male | AA | OD | SI |
| 11 | 74 | Male | AA | OD, OS | NT, SI |
| 12 | 54 | Female | AA | OD | NT |
Both eyes of three donors (5, 6, and 11) were included. A 3D ultrasound examination was scanned either along the nasal-temporal (NT) or superior–inferior (SI) direction.
Table 2.
Summary of PPS and ONH Morphometric Measurements Obtained by High-Frequency Ultrasound Imaging in Human Donor Eyes (n = 15)
| Parameters | Mean ± SD | Range |
|---|---|---|
| PPS thickness (mm) | 1.14 ± 0.20 | [0.84–1.53] |
| PPS radius (mm) | 12.2 ± 0.75 | [10.3–13.4] |
| BMO area (mm2) | 1.25 ± 0.37 | [0.74–1.89] |
| BMO Radius (µm) | 624 ± 95 | [486–775] |
| PSCO area (mm2) | 5.83 ± 0.67 | [5.02–7.66] |
| PSCO radius (mm) | 1.36 ± 0.76 | [1.26–1.56] |
BMO, Bruch's membrane opening.
Principal Strains and Volumetric Strains in Human ONH and PPS
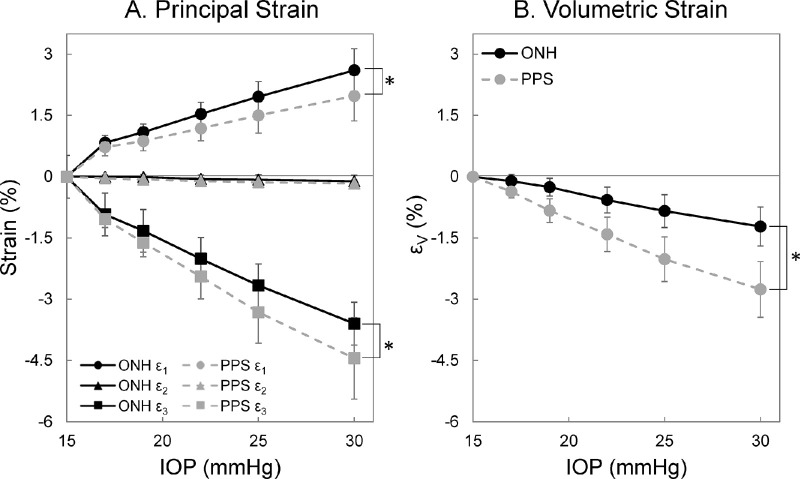
The three principal strains were calculated for each donor eye across all pressure levels. For both ONH and PPS, the general trend observed was shown in Figure 4A. The first principal strain was positive and showed an increase in magnitude with increasing IOP. The second principal strain was minimal in magnitude in both ONH and PPS at all tested IOP levels. The third principal strain in both regions was negative, but largest in magnitude. For an IOP higher than 17 mm Hg, the first principal strain was significantly greater in the ONH than the PPS (all P < 0.05). At all IOP levels, the third principal strain magnitude was significantly smaller in the ONH than the PPS (all P < 0.05). At 30 mm Hg, the first and third principal strains are highly correlated for both ONH and PPS (R = −0.85 [P < 0.001] and R = −0.79 [P < 0.001], respectively).
Figure 4.
Average principal and volumetric strains of the ONH and PPS at different IOP levels (n = 15). (A) First (ε1) and third (ε3) principal strain magnitudes increased with IOP. The second principal strain (ε2) was minimal at all tested IOP levels. (B) Volumetric strain (εV) was negative in both ONH and PPS indicating volume loss during IOP increase. (*P < 0.05, for comparison between the ONH and PPS.)
The volumetric strains in the ONH and PPS were negative, suggesting a small loss of volume during IOP increase. The magnitudes of the volumetric strains showed an increasing trend with IOP, where PPS had larger volumetric strain magnitude than ONH at all IOP levels (all P < 0.001) (Fig. 4B). At 30 mm Hg, the magnitudes of volumetric strains were 1.22 ± 0.48% and 2.76 ± 0.68% for the ONH and PPS, respectively.
Three-Dimensional Spherical Strains in Human ONH and PPS
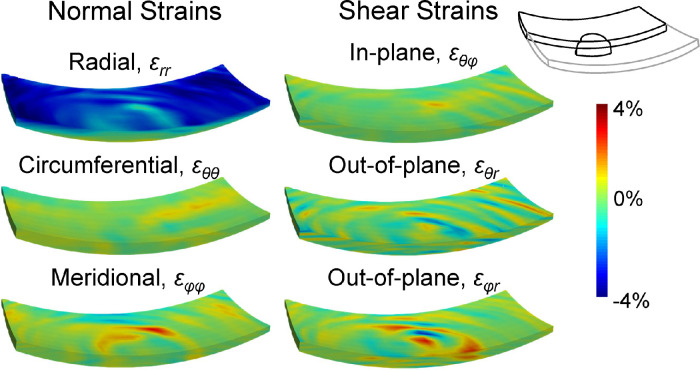
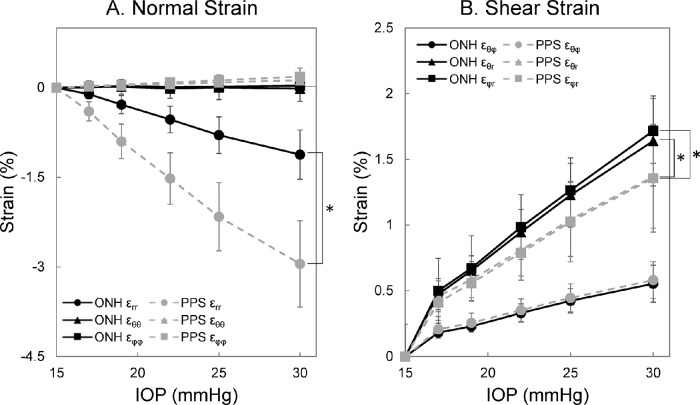
Representative 3D strain maps from a human donor globe at 30 mm Hg are shown in Figure 5. The radial strain εrr in ONH and PPS increased in magnitude with IOP elevation. ONH radial strain εrr was significantly smaller than PPS radial strain across all IOP levels (all P < 0.001) (Fig. 6A). At 30 mm Hg, ONH and PPS had εrr of −1.12 ± 0.41% and −2.95 ± 0.72%, respectively. The in-plane normal strains, including circumferential strain εθθ and meridional strain εφφ, were significantly smaller compared with the radial strain εrr for both ONH and PPS at all IOP levels (all P < 0.01). At 30 mm Hg, circumferential strains εθθ in the ONH and PPS were –0.01 ± 0.21% and 0.12 ± 0.09%, respectively, and meridional strain εφφ was 0.03 ± 0.20% in the ONH and 0.19 ± 0.14% in the PPS.
Figure 5.
Color maps of the 3D strains including three normal strains (εrr, εθθ, and εφφ) and three shear strains (εθφ, εθr, and εφr) at 30 mm Hg in a representative human donor eye. The volumes were cut through the center of the ONH to also visualize the strain distibution within one central cross-section.
Figure 6.
Average spherical strains of the ONH and PPS in response to IOP elevation (n = 15). (A) Radial strain εrr was the dominant normal strain in both ONH and PPS. (B) Out-of-plane shears εφr and εθr were larger than in-plane shear εθφ for both ONH and PPS. (*P < 0.05, for comparison between the ONH and PPS.)
Among the three shear strains, in-plane shear εθφ is the smallest for both ONH and PPS (all P < 0.001). At 30 mm Hg, εθφ was 0.55 ± 0.14% and 0.58 ± 0.14% for ONH and PPS, respectively, whereas the out-of-plane shear εθr were 1.64 ± 0.34% and 1.37 ± 0.39%, and the out-of-plane shear εφr were 1.72 ± 0.37% and 1.36 ± 0.41%, respectively. No significant difference in εθφ was observed between the ONH and PPS at any IOP level. The εφr was significantly greater in the ONH than PPS across all IOP levels (all P < 0.05) (Fig. 6B), and the εθr was significantly greater in the ONH than the PPS for an IOP of greater than 17 mm Hg (all P < 0.05). Each type of shear strain was highly correlated between the ONH and PPS with an R of 0.98 at all tested IOP levels greater than 15 mm Hg.
Anterior Versus Posterior Comparison
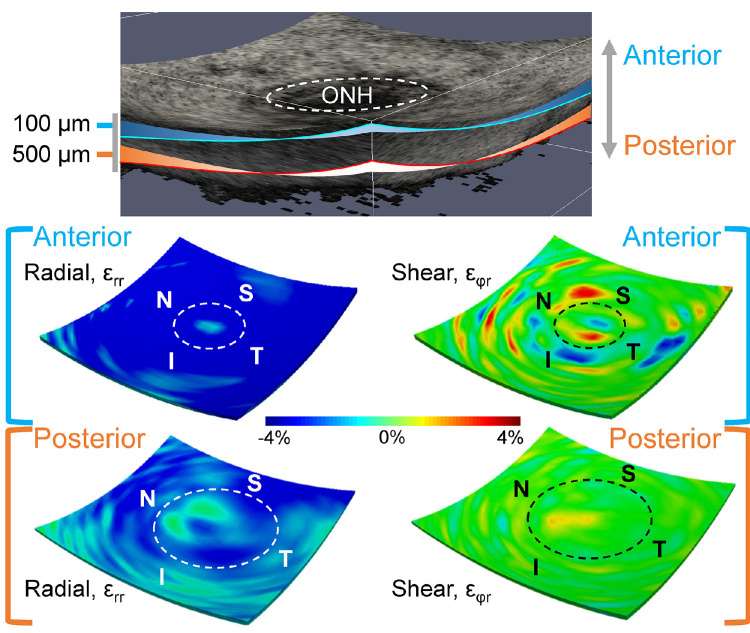
The deformation through the thickness of the posterior tissues in response to IOP elevation was not homogeneous. At 30 mm Hg, all six strain components were larger in the anterior layer than the posterior for both ONH and PPS (Table 3). The dominant deformation at 30 mm Hg was radial compression at the anterior layer (εrr = −3.04 ± 0.91% in ONH and −4.76 ± 0.94% in PPS). When comparing the anterior halves of ONH and PPS, the anterior ONH had a significantly smaller radial strain εrr than the anterior PPS (P < 0.001). There was a strong correlation in radial compression εrr between anterior ONH and anterior PPS (R = 0.63; P = 0.011). Both out-of-plane shear strains (εθr and εφr) were significantly greater in the anterior ONH compared with anterior PPS (all P < 0.001). The radial and shear strain maps from a curved surface in the anterior ONH/PPS and a curved surface in the posterior ONH/PPS were shown in Figure 7, demonstrating the depth-dependent variation of these strains. The strain maps also showed that high-magnitude shear strains were more localized, which was observed in all tested donor eyes.
Table 3.
All Strains Were Higher in the Anterior ONH and PPS Than the Posterior ONH and PPS in Human Donor Eyes (n = 15)
| ONH | PPS | |||||
|---|---|---|---|---|---|---|
| Strain (%) at 30 mm Hg | Anterior | Posterior | P Value | Anterior | Posterior | P Value |
| Volumetric, εV | −2.91 ± 1.12 | −0.35 ± 0.68 | <0.001 | −4.48 ± 0.87 | −1.22 ± 0.66 | <0.001 |
| Radial, εrr | −3.04 ± 0.91 | −0.12 ± 0.60 | <0.001 | −4.76 ± 0.94 | −1.32 ± 0.69 | <0.001 |
| Meridional, εφφ | 0.21 ± 0.36 | −0.06 ± 0.20 | 0.01 | 0.27 ± 0.21 | 0.10 ± 0.09 | 0.001 |
| Circumferential, εθθ | 0.16 ± 0.50 | −0.11 ± 0.18 | 0.06 | 0.21 ± 0.11 | 0.05 ± 0.08 | <0.001 |
| In-plane shear, εθφ | 0.75 ± 0.18 | 0.46 ± 0.17 | <0.001 | 0.73 ± 0.19 | 0.45 ± 0.12 | <0.001 |
| Out-of-plane shear, εθr | 2.51 ± 0.75 | 1.22 ± 0.37 | <0.001 | 1.79 ± 0.58 | 0.98 ± 0.26 | <0.001 |
| Out-of-plane shear, εφr | 2.64 ± 0.76 | 1.26 ± 0.40 | <0.001 | 1.87 ± 0.64 | 0.89 ± 0.26 | <0.001 |
All comparisons reached statistical significance (P < 0.05) except for ONH circumferential strains.
Figure 7.
Three-dimensional strain maps in a donor eye showing larger strains were concentrated in the anterior region of both ONH and PPS. Dashed circles indicate the border of the ONH. Shear strain of high magnitudes (either positive or negative) seemed to be more localized than radial strain.
Associations Between Age and Strains
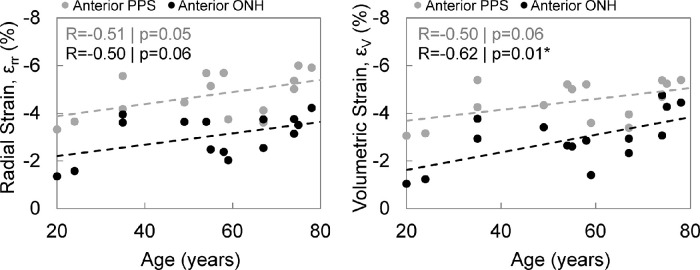
None of the morphometric parameters were significantly associated with age (all P > 0.2). Correlations and P values between age and different types of strains (3D volumetric, normal, and shear strains) in the anterior ONH and anterior PPS are tabulated in Table 4. The magnitude of compressive radial strain εrr was significantly correlated with age in the anterior PPS (R = 0.51; P = 0.05; Fig. 8). Similar correlation with age was also found in the adjacent PPS (R = 0.57; P = 0.03). The magnitude of radial strain εrr in the anterior ONH also exhibited a trend of positive correlation with age (R = 0.50; P = 0.06). Likewise, volumetric strain magnitude exhibited a significant correlation with age in the anterior ONH (R = 0.62; P = 0.01) and a trend of positive correlation with age in anterior PPS (R = 0.50; P = 0.06). Figure 9 shows the representative color maps of radial compression from a young eye (24 years old) compared to an older eye (78 years old). There was also a trend of positive correlation between adjacent PPS circumferential strain with age (R = 0.49; P = 0.06).
Table 4.
Correlations Between Age and 3D Strains in Anterior ONH, Anterior PPS, and Adjacent PPS (aPPS)
| ONH | PPS | ||
|---|---|---|---|
| Pearson R (P Value) | Anterior | aPPS | Anterior |
| Volumetric, εV | −0.62 (0.01)* | −0.02 (0.94) | −0.50 (0.06) |
| Radial, εrr | −0.50 (0.06) | −0.57 (0.03)* | −0.51 (0.05) |
| Meridional, εφφ | 0.03 (0.90) | 0.22 (0.43) | 0.09 (0.74) |
| Circumferential, εθθ | −0.40 (0.14) | 0.49 (0.06) | 0.24 (0.38) |
| In-plane shear, εθφ | 0.10 (0.73) | −0.27 (0.34) | −0.21 (0.46) |
| Out-of-plane shear, εθr | 0.13 (0.64) | 0.01 (0.97) | 0.04 (0.89) |
| Out-of-plane shear, εφr | 0.41 (0.13) | 0.12 (0.68) | 0.04 (0.89) |
P < 0.05. The magnitudes of radial compression and volumetric strain increased with age in anterior ONH and anterior PPS. Radial strain magnitude also increased with age in the aPPS.
Figure 8.
Association of age with radial strain (εrr) and volumetric strain (εV) in the anterior ONH and anterior PPS.
Figure 9.
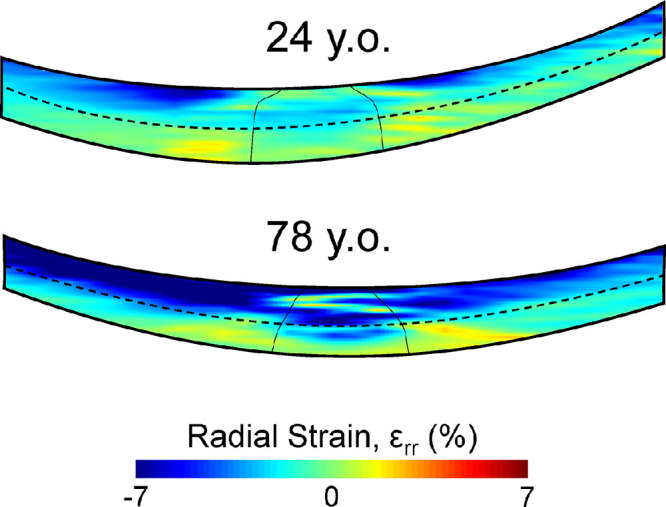
Color maps of radial strain (εrr) at 30 mm Hg through the center of the scanned volume in a representative young eye (24 years old) and a representative old eye (78 years old). The older eye exhibited a larger radial compression in both the anterior ONH and anterior PPS.
Discussion
Glaucoma is an optic neuropathy initiated at the ONH. Two primary risk factors for glaucoma are higher IOP and older age. In this study, we used a high-resolution ultrasound elastography technique to simultaneously image the ONH and PPS in human donor eyes to quantify IOP-induced 3D mechanical deformation in these tissues and explore associations with age. Compared with optical imaging, ultrasound imaging has a greater penetration depth, which gives us a more comprehensive investigation to include the entire thickness of the ONH and PPS. More important, it allows us to accurately characterize the out-of-plane deformations, including radial compression and shear, which are difficult to obtain using other methods. In this study, we quantified the full strain tensor (six components) at each spatial point within the scanned ONH and PPS volume (approximately 23,000 points per eye) and analyzed the whole and regional ONH and PPS response to IOP increases up to 30 mm Hg. The primary findings are as follows. First, the dominant form of deformation in response to IOP was compressive radial strain εrr in both ONH and PPS, with a much larger magnitude than the in-plane normal strains (εφφ and εθθ) and in-plane shear εθφ. Out-of-plane shear strains (εφr and εθr) were also substantial in both ONH and PPS. Second, most strains were found to be significantly greater in the anterior than the posterior one-half of both the ONH and the PPS. Third, exploratory analyses suggest that radial and volumetric strains in the anterior ONH and PPS increased with age, indicating a greater compression and volume loss in older age during IOP elevation.
Among the six components of the 3D spherical strain tensor, radial strain was the greatest in magnitude, indicating radial compression as the primary form of deformation in both ONH and PPS. This result was consistent with the findings in our previous 2D study that scanned the central cross-section along the nasal–temporal direction of the ONH and PPS.28 The circumferential and meridional strains in the ONH were very small, suggesting that in the normal eye the PPS is effective in shielding the ONH from in-plane tensile stretch created by an elevated IOP. This is likely accomplished by the strong annulus collagen ring in the PPS immediately adjacent to the ONH, which is present ubiquitously in all studied species including mouse, rabbit, pig, and human. Although the radial compression was smaller in ONH than in PPS, the PPS seemed to be less effective in shielding the ONH from deformations in the out-of-plane direction. Our results showed that the radial compression and the out-of-plane shear strains in the ONH (particularly in the anterior ONH) had a substantial magnitude and increased at higher IOP. It is noted that the strain values in this study are not directly comparable with previous donor eye studies,12,15,17,37 because these strains were created by a pressure elevation from 15 mm Hg, the average normal pressure in the human eye. Previous donor eye studies reported strains created by an IOP change from a lower baseline (1.5 or 5.0 mm Hg).12,17
Both our previous 2D study and the present 3D study showed a higher radial strain in the anterior than the posterior ONH. This finding may be explained by the role of LC as it represents a stiffer connective tissue discontinuity in the thickness direction. In our previous investigation of the radial displacement through the thickness of ONH, it was observed that radial displacement decreased from the prelaminar region to the LC and then plateaued in the region posterior to LC.29,30 Results from the present study showed that out-of-plane shear εφr was concentrated in the anterior ONH region. This component of shear describes the outward bending and posterior bowing of the ONH during IOP increases, which may contribute to the biomechanically driven LC remodeling and optic disc cupping, characteristic of clinical glaucoma.38 These results indicate that the mechanical deformations that contribute to glaucomatous damage in the ONH are likely those in the out-of-plane direction, namely, radial compression and out-of-plane shear. An imaging method that can characterize these deformations in the anterior ONH in vivo accurately may thus provide additional diagnostic information to monitor and predict progression.
Previous studies have shown an age-related stiffening in the collagenous connective tissues of the posterior eye. Albon et al.11 used laser scanning confocal microscope imaging to determine changes in the volume and strain of ex vivo human LC in response to IOP increase. Higher gradients in the pressure–volume curve were observed in older eyes, suggesting an increased LC stiffness in older age. In addition, the mechanical compliance of LC, as the ability to regain the original shape and size of LC after the removal of applied pressure, decreased with age.11 As for the sclera, inflation tests of human eyes have observed an age-related stiffening of the pressure–strain response of the scleral surface using different methods for displacement measurements such as electron speckle pattern interferometry12 and digital image correlation.17 Inverse computational models were developed that integrated the displacement fields of inflation testing and microstructure of the sclera to examine the elastic properties of the collagen fibers and matrix in the sclera.39,40 Specifically, the model used by Grytz et al.41 was based on electron speckle pattern interferometry displacement and constitutive formulation that incorporates scleral collagen fibril crimp and local anisotropic collagen architecture, which reported an increased shear modulus and decreased collagen fibril crimp angle with age. The eye-specific model used by Coudrillier et al.,42 which was based on digital image correlation-calculated displacement and wide-angle x-ray-measured scleral collagen distribution, showed a greater matrix stiffness and a lower degree of fiber alignment in the sclera of older eyes. Taken together, these findings consistently suggested age-related stiffening in the LC and sclera. However, it remains unclear how age-associated collagenous tissue stiffening may or may not contribute to glaucoma risk.
A major new finding of the present study is that there was a trend of increased radial compression and volume loss with age in the anterior ONH and PPS during IOP increase. This observation was enabled by the 3D ultrasound elastography technique that allows the accurate quantification of displacement and strain fields beyond the tissue surface. The PPS is a highly anisotropic structure with an in-plane tensile modulus orders of magnitude higher than the through-thickness (radial) compressive modulus.43 Age-associated collagen cross-linking may result in stiffening of the in-plane properties, whereas through-thickness stiffness may decrease with age owing to decreased proteoglycan and hydration.44–46 Our results indicated that the radial compression in the anterior ONH also showed a trend of increasing with age. Although a larger sample size is needed to confirm this result, two implications are worth noting. First, this finding points to a potential biomechanical mechanism underlying the greater glaucoma risk in older age. Despite connective tissue in-plane stiffening, the anterior ONH, which is composed mostly of neuroglial and capillary tissues, may be subject to an increased through-thickness compression during aging. This factor could contribute to optic disc cupping, a key clinical feature of glaucoma, as well as axonal blockage, glial reactivity, and decreased blood flow in this region. Second, because radial strains in the anterior ONH and anterior PPS were correlated strongly, further studies are needed to investigate the interactions between the ONH and PPS radial responses to the IOP. For example, would a decrease in PPS radial strain alleviate ONH radial compression? Previous studies have investigated the effect of PPS stiffening on ONH and LC in-plane deformation47,48 and found decreased in-plane strains after PPS stiffening. However, the responses in the radial (through-thickness) direction were not examined. In vivo rodent models of experimentally induced glaucoma did not show a protective effect of PPS stiffening against glaucoma damage, despite reduced in-plane strains.49,50 These results, along with the findings in the present study, indicated that the ONH and PPS radial compression may be potentially a more important driver in IOP-related glaucomatous damage and warrants further study.
We also observed a small volume loss in the anterior ONH and PPS in response to elevated IOP. Most biological tissues are modeled as nearly incompressible with a Poisson's ratio close to 0.5 (essentially no volume change during mechanical deformation). Tissues such as cartilage are known to change volume during deformation; for example, patella cartilage volume decreased by 6% after knee bends.51 A recent study reported that cells undergo slow deformation at constant volume, whereas fast deformation leads to volume loss.52 Very few studies have reported the volume ratio or volumetric strains in ONH or PPS. The 3D approach used in this study allowed us to characterize the full strain tensor and calculate these parameters. Interestingly, there was a significantly larger volume loss (i.e., larger volumetric strain magnitude) in older eyes, which was consistent with the larger radial compression discussed elsewhere in this article. Further studies are needed to explore the biomechanical and pathophysiological implications of volume loss in ONH and PPS during IOP elevation.
In addition to deformation characterization, with the advantage of high-frequency 3D ultrasound, morphological characterization was also made possible. Taking into account the exsanguinated choroid layer, the measured PPS thickness was in a similar range as previously reported in our28 and others53–55 studies. Similarly, PPS curvature, the BMO radius, and area also agreed with reported ranges.56,57 We did not find reports of human PSCO radius and area. Our measured values were comparable with the reported intraorbital optic nerve sheath diameter.58 We also did not observe significant correlations between morphometric parameters and age. In the case of PPS thickness, previous studies reported mixed results. Some reported no association with age,54,59 whereas others reported a decrease with age.17
This study has several limitations. First, ex vivo testing is limited to only include IOP without other important forces that are exerted on the living eye, such as cerebrospinal fluid pressure, central retinal artery blood pressure, and tension on the optic nerve. Because IOP is a dominant factor for determining the biomechanical insults in the development and progression of glaucoma, our focus was IOP-induced deformation with an understanding that in vivo deformation would be affected by other factors as well. Second, the exsanguinated choroid is indistinguishable from the PPS in the ultrasound images and, thus, was not separated out from the PPS in the current analysis. In the ex vivo donor eye, the choroid is approximately 200 µm in thickness near the posterior pole.60 Evaluating the strain maps of the PPS, the anterior 200-µm layer did not show a distinct strain response. As such, the mechanical response of the PPS volume described in this study would be close to that of the PPS if choroid was removed. Third, our current sample size was limited. The sample size of 15 provides 80% power to detect a Pearson correlation of greater than 0.65 at a significance level of 0.05. Thus, future studies with a larger sample size (30 or more) are needed to verify age-associated changes. Our current sample size provided approximately 90% power to detect an effect size of 1 (1 SD difference) between two regions based on paired t tests. Last, our analysis of the anterior and posterior halves of the ONH and PPS was not based on natural tissue boundaries, such as the LC surface. The LC was not separately segmented out for either morphometric or strain analysis in the present study. We are currently developing 3D segmentation methods and aim to delineate anatomical features such as the LC in future studies to characterize the mechanical deformation in the pre-LC, LC, and post-LC regions.
In conclusion, high-resolution ultrasound elastography was used to measure the 3D mechanical responses of the human ONH and PPS to IOP elevation. We found that radial compression was the dominant form of deformation in the anterior PPS and anterior ONH, and its magnitude increased with age. Although this trend seemed to contrast with age-associated stiffening, increased radial compression may be the predominant IOP-related mechanical insult at the ONH, potentially contributing to age-related glaucoma risk. Future studies in glaucomatous eyes are needed to further understand the connection with glaucoma progression. The unique capability of high-frequency ultrasound elastography to quantify 3D tissue deformation may provide a useful tool in such studies to gain new insights into the age-associated biomechanical susceptibility to glaucoma, particularly in the anterior ONH, where glaucomatous damages initiate.
Acknowledgments
Funded by Grant no. NIHR01EY032621.
Disclosure: S. Kwok, None; Y. Ma, None; X. Pan, None; J. Liu, None
References
- 1. Tham YC, Li X, Wong TY, et al.. Global prevalence of glaucoma and projections of glaucoma burden through 2040: a systematic review and meta-analysis. Ophthalmology. 2014; 121: 2081–2090. [DOI] [PubMed] [Google Scholar]
- 2. Quigley HA, Addicks EM, Green WR, Maumenee AE. Optic nerve damage in human glaucoma: II. The site of injury and susceptibility to damage. Arch Ophthalmol. 1981; 99: 635–649. [DOI] [PubMed] [Google Scholar]
- 3. Burgoyne CF, Downs JC, Bellezza AJ, Suh JKF, Hart RT. The optic nerve head as a biomechanical structure: a new paradigm for understanding the role of IOP-related stress and strain in the pathophysiology of glaucomatous optic nerve head damage. Prog Retina Eye Res. 2005; 24: 39–73. [DOI] [PubMed] [Google Scholar]
- 4. Nickells RW, Howell GR, Soto I, John SWM. Under pressure: cellular and molecular responses during glaucoma, a common neurodegeneration with axonopathy. Annu Rev Neurosci. 2012; 35: 153–179. [DOI] [PubMed] [Google Scholar]
- 5. Strouthidis NG, Girard MJA. Altering the way the optic nerve head responds to intraocular pressure—a potential approach to glaucoma therapy. Curr Opin Pharmacol. 2012; 13: 83–89. [DOI] [PubMed] [Google Scholar]
- 6. Quigley HA, Cone FE. Development of diagnostic and treatment strategies for glaucoma through understanding and modification of scleral and lamina cribrosa connective tissue. Cell Tissue Res. 2013; 353: 231–244. [DOI] [PMC free article] [PubMed] [Google Scholar]
- 7. Quigley HA, Addicks EM. Regional differences in the structure of the lamina cribrosa and their relation to glaucomatous optic nerve damage. Arch Ophthalmol. 1981; 99: 137–143. [DOI] [PubMed] [Google Scholar]
- 8. Klein BE, Klein R, Sponsel WE, et al.. Prevalence of glaucoma: the Beaver Dam eye study. Ophthalmology. 1992; 99: 1499–1504. [DOI] [PubMed] [Google Scholar]
- 9. Varma R, Ying-Lai M, Francis BA, et al.. Prevalence of open-angle glaucoma and ocular hypertension in Latinos: the Los Angeles Latino Eye Study. Ophthalmology. 2004; 111: 1439–1448. [DOI] [PubMed] [Google Scholar]
- 10. Friedman DS, Wolfs RCW, O'Colmain B, et al.. Prevalence of open-angle glaucoma among adults in the United States. Arch Ophthalmol. 2004; 122: 532–538. [DOI] [PMC free article] [PubMed] [Google Scholar]
- 11. Albon J, Purslow PP, Karwatowski WSS, Easty DL. Age related compliance of the lamina cribrosa in human eyes. Br J Ophthalmol. 2000; 84: 318–323. [DOI] [PMC free article] [PubMed] [Google Scholar]
- 12. Fazio M, Grytz R, Morris J, et al.. Age-related changes in human peripapillary scleral strain. Biomech Model Mechanobiol. 2014; 13: 551–563. [DOI] [PMC free article] [PubMed] [Google Scholar]
- 13. Yang H, Downs JC, Sigal IA, et al.. Deformation of the normal monkey optic nerve head connective tissue after acute IOP elevation within 3-D histomorphometric reconstructions. Invest Ophthalmol Vis Sci. 2009; 50: 5785–5799. [DOI] [PMC free article] [PubMed] [Google Scholar]
- 14. Coudrillier B, Geraldes DM, Vo NT, et al.. Phase-contrast micro-computed tomography measurements of the intraocular pressure-induced deformation of the porcine lamina cribrosa. IEEE Trans Med Imaging. 2016; 35: 988–999. [DOI] [PMC free article] [PubMed] [Google Scholar]
- 15. Fazio MA, Grytz R, Bruno L, et al.. Regional variations in mechanical strain in the posterior human sclera. Invest Ophthalmol Vis Sci. 2012; 53: 5326–5333. [DOI] [PMC free article] [PubMed] [Google Scholar]
- 16. Midgett DE, Pease ME, Jefferys JL, et al.. The pressure-induced deformation response of the human lamina cribrosa: analysis of regional variations. Acta Biomaterial. 2017; 53: 123–139. [DOI] [PMC free article] [PubMed] [Google Scholar]
- 17. Coudrillier B, Tian J, Alexander S, et al.. Biomechanics of the human posterior sclera: Age- and glaucoma-related changes measured using inflation testing. Invest Ophthalmol Vis Sci. 2012; 53: 1714–1728. [DOI] [PMC free article] [PubMed] [Google Scholar]
- 18. Fazio MA, Clark ME, Bruno L, Girkin CA. In vivo optic nerve head mechanical response to intraocular and cerebrospinal fluid pressure: imaging protocol and quantification method. Sci Rep. 2018; 8: 12639–12639. [DOI] [PMC free article] [PubMed] [Google Scholar]
- 19. Wang B, Tran H, Smith MA, et al.. In-vivo effects of intraocular and intracranial pressures on the lamina cribrosa microstructure. PLoS One. 2017; 12: e0188302. [DOI] [PMC free article] [PubMed] [Google Scholar]
- 20. Midgett DE, Quigley HA, Nguyen TD. In vivo characterization of the deformation of the human optic nerve head using optical coherence tomography and digital volume correlation. Acta Biomaterial. 2019; 96: 385–399. [DOI] [PMC free article] [PubMed] [Google Scholar]
- 21. Beotra MR, Wang X, Tun TA, et al.. In vivo three-dimensional lamina cribrosa strains in healthy, ocular hypertensive, and glaucoma eyes following acute intraocular pressure elevation. Invest Ophthalmol Vis Sci. 2018; 59: 260–272. [DOI] [PubMed] [Google Scholar]
- 22. Tang J, Liu J. Ultrasonic measurement of scleral cross-sectional strains during elevations of intraocular pressure: method validation and initial results in posterior porcine sclera. J Biomech Eng. 2012; 134: 091007. [DOI] [PMC free article] [PubMed] [Google Scholar]
- 23. Pavlatos E, Perez BC, Morris HJ, et al.. Three-dimensional strains in human posterior sclera using ultrasound speckle tracking. J Biomech Eng. 2016; 138: 2101–2109. [DOI] [PMC free article] [PubMed] [Google Scholar]
- 24. Palko JR, Ma Y, Pan X, et al.. Mechanical stability of cryopreserved split-thickness tectonic corneal grafts. Cornea. 2020; 39: 1151–1156. [DOI] [PubMed] [Google Scholar]
- 25. Clayson K, Pavlatos E, Pan X, et al.. Ocular pulse elastography: imaging corneal biomechanical responses to simulated ocular pulse using ultrasound. Transl Vis Sci Technol. 2020; 9: 5. [DOI] [PMC free article] [PubMed] [Google Scholar]
- 26. Kwok S, Clayson K, Hazen N, et al.. Heartbeat-induced corneal axial displacement and strain measured by high frequency ultrasound elastography in human volunteers. Transl Vis Sci Technol. 2020; 9: 33. [DOI] [PMC free article] [PubMed] [Google Scholar]
- 27. Pavlatos E, Ma Y, Clayson K, Pan X, Liu J. Regional deformation of the optic nerve head and peripapillary sclera during IOP elevation. Invest Ophthalmol Vis Sci. 2018; 59: 3779. [DOI] [PMC free article] [PubMed] [Google Scholar]
- 28. Ma Y, Pavlatos E, Clayson K, et al.. Mechanical deformation of human optic nerve head and peripapillary tissue in response to acute IOP elevation. Invest Ophthalmol Vis Sci. 2019; 60: 913–920. [DOI] [PMC free article] [PubMed] [Google Scholar]
- 29. Ma Y, Kwok S, Sun J, et al.. IOP-induced regional displacements in the optic nerve head and correlation with peripapillary sclera thickness. Exp Eye Res. 2020; 200: 108202. [DOI] [PMC free article] [PubMed] [Google Scholar]
- 30. Kwok S, Pan M, Hazen N, Pan X, Liu J. Mechanical deformation of peripapillary retina in response to acute intraocular pressure elevation. J Biomech Eng. 2022; 144: 061001. [DOI] [PMC free article] [PubMed] [Google Scholar]
- 31. Ma Y, Pavlatos E, Clayson K, et al.. Three-dimensional inflation response of porcine optic nerve head using high-frequency ultrasound elastography. J Biomech Eng. 2020; 142: 1–7. [DOI] [PMC free article] [PubMed] [Google Scholar]
- 32. Clayson K, Pavlatos E, Ma Y, Liu J. 3D characterization of corneal deformation using ultrasound speckle tracking. J Innov Opt Health Sci. 2017; 10: 1742005. [DOI] [PMC free article] [PubMed] [Google Scholar]
- 33. Cruz Perez B, Pavlatos E, Morris HJ, et al.. Mapping 3D strains with ultrasound speckle tracking: method validation and initial results in porcine scleral inflation. Ann Biomed Eng. 2016; 44: 2302–2312. [DOI] [PMC free article] [PubMed] [Google Scholar]
- 34. Pavlatos E, Chen H, Clayson K, Pan X, Liu J. Imaging corneal biomechanical responses to ocular pulse using high-frequency ultrasound. IEEE Trans Med Imaging. 2018; 37: 663–670. [DOI] [PMC free article] [PubMed] [Google Scholar]
- 35. Anand L, Govindjee S. Continuum mechanics of solids. Oxford, UK: Oxford University Press; 2020. [Google Scholar]
- 36. Kallel F, Ophir J. A least-squares strain estimator for elastography. Ultrason Imaging. 1997; 19: 195–208. [DOI] [PubMed] [Google Scholar]
- 37. Eilaghi A, Flanagan JG, Tertinegg I, et al.. Biaxial mechanical testing of human sclera. J Biomech. 2010; 43: 1696–1701. [DOI] [PubMed] [Google Scholar]
- 38. Downs JC, Roberts MD, Sigal IA. Glaucomatous cupping of the lamina cribrosa: a review of the evidence for active progressive remodeling as a mechanism. Exp Eye Res. 2011; 93: 133–140. [DOI] [PMC free article] [PubMed] [Google Scholar]
- 39. Coudrillier B, Boote C, Quigley HA, Nguyen TD. Scleral anisotropy and its effects on the mechanical response of the optic nerve head. Biomech Model Mechanobiol. 2013; 12: 941–963. [DOI] [PMC free article] [PubMed] [Google Scholar]
- 40. Grytz R, Fazio MA, Girard MJA, et al.. Material properties of the posterior human sclera. J Mech Behav Biomed Mater. 2014; 29. [DOI] [PMC free article] [PubMed] [Google Scholar]
- 41. Grytz R, Fazio MA, Libertiaux V, et al.. Age- and race-related differences in human scleral material properties. Invest Ophthalmol Vis Sci. 2014; 55: 8163–8172. [DOI] [PMC free article] [PubMed] [Google Scholar]
- 42. Coudrillier B, Pijanka J, Jefferys J, et al.. Collagen structure and mechanical properties of the human sclera: analysis for the effects of age. J Biomech Eng. 2015; 137: 4100–4114. [DOI] [PMC free article] [PubMed] [Google Scholar]
- 43. Battaglioli JL, Kamm RD. Measurements of the compressive properties of scleral tissue. Invest Ophthalmol Vis Sci. 1984; 25: 59–65. [PubMed] [Google Scholar]
- 44. Rada JA, Achen VR, Penugonda S, Schmidt RW, Mount BA. Proteoglycan composition in the human sclera during growth and aging. Invest Ophthalmol Vis Sci. 2000; 41: 1639–1648. [PubMed] [Google Scholar]
- 45. Brown CT, Vural M, Johnson M, Trinkaus-Randall V. Age-related changes of scleral hydration and sulfated glycosaminoglycans. Mech Ageing Dev. 1994; 77: 97–107. [DOI] [PubMed] [Google Scholar]
- 46. Mortazavi AM, Simon BR, Stamer WD, Geest JPV. Drained secant modulus for human and porcine peripapillary sclera using unconfined compression testing. Exp Eye Res. 2009; 89: 892–897. [DOI] [PubMed] [Google Scholar]
- 47. Thornton IL, Dupps WJ, Roy AS, Krueger RR. Biomechanical effects of intraocular pressure elevation on optic nerve/lamina cribrosa before and after peripapillary scleral collagen cross-linking. Invest Ophthalmol Vis Sci. 2009; 50: 1227–1233. [DOI] [PubMed] [Google Scholar]
- 48. Coudrillier B, Campbell IC, Read AT, et al.. Effects of peripapillary scleral stiffening on the deformation of the lamina cribrosa. Invest Ophthalmol Vis Sci. 2016; 57: 2666–2677. [DOI] [PMC free article] [PubMed] [Google Scholar]
- 49. Kimball EC, Nguyen C, Steinhart MR, et al.. Experimental scleral cross-linking increases glaucoma damage in a mouse model. Exp Eye Res. 2014; 128: 129–140. [DOI] [PMC free article] [PubMed] [Google Scholar]
- 50. Gerberich BG, Hannon BG, Brown DM, et al.. Evaluation of spatially targeted scleral stiffening on neuroprotection in a rat model of glaucoma. Transl Vis Sci Technol. 2022; 11: 7. [DOI] [PMC free article] [PubMed] [Google Scholar]
- 51. Niehoff A, Muller M, Bruggemann L, et al.. Deformational behaviour of knee cartilage and changes in serum cartilage oligomeric matrix protein (COMP) after running and drop landing. Osteoarthritis Cartilage. 2011; 19: 1003–1010. [DOI] [PubMed] [Google Scholar]
- 52. Venkova L, Vishen AS, Lembo S, et al.. A mechano-osmotic feedback couples cell volume to the rate of cell deformation. Elife. 2022; 11: e72381. [DOI] [PMC free article] [PubMed] [Google Scholar]
- 53. Guyer DR, Schachat AP, Green WR. The choroid: structural considerations. In: Ryan SJ ed. Retina. Philadelphia: Elsevier; 2006: 34–42. [Google Scholar]
- 54. Vurgese S, Panda-Jonas S, Jonas JB. Scleral thickness in human eyes. PLoS One. 2012; 7: e29692. [DOI] [PMC free article] [PubMed] [Google Scholar]
- 55. Shen L, You QS, Xu X, et al.. Scleral and choroidal thickness in secondary high axial myopia. Retina (Philadelphia, Pa.). 2016; 36: 1579–1585. [DOI] [PubMed] [Google Scholar]
- 56. Jesus DA, Kedzia R, Iskander DR. Precise measurement of scleral radius using anterior eye profilometry. Contact Lens Anterior Eye. 2017; 40: 47–52. [DOI] [PubMed] [Google Scholar]
- 57. Jonas JB, Gusek GC, Naumann GO. Optic disc, cup and neuroretinal rim size, configuration and correlations in normal eyes. Invest Ophthalmol Vis Sci. 1988; 29: 1151–1158. [PubMed] [Google Scholar]
- 58. Vaiman M, Abuita R, Bekerman I. Optic nerve sheath diameters in healthy adults measured by computer tomography. Int J Ophthalmol. 2015; 8: 1240–1244. [DOI] [PMC free article] [PubMed] [Google Scholar]
- 59. Shen L, You QS, Xu X, et al.. Scleral thickness in Chinese eyes. Invest Ophthalmol Vis Sci. 2015; 56: 2720–2727. [DOI] [PubMed] [Google Scholar]
- 60. Sezer T, Altinisik M, Koytak IA, Ozdemir MH. The choroid and optical coherence tomography. Turk J Ophthalmol. 2016; 46: 30–37. [DOI] [PMC free article] [PubMed] [Google Scholar]


