Abstract
Background
Glycated hemoglobin (HbA1c) is a commonly used clinical marker to monitor the control of type 2 diabetes mellitus patients (T2DM). However, it is unable to identify the ongoing inflammatory changes in the body. These factors could be easily identified and monitored by the neutrophil-to-lymphocyte ratio (NLR). Therefore, this study is aimed at investigating the relationship between NLR and glycemic control in T2DM.
Method
A comprehensive search of eligible studies was performed in various databases published until July 2021. A random effect model was used to estimate the standardized mean difference (SMD). A metaregression, subgroup, and sensitivity analysis were conducted to search for potential sources of heterogeneity.
Result
A total of 13 studies were included in this study. Accordingly, the SMD of the NLR values between the poor and good glycemic control groups was 0.79 (95% CI, 0.46-1.12). Our study also showed that high NLR was significantly associated with poor glycemic control in T2DM patients (OR = 1.50, 95% CI: 1.30-1.93).
Conclusion
The results of this study suggest an association between high NLR values and an elevated HbA1C in T2DM patients. Therefore, NLR should be considered a marker of glycemic control in addition to HbA1c in T2DM patients.
1. Introduction
Diabetes mellitus (DM) is a multifaceted metabolic disorder that affects the body's blood glucose levels [1]. Based on insulin dependency, it can be classified into type 1 DM (T1DM) and T2DM [2]. T2DM is an inflammatory disease with immune system dysfunction [3]. Low-grade inflammation plays a significant role in the pathogenesis of T2DM, particularly in the development of insulin resistance associated with obesity [4]. Chronic inflammation, indicated by an elevated leukocyte count, may play a central role in the development of diabetic macro- and microvascular complications [5]. Type 2 DM is also associated with changes in serum levels of inflammatory markers like mean platelet volume (MPV) [6] and cytokines [7]. It is well known that T2DM patients are recommended to maintain glycemic standards based on epidemiological data to prevent, or at least delay, the onset and progression of vascular complications [8].
The HbA1c measures average glycemia over about three months and aids in determining the disease's level of management [9]. Poorer outcomes during the course of the disease are associated with higher HbA1c levels [10]. One of the most often utilized tests to check on the management of DM is the HbA1c [11]. It is unable to identify the ongoing inflammatory changes in the body, though. The neutrophil-to-lymphocyte ratio (NLR) can easily identify and monitor such conditions [12].
The NLR is a reliable biomarker of low-grade inflammation in various clinical conditions such as hypertension, metabolic syndrome, obesity, and lifestyle changes [13]. Elevated NLR has also been reported in various inflammatory diseases including type 2 diabetes mellitus [14], irritable bowel disease [15], cancer [16], inflammatory bowel disease [17], cardiac conditions [18], thyroiditis [19], and COVID-19 infection [20]. NLR has emerged as a novel indicator of systemic inflammatory response in various diseases in recent years. In many clinical settings, NLR is considered an independent predictor of major morbidity, mortality, and long-term survival [21]. Besides, it can also be used for population screening, disease detection, and drug monitoring [22]. Neutrophils are the main branch of leukocytes in the bloodstream. Initially, they respond rapidly to the inflammatory stimuli, and the neutrophil count increases in circulation. Instead, interleukin levels that increase in inflammatory conditions cause lymphopenia and neutrophilia, together causing elevated NLR [23, 24].
NLR represents neutrophil and lymphocyte; the 2 components of chronic inflammatory condition [25]. A high neutrophil value is a marker of the ongoing, destructive, nonspecific inflammatory process. Conversely, a low lymphocyte count indicates relatively inadequate immune regulation as well as a quiescent immunity pathway [26]. Hence, a high level of NLR can indicate the functional status of the immune system in the course of chronic inflammation [27]. However, NLR is relatively more stable and less influenced by physiological, pathological, and physical factors than individual leukocyte parameters [28]. The NLR is a low cost, widely available parameter that has been investigated as a reliable proxy marker of systemic inflammation in a spectrum of chronic diseases [29, 30].
Recently, the relationship between DM and NLR has also become a current issue of investigation [31]. Therefore, the main aim of this systematic review and meta-analysis is to investigate the potential role of NLR as an indicator of glycemic control in T2DM patients.
2. Method
2.1. Design and Protocol Registration
This systematic review and meta-analysis were conducted as per the 2020 PRISMA guidelines [32]. The protocol has been registered in the International Prospective Register of Systematic Reviews (PROSPERO), with the registration number CRD42021273819.
2.2. Eligibility Criteria
Articles were included in the meta-analysis if they met each of the following criteria: (1) cross-sectional, case-control, and cohort studies published in peer-reviewed journals evaluating the relationship between NLR and glycemic control in T2DM patients; (2) full text in English; (3) published online up to July 2021; and (4) expressing NLR results as mean and standard deviation (SD) and/or median and interquartile range (IQR). We have excluded studies with (1) insufficient or ambiguous data for meta-analysis; (2) overlapping or duplicate data; and (3) poster presentations, reviews, case reports, and editorial letters.
2.3. Search Strategy
We conducted a comprehensive search of eligible studies in the PubMed/MEDLINE, Cochrane Library, Google Scholar, Scopus, Web of Science, and EMBASE published until July 2021. It was strengthened by searching the reference lists of published articles to identify relevant unpublished studies. The search strategy was based on the combinations of keywords and medical subject heading (MeSH) terms as follows: “neutrophil lymphocyte ratio” or “NLR” or “neutrophil-to-lymphocyte ratio” AND “glycemic control” or “glucose regulation” “level of HgA1C” AND “DM” or “diabetes mellitus” or “Type 2 diabetes.”
2.4. Selection Process
Articles retrieved across the search strategy were imported to EndNote X7 (Thomson Reuters). After precluding duplicated articles, titles and abstracts were independently screened by the two review authors (Solomon Getawa and Tiruneh Adane). For articles considered to appear pertinent during title/abstract screening, the full-text was appraised for inclusion in this study. Available discrepancies between the review authors were resolved through consensus, and a third review author (Mulugeta Melku) was involved if required.
2.5. Data Extraction
Relevant data from the included studies was summarized into an Excel spreadsheet. The following study characteristics were extracted from the included studies; name of the first author; year of publication; study setting; duration of illness; mean age of the participants; and the NLR value in the good and poor glycemic control groups.
2.6. Outcomes of Interest
The main outcome of interest is the comparison of the NLR value between poor and good glycemic control groups (in the form of SMD) in T2DM patients. Six studies divided diabetes control into three groups: group A, with HbA1c 7% (excellent control), group B, with HbA1c 7.0-9.0% (poor control), and group C, with HbA1c 9% (worst control), while the remaining seven studies classified glycemic control into two groups. Those with HbA1c ≤7% (regulated diabetes) were included in group 1, and those with HbA1c >7% (unregulated diabetes) were included in group 2. The secondary outcome is to investigate the association between the NLR values and elevated HbA1c in T2DM patients (in the form of an odd ratio).
2.7. Risk of Bias Measurement
A modified Newcastle-Ottawa quality assessment scale was used to evaluate the methodological quality of the included studies [33]. The tool uses 3 sections (selection, comparability, and exposure) to evaluate the quality of case-control studies. Moreover, cohort and cross-sectional studies are also evaluated using 3 sections (selection, comparability, and outcome). Studies with a score of 5 and above are considered high quality.
2.8. Statistical Analysis
Results are presented as SMDs with an associated 95% CI. Statistical heterogeneity was measured using the I2 statistic, with results above 50% considered to be indicative of statistical heterogeneity. A random effect model was employed to estimate the pooled SMD considering the high heterogeneity in the included studies. According to the recommended protocol, studies that reported the NLR value in the form of median and IQR were changed to mean (SD) [34]. Subgroup analysis, metaregression, and sensitivity analysis were conducted to search for potential sources of heterogeneity. The existence of publication bias was assessed qualitatively using funnel plots and quantitatively using the Eggers regression test. A p value <0.05 was considered statistically significant. Statistical analyses were performed using STATA 11.0 software.
3. Result
3.1. Study Selection
A total of 632 abstracts were screened for inclusion. Of the abstracts screened, 598 were excluded as not being relevant and/or duplicates, leaving 34 studies for screening. Finally, 13 studies were included in the qualitative and quantitative analysis (Figure 1).
Figure 1.
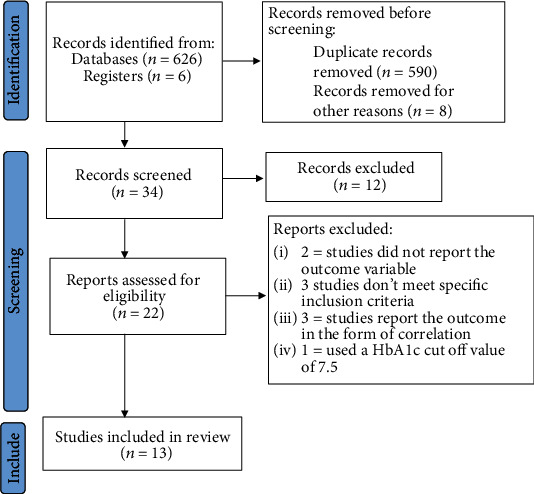
Flow chart of study selection.
3.2. Study Characteristics
Thirteen studies containing 1,434 participants (623 having good glycemic control and 811 with poor glycemic control) were included. Six studies were conducted in India, 2 in Pakistan, 1 in Italy, 1 in Turkey, 1 in Syria, 1 in Brazil, and 1 in Israel. Five studies followed a cross-sectional study design, one case-control, one retrospective, and four observational studies. Two studies did not report the study design. The results of the Modified Newcastle-Ottawa quality assessment scale showed that very good, good, and satisfactory results were found in 4, 7, and 2 studies, respectively. Their characteristics are summarized in Table 1.
Table 1.
Descriptive summary of the included studies on the role of NLR as glycemic control in T2DM patients.
| Author, publication year | Country | Sample size | NLR | Duration of illness | Quality score | |||
|---|---|---|---|---|---|---|---|---|
| Good control | Poor control | Good control | Poor control | Good control | Poor control | |||
| Dudani et al., 2021 [35] | India | 40 | 20 | 2.06 ± 0.77 | 1.94 ± 0.61 | — | — | Good |
| Devamsh and Raghavan, 2019 [36] | India | 33 | 33 | 2.49 ± 1.2 | 2.701 ± 1.5 | 6.93 ± 5.3 | 6.84 ± 3.6 | Satisfactory |
| Mendes et al., 2019 [37] | Brazil | 12 | 127 | 3.9 ± 5.8 | 4.9 ± 8.6 | Good | ||
| Gubbala et al., 2019 [12] | India | 53 | 69 | 2.79 ± 0.97 | 3.74 ± 1.18 | 6.2 ± 4.2 | 8.9 ± 6.8 | Good |
| Hussain et al., 2017 [38] | Pakistan | 110 | 110 | 2.0 ± 0.5 | 2.62 ± 0.42 | — | — | Very good |
| Kemba, 2017 [39] | India | 9 | 51 | 2.08 ± 0.59 | 2.48 ± 0.43 | 5.55 ± 3.33 | 5.94 ± 3.17 | Good |
| Liaqat et al., 2020 [40] | Pakistan | 52 | 48 | 2 ± 0.5 | 2.7 ± 1.0 | 14 ± 20 | 17 ± 24 | Satisfactory |
| Sefil et al., 2014 [41] | Turkey | 34 | 37 | 1.45 ± 0.56 | 1.97 ± 0.56 | 7 ± 6.3 | 6.5 ± 5.9 | Very good |
| Kumar et al., 2020 [42] | India | 21 | 29 | 3.52 ± 1.22 | 5.02 ± 1.29 | — | — | Good |
| Assulyn et al., 2020 [43] | Israel | 53 | 57 | 1.90 ± 0.65 | 2.06 ± 0.83 | 10 ± 6 | 14 ± 8 | Very good |
| Alnabi and Hussain, 2020 [44] | Syria | 38 | 45 | 2.29 ± 0.2 | 2.98 ± 0.3 | — | — | Good |
| Palella et al., 2020 [45] | Italy | 58 | 75 | 1.90 ± 0.8 | 2.28 ± 0.97 | — | — | Good |
| Najeeb, 2019 [46] | India | 110 | 110 | 2.0 ± 0.5 | 2.7 ± 1.0 | — | — | Very good |
3.3. Pooled Mean NLR Value in Poor and Good Glycemic Control T2DM Patients
In this study, we tried to determine the pooled mean NLR value in the poor and good glycemic control groups through the random effect model. As a result, the pooled NLR was 2.64 (95% CI: 2.30-2.97) (Figure 2) and 2.15 (95% CI: 1.88-2.42), respectively (Figure 3).
Figure 2.
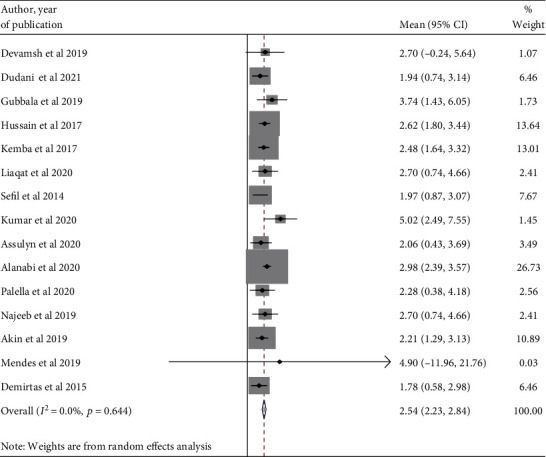
A forest plot displaying the pooled estimate of NLR value among poor glycemic groups.
Figure 3.
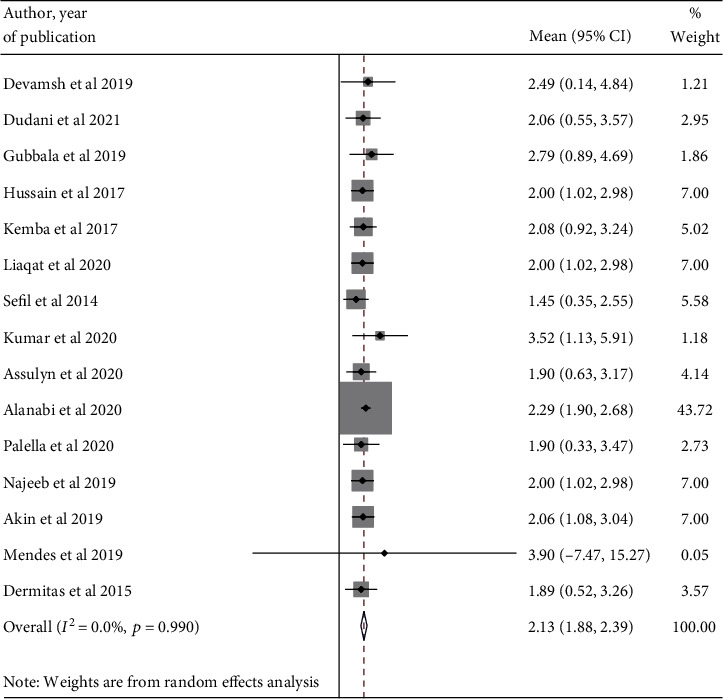
A forest plot displaying the pooled estimate of NLR value among good glycemic groups.
3.4. The Association between NLR and Glycemic Control in T2DM Patients
A total of 13 studies were included in this meta-analysis to explore the association between NLR and glycemic control in T2DM patients. The box plot comparing the NLR value is shown in Figure 4.
Figure 4.
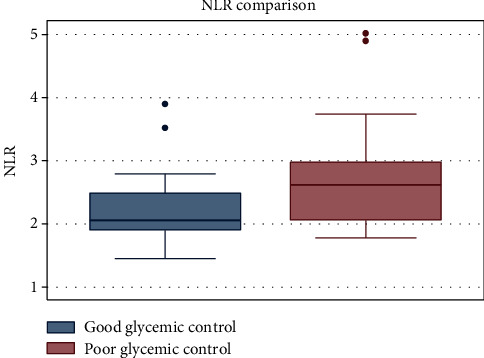
Box plot displaying the comparison of NLR value in the poor and good glycemic control groups.
A random effect model was applied because of the significant heterogeneity between studies (I2 = 86.9%). In the pooled analysis, a significant increase in NLR was observed in the poor control groups than the good control groups (SMD = 0.79; 95% CI, 0.46-1.12; p < .001) (Figure 5).
Figure 5.
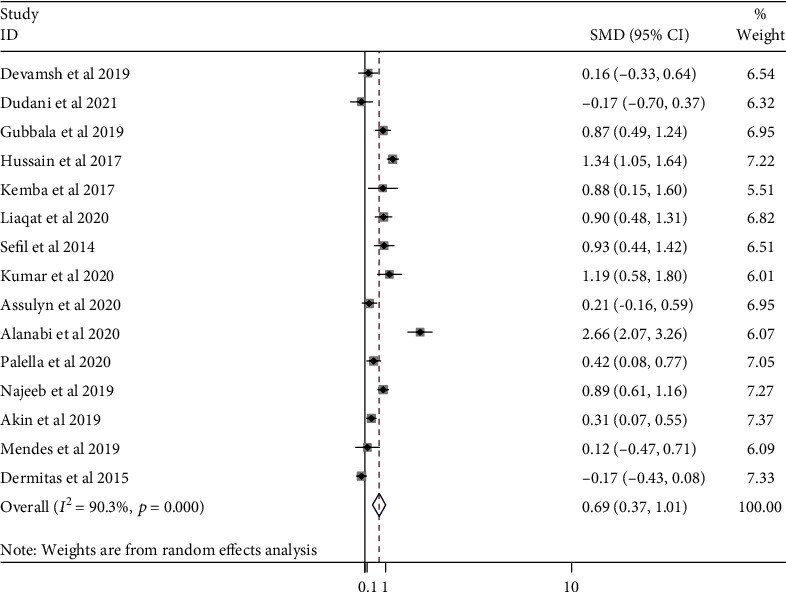
A forest plot showing SMD of the NLR value between good and poor glycemic control in DM patients.
3.5. High vs. Low NLR and Glycemic Control in T2DM Patients
Five studies reported the odd ratio of a high NLR as an independent predictor of poor and/or worse glycemic control in T2DM patients. The pooled OR was 1.70 (95% CI: 1.50, 1.93) with no heterogeneity (I2 = 0.0%; p value = 0.559) (Figure 6).
Figure 6.
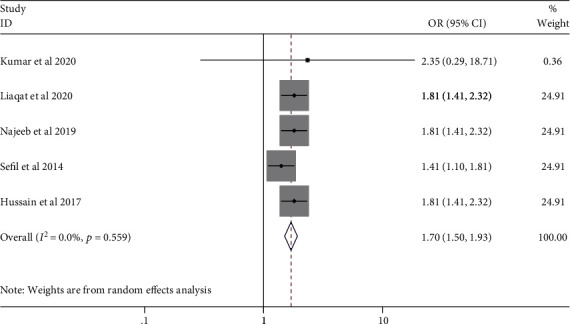
Pooled OR of high NLR value in DM patients.
3.6. Subgroup Analysis
To explore the sources of heterogeneity, subgroup analysis was carried out according to the duration of illness. Accordingly, the NLR values were 0.70 (95% CI: 0.33, 1.07) and 0.55 (95% CI: -0.12, 1.22) for durations of less than 10 years and above 10 years, respectively (Figure 7).
Figure 7.
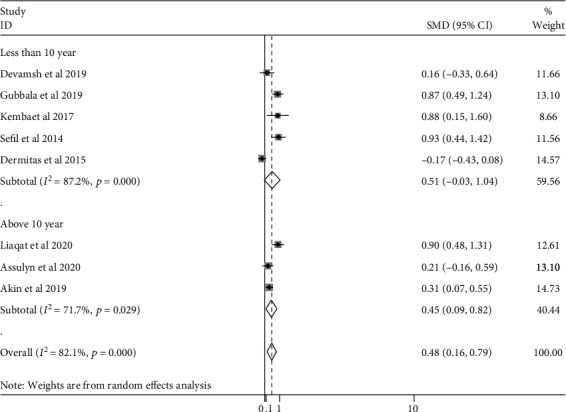
Subgroup analysis stratified by duration of DM.
3.7. Sensitivity Analysis
Sensitivity analyses were performed to evaluate the robustness of the results. One study was sequentially omitted at a time to assess its effect on the overall outcome. As a result, no apparent change occurred in the NLR value when an individual study was omitted, confirming that the results were stable (Table 2).
Table 2.
Sensitivity analysis.
| Excluded studies | SMD (95% CI) | Heterogeneity | |
|---|---|---|---|
| I 2 | p value | ||
| Dudani et al., 2021 [35] | 0.87 (0.54-1.19) | 86% | ≤0.001 |
| Devamsh and Raghavan, 2019 [36] | 0.84 (0.50-1.19) | 87% | ≤0.001 |
| Mendes et al., 2019 [37] | 0.84 (0.50-1.18) | 87.3% | ≤0.001 |
| Gubbala et al., 2019 [12] | 0.79 (0.42-1.15) | 88% | ≤0.001 |
| Hussain et al., 2017 [38] | 0.74 (0.40-1.08) | 85.5% | ≤0.001 |
| Kemba, 2017 [39] | 0.79 (0.44-1.13) | 88% | ≤0.001 |
| Liaqat et al., 2020 [40] | 0.78 (0.43-1.14) | 88% | ≤0.001 |
| Sefil et al., 2014 [41] | 0.78 (0.43-1.13) | 88% | ≤0.001 |
| Kumar et al., 2020 [42] | 0.76 (0.42-1.11) | 87.8% | ≤0.001 |
| Assulyn et al., 2020 [43] | 0.84 (0.50-1.19) | 86.5% | ≤0.001 |
| Alnabi and Hussain, 2020 [44] | 0.66 (0.39-0.92) | 79.1% | ≤0.001 |
| Palella et al., 2020 [45] | 0.83 (0.47-1.18) | 87.3% | ≤0.001 |
| Najeeb, [46] | 0.67 (0.32-1.02) | 90.7% | ≤0.001 |
| Combined | 0.79 (0.46-1.12) | 86.9% | ≤0.001 |
3.8. Metaregression
A metaregression was conducted to explore the effect of continuous covariates on differences in the NLR value between poor and good glycemic control groups. The continuous covariates included in the analysis were the year of publication and the duration of illness. Accordingly, any of the covariates show no effect on the pooled SMD of the NLR values (Table 3).
Table 3.
Metaregression.
| Variables | Coefficient (95% CI) | p value |
|---|---|---|
| Year of publication | 0.016 (-0.197,0.23) | 0.870 |
| Duration of illness (poor glycemic control) | 0.003 (-0.09, 0.092) | 0.933 |
| Duration of illness (good glycemic control) | 0.002 (-0.12, 0.13) | 0.965 |
3.9. Publication Bias
A funnel plot and Eggers regression tests were performed to explore the presence of publication bias. A visual inspection of the funnel plot shows no divergence from the expected shape (Figure 8); suggesting the absence of publication bias. This is also confirmed by using the Egger tests; p value = 0.86 (Table 4).
Figure 8.
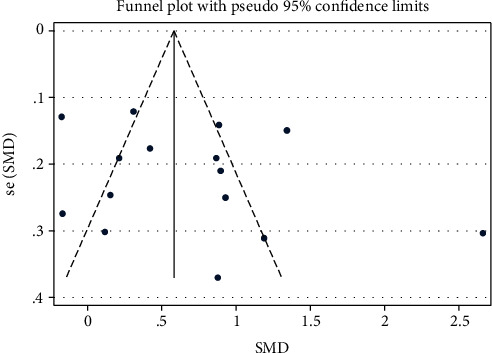
Publication bias.
Table 4.
Egger's test.
| Standard effect | Coefficient | Standard error | p > |t| | (95% confidence interval) | |
|---|---|---|---|---|---|
| Slope | 0.90 | 0.60 | 1.50 | 0.16 | -0.42, 2.23 |
| Bias | -0.51 | 2.8 | -0.18 | 0.86 | -6.77, 5.74 |
4. Discussion
This systematic review and meta-analysis is aimed at investigating the association between NLR value and glycemic control in T2DM patients. The findings demonstrated that the mean NLR value in the poor group was significantly higher than that of the good glycemic control group (SMD = 0.79; 95% CI, 0.46-1.12; p < .001). This study also showed that a high NLR value was significantly associated with poor glycemic control in T2DM patients (OR = 1.50 (95% CI: 1.30-1.93)). This study confirms that the NLR value increased as the HbA1c level worsened and could be a good marker for assessing glycemic control in addition to HbA1c. The increase in NLR in T2DM patients probably showed the inflammatory burden of the disease.
In line with previous studies, this study showed that the NLR value could be used as a marker of diabetic control level besides the HbA1c level in T2DM patients [47, 48]. It can be associated with the negative effects of neutrophils on endothelial damage and the antiatherosclerotic role of lymphocytes [49]. Chronic inflammation in T2DM progresses with leukocyte recruitment to the vascular environment in response to oxidative stress and the production of proinflammatory cytokines [50]. The power of the NLR value as an inflammatory factor stems from both a reduction in the lymphocyte count and an increase in the neutrophil count [51]. Neutrophils rapidly respond to inflammatory stimuli and increase their number in circulation. Studies showed that there is an increased expression of activation markers like CD11b/CD18 on monocytes and neutrophils in T2DM patients, resulting in increased neutrophil adhesiveness to the endothelium, independent of fasting glucose levels [52, 53]. Leucocytes in DM patients may also be activated by leptin and advanced glycation end products [54]. Activated leucocytes then contribute to systemic inflammation and endothelial damage by releasing reactive oxygen species through neutrophils and cytokines [55]. In addition, the relative number of regulatory T cells compared to helper T cells is reduced in patients with DM [56]. Increased interleukin levels during inflammation cause lymphopenia [23] and neutrophilia [24], together resulting in a high NLR value. It is associated with microvascular and macrovascular complications of DM and metabolic impairment [57].
The current study showed that the NLR is significantly related to the level of hyperglycemia in T2DM patients. Previous research has linked high NLR levels to elevated HbA1c levels in T2DM [31, 41]. Clinicians measure the long-term glycemic control in DM patients using the HbA1c test. However, HbA1c may be affected by a variety of genetic, hematologic, and illness-related factors. Hemoglobinopathies, certain anemia, and disorders associated with accelerated red cell turnover, such as malaria, are the most common important factors affecting HbA1c levels worldwide [58]. Furthermore, recent blood transfusion, use of erythropoiesis-stimulating drugs, end-stage kidney disease, and pregnancy may cause discrepancies between the HbA1C result and the patient's true mean glycaemia [59]. The NLR has been identified as a potential marker to determine inflammation in various cardiac and noncardiac disorders because it has a superior predictive, diagnostic, and discriminative ability than the total WBC count [36]. It is a simple and inexpensive test for assessing inflammation that is obtained by dividing the absolute neutrophil to absolute lymphocyte count [60].
Aside from diabetes, the NLR value is used to predict the prognosis of other inflammatory diseases, including cardiovascular disease [61], gestational diabetes mellitus [62], chronic obstructive pulmonary disease [63], hypertension [64], and colorectal cancer [65]. It has also proven its usefulness in the stratification of mortality in major cardiac events, as a strong prognostic factor in several types of cancer, or as a predictor and marker of inflammatory or infectious pathologies (such as pediatric appendicitis) and postoperative complications [66]. Increased NLR values and the risk of cardiovascular events are explained by neutrophils secreting inflammatory mediators that can cause vascular wall degeneration [67] and lymphocytes regulating the inflammatory response and acting as antiatherosclerotic agents [68]. Increased neutrophil and decreased lymphocyte count in hypertensive complications such as neuropathy, cardiomyopathy, and retinopathy occurred due to inflammatory response developed in the arterial walls due to elevated pressures [69, 70]. Recent evidence has shown that a high NLR value can be used to predict inhospital and postdischarge mortality in chronic obstructive pulmonary disease patients [63]. Elevated NLR and poor prognosis have been reported in different cancer patients due to inflammation-associated elevation of tumor-associated neutrophils or neutrophils which infiltrate tumors [71, 72].
Subgroup analysis of this study revealed that the duration of diabetes had no statistically significant difference in NLR value to predict glycemic control in diabetic patients. The findings were consistent with previous research [38, 41]. Though the pooled estimate did not show a significant difference in NLR between the poor and good glycemic control groups, studies by Chittawar et al. and Gubbala et al. found that the duration of T2DM and NLR were significantly involved in determining the glycemic control of DM patients [12, 73]. This is because T2DM patients are more likely to develop microvascular complications, which result in higher blood pressure, NLR, creatinine, and albumin levels as the illness progresses [73].
The current study has some strengths and limitations. The strength of the study is its comprehensive literature search by the two independent authors to extract all available published articles. To the best of our knowledge, this is the first systematic review and meta-analysis to address the association between NLR and glycemic control in T2DM patients. Even though we did metaregression, subgroup, and sensitivity analysis, the heterogeneity was high. This might be due to the inclusion of studies only in the English language. Besides, the study cannot address the prognostic and diagnostic role of NLR in the glycemic control of T2DM patients.
5. Conclusions and Recommendations
The results of this study showed that there was a higher NLR value in poor glycemic control patients than in their counterparts. This suggests an association of high NLR values with an elevated HbA1c in T2DM patients. Therefore, NLR should be considered a marker of glycemic control in addition to HbA1C in T2DM patients.
Abbreviations
- DM:
Diabetes mellitus
- HbA1c:
Plasma glycated hemoglobin
- IL-6:
Interleukin-6
- NLR:
Neutrophil-to-lymphocyte ratio
- SMD:
Standardized mean difference
- T2DM:
Type 2 diabetes mellitus.
Data Availability
All data generated or analyzed during this study are included in this published article.
Conflicts of Interest
The authors declare that they have no competing interests.
Authors' Contributions
Tiruneh Adane designed the study, did the searching, statistical analysis, and draft of the manuscript. Mulugeta Melku designed the study, performed the statistical analysis, and reviewed the manuscript. Yilkal Belete Worku designed the study, conducted the statistical analysis, and reviewed the manuscript. Melak Aynalem, Amanuel Kelem, and Alebachew Fasil designed the study, performed the statistical analysis, and reviewed the manuscript. Solomon Getawa designed the study, conducted the quality appraisal, and reviewed the manuscript. All the authors critically revised the paper and agreed to be accountable for all aspects of the work.
References
- 1.Tsalamandris S., Antonopoulos A. S., Oikonomou E., et al. The role of inflammation in diabetes: current concepts and future perspectives. European Cardiology Review . 2019;14(1):50–59. doi: 10.15420/ecr.2018.33.1. [DOI] [PMC free article] [PubMed] [Google Scholar]
- 2.American Diabetes Association. Diagnosis and classification of diabetes mellitus. Diabetes Care . 2004;27(supplement_1):s5–s10. doi: 10.2337/diacare.27.2007.S5. [DOI] [PubMed] [Google Scholar]
- 3.Liu S., Zheng H., Zhu X., et al. Neutrophil-to-lymphocyte ratio is associated with diabetic peripheral neuropathy in type 2 diabetes patients. Diabetes Research and Clinical Practice . 2017;130:90–97. doi: 10.1016/j.diabres.2017.05.008. [DOI] [PubMed] [Google Scholar]
- 4.Donath M. Y., Shoelson S. E. Type 2 diabetes as an inflammatory disease. Nature Reviews Immunology . 2011;11(2):98–107. doi: 10.1038/nri2925. [DOI] [PubMed] [Google Scholar]
- 5.Abdel-Moneim A., Semmler M., Abdel-Reheim E. S., Zanaty M. I., Addaleel W. Association of glycemic status and interferon-γ production with leukocytes and platelet indices alterations in type2 diabetes. Diabetes & Metabolic Syndrome: Clinical Research & Reviews . 2019;13(3):1963–1969. doi: 10.1016/j.dsx.2019.04.046. [DOI] [PubMed] [Google Scholar]
- 6.Aktas G., Kocak M. Z., Duman T. T., et al. Mean platelet volume (mpv) as an inflammatory marker in type 2 diabetes mellitus and obesity. Bali Medical Journal . 2018;7(3) doi: 10.15562/bmj.v7i3.806. [DOI] [Google Scholar]
- 7.Kocak M. Z., Aktas G., Erkus E., et al. Neuregulin-4 is associated with plasma glucose and increased risk of type 2 diabetes mellitus. Swiss Medical Weekly . 2019;43 doi: 10.4414/smw.2019.20139. [DOI] [PubMed] [Google Scholar]
- 8.Care, D. 6. Glycemic targets: standards of medical care in diabetes—2019. Diabetes Care . 2019;42(Supplement_1):s61–s70. doi: 10.2337/dc19-S006. [DOI] [PubMed] [Google Scholar]
- 9.Organization WHO. Glycated haemoglobin (HBA 1c) for the diagnosis of diabetes . Geneva, Switzerland: World Health Organization; 2011. [Google Scholar]
- 10.Rohlfing C. L., Wiedmeyer H. M., Little R. R., England J. D., Tennill A., Goldstein D. E. Defining the relationship between plasma glucose and HbA1c: analysis of glucose profiles and HbA1c in the diabetes control and complications trial. Diabetes Care . 2002;25(2):275–278. doi: 10.2337/diacare.25.2.275. [DOI] [PubMed] [Google Scholar]
- 11.Lyons T. J., Basu A. Biomarkers in diabetes: hemoglobin A1c, vascular and tissue markers. Translational Research . 2012;159(4):303–312. doi: 10.1016/j.trsl.2012.01.009. [DOI] [PMC free article] [PubMed] [Google Scholar]
- 12.Sefil F., Ulutas K. T., Dokuyucu R., et al. Investigation of neutrophil lymphocyte ratio and blood glucose regulation in patients with type 2 diabetes mellitus. Journal of Evidence Based Medicine and Healthcare . 2019;6(50):3137–3140. doi: 10.18410/jebmh/2019/657. [DOI] [PubMed] [Google Scholar]
- 13.Imtiaz F., Shafique K., Mirza S. S., Ayoob Z., Vart P., Rao S. Neutrophil lymphocyte ratio as a measure of systemic inflammation in prevalent chronic diseases in Asian population. International Archives of Medicine . 2012;5(1):2–6. doi: 10.1186/1755-7682-5-2. [DOI] [PMC free article] [PubMed] [Google Scholar]
- 14.Bilgin S., Aktas G., Zahid Kocak M., et al. Association between novel inflammatory markers derived from hemogram indices and metabolic parameters in type 2 diabetic men. The Aging Male . 2020;23(5):923–927. doi: 10.1080/13685538.2019.1632283. [DOI] [PubMed] [Google Scholar]
- 15.Aktaş G., Duman T. T., Atak B., et al. Irritable bowel syndrome is associated with novel inflammatory markers derived from hemogram parameters. Family Medicine and Primary Care Review . 2020;22(2):107–110. doi: 10.5114/fmpcr.2020.95311. [DOI] [Google Scholar]
- 16.Atak B. M., Kahveci G. B., Bilgin S., Kurtkulagi O., Kosekli M. A. Platelet to lymphocyte ratio in differentiation of benign and malignant thyroid nodules. Experimental Biomedical Research . 2021;4(2):148–153. doi: 10.30714/j-ebr.2021267978. [DOI] [Google Scholar]
- 17.Posul E., Yilmaz B., Aktas G., Kurt M. Does neutrophil-to-lymphocyte ratio predict active ulcerative colitis? Wiener Klinische Wochenschrift . 2015;127(7-8):262–265. doi: 10.1007/s00508-014-0683-5. [DOI] [PubMed] [Google Scholar]
- 18.Keskin H., Kaya Y., Cadirci K., et al. Elevated neutrophil-lymphocyte ratio in patients with euthyroid chronic autoimmune thyreotidis. Endocrine Regulations . 2016;50(3):148–153. doi: 10.1515/enr-2016-0017. [DOI] [PubMed] [Google Scholar]
- 19.Aktas G., Sit M., Dikbas O., et al. Elevated neutrophil-to-lymphocyte ratio in the diagnosis of Hashimoto's thyroiditis. Revista da Associação Médica Brasileira . 2017;63(12):1065–1068. doi: 10.1590/1806-9282.63.12.1065. [DOI] [PubMed] [Google Scholar]
- 20.Aktas G. Hematological predictors of novel coronavirus infection. Revista da Associação Médica Brasileira . 2021;67(suppl 1):1–2. doi: 10.1590/1806-9282.67.suppl1.20200678. [DOI] [PubMed] [Google Scholar]
- 21.Solak Y., Yilmaz M. I., Sonmez A., et al. Neutrophil to lymphocyte ratio independently predicts cardiovascular events in patients with chronic kidney disease. Clinical and Experimental Nephrology . 2013;17(4):532–540. doi: 10.1007/s10157-012-0728-x. [DOI] [PubMed] [Google Scholar]
- 22.Hussain M., Saeed M., Babar M. Z. M., Atif M. A., Akhtar L. Nebivolol attenuates neutrophil lymphocyte ratio: a marker of subclinical inflammation in hypertensive patients. International Journal of Hypertension . 2017;2017:6. doi: 10.1155/2017/7643628.7643628 [DOI] [PMC free article] [PubMed] [Google Scholar]
- 23.Chung K. P., Chang H. T., Lo S. C., et al. Severe lymphopenia is associated with elevated plasma interleukin-15 levels and increased mortality during severe sepsis. Shock . 2015;43(6):569–575. doi: 10.1097/SHK.0000000000000347. [DOI] [PubMed] [Google Scholar]
- 24.Fonseka T. M., McIntyre R. S., Soczynska J. K., Kennedy S. H. Novel investigational drugs targeting il-6 signaling for the treatment of depression. Expert Opinion on Investigational Drugs . 2015;24(4):459–475. doi: 10.1517/13543784.2014.998334. [DOI] [PubMed] [Google Scholar]
- 25.Xu T., Weng Z., Pei C., et al. The relationship between neutrophil-to-lymphocyte ratio and diabetic peripheral neuropathy in type 2 diabetes mellitus. Medicine . 2017;96(45):p. e8289. doi: 10.1097/MD.0000000000008289. [DOI] [PMC free article] [PubMed] [Google Scholar]
- 26.Azab B., Daoud J., Naeem F. B., et al. Neutrophil-to-lymphocyte ratio as a predictor of worsening renal function in diabetic patients (3-year follow-up study) Renal Failure . 2012;34(5):571–576. doi: 10.3109/0886022X.2012.668741. [DOI] [PubMed] [Google Scholar]
- 27.Luo P., Huang Y., Xu T., Ji Y., Yu N., He L. Relationship between hyperuricemia and neutrophil-to-lymphocyte ratio in type 2 diabetes mellitus. International Journal of Clinical and Experimental Pathology . 2016;9(10):10833–10838. [Google Scholar]
- 28.Balta S., Kurtoglu E., Kucuk U., Demirkol S., Ozturk C. Neutrophil–lymphocyte ratio as an important assessment tool. Expert Review of Cardiovascular Therapy . 2014;12(5):537–538. doi: 10.1586/14779072.2014.902309. [DOI] [PubMed] [Google Scholar]
- 29.Lee J. S., Kim N. Y., Na S. H., Youn Y. H., Shin C. S. Reference values of neutrophil-lymphocyte ratio, lymphocyte-monocyte ratio, platelet-lymphocyte ratio, and mean platelet volume in healthy adults in South Korea. Medicine . 2018;97(26):p. e11138. doi: 10.1097/MD.0000000000011138. [DOI] [PMC free article] [PubMed] [Google Scholar]
- 30.Moosazadeh M., Maleki I., Alizadeh-navaei R., et al. Normal values of neutrophil-to-lymphocyte ratio, lymphocyte-to-monocyte ratio and platelet-to-lymphocyte ratio among Iranian population: results of Tabari cohort. Caspian Journal of Internal Medicine . 2019;10(3):320–325. doi: 10.22088/cjim.10.3.320. [DOI] [PMC free article] [PubMed] [Google Scholar]
- 31.Akin S., Aydin Z., Yilmaz G., Aliustaoglu M., Keskin O. Evaluation of the relationship between glycaemic regulation parameters and neutrophil-to-lymphocyte ratio in type 2 diabetic patients. Diabetes . 2019;7(1):91–96. doi: 10.33590/emjdiabet/10311581. [DOI] [Google Scholar]
- 32.Page M. J., Mckenzie J. E., Bossuyt P. M., et al. The prisma 2020 statement: an updated guideline for reporting systematic reviews. BMJ . 2021;372 doi: 10.1136/bmj.n71. [DOI] [PMC free article] [PubMed] [Google Scholar]
- 33.Wells G., Shea B., O’connell D., et al. Newcastle–Ottawa quality assessment scale—case control studies. Ottawa: Ottawa Hospital Research Institute . 2017;2(1):1–2. [Google Scholar]
- 34.Hozo S. P., Djulbegovic B., Hozo I. Estimating the mean and variance from the median, range, and the size of a sample. BMC Medical Research Methodology . 2005;5(1):1–10. doi: 10.1186/1471-2288-5-13. [DOI] [PMC free article] [PubMed] [Google Scholar]
- 35.Dudani S., Poodury S., Mangalesh S. Study of neutrophil-lymphocyte ratio (NLR) in recent onset type 2 diabetes mellitus. Atherosclerosis . 2021;10(1):11–16. doi: 10.15562/bmj.v10i1.1780. [DOI] [Google Scholar]
- 36.Gn D., Raghavan L. Study of neutrophil lymphocyte ratio in patients with type 2 diabetes mellitus and its correlation with glycemic control. International Journal of Advances in Medicine . 2019;6(5):1637–1641. [Google Scholar]
- 37.Mendes B. B., Oliveira A. C. R., Alcântara K. C. D. Comparison of the neutrophil-to-lymphocyte and platelet-to-lymphocyte ratios in normoglycemic and hyperglycemic subjects. Einstein (São Paulo) . 2018;17 doi: 10.31744/einstein_journal/2019AO4403. [DOI] [PMC free article] [PubMed] [Google Scholar]
- 38.Hussain M., Babar M. Z. M., Akhtar L., Hussain M. S. Neutrophil lymphocyte ratio (NLR): a well assessment tool of glycemic control in type 2 diabetic patients. Pakistan Journal of Medical Sciences . 2017;33(6):1366–1370. doi: 10.12669/pjms.336.12900. [DOI] [PMC free article] [PubMed] [Google Scholar]
- 39.Madhavi Kemba S. S. Neutrophil-lymphocyte ratio: a risk predictor in patients with type 2 diabetes mellitus. International Journal of Physiology . 2017;5(1):p. 166. doi: 10.5958/2320-608X.2017.00037.3. [DOI] [Google Scholar]
- 40.Maham Liaqat R. N., Zafar M. Neutrophil lymphocyte ratio as an evaluation tool for the glycemic control in patients suffering from diabetes. Indo American Journal of Pharmaceutical Sciences . 2020;7(1):844–848. [Google Scholar]
- 41.Sefil F., Ulutas K. T., Dokuyucu R., et al. Investigation of neutrophil lymphocyte ratio and blood glucose regulation in patients with type 2 diabetes mellitus. Journal of International Medical Research . 2014;42(2):581–588. doi: 10.1177/0300060513516944. [DOI] [PubMed] [Google Scholar]
- 42.Kumar V. S., Aishwarya Ganga S. N., Anand A. S. Correlation of neutrophillymphocyte ratio with glycosylated hb in patients with type 2 diabetes mellitus. Indian Journal of Applied Research . 2020;10(9):1–4. doi: 10.36106/ijar/2609391. [DOI] [Google Scholar]
- 43.Assulyn T., Khamisy‐Farah R., Nseir W., Bashkin A., Farah R. Neutrophil-to-lymphocyte ratio and red blood cell distribution width as predictors of microalbuminuria in type 2 diabetes. Journal of Clinical Laboratory Analysis . 2020;34(7, article e23259) doi: 10.1002/jcla.23259. [DOI] [PMC free article] [PubMed] [Google Scholar]
- 44.Ahmad Abed Alnabi R. S., Hussain F. The relationship between neutrophil to lymphocyte ratio and glycemic control degree in patients with type 2 diabetes mellitus. 2020.
- 45.Palella E., Cimino R., Pullano S. A., et al. Laboratory parameters of hemostasis, adhesion molecules, and inflammation in type 2 diabetes mellitus: correlation with glycemic control. International Journal of Environmental Research and Public Health . 2020;17(1):p. 300. doi: 10.3390/ijerph17010300. [DOI] [PMC free article] [PubMed] [Google Scholar]
- 46.Arsa N. N. Relationship between neutrophil lymphocyte ratio and different levels of glycemic control in type 2 diabetic patients. World Journal of Pharmaceutical and Medical Research . 2019;5(3):344–347. [Google Scholar]
- 47.Duman T. T., Aktas G., Atak B. M., Kocak M. Z., Erkus E., Savli H. Neutrophil to lymphocyte ratio as an indicative of diabetic control level in type 2 diabetes mellitus. African Health Sciences . 2019;19(1):1602–1606. doi: 10.4314/ahs.v19i1.35. [DOI] [PMC free article] [PubMed] [Google Scholar]
- 48.Fawwad A., Butt A. M., Siddiqui I. A., Khalid M., Sabir R., Basit A. Neutrophil-to-lymphocyte ratio and microvascular complications in subjects with type 2 diabetes: Pakistan’s perspective. Turkish Journal of Medical Sciences . 2018;48(1):157–161. doi: 10.3906/sag-1706-141. [DOI] [PubMed] [Google Scholar]
- 49.Shiny A., Bibin Y. S., Shanthirani C. S., et al. Association of neutrophil-lymphocyte ratio with glucose intolerance: an indicator of systemic inflammation in patients with type 2 diabetes. Diabetes Technology & Therapeutics . 2014;16(8):524–530. doi: 10.1089/dia.2013.0264. [DOI] [PubMed] [Google Scholar]
- 50.Marques-Vidal P., Schmid R., Bochud M., et al. Adipocytokines, hepatic and inflammatory biomarkers and incidence of type 2 diabetes. the CoLaus study. PloS One . 2012;7(12, article e51768) doi: 10.1371/journal.pone.0051768. [DOI] [PMC free article] [PubMed] [Google Scholar]
- 51.Guo X., Zhang S., Zhang Q., et al. Neutrophil:lymphocyte ratio is positively related to type 2 diabetes in a large-scale adult population: a Tianjin chronic low-grade systemic inflammation and health cohort study. European Journal of Endocrinology . 2015;173(2):217–225. doi: 10.1530/EJE-15-0176. [DOI] [PubMed] [Google Scholar]
- 52.Van Oostrom A. J., Van Wijk J. P., Sijmonsma T. P., Rabelink T. J., Castro Cabezas M. Increased expression of activation markers on monocytes and neutrophils in type 2 diabetes. The Netherlands Journal of Medicine . 2004;62(9):320–325. [PubMed] [Google Scholar]
- 53.Berliner S., Rogowski O., Rotstein R., et al. Activated polymorphonuclear leukocytes and monocytes in the peripheral blood of patients with ischemic heart and brain conditions correspond to the presence of multiple risk factors for atherothrombosis. Cardiology . 2000;94(1):19–25. doi: 10.1159/000007041. [DOI] [PubMed] [Google Scholar]
- 54.Pertyńska-Marczewska M., Kiriakidis S., Wait R., Beech J., Feldmann M., Paleolog E. M. Advanced glycation end products upregulate angiogenic and pro-inflammatory cytokine production in human monocyte/macrophages. Cytokine . 2004;28(1):35–47. doi: 10.1016/j.cyto.2004.06.006. [DOI] [PubMed] [Google Scholar]
- 55.Shurtz-Swirski R., Sela S., Herskovits A. T., et al. Involvement of peripheral polymorphonuclear leukocytes in oxidative stress and inflammation in type 2 diabetic patients. Diabetes Care . 2001;24(1):104–110. doi: 10.2337/diacare.24.1.104. [DOI] [PubMed] [Google Scholar]
- 56.Fontana G., Lapolla A., Sanzari M., et al. An immunological evaluation of type II diabetic patients with periodontal disease. Journal of Diabetes and its Complications . 1999;13(1):23–30. doi: 10.1016/S1056-8727(98)00021-X. [DOI] [PubMed] [Google Scholar]
- 57.Moursy E. Y., Megallaa M. H., Mouftah R. F., Ahmed S. M. Relationship between neutrophil-lymphocyte ratio and microvascular complications in Egyptian patients with type 2 diabetes. American Journal of Medicine . 2015;3(6):250–255. doi: 10.11648/j.ajim.20150306.16. [DOI] [Google Scholar]
- 58.Gallagher E. J., Le Roith D., Bloomgarden Z. Review of hemoglobin A1c in the management of diabetes. Journal of Diabetes . 2009;1(1):9–17. doi: 10.1111/j.1753-0407.2009.00009.x. [DOI] [PubMed] [Google Scholar]
- 59.Assessment G. 6. Glycemic targets: standards of medical care in diabetes 2021. Diabetes Care . 2021;44, article s73(Supplement_1):S73–S84. doi: 10.2337/dc21-S006. [DOI] [PubMed] [Google Scholar]
- 60.Yuksel M., Yildiz A., Oylumlu M., et al. Novel markers of endothelial dysfunction and inflammation in Behçet's disease patients with ocular involvement: epicardial fat thickness, carotid intima media thickness, serum ADMA level, and neutrophil-to-lymphocyte ratio. Clinical Rheumatology . 2016;35(3):701–708. doi: 10.1007/s10067-015-2907-0. [DOI] [PubMed] [Google Scholar]
- 61.Angkananard T., Anothaisintawee T., McEvoy M., Attia J., Thakkinstian A. Neutrophil lymphocyte ratio and cardiovascular disease risk: a systematic review and meta-analysis. BioMed Research International . 2018;2018:11. doi: 10.1155/2018/2703518.2703518 [DOI] [PMC free article] [PubMed] [Google Scholar]
- 62.Pace N. P., Vassallo J. Association bbetween neutrophil-lymphocyte ratio and gestational diabetes—a systematic review and meta-analysis. Journal of the Endocrine Society . 2021;5(7) doi: 10.1210/jendso/bvab051. [DOI] [PMC free article] [PubMed] [Google Scholar]
- 63.Paliogiannis P., Fois A. G., Sotgia S., et al. Neutrophil to lymphocyte ratio and clinical outcomes in COPD: recent evidence and future perspectives. European Respiratory Review . 2018;27(147, article 170113) doi: 10.1183/16000617.0113-2017. [DOI] [PMC free article] [PubMed] [Google Scholar]
- 64.Belen E., Sungur A., Sungur M. A., Erdoğan G. Increased neutrophil to lymphocyte ratio in patients with resistant hypertension. The Journal of Clinical Hypertension . 2015;17(7):532–537. doi: 10.1111/jch.12533. [DOI] [PMC free article] [PubMed] [Google Scholar]
- 65.Walsh S. R., Cook E. J., Goulder F., Justin T. A., Keeling N. J. Neutrophil-lymphocyte ratio as a prognostic factor in colorectal cancer. Journal of Surgical Oncology . 2005;91(3):181–184. doi: 10.1002/jso.20329. [DOI] [PubMed] [Google Scholar]
- 66.Forget P., Khalifa C., Defour J. P., Latinne D., Van Pel M. C., De Kock M. What is the normal value of the neutrophil-to-lymphocyte ratio? BMC Research Notes . 2017;10(1):1–4. doi: 10.1186/s13104-016-2335-5. [DOI] [PMC free article] [PubMed] [Google Scholar]
- 67.Ikeda U., Ikeda M., Oohara T., Kano S., Yaginuma T. Mitogenic action of interleukin-1α on vascular smooth muscle cells mediated by PDGF. Atherosclerosis . 1990;84(2-3):183–188. doi: 10.1016/0021-9150(90)90089-2. [DOI] [PubMed] [Google Scholar]
- 68.Simpson E., Cantor H. Regulation of the immune response by subclasses of T lymphocytes. II. The effect of adult thymectomy upon humoral and cellular responses in mice. European Journal of Immunology . 1975;5(5):337–343. doi: 10.1002/eji.1830050509. [DOI] [PubMed] [Google Scholar]
- 69.Srinivasagopalane B., Andrew Rajarathinam S., Balasubramaiyan T. Clinical pertinence of neutrophil-to- lymphocyte ratio among hypertensives with different grades and duration of hypertension – an insight. Clinical and Experimental Hypertension . 2019;41(4):394–399. doi: 10.1080/10641963.2018.1510942. [DOI] [PubMed] [Google Scholar]
- 70.Jhuang Y. H., Kao T. W., Peng T. C., et al. Neutrophil to lymphocyte ratio as predictor for incident hypertension: a 9-year cohort study in Taiwan. Hypertension Research . 2019;42(8):1209–1214. doi: 10.1038/s41440-019-0245-3. [DOI] [PMC free article] [PubMed] [Google Scholar]
- 71.Templeton A. J., McNamara M. G., Šeruga B., et al. Prognostic role of neutrophil-to-lymphocyte ratio in solid tumors: a systematic review and meta-analysis. JNCI: Journal of the National Cancer Institute . 2014;106(6) doi: 10.1093/jnci/dju124. [DOI] [PubMed] [Google Scholar]
- 72.Jensen H. K., Donskov F., Marcussen N., Nordsmark M., Lundbeck F., von der Maase H. Presence of intratumoral neutrophils is an independent prognostic factor in localized renal cell carcinoma. Journal of Clinical Oncology . 2009;27(28):4709–4717. doi: 10.1200/JCO.2008.18.9498. [DOI] [PubMed] [Google Scholar]
- 73.Chittawar S., Dutta D., Qureshi Z., Surana V., Khandare S., Dubey T. N. Neutrophil-lymphocyte ratio is a novel reliable predictor of nephropathy, retinopathy, and coronary artery disease in Indians with type-2 diabetes. Indian Journal of Endocrinology and Metabolism . 2017;21(6):864–870. doi: 10.4103/ijem.IJEM_197_17. [DOI] [PMC free article] [PubMed] [Google Scholar]
Associated Data
This section collects any data citations, data availability statements, or supplementary materials included in this article.
Data Availability Statement
All data generated or analyzed during this study are included in this published article.


