

Abstract
Traditional methods do not capture the multidimensional domains and dynamic nature of infant behavioral patterns. We aim to compare full-day, in-home leg movement data between infants with typical development (TD) and infants at risk of developmental disabilities (AR) using barcoding and nonlinear analysis. Eleven infants with TD (2–10 months) and nine infants AR (adjusted age: 2–14 months) wore a sensor on each ankle for 7 days. We calculated the standard deviation for linear variability and sample entropy (SampEn) of leg acceleration and angular velocity for nonlinear variability. Movements were also categorized into 16 barcoding states, and we calculated the SampEn and proportions of the barcoding. All variables were compared between the two groups using independent-samples t-test or Mann-Whitney U test. The AR group had larger linear variability compared to the TD group. SampEn was lower in the AR group compared to TD group for both acceleration and angular velocity. Two barcoding states’ proportions were significantly different between the two groups. The results showed that nonlinear analysis and barcoding could be used to identify the difference of dynamic multidimensional movement patterns between infants AR and infants with TD. This information may help early diagnosis of developmental disabilities in the future.
1 |. INTRODUCTION
Infants’ spontaneous movements during infancy are related to their developmental outcomes later in life (Bultmann et al., 2019; Butcher et al., 2009; Hadders-Algra et al., 1997; Karch et al., 2012; Miyagishima et al., 2018). Moreover, spontaneous movements show different forms at different ages and are influenced by brain structure and maturational level (Kobesova & Kolar, 2014; Prechtl, 1997). Atypical brain development often leads to atypical behavioral patterns early in life. As a result, spontaneous movements are being assessed in clinics early on to assess infants at risk of developmental disabilities (AR) (Einspieler & Prechtl, 2005; Luttikhuizen dos Santos et al., 2013). However, due to the subjectivity of observational assessments, these assessments normally need a great amount of reliability training and may be difficult to use in low-resource settings.
The fast development and increasing popularity of wearable technologies bring the opportunity to quantitatively measure infant spontaneous movements in an objective way. With a high accuracy in measuring infants’ spontaneous movements using wearable sensors, we may be able to quantify their functional skills instead of a subjective qualitative perception. Researchers are even able to reconstruct infant spontaneous movements in a 3D space with advanced algorithms (Jeong et al., 2021). Wearable technologies allow researchers to measure infant behavior over a long period of time. Since infant behavior is highly variable (Adolph et al., 2015; Thelen, 1995), a longer assessment in their familiar home environment is believed to be more reflective of their true developmental level than a short session during a clinic visit (Abrishami et al., 2019). Wearable technologies also have the potential to help with early diagnosis, and predict an infant’s neuromotor developmental outcome (Abrishami et al., 2019; Airaksinen et al., 2022; Shida-tokeshi et al., 2018; Wilson et al., 2021), monitor infant development across time, and provide real-time adjustment of intervention strategies using a cloud-based algorithm that can process sensor data in time and provide individualized feedback accordingly (Deng et al., 2020).
With the enormous amount of data available from wearable technology, researchers are still developing methods to extract meaningful information from infant behavior. An important parameter for infant behavior analysis is its variability. Movement variability was once perceived to represent noise in the motor system and is now believed to be essential to movement organization and execution, especially for infants. It is proposed that infants select various movement patterns during motor development and dynamically select the patterns that have more adaptive values over time as they develop motor skills (Manoel & Connolly, 1995).
Traditionally, analysis of infant behavioral data from wearable technologies has focused on movement frequency, intensity, and magnitude of variability. Modern wearable sensors can be equipped with multiple devices, such as inertial measurement units (IMU), electromyography (EMG), heart rate, and respiratory monitors. IMU and EMG can be employed to analyze movement patterns and muscle synergies, respectively, using linear methods (Bekius et al., 2021; Trujillo-Priego & Smith, 2017). These linear methods are adopted to measure the amount or magnitude of change. However, none of these methods capture the dynamic nature (the evolution of movement behavior across time) and multidimensional domains of infant behavioral patterns (Harbourne & Stergiou, 2009).
Traditional linear methods measure the change of magnitude, such as the distance a movement traveled, the value of velocity, and acceleration. Linear variability may be different between infants with typical development (TD) and infants AR with the atypical range of motion and muscle power due to high or low muscle tone (de Groot et al., 1993; Jeffries et al., 2019). Linear parameters are the most used parameters and they are easy to interpret. However, linear methods do not consider the temporal structure of movement patterns or how each movement interacts with other movements in the highly adaptive and complex motor control system.
Nonlinear methods, on the other hand, describe how movement patterns change over time and consider that each movement is influenced by the previous and the latter movements (Stergiou et al., 2006). An optimal movement pattern is one with the right amount of complexity and predictability (Stergiou & Decker, 2011). Decreased complexity and predictability lead to random uncontrolled movements, while too much predictability leads to periodic and rigid movement patterns. For the dynamic nature of infants’ highly variable behavior, nonlinear analysis of infant behavior has shown promising results identifying differences between infants with TD and infants with or at risk of AR (Deffeyes et al., 2009; Smith et al., 2017). It is hypothesized that neurological deficits contributed to this atypical movement adaptation (Dusing & Harbourne, 2010). Previous literature using non-linear analysis only assessed infant movement variability within a laboratory setting or a short in-home session. In this study, we aim to measure infant leg movement non-linear variability in an ecological approach, consisting recordings across full days in the home environment.
However, both linear and nonlinear methods only focus on one aspect of movement patterns at a time, which could potentially lead to incomplete or even misleading interpretation as the whole is often more than the sum of its parts. Barcoding is a promising method to describe infant’s motor behavior from multiple domains. This method was developed by Paraschiv-Ionescu to assess chronic pain conditions in adults (Paraschiv-Ionescu et al., 2012). It has also been used to describe physical activity in children and adolescents with cerebral palsy (Gerber et al., 2020). This method considers human behavior as a system in constantly changing states, where each state is a combination of different aspects of behavioral data and is assigned a unique number (Paraschiv-Ionescu et al., 2012). With a string of barcoding numbers, we can recreate the temporal and spatial structure of infant behavior. For example, we can use 1 to represent a fast-reaching movement and 2 to represent a slow-kicking movement. By connecting them together as 1-2-1, we can get an idea of a string of behavior generated as fast reaching—slow kicking—fast reaching. Both the time order and characteristics are included in simple barcodes. This method has the potential to fill in any dimensions we think are important. By combining both linear and nonlinear dimensions, we could potentially demonstrate the difference in a higher dimension that is not obvious or observable in a single dimension. Including all of the information may give us a more comprehensive knowledge of typical and atypical behavior, and how to correct the atypical movement patterns. To our knowledge, the current study is the first to apply this method to analyze infant movement patterns.
Our aim is to apply a linear method, a nonlinear method, and barcoding analyses to compare full-day, in-home leg movement patterns recorded from wearable sensors in TD and AR infants. We hypothesize that infants in these two groups will show different characteristics of leg movement patterns by applying the abovementioned three methods.
2 |. METHOD
2.1 |. Participants
A total of 11 infants with TD within 1–10 months of age (mean [SD]: 114 [72] days) and 16 infants AR within 2–14 months of age (adjusted for prematurity as appropriate, mean [SD]: 268 [126] days) with similar motor developmental level, participated in this cross-sectional study. The TD group was recruited by fliers and word of mouth in the Greater Los Angeles area. Inclusion criteria for the TD group were singleton, full-term births. Exclusion criteria for the TD group was an Alberta Infant Motor Scale (AIMS) score 10th percentile or less (Verdú Pérez & Montes Gonzalo, 1996). Infants with any known visual, orthopedic, or neurological impairment were also excluded from the TD group. The AR group was recruited from Children’s Hospital Los Angeles Newborn Follow-Up Program. Inclusion criteria for the AR group followed the criteria set for high-risk infant follow-up services in the State of California (Eligibility Criteria, 2018), which led to a heterogeneous group (e.g., preterm, low birth weight), with potentially heterogeneous developmental levels, but representing the typical population distribution in clinical settings. Infants with unstable medical conditions were excluded. Because we controlled for the motor developmental level, the AIMS score in the two groups did not have significant difference (AR group mean [SD]: 28.3 [17.6]; TD group mean [SD]: 16.9 [12.5], p = .13).
2.2 |. Procedure
This research was conducted according to guidelines of Declaration of Helsinki. A parent or legal guardian signed an informed consent form before their infant’s participation. All procedures involving human subjects in this study were approved by the Institutional Review Board of the University of Southern California (HS-16-00170). Data was collected at participants’ homes using Opal wearable sensors (APDM Inc.). Each sensor weighed 22 g with a dimension of 48.4 × 36.1 × 13.4 mm (L × W × H). One sensor was put on infant’s each ankle to record the legs’ tri-axial acceleration and angular velocity data at 20 Hz. Each sensor was labeled left and right. Caregivers were instructed to put the sensors on the infants in the morning and take the sensors off to charge overnight when putting their infants to sleep at night for 7 consecutive days. Caregivers were also instructed to take the sensors off when the infants were in water, such as during baths. Given the ecological settings of this study, the families were also instructed to maintain their typical daily lifestyle. A daily survey was provided to the caregivers to record whether each day was a typical day for the infants and record the time they put on or took off the sensors. We measured the infants’ anthropometrics (head circumference, body length and weight) and assessed their motor development using the AIMS. We scheduled another 7 days of data collection for some infants if the first week did not generate enough data for several reasons (e.g., infant was sick, sensors were not placed on the infant). However, a complete set of 7 recording days after 2 weeks was not always possible.
2.3 |. Data pre-processing
Based on previous studies, 2 days of sensor recordings is the optimal amount of data to represent typical daily motor behavior for both infants with TD and AR (Deng et al., 2019, 2020). We then decided to choose the first two typical days (per caregiver’s survey response) of data with at least 8 h of awake time each day for analysis here. This led to a final sample of 11 infants with TD and 9 infants AR. Individual demographic information for the AR group is shown in Table 1. Summarized information for each group is shown in Table 2. The total recorded hours for each infant are shown in Table 3.
TABLE 1.
Mapping infant leg movement characteristics into each barcoding state based on leg movement type, peak acceleration magnitude, peak angular velocity magnitude and duration.
| Barcoding state | Leg movement type | Peak acceleration: > or < median value | Peak angular velocity: > or < median value | Duration: > or < median value |
|---|---|---|---|---|
| 1 | Unilateral | < | < | < |
| 2 | Unilateral | < | < | > |
| 3 | Unilateral | < | > | < |
| 4 | Unilateral | < | > | > |
| 5 | Unilateral | > | < | < |
| 6 | Unilateral | > | < | > |
| 7 | Unilateral | > | > | < |
| 8 | Unilateral | > | > | > |
| 9 | Bilateral | < | < | < |
| 10 | Bilateral | < | < | > |
| 11 | Bilateral | < | > | < |
| 12 | Bilateral | < | > | > |
| 13 | Bilateral | > | < | < |
| 14 | Bilateral | > | < | > |
| 15 | Bilateral | > | > | < |
| 16 | Bilateral | > | > | > |
TABLE 2.
Health status, anthropometric measurements, and motor developmental level for infants at risk of developmental disabilities.
| Infant | Health status summary | Gestational age at birth (weeks) | Chronological age (days) | Adjusted age (days) | Sex (M = male, F = female) | Weight (kg) | Body length (cm) | Head circumference (cm) | AIMS (total) | AIMS (percentile) |
|---|---|---|---|---|---|---|---|---|---|---|
| 1 | Preterm, short gut syndrome | 25 | 495 | 395 | F | 8.22 | 78.0 | 42.4 | 24 | <5 |
| 2 | Preterm | 26 | 234 | 137 | M | 6.07 | 59.5 | 41.8 | 14 | 10–25 |
| 3 | Preterm | 24 | 441 | 333 | F | 6.49 | 68.5 | 42.0 | 49 | 25–50 |
| 4 | Congenital heart defects | 41 | 262 | NA | M | 8.02 | 67.0 | 45.0 | 33 | 10–25 |
| 5 | Preterm, gets breathing treatment | 35 | 273 | 239 | F | 9.22 | 68.0 | 44.0 | 40 | 50–75 |
| 6 | Preterm, gastroparesis | 28 | 498 | 417 | F | 7.49 | 68.5 | 45.2 | 58 | 75–90 |
| 7 | Preterm, on ventilator and feeding tube | 33 | 147 | 114 | M | 6.46 | 62.5 | 41.0 | 13 | 25–50 |
| 8 | Preterm | 29 | 306 | 233 | M | 9.07 | 66.0 | 46.0 | 16 | <5 |
| 9 | DiGeorge syndrome | 40 | 85 | NA | M | 5.01 | 51 | 40 | 8 | 10–25 |
Abbreviation: AIMS, Alberta Infant Motor Scale.
TABLE 3.
Summarized characteristics for the TD and AR groups (mean ± SD).
| Group | TD | AR | ρ |
|---|---|---|---|
| Age/adjusted age (days) | 113.45 ± 73.40 | 267.44 ± 129.86 | 0.008 |
| Sex | 4 females, 5 males | 3 females, 8 males | 0.642 |
| Race | 8 White, 2 other, 1 declined | 4 White, 2 other, 2 declined, 1 Black | |
| AIMS (total) | 28.33 ± 17.64 | 16.91 ± 12.54 | 0.124 |
| Gestational age (weeks) | 31.22 ± 6.36 | 39.27 ± 1.27 | 0.015 |
| Head circumference (cm) | 43.04 ± 2.08 | 40.93 ± 2.10 | 0.037 |
| Body length (cm) | 65.44 ± 7.40 | 62.97 ± 6.42 | 0.442 |
| Weight (kg) | 7.34 ± 1.43 | 7.13 ± 2.05 | 0.791 |
| Total recorded hours | 19.58 ± 1.84 | 19.06 ± 1.81 | 0.717 |
| Number of active segments | 136 ± 25 | 123 ± 24 | 0.783 |
Abbreviations: AIMS, Alberta Infant Motor Scale; AR, developmental disabilities; TD, typical development.
2.4 |. Linear and nonlinear analysis
The recordings of infant’s leg movement data were downloaded from the sensors after the data collection using Motion Studio software (APDM Inc.). We calculated the leg movement parameters using a previously validated algorithm (Smith et al., 2015; Trujillo-Priego & Smith, 2017). The algorithm first determined the threshold for a movement based on the whole day recording. The threshold was determined by calculating the mean minus the standard deviation of all of the acceleration peak magnitudes between 1 and 3.25 m/s2. The minimal threshold variation considers the unique statistical properties of infant movements as well as environmental noise. The start and end of each movement were determined based on the threshold crossings. A new leg movement was counted each time the infant paused or changed the direction of the leg movement. Finally, the duration, peak acceleration, and peak angular velocity for each leg movement was determined.
From the full-day recording, we divided the continuous data into 5-min segments, and only active portions of data that included at least 50 movements, further averaged, were included for the analysis (Wilson et al., 2021). The number of active segments for each infant is shown in Table 3. This method has been shown to yield data segments with high concentration of motor behavioral and more salient movement patterns from the full-day recording (Wilson et al., 2021).
To determine the linear variability of the leg movements, we calculated the standard deviations of peak acceleration and peak angular velocity for all movements during each active segment and then averaged each variable across all the active segments from the 2 recording days. To determine the non-linear variability of the leg movement, we used sample entropy (SampEn) for the continuous acceleration and angular velocity data. SampEn has been widely used to assess the complexity of physiological time-series signals for the past decade (Richman & Moorman, 2000; Smith et al., 2017). It measures the regularity of time series by quantifying the occurrence of similar sub-patterns in the data. The leg movement data recorded using the wearable sensor have been found to be deterministic (with order) rather than stochastic (random) (Smith et al., 2017). We calculated SampEn using the algorithm from Richman and Moorman (2000). The vector length (m) and the relative tolerance limit (r) were set at 2 and .2, respectively. Leg movements and SampEn analyses were performed using MATLAB (The MathWorks Inc.).
To summarize the data preparation procedure for measuring linear and non-linear variability, we: (1) selected data from infants who provided two full days of recordings, (2) divided each full-day data into 5-min segments and select only the active segments for further analysis, (3) calculated SampEn for acceleration and angular velocity, (4) calculated standard deviation of peak acceleration and angular velocity for each active segment, (5) averaged each variable in all active segments for each leg from each day, and (6) averaged the results from the 2 full days of recordings.
2.5 |. Barcoding analysis
For barcoding analysis, we need to identify several dimensions that are most meaningful from full day recordings of leg movement (Paraschiv-Ionescu et al., 2012). We decided to use four dimensions: peak acceleration (low/high), peak angular velocity (low/high), duration (short/long), and movement type (unilateral/bilateral leg movement). We chose these four dimensions as these are among the most commonly used parameters to measure infant movement. Previous literature demonstrated these parameters showed differences between infants with TD and infants at risk of AR, and between infants with various developmental outcomes (Abrishami et al., 2019; Deng et al., 2018; Shida-tokeshi et al., 2018; Zuzarte et al., 2020). Since this was the first time that a barcoding method was applied to capture multi-dimensionality of leg movements in infants, we separated each variable into a dichotomous system for a relatively easy interpretation. After we identified all movements from a single full day recording, we calculated the median of all movements’ peak acceleration, peak angular velocity, and duration for each infant. The averaged value of all the median values from each infant in the TD group was used as the strategy to separate peak acceleration, peak angular velocity, and duration into a dichotomous system in order to define the barcoding states. Regarding the movement type, a unilateral leg movement is determined as only one leg is moving during the whole movement period, whereas a bilateral movement is determined if both legs were moving concurrently during some portion of the leg movement period. Each leg movement was represented as a combination of these different dimensions. All the calculation was performed using a MATLAB script (The MathWorks Inc.).
Since each of the four dimensions has two possible values, this leads to 16 possible combinations. Each combination is a barcoding state. A numerical symbol was then assigned to each barcoding state as listed in Table 4. Figure 1 is a visualized chart to help illustrate the change of barcoding states across movements.
TABLE 4.
Total recorded hours and number of active segments for each infant.
| Infant | Total hours recorded | Total active 5-min segments |
|---|---|---|
| TD 1 | 23.78 | 121 |
| TD 2 | 20.43 | 159 |
| TD 3 | 18.39 | 131 |
| TD 4 | 17.71 | 117 |
| TD 5 | 18.90 | 185 |
| TD 6 | 20.65 | 144 |
| TD 7 | 20.61 | 144 |
| TD 8 | 19.33 | 132 |
| TD 9 | 18.49 | 86 |
| TD 10 | 20.04 | 132 |
| TD 11 | 17.02 | 147 |
| AR 1 | 16.88 | 148 |
| AR 2 | 22.44 | 113 |
| AR 3 | 18.90 | 105 |
| AR 4 | 19.17 | 136 |
| AR 5 | 20.72 | 87 |
| AR 6 | 16.42 | 139 |
| AR 7 | 19.16 | 158 |
| AR 8 | 19.16 | 100 |
| AR 9 | 18.71 | 122 |
Abbreviations: AR, developmental disabilities; TD, typical development.
FIGURE 1.

Visualization of barcoding states with a color-coded chart and a line chart illustrating the number 1000th movement to the number 1030th movement for a single infant during a day.
To capture infant leg movement behavior during a full day, we assigned a barcoding state to each movement and then concatenated all the barcoding states chronologically from the time domain. This generated around 10,000 barcoding states for each leg and each full-day recording. We used SampEn to determine the structural complexity of the barcoding states. We also measured the proportion of each barcoding state to demonstrate the variety of each movement type.
2.6 |. Statistical analysis
Comparisons between TD and AR groups for each leg were performed using the averaged recordings from two full days, level of significance was to α = .05. Shapiro-Wilk tests were used to determine whether each variable was normally distributed. Parametric methods were used for normally distributed data and non-parametric methods were used for non-normally distributed data. Independent-samples t-tests were used to compare the age, gestational age, weight, body length, AIMS score, and head circumference between the two groups. Chi-square test was used to compare sex between groups. To compare the linear variability of each leg between AR and TD group, we compared the standard deviation of peak acceleration and angular velocity using independent-samples t-test. To compare the non-linear variability of each leg between the two groups, we compared the SampEn of peak acceleration and peak angular velocity using Mann-Whitney U test. To compare the structural complexity of barcoding states, we used independent-samples t-test. The differences between two legs in each group were tested using paired-t test. We also compared the proportion of each barcoding state between the two groups using Mann-Whitney U test. We did not adjust the significance level since this is an exploratory analysis. We also calculated the effect size for each hypothesis (Cohen’s d for normally distributed variables and Pearson’s r for non-normally distributed variables). All statistical analyses were conducted using MATLAB (The MathWorks Inc).
3 |. RESULTS
There was a significant difference of age (TD group: 113.45 ± 73.40 days; AR group: 267.44 ± 129.86 days) between the two groups with p = .008. However, we did not find a significant difference of AIMS score between the two groups (TD group: 28.33 ± 17.64; AR group: 16.91 ± 12.54, p = .124).
3.1 |. Linear variability
As shown in Figure 2, the AR group (mean [SD], left leg: 3.359 [0.682], right leg: 3.314 [0.674]) had significant larger standard deviation of the leg movement peak acceleration compared to the TD group (left leg: 2.556 [0.656], right leg: 2.495 [0.587]) with p = .015, t = 2.678, df = 18, effect size = 1.20 (large effect for Cohen’s d) for left leg and p = .009, t = 2.906, df = 18, effect size = 1.31 (large effect for Cohen’s d) for right leg, respectively. The AR group also had larger standard deviation of the leg movement angular velocity compared to the TD group on the right leg (mean [SD], AR: 1.956 [0.269]; TD: 1.690 [0.290], p = .049, t = 2.114, df = 18, effect size = 0.95 [large effect for Cohen’s d]) but not the left leg (AR: 1.955 [0.251]; TD: 1.703 [0.371], p = .010, t = 1.736, df = 18).
FIGURE 2.

(a) Standard deviation of peak acceleration of movements for AR and TD groups in both left leg and right leg. (b) Standard deviation of peak angular velocity of movements for AR and TD groups in both left leg and right leg. *p < .05. AR, developmental disabilities; TD, typical development.
3.2 |. Nonlinear variability
As shown in Figure 3, there were significant differences of leg movement acceleration SampEn between the AR group (left leg: 0.309 [0.044], right leg: 0.310 [0.052]) and TD group (left leg: 0.400 [0.090], right leg: 0.394 [0.075]) (U = 17, p = .012 for both legs), effect size = −0.12 (small effect for Pearson’s r). Similarly, the SampEn of angular velocity also demonstrated significant differences between the AR group (mean [SD], left leg: 0.278 [0.054], right leg: 0.276 [0.056]) and the TD group (left leg: 0.370 [0.075], right leg: 0.368 [0.067]) (U = 14, p = .006, effect size = −0.13 [small effect for Pearson’s r], and U = 11, p = .002, effect size = −0.15 [small effect for Pearson’s r], respectively).
FIGURE 3.
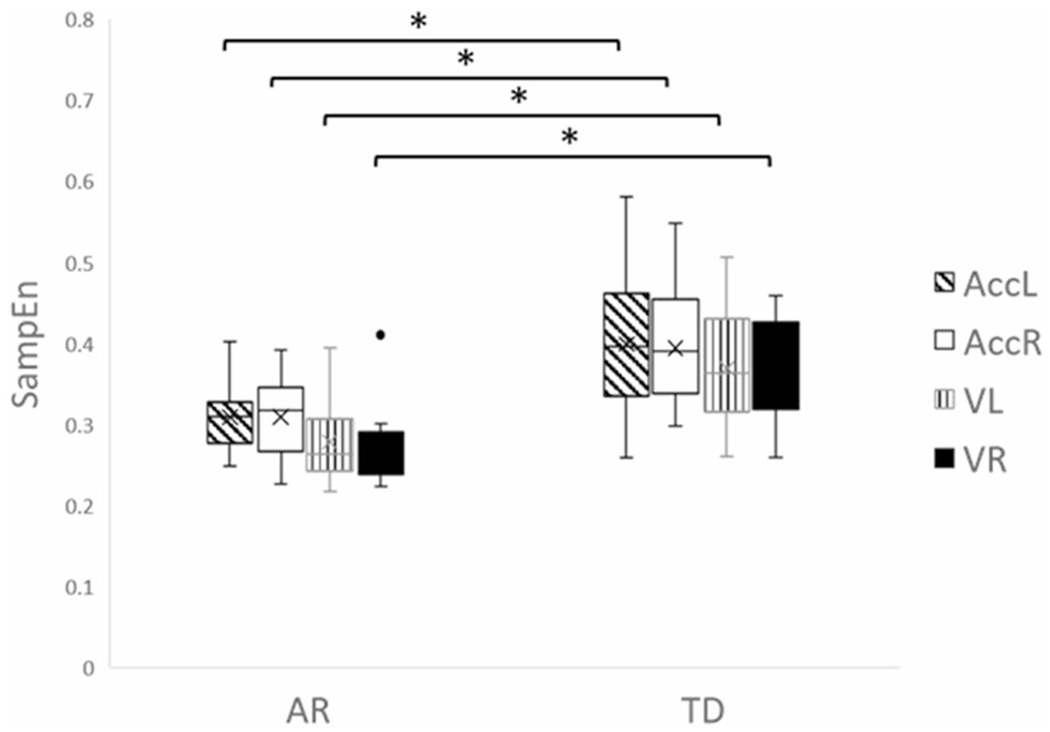
SampEn of acceleration and angular velocity data for AR and TD groups in both left leg and right legs. *p < .05. AccL, left leg acceleration; AccR, right leg acceleration; AR, developmental disabilities; TD, typical development; VL, left leg angular velocity; VR, right leg angular velocity.
3.3 |. Barcoding
The averaged value of all the median values from each infant in the TD group (median peak acceleration: 2.922 m/s2; median peak angular velocity: 2.073 m/s; median duration: 4.86 s) was used to separate each variable into a dichotomous system to define the barcoding states. Figure 4 illustrates that, for the SampEn of barcoding states, we did not find a significant difference between the AR group (left leg: 1.70 [0.36], right leg: 1.36 [0.29]) and the TD group (left leg: 1.55 [0.47], right leg: 1.16 [0.36]) for left (p = .446, t = 0.779, df = 18) and right legs (p = .180, t = 1.396, df = 18). However, we found significant differences between the left and right leg within the AR and the TD groups (p = .004, t = 3.925, df = 8, effect size = 1.31 [large effect for Cohen’s d], and p = .011, t = 3.133, df = 10, effect size = 1.04 [large effect for Cohen’s d], respectively).
FIGURE 4.

SampEn of barcoding states in both legs in each group. *p < .05.
As shown in Figure 5, by comparing the proportion of each barcoding state between the two groups, we found state 8 (unilateral movement with large peak acceleration, large angular velocity and long movement duration) and 14 (bilateral leg movement with large peak acceleration, small angular velocity, and long movement duration) were significantly different between the AR and the TD groups for both left (AR 8: 0.12 [0.02], TD 8: 0.09 [0.03], AR 14: 0.04 [0.02], TD 14: 0.09 [0.07]) and right legs (AR 8: 0.09 [0.03], TD 8: 0.06 [0.02], AR 14: 0.05 [0.03], TD 14: 0.09 [0.08]) with U values of 20, 20, 20 and 21, and p values of .025, .025, .025 and .031, effect sizes of −0.11 (small effect for Pearson’s r), respectively.
FIGURE 5.

The proportion of barcoding states 8 and 14 in both legs in each group. *p < .05. L14, left leg with state 14; L8, left leg with state 8; R14, right leg with state 14; R8, right leg with state 8.
4 |. DISCUSSION
The aim of this study was to apply linear, nonlinear and barcoding methods to compare full-day, in-home leg movement recordings collected by means of wearable sensors between infants with TD and infants AR. We hypothesized different leg movements pattern between these two groups. Our findings showed that the infants AR had higher linear variability and lower nonlinear variability of leg movement patterns compared to the infants with TD. Barcoding analysis revealed further significant differences between these two groups. Our findings suggest that barcode states can represent a useful tool to describe the multidimensional structure of infants’ motor behavior. To our knowledge, this is the first time that barcode analysis has been employed for this purpose.
4.1 |. Linear variability
Previous literature suggested that infants born preterm exhibit different leg movement linear variability compared to infants with TD. For example, infants born preterm with delayed motor development at 3 years of age have higher kurtosis of acceleration of arms and legs at term age than the infants with TD (Kanemaru et al., 2013). Similarly, our results showed that AR group’s leg movements has larger linear variability of acceleration than infants with TD. Other literature, showed that several lower limbs’ parameters (i.e., areas out of the standard deviation of acceleration and velocity) are able to successfully differentiate infants with TD and infants AR (Meinecke et al., 2006). Our findings confirmed this further, by showing a similar differentiation between the two groups involved in the study, using similar lower limb’s parameters (standard deviation of angular velocity). Overall, using linear variability, our findings suggest a larger magnitude change of leg movements in infants AR. This indicates that infants AR tend to have more extreme movement patterns with abrupt change of postures instead of a smooth transition. This may be related with the abnormal muscle tone or coordination issues among infants AR. However, this still does not reveal whether the quality or infants leg movements’ temporal patterns is different between AR and TD infants.
4.2 |. Nonlinear variability
We found that the AR group had smaller nonlinear variability than the TD group, which is consistent with the previous results on spontaneous leg movements during infancy (Smith et al., 2011, 2017). This result hints that the AR group’s spontaneous leg movement patterns are likely more repetitive and less explorative. Indeed, infants with monotonous movement patterns are believed to be less flexible to switch their motor behaviors in order to adapt to different environments (Dusing & Harbourne, 2010). Smith et al. (2011, 2017) also found that infants with myelomeningocele and infants at AR had smaller nonlinear variability values, namely SampEn and Approximate Entropy, of spontaneous leg movements compared to infants with TD. Such results suggested that infants AR have more repetitive movement patterns compared to infants with TD.
Nonlinear variability of upper or lower limbs is likely to be different in infants with different AR or developmental stages. Stergiou et al. proposed the theoretical model of optimal movement variability (Stergiou & Decker, 2011). The optimal variability was hypothesized to have the right amount of complexity and predictability. An atypical amount of complexity and predictability will lead to atypical movement patterns. For example, children with Down syndrome have higher complexity (using Approximate Entropy) for thigh and foot segments than children with TD during walking, as a possible way to compensate for the decreased postural predictability (unstable posture) in other segments (Buzzi & Ulrich, 2004). Preterm infants with brain injuries were also found to have larger maximal Lyapunov exponent values for spontaneous arm movements than those without brain injuries (Ohgi et al., 2008). The larger nonlinear variability was interpreted as the group with brain injury having decreased predictability (more unstable and unpredictable movements) than those without brain injuries (Ohgi et al., 2008). Considering the conflicting results of nonlinear variability in different patient groups and body parts, it is important to always include a control group. The healthy control behavior should be the gold standard for optimal variability reference since there is no consistent standard for optimal variability across different ages and functions. Both too much and too little predictability compared to the healthy control can lead to atypical function.
The altered nonlinear variability from different AR may indicate abnormal neuromotor control, which may further interrupt their daily exploratory behavior and the development of motor and cognitive skills (Smith et al., 2017). The lower SampEn values in infants AR from our findings suggest the potential need for early interventions to improve their movement variability and exploration during early infancy.
4.3 |. Barcoding
Lastly, we applied the barcoding method to further the “dissection” of leg movement patterns. Barcoding was originally used to assess chronic pain conditions in adults, by showing that the increase in pain intensity can be explained by the structural complexity of physical activity barcoding (Paraschiv-Ionescu et al., 2012). We are extending the range to describe infant behavioral patterns. The first thing we observed is the significant difference between the two legs’ barcoding results within each group. This could be related to their positions at home which may restrict their movements on one side, or it may suggest the early laterality of leg movement control.
We also noticed that certain barcode states were different between the two groups. That is, AR infants showed more states at barcode #8 (unilateral movement with large peak acceleration, large angular velocity, and long movement duration), likely representing a unilateral kicking movement. The TD group, on the other hand, showed more states at barcode #14 (bilateral leg movement with large peak acceleration, small angular velocity, and long movement duration), likely representing a bilateral hip flexion or extension movement. These results may indicate the AR group wase more asymmetrical in leg movement control than the TD group.
We did not find a significant difference in the SampEn value of barcoding between the two groups. This is likely due to the fact that we only separated each aspect of the state into two categories based on the median value as a first step. More detailed or clinically meaningful categorization of states could be used to determine the barcoding states in the future. For example, instead of separating the variables into high and low values, we can separate each variable into quarters or even 10 folds. This finer resolution could potentially be more sensitive to the behavioral change across different movements. The barcoding analysis employed in the present study hints toward a wider use of barcoding as a potential tool to analyze the multidimensional features of infant movement repertoire using wearable sensor recordings. Barcoding analysis demonstrated better interpretability of movement patterns than traditional nonlinear analysis by itself. Understanding the difference in movement patterns of TD and AR infants in a multi-dimensional way can help to enhance future intervention strategies, by providing direct instruction of typical movement patterns, from multiple angles and at the same time.
4.4 |. Limitations
Our findings should be considered while taking into account several limitations. Our findings need to be generalized with caution given the small sample size. Future studies are warranted to potentially validate and generalize the results presented in this study. Moreover, the significant age difference between the two groups may have contributed to some of the observed differences. Since infant neuromuscular structure changes drastically across the first couple years in life, some of the observed difference could potentially be caused by the change in muscular strength and limb length. However, we specifically recruited the infants in the two groups to match them on developmental levels. Future studies with a longitudinal design may help in outlining more detailed changes in infant movement patterns over time. Moreover, the AR group here is a diverse group that includes preterm birth, congenital heart disease, and DiGeorge syndrome. Infants with different AR may generate different movement patterns compared to the control group. The findings here may not generalize to a certain population. However, our sample represents the typical population we may encounter in a high-risk infant follow up clinic and we were able to observe group differences. Moreover, future studies may investigate infants with specific AR.
5 |. CONCLUSION
To summarize, the linear and non-linear analysis of full day in-home leg movements recordings, collected by means of wearable sensors, suggest that infants AR have larger linear variability (larger movement magnitude change) and smaller nonlinear variability (more repetitive movement patterns) compared to infants with TD. The barcoding analysis hints toward that the infants AR have more unilateral kicking and less bilateral movements. Clinically meaningful categorization for barcoding is needed to improve the current coding system in order to identify potential differences of dynamic and multidimensional movement patterns between infants AR and infants with TD. Further analysis of different movement patterns within current barcoding states is also important to differentiate the movements. As a first step, this study shows promising possibilities to incorporate different analysis methods to interpret infant leg movement patterns from ecological full-day recordings by using wearable sensors, with the potential to improve early diagnosis of AR in an objective and automated way. Future studies should also correlate these measurements with developmental outcomes. With larger data sets, we may incorporate machine learning methods to improve the accuracy of early diagnosis and outcome prediction.
ACKNOWLEDGMENTS
This research was funded by the American Physical Therapy Association Academy of Pediatric Physical Therapy (PI: B.A. Smith) and CAL-PT FUND (PI: B.A. Smith). Additionally, B.A.S. was supported in part by NIH K12-HD055929 (PI: K. Ottenbacher). The authors declare no conflicts of interest with regard to the funding source for this study.
Footnotes
CONFLICT OF INTEREST STATEMENT
All the authors do not claim any conflict of interest which might be perceived as posing a conflict or bias.
DATA AVAILABILITY STATEMENT
The data that support the findings of this study are available from the corresponding author upon reasonable request.
REFERENCES
- Abrishami MS, Nocera L, Mert M, Trujillo-Priego IA, Purushotham S, Shahabi C, & Smith BA (2019). Identification of developmental delay in infants using wearable sensors: Full-day leg movement statistical feature analysis. IEEE Journal of Translational Engineering in Health and Medicine, 7, 2800207. 10.1109/JTEHM.2019.2893223 [DOI] [PMC free article] [PubMed] [Google Scholar]
- Adolph KE, Cole WG, & Vereijken B (2015). Intraindividual variability in the development of motor skills in childhood. In Diehl M, Hooker K, & Sliwinski MJ (Eds.), Handbook of intraindividual variability across the life span (pp. 59–83). Routledge/Taylor & Francis Group. [Google Scholar]
- Airaksinen M, Gallen A, Kivi A, Vijayakrishnan P, Häyrinen T, Ilén E, Räsänen O, Haataja LM, & Vanhatalo S (2022). Intelligent wearable allows out-of-the-lab tracking of developing motor abilities in infants. Communication and Medicine, 2(1), 69. 10.1038/s43856-022-00131-6 [DOI] [PMC free article] [PubMed] [Google Scholar]
- Bekius A, Zandvoort CS, Kerkman JN, van de Pol LA, Vermeulen RJ, Harlaar J, Daffertshofer A, Buizer AI, & Dominici N (2021). Neuromuscular control before and after independent walking onset in children with cerebral palsy. Sensors, 21(8), 2714. 10.3390/s21082714 [DOI] [PMC free article] [PubMed] [Google Scholar]
- Bultmann CS, Orlikowsky T, Hausler M, Trepels-Kottek S, Disselhorst-Klug C, & Schoberer M (2019). Spontaneous movements in the first four months of life: An accelerometric study in moderate and late preterm infants. Early Human Development, 130, 1–9. 10.1016/j.earlhumdev.2019.01.002 [DOI] [PubMed] [Google Scholar]
- Butcher PR, van Braeckel K, Bouma A, Einspieler C, Stremmelaar EF, & Bos AF (2009). The quality of preterm infants’ spontaneous movements: An early indicator of intelligence and behaviour at school age. The Journal of Child Psychology and Psychiatry and Allied Disciplines, 50(8), 920–930. 10.1111/j.1469-7610.2009.02066.x [DOI] [PubMed] [Google Scholar]
- Buzzi UH, & Ulrich BD (2004). Dynamic stability of gait cycles as a function of speed and system constraints. Motor Control, 8(3), 241–254. 10.1123/mcj.8.3.241 [DOI] [PMC free article] [PubMed] [Google Scholar]
- Deffeyes JE, Harbourne RT, Kyvelidou A, Stuberg WA, & Stergiou N (2009). Nonlinear analysis of sitting postural sway indicates developmental delay in infants. Clinical Biomechanics, 24(7), 564–570. 10.1016/j.clinbiomech.2009.05.004 [DOI] [PubMed] [Google Scholar]
- de Groot L, vd Hoek AM, Hopkins B, & Touwen BC (1993). Development of muscle power in preterm infants: Individual trajectories after term age. Neuropediatrics, 24(2), 68–73. 10.1055/s-2008-1071516 [DOI] [PubMed] [Google Scholar]
- Deng W, Nishiyori R, Vanderbilt DL, & Smith BA (2020). How many days are necessary to represent typical daily leg movement behavior for infants at risk of developmental disabilities? Sensors, 20(18), 5344. 10.3390/s20185344 [DOI] [PMC free article] [PubMed] [Google Scholar]
- Deng W, Trujillo-Priego IA, & Smith BA (2019). How many days are necessary to represent an infant’s typical daily leg movement behavior using wearable sensors? Physical Therapy, 99(6), 730–738. 10.1093/ptj/pzz036 [DOI] [PMC free article] [PubMed] [Google Scholar]
- Deng W, Vanderbilt DL, & Smith BA (2018). Differences in spontaneous leg movement patterns between infants with typical development and infants at risk for developmental delay: Cross-sectional observation prior to sitting onset. Journal of Motor Learning and Development, 6(1), 101–113. 10.1123/jmld.2016-0056 [DOI] [PMC free article] [PubMed] [Google Scholar]
- Dusing SC, & Harbourne RT (2010). Variability in postural control during infancy: Implications for development, assessment, and intervention. Physical Therapy, 90(12), 1838–1849. 10.2522/ptj.2010033 [DOI] [PMC free article] [PubMed] [Google Scholar]
- Einspieler C, & Prechtl HF (2005). Prechtl’s assessment of general movements: A diagnostic tool for the functional assessment of the young nervous system. Mental Retardation and Developmental Disabilities Research Reviews, 11(1), 61–67. 10.1002/mrdd.20051 [DOI] [PubMed] [Google Scholar]
- Eligibility Criteria. (2018). Thomson Reuters. https://www.cpqcc.org/sites/default/files/CCS%20HRIF%20Prog%20Med%20Criteria%20%28flow%20chart%29%20FEB2018.pdf [Google Scholar]
- Gerber CN, Carcreff L, Paraschiv-Ionescu A, Armand S, & Newman CJ (2020). Multidimensional measures of physical activity and their association with gross motor capacity in children and adolescents with cerebral palsy. Sensors, 20(20), 20. 10.3390/s20205861 [DOI] [PMC free article] [PubMed] [Google Scholar]
- Hadders-Algra M, Klip-Van den Nieuwendijk A, Martijn A, & van Eykern LA (1997). Assessment of general movements: Towards a better understanding of a sensitive method to evaluate brain function in young infants. Developmental Medicine and Child Neurology, 39(2), 88–98. 10.1111/j.1469-8749.1997.tb07390.x [DOI] [PubMed] [Google Scholar]
- Harbourne RT, & Stergiou N (2009). Movement variability and the use of nonlinear tools: Principles to guide physical therapist practice. Physical Therapy, 89(3), 267–282. 10.2522/ptj.20080130 [DOI] [PMC free article] [PubMed] [Google Scholar]
- Jeffries LM, LaForme Fiss A, Westcott McCoy S, Bartlett D, Avery L, & Hanna S (2019). Developmental trajectories and reference percentiles for range of motion, endurance, and muscle strength of children with cerebral palsy. Physical Therapy, 99(3), 329–338. 10.1093/ptj/pzy160 [DOI] [PubMed] [Google Scholar]
- Jeong H, Kwak SS, Sohn S, Lee JY, Lee YJ, O’Brien MK, Park Y, Avila R, Kim J-T, Yoo J-Y, Irie M, Jang H, Ouyang W, Shawen N, Kang YJ, Kim SS, Tzavelis A, Lee K, Andersen RA, … Rogers JA (2021). Miniaturized wireless, skin-integrated sensor networks for quantifying full-body movement behaviors and vital signs in infants. Proceedings of the National Academy of Sciences of the United States of America, 118(43). 10.1073/pnas.2104925118 [DOI] [PMC free article] [PubMed] [Google Scholar]
- Kanemaru N, Watanabe H, Kihara H, Nakano H, Takaya R, Nakamura T, Nakano J, Taga G, & Konishi Y (2013). Specific characteristics of spontaneous movements in preterm infants at term age are associated with developmental delays at age 3 years. Developmental Medicine and Child Neurology, 55(8), 713–721. 10.1111/dmcn.12156 [DOI] [PubMed] [Google Scholar]
- Karch D, Kang K-S, Wochner K, Philippi H, Hadders-Algra M, Pietz J, & Dickhaus H (2012). Kinematic assessment of stereotypy in spontaneous movements in infants. Gait & Posture, 36(2), 307–311. 10.1016/j.gaitpost.2012.03.017 [DOI] [PubMed] [Google Scholar]
- Kobesova A, & Kolar P (2014). Developmental kinesiology: Three levels of motor control in the assessment and treatment of the motor system. Journal of Bodywork and Movement Therapies, 18(1), 23–33. 10.1016/j.jbmt.2013.04.002 [DOI] [PubMed] [Google Scholar]
- Luttikhuizen dos Santos ES, de Kieviet JF, Königs M, van Elburg RM, & Oosterlaan J (2013). Predictive value of the Bayley scales of infant development on development of very preterm/very low birth weight children: A meta-analysis. Early Human Development, 89(7), 487–496. 10.1016/j.earlhumdev.2013.03.008 [DOI] [PubMed] [Google Scholar]
- Manoel E. de J., & Connolly KJ (1995). Variability and the development of skilled actions. International Journal of Psychophysiology, 19(2), 129–147. 10.1016/0167-8760(94)00078-s [DOI] [PubMed] [Google Scholar]
- Meinecke L, Breitbach-Faller N, Bartz C, Damen R, Rau G, & Disselhorst-Klug C (2006). Movement analysis in the early detection of newborns at risk for developing spasticity due to infantile cerebral palsy. Human Movement Science, 25(2), 125–144. 10.1016/j.humov.2005.09.012 [DOI] [PubMed] [Google Scholar]
- Miyagishima S, Asaka T, Kamatsuka K, Kozuka N, Kobayashi M, Igarashi L, Hori T, & Tsutsumi H (2018). Spontaneous movements of preterm infants is associated with outcome of gross motor development. Brain & Development, 40(8), 627–633. 10.1016/j.braindev.2018.04.007 [DOI] [PubMed] [Google Scholar]
- Ohgi S, Morita S, Loo KK, & Mizuike C (2008). Time series analysis of spontaneous upper-extremity movements of premature infants with brain injuries. Physical Therapy, 88(9), 1022–1033. 10.2522/ptj.20070171 [DOI] [PMC free article] [PubMed] [Google Scholar]
- Paraschiv-Ionescu A, Perruchoud C, Buchser E, & Aminian K (2012). Barcoding human physical activity to assess chronic pain conditions. PLoS One, 7(2), e32239. 10.1371/journal.pone.0032239 [DOI] [PMC free article] [PubMed] [Google Scholar]
- Prechtl HF (1997). State of the art of a new functional assessment of the young nervous system. An early predictor of cerebral palsy. Early Human Development, 50(1), 1–11. 10.1016/s0378-3782(97)00088-1 [DOI] [PubMed] [Google Scholar]
- Richman JS, & Moorman JR (2000). Physiological time-series analysis using approximate entropy and sample entropy. American Journal of Physiology - Heart and Circulatory Physiology, 278(6), H2039–H2049. 10.1152/ajpheart.2000.278.6.H2039 [DOI] [PubMed] [Google Scholar]
- Shida-tokeshi J, Lane CJ, Trujillo-priego IA, Deng W, Vanderbilt DL, Loeb GE, Smith BA, & De Campos AC (2018). Between full-day arm movement characteristics and developmental status in infants with typical development as they learn to reach: An observational study. Gates Open Research, 0, 1–18. 10.12688/gatesopenres.12813.1 [DOI] [PMC free article] [PubMed] [Google Scholar]
- Smith BA, Teulier C, Sansom J, Stergiou N, & Ulrich BD (2011). Approximate entropy values demonstrate impaired neuromotor control of spontaneous leg activity in infants with myelomeningocele. Pediatric Physical Therapy, 23(3), 241–247. 10.1097/PEP.0b013e3182289ae4 [DOI] [PMC free article] [PubMed] [Google Scholar]
- Smith BA, Trujillo-Priego IA, Lane CJ, Finley JM, & Horak FB (2015). Daily quantity of infant leg movement: Wearable sensor algorithm and relationship to walking onset. Sensors, 15(8), 19006–19020. 10.3390/s150819006 [DOI] [PMC free article] [PubMed] [Google Scholar]
- Smith BA, Vanderbilt DL, Applequist B, & Kyvelidou A (2017). Sample entropy identifies differences in spontaneous leg movement behavior between infants with typical development and infants at risk of developmental delay. Technologies, 5(3), 55. 10.3390/technologies5030055 [DOI] [PMC free article] [PubMed] [Google Scholar]
- Stergiou N, & Decker LM (2011). Human movement variability, nonlinear dynamics, and pathology: Is there a connection? Human Movement Science, 30(5), 869–888. 10.1016/j.humov.2011.06.002 [DOI] [PMC free article] [PubMed] [Google Scholar]
- Stergiou N, Harbourne R, & Cavanaugh J (2006). Optimal movement variability: A new theoretical perspective for neurologic physical therapy. Journal of Neurologic Physical Therapy, 30(3), 120–129. 10.1097/01.npt.0000281949.48193.d9 [DOI] [PubMed] [Google Scholar]
- Thelen E (1995). Motor development – A new synthesis. American Psychologist, 50(2), 79–95. 10.1037//0003-066x.50.2.79 [DOI] [PubMed] [Google Scholar]
- Trujillo-Priego IA, & Smith BA (2017). Kinematic characteristics of infant leg movements produced across a full day. Journal of Rehabilitation and Assistive Technologies Engineering, 4, 2055668317717461. 10.1177/2055668317717461 [DOI] [PMC free article] [PubMed] [Google Scholar]
- Verdú Pérez A, & Montes Gonzalo MC (1996). [The Albert scale of motor development: A new instrument for the evaluation of motor development. Letter]. Anales espanoles de pediatria, 45(4), 447–448. [PubMed] [Google Scholar]
- Wilson RB, Vangala S, Elashoff D, Safari T, & Smith BA (2021). Using wearable sensor technology to measure motion complexity in infants at high familial risk for autism spectrum disorder. Sensors, 21(2). 616. 10.3390/s21020616 [DOI] [PMC free article] [PubMed] [Google Scholar]
- Zuzarte I, Gee AH, Sternad D, & Paydarfar D (2020). Automated movement detection reveals features of maturation in preterm infants. In Annual International Conference of the IEEE Engineering in Medicine and Biology Society (pp. 600–603). 10.1109/EMBC44109.2020.9176091 [DOI] [PubMed] [Google Scholar]
Associated Data
This section collects any data citations, data availability statements, or supplementary materials included in this article.
Data Availability Statement
The data that support the findings of this study are available from the corresponding author upon reasonable request.