

Abstract
The human microbiome encodes a large repertoire of biochemical enzymes and pathways, most of which remain uncharacterized. Here, using a metagenomics-based search strategy, we discovered that bacterial members of the human gut and oral microbiome encode enzymes that selectively phosphorylate a clinically used antidiabetic drug, acarbose1,2, resulting in its inactivation. Acarbose is an inhibitor of both human and bacterial α-glucosidases3, limiting the ability of the target organism to metabolize complex carbohydrates. Using biochemical assays, X-ray crystallography and metagenomic analyses, we show that microbiome-derived acarbose kinases are specific for acarbose, provide their harbouring organism with a protective advantage against the activity of acarbose, and are widespread in the microbiomes of western and non-western human populations. These results provide an example of widespread microbiome resistance to a non-antibiotic drug, and suggest that acarbose resistance has disseminated in the human microbiome as a defensive strategy against a potential endogenous producer of a closely related molecule.
Orally administered non-antibiotic drugs can unintentionally impact the composition of the human microbiome4–8. For example, acarbose–a naturally derived α-glucosidase inhibitor that is used to treat type 2 diabetes1,2–has profound side effects on the gut microbiome in both murine models and humans7,9–14. Administered orally or in a chewable form right before meals, acarbose is intended to inhibit human α-glucosidases (such as salivary and pancreatic amylases), leading to a decrease in the metabolism of ingested complex carbohydrates and in post-prandial blood glucose levels1. Concurrently, the fact that more than 95% of the acarbose dose remains unabsorbed in the intestines, coupled with its ability to also inhibit bacterial α-glucosidases, result in noticeable effects on the gut microbiome2,7,11–16. Nevertheless, mechanisms by which members of the microbiome may resist the carbohydrate-dependent inhibitory effects of acarbose remain largely unexplored. To address this gap, we undertook a metagenomics–biochemical–structural biology approach to examine the human microbiome for enzymes that specifically metabolize and inactivate acarbose–an activity that can potentially modulate its microbiome-targeted effects and impact its therapeutic efficacy.
Acarbose inactivation by the human microbiome
Acarbose was discovered from, and is produced industrially by, the soil bacterium Actinoplanes sp. SE50/110 (refs. 17,18). A self-resistance mechanism is encoded within the biosynthetic gene cluster (BGC) for acarbose (acb) production; a specific kinase, AcbK, phosphorylates acarbose at the O6A hydroxyl and renders it inactive2,17,19,20 (Fig. 1a). Conceptually, any bacterium that encodes the same function would be similarly resistant to acarbose. We therefore computationally searched for genes encoding AcbK homologues in the human microbiome using two approaches: (1) BLAST searches against genomes of bacterial isolates on NCBI and metagenomic scaffolds assembled from the Human Microbiome Project (HMP-1-1); and (2) searches using MetaBGC against unassembled metagenomic sequencing data of 3,212 human microbiome samples from five diverse cohorts (HMP, encompassing both HMP-1-1 and HMP-1-2, MetaHIT, Chinese and Fijicomp)21–26. Combined, our searches identified 82 genes (70 of which in full length), designated as microbiome-encoded carbohydrate kinases (mck1–mck82) (Methods, Supplementary Tables 1 and 2 and Extended Data Fig. 1).
Fig. 1 |. Metagenomic discovery of Maks from the human microbiome.
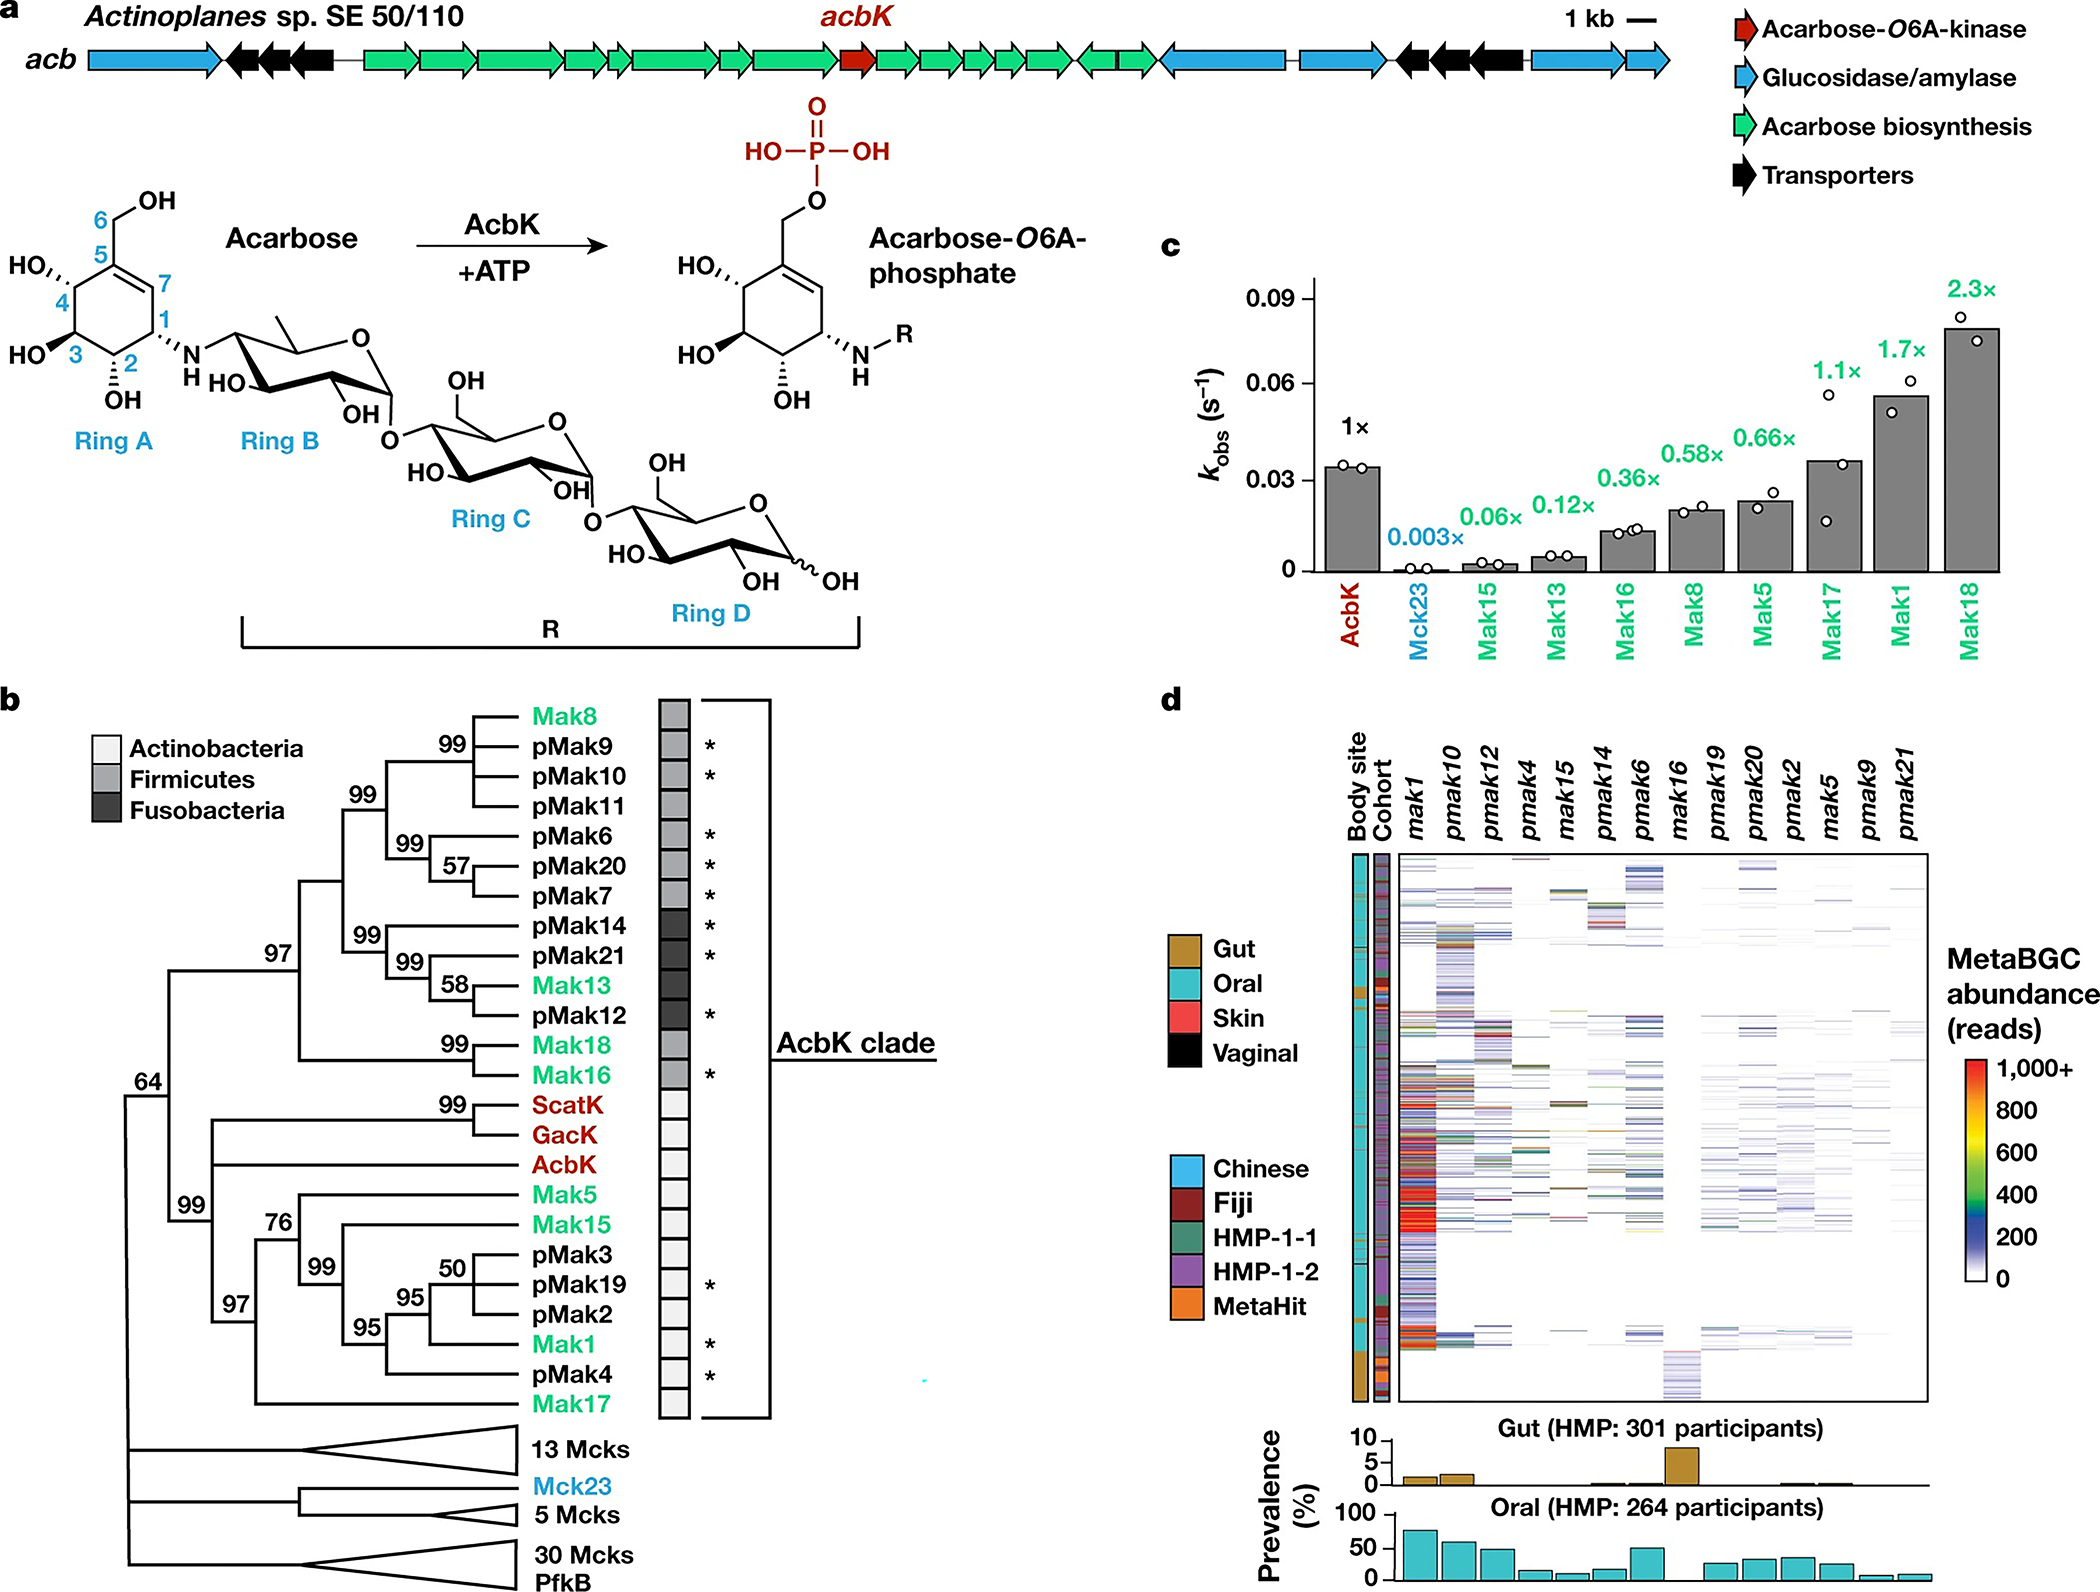
a, Acarbose BGC (acb) (top). Bottom, AcbK phosphorylates acarbose to yield acarbose-O6A-phosphate. b, A maximum likelihood phylogenetic tree of AcbK homologues discovered in this study, constructed using MEGA7 (ref. 42), with bootstrap values of >50% out of 1,000 replicates displayed at the branch points. The tree includes previously characterized acarbose kinases (red), PfkB from E. coli, Mcks experimentally verified to have (green, Maks) or lack (blue) acarbose-O6A-kinase activity, and ones that have not been experimentally tested (black). pMaks indicate putative Maks in the AcbK clade. Phyla of the bacteria of origin are illustrated by shaded boxes. An asterisk denotes that the phylum is predicted because of a metagenomic origin. The complete tree is shown in Extended Data Fig. 2. c, The rates of each experimentally characterized Mck/Mak relative to AcbK, coloured as in b. Values from individual replicates (n = 2 or n = 3) are shown as small circles. Raw data are available in Supplementary Table 3. Representative HPLC–MS and HPLC-high resolution (HR) –MS/MS data are shown in Extended Data Figs. 3 and 5. d, Heatmap showing the abundance of a selected subset of mak and pmak genes in the five analysed cohorts as calculated by MetaBGC (samples with no mapped reads are not shown) (top). Hierarchical clustering was performed using UPGMA (unweighted pair group method with arithmetic mean) in pheatmap in R. Bottom, the prevalence (the percentage of positive individuals) of the same set of mak and pmak genes in the HMP cohorts at two body sites. The prevalence and abundance of all mck genes in all cohorts are shown in Extended Data Fig. 2 and Supplementary Table 2.
Next, we tested whether the computationally identified Mcks can indeed phosphorylate and inactivate acarbose. We constructed a phylogenetic tree of the 70 full-length Mcks and included three proteins from soil bacteria that are known to phosphorylate acarbose (AcbK, GacK and ScatK)17,27,28, and the well characterized ATP-dependent 6-phosphofructokinase (PfkB) from Escherichia coli29. The phylogenetic tree revealed a large clade of 21 Mcks that cluster with the three positive controls (the AcbK clade) (Fig. 1b and Extended Data Fig. 2). We synthesized codon-optimized DNA sequences for nine mck genes (eight from various subclades in the AcbK clade, and one from an outside clade), as well as the positive control acbK, for recombinant protein expression in E. coli. After successful expression and purification, we incubated the resulting proteins with ATP and acarbose and quantified the post-reaction levels of acarbose and phosphorylated acarbose using high-performance liquid chromatography coupled with mass spectrometry (HPLC-MS) (Extended Data Fig. 3 and Supplementary Fig. 1). We calculated the observed reaction rate (kobs) for each of the nine proteins and normalized them to the kobs of AcbK (which we calculated to be 0.034 s−1; Supplementary Table 3). The eight tested proteins from the AcbK clade had a kobs ranging from 17-fold slower to 2-fold faster than AcbK (Fig. 1c). Only Mck23, from outside the AcbK clade, had a kobs that was more than 300-fold slower compared with the kobs of AcbK. We therefore designated all eight tested proteins from the AcbK clade microbiome-derived acarbose kinases (Maks) and we designated the untested proteins from this clade putative Maks (pMaks) (Fig. 1b).
Next, using MetaBGC (Methods)26, we examined the representation of mak and pmak genes in 3,212 samples originating from all major body sites (gut, mouth, skin and vagina), and five countries (United States, China, Denmark, Spain and Fiji). Notably, 13 mak and pmak genes were most prevalent in oral samples (249/264, 94% of HMP participants, and 144/243, 59% of Fijian participants, encoded at least one mak or pmak gene in their oral samples) and, especially, in supragingival plaque samples (229/230, 99% of HMP participants). Individual oral mak and pmak genes varied widely in their prevalence (ranging from 8% to 81% of the HMP participants in oral samples), with mak1 being the most widely distributed (213/264, 81% of the participants in the HMP) and the most abundant (Fig. 1d, Extended Data Fig. 4 and Supplementary Table 2). Oral mak and pmak genes discovered from isolate genomes are encoded by diverse bacteria from the phyla Actinobacteria (such as Actinomyces oris), Firmicutes (such as Solobacterium moorei) and Fusobacteria (such as Leptotrichia trevisanii), and mak and pmak genes identified from metagenomic data were predicted to originate from the same three phyla (Fig. 1b and Supplementary Table 1).
Although several oral mak and pmak genes can occasionally be detected at lower prevalence in the gut microbiome, only one gene–mak16, which is encoded by the gut Firmicute Turicibacter sanguinis–is exclusively found in the gut (25/301, 8% of the participants in the HMP; 7/194, 4% in Chinese; 21/193, 11% in Fijicomp; and 34/318, 11% in MetaHit). Finally, we analysed several publicly available metatranscriptomic datasets and detected metatranscriptomic reads that match 12 mak and pmak genes in oral microbiome samples and one gene (mak16) in faecal microbiome samples from at least two different individuals each (Methods and Supplementary Table 2). Taken together, these results reveal that homologues of an acarbose-inactivating enzyme are widespread in the human oral and gut microbiome from diverse populations.
Similar enzyme kinetics of Mak1 and AcbK
We further characterized the most abundant and widespread Mak, Mak1. First, we tested whether the phosphorylation of acarbose by Mak1 results in its inactivation, as was reported for AcbK19. We measured the inhibitory activity of acarbose and its phosphorylated form, produced by either AcbK or Mak1 (Extended Data Fig. 5), against human salivary amylase and porcine pancreatic amylase using a colorimetric assay. Although acarbose completely inhibited both enzymes at a concentration of 10 μM, no inhibition was observed by either of the phosphorylated forms (produced by AcbK or Mak1) at the same concentration (Fig. 2a, b and Supplementary Table 4). These results confirm that phosphorylation of acarbose by Maks results in its inactivation. Second, we tested whether acarbose is the preferred substrate of Mak1; carbohydrate kinases are known to phosphorylate structurally similar substrates30–32. We incubated both Mak1 and AcbK with eight diverse carbohydrates and aminoglycosides19, and calculated their observed reaction rates with each substrate. Both Mak1 and AcbK showed a very strong preference for acarbose, while performing little to no phosphorylation of related compounds (Extended Data Fig. 6).
Fig. 2 |. Mak1 and AcbK phosphorylate and inactivate acarbose with similar enzyme kinetics.
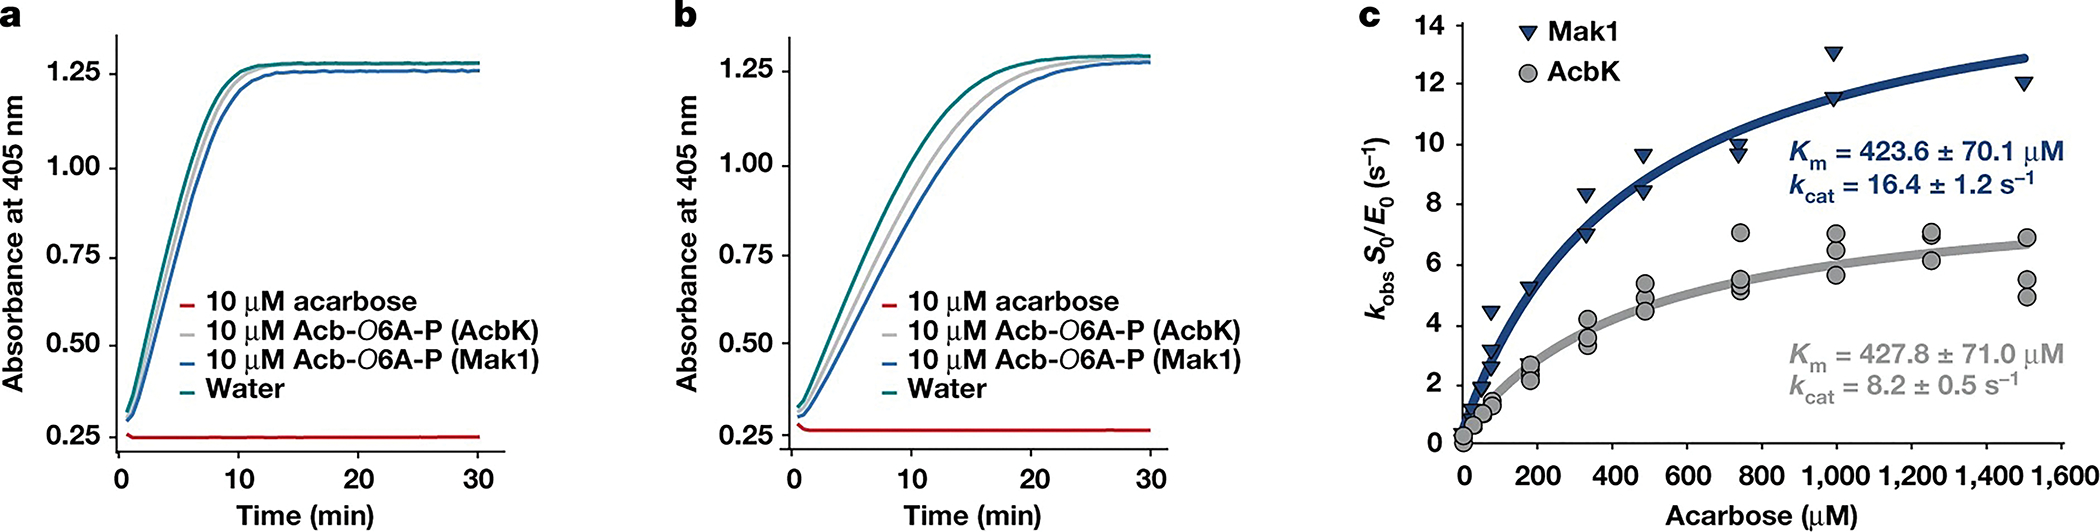
a, b, A colorimetric amylase activity assay for porcine pancreatic amylase (a) and human salivary amylase (b). The increase in absorbance at 405 nm (y axis, measured every 30 s) indicates the cleavage of an oligosaccharide substrate mimic (ethylidene-pNP-G7) and the release of a chromogenic dye (p-nitrophenol) as a direct readout for amylase activity. Although incubation of either amylase with 10 μM acarbose completely abolishes their activity, incubation with the same concentration of acarbose-O6A-phosphate (Acb-O6A-P) produced by either Mak1 or AcbK is no longer inhibitory. Data plotted in a and b are from a single experiment. The raw data from this experiment, and from a second replicate showing identical results are presented in Supplementary Table 4. c, Michaelis–Menten saturation curves for AcbK (grey) and Mak1 (blue). Km and kcat values are indicated in their respective colours and individual kobs measurement replicates are shown on the graph for both enzymes. S0 is the initial substrate concentration and E0 is the concentration of the enzyme. Raw data are available in Supplementary Table 3.
Finally, we tested whether Mak1 phosphorylates acarbose with similar enzyme kinetics to the enzyme kinetics of AcbK. We determined that the apparent Michaelis constant (Km) for acarbose is 424 μM for Mak1 and 428 μM for AcbK (Fig. 2c and Supplementary Table 3), suggesting a similar preference for acarbose as a substrate. Notably, the kcat (multiple-turnover catalytic rate constant) for Mak1 is 16.4 s−1, compared to 8.2 s−1 for AcbK, indicating that Mak1 phosphorylates acarbose faster than AcbK under similar laboratory conditions. This difference was consistently observed over varying substrate concentrations (Fig. 2c and Extended Data Fig. 6) and temperatures (Extended Data Fig. 6 and Supplementary Table 3). Moreover, at fixed ATP and acarbose concentrations, a 100-fold increase in enzyme concentration leads to a linear 100-fold increase in kobs for AcbK but a non-linear increase in kobs of around 1,000-fold for Mak1. Thus, Mak1 is a cooperative enzyme (Hill coefficient = 1.71 ± 0.06), whereas AcbK is not (Hill coefficient = 1.13 ± 0.02) (Extended Data Fig. 6 and Supplementary Table 3). These results indicate that Mak1 and AcbK are very similar enzymes with regard to their substrate preference, catalytic activity and Km, but slightly differ in their kcat and cooperativity.
Structural analysis of AcbK and Mak1
To understand how the two kinases recognize and phosphorylate acarbose, we determined the crystal structure of AcbK bound to acarbose and a non-hydrolysable ATP analogue, adenylyl-imidodiphosphate (AMP-PNP), by X-ray crystallography at a resolution of 2.4 Å, and of the equivalent Mak1 complex at a resolution of 3.1 Å (Supplementary Table 5). Mak1 and AcbK structures are similar (root-mean-square deviation = 1.12 Å for 272 Cα atoms), share 42% sequence identity, and have the same overall fold as the E. coli ribokinase PfkB (Protein Data Bank (PDB): 1RKD)33. Monomers of this ribokinase consist of two domains: a core α/β domain and a smaller five-stranded β-sheet towards the N-terminus (Fig. 3a). Both AcbK and Mak1 form homodimers in the crystals through dimerization of the five-stranded β-sheet to form the ‘β-clasp’, which comprises residues 13–41 and 93–113 in Mak1, and 14–42 and 94–115 in AcbK (Fig. 3b and Extended Data Fig. 7). Interactions between the polypeptide chains within the β-clasp are extensive, burying up to 1,298 Å2 of surface area and forming a small hydrophobic core. Each β-sheet within the β-clasp contains β-strands from both monomers in the dimer– notably β3 of one monomer with β8 of the other (Fig. 3b and Extended Data Fig. 7). The β-clasp also forms one face of the acarbose binding site, with β3 from one monomer contacting the edge of the active site of the other monomer in the homodimer, forming part of the lid over the acarbose-binding site (Fig. 3b and Extended Data Fig. 7). By contrast, the ATP-binding site, occupied by AMP-PNP, is wholly contained within each individual monomer.
Fig. 3 |. Crystal structures of Mak1 and AcbK reveal their structural similarity and specific acarbose interacting residues.
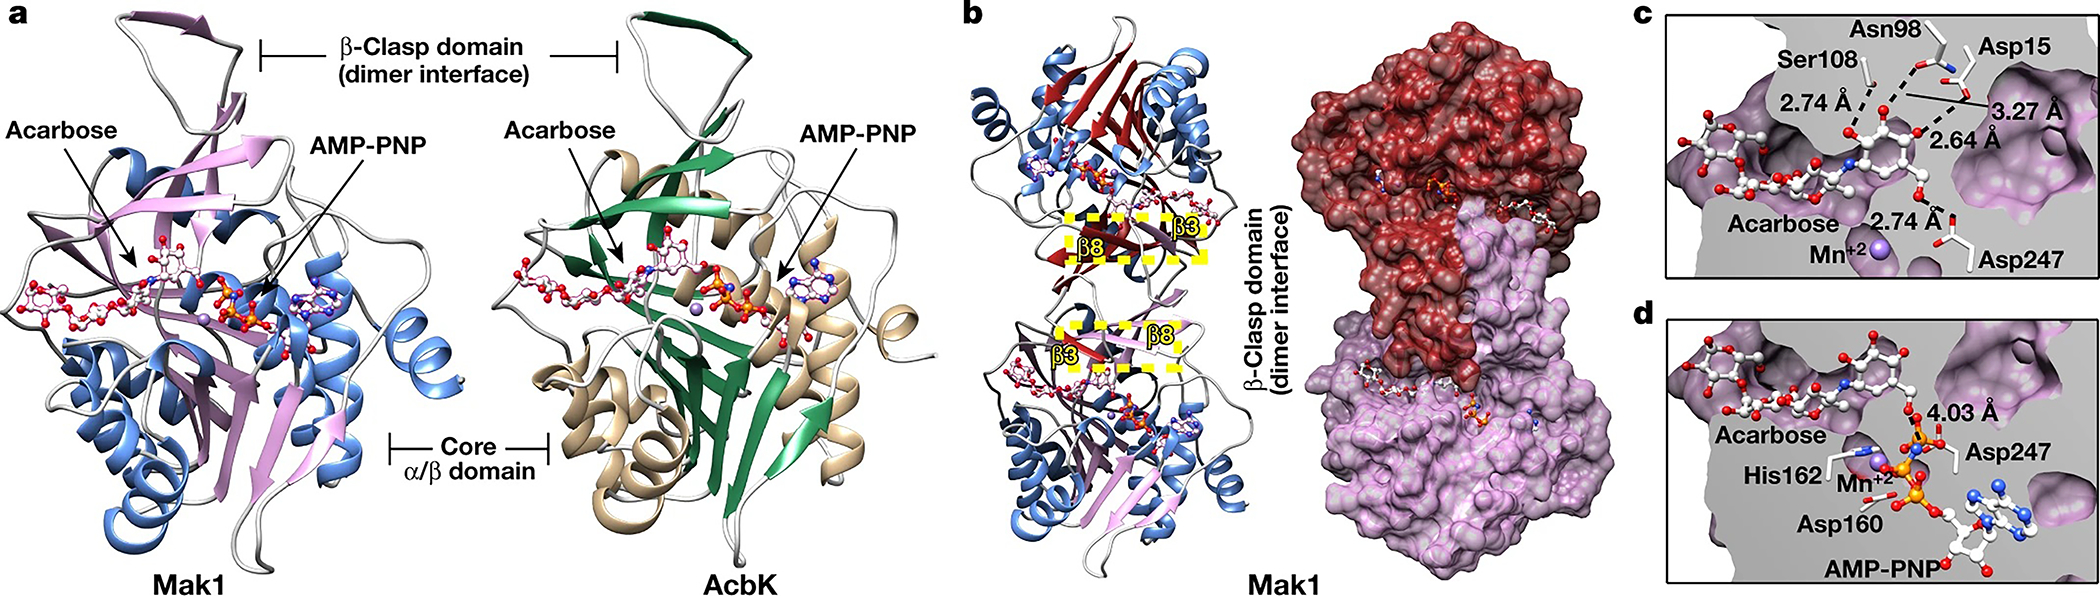
a, Side-by-side comparison of the extremely similar structures of Mak1 and AcbK with the acarbose substrate and AMP-PNP bound, as well as the coordinated metal (Mn+2, purple sphere). Both proteins form a canonical ribokinase fold where the substrate binds in a small cleft between the two main domains: a core α/β domain and a smaller β-clasp domain that forms the dimer interface. b, Left, Mak1 forms homodimers with extensive interactions between the two monomers, most notably β3 of one monomer and β8 of the other (yellow highlighted boxes; β-strands from each monomer are shaded differently for clarity). A molecular surface view is shown (right) with one Mak1 monomer coloured red and the other coloured purple, highlighting the extensive surface area (1,298 Å2) that is involved in forming the dimer through the β-clasp domains. c, Magnified view of the Mak1 substrate-binding pocket where an extensive network of hydrogen bonds form with all the hydroxyl groups in the acarbose A ring and hold it in place. Distances are shown for each of the hydrogen bonds. d, Magnified view of the Mak1 active site with important residues shown (Asp160, His162 and Asp247) that are all involved in priming the O6A hydroxyl of acarbose for nucleophilic attack and in facilitating the transfer of the phosphate from an ATP (AMP-PNP shown) to the O6A hydroxyl of acarbose. The distance shown is from the O6A hydroxyl to the γ-phosphate. A corresponding set of figures for AcbK is provided in Extended Data Fig. 7.
The acarbose substrate binds in an extended conformation within a cleft in the ribokinase fold formed between the β-clasp and α/β domains. Each acarbose molecule buries up to 501 Å2 of surface area on one monomer and 94 Å2 on the other monomer in each dimer. The acarviosine moiety of acarbose (A and B rings; Fig. 1a) is distinct from related oligosaccharides and contributes the most extensive interactions between acarbose and the kinases. Every hydroxyl group on the A ring forms hydrogen bonds to residues on AcbK: Ser109 with acarbose O2A; Asn99 with O3A; Asp16 with O4A; and Asp248 with O6A (Extended Data Fig. 7); Ser108, Asn98, Asp15 and Asp247 in Mak1, respectively (Fig. 3c). These hydrogen-bonding residues are conserved across all tested and confirmed Maks and are probably important in stabilizing the acarbose A ring (Fig. 3d and Extended Data Fig. 7). Interactions between the acarbose B ring and the kinases involve two hydrogen bonds: acarbose O2B with Asn165 and Ser31 in AcbK (Asn163 and Ser30 in Mak1) and are contributed by both monomers in the dimer, with the ring sandwiched between the faces of aromatic side-chains: Trp111 and His164 in AcbK, or Tyr110 and His162 in Mak1. In contrast to rings A and B, which are held rigidly in the deepest part of the active site cleft, rings C and D sit in a shallower region of the cleft and lack hydrogen bonds to the proteins (Fig. 3c and Extended Data Fig. 7); thus, the substrate specificity of acarbose kinases arises mainly from the interaction with the distinctive acarviosine moiety.
In PfkB, a proposed mechanism for ribose phosphorylation is through the deprotonation of the O5′ hydroxyl group of ribose, priming it for nucleophilic attack on the γ-phosphate of ATP33. The conformation observed in the Mak1 and AcbK active sites is consistent with this mechanism: the O6A hydroxyl of acarbose is ideally positioned to act as a nucleophile and attack the γ-phosphate of AMP-PNP. As in canonical ribokinases, the carboxylate side-chain of Asp248 in AcbK (Asp247 in Mak1) would abstract the proton from the O6A hydroxyl, and the Mn+2 metal ion coordinates with both the β- and γ-phosphates of AMP-PNP, aligning them for attack (Fig. 3 and Extended Data Fig. 7). In AcbK and Mak1 crystal structures, the non-hydrolysable ATP analogue AMP-PNP prevents the phosphorylation of acarbose and stabilizes the substrate-bound kinases in a conformation immediately before phosphate transfer. In AcbK, the O6A-Pγ distance is 3.50 Å and the acarbose O6A nucleophile is colinear with the Pγ and N3β atoms of AMP-PNP in perfect alignment for transfer of the phosphate group to acarbose (Extended Data Fig. 7). For AcbK, His164 (His162 in Mak1) coordinates the Mn+2 ion and Asp162 (Asp160 in Mak1) forms hydrogen bonds with two of the three metal-bound water molecules (Fig. 3e and Extended Data Fig. 7).
In agreement with this mechanism, Asp248, Asp162 and His164 in AcbK and the Mak1 equivalents are absolutely conserved in all of the tested Maks (Extended Data Fig. 7). We constructed mutants for these three residues and observed a 713-fold, 7-fold and 300-fold reduction in acarbose phosphorylation activity in the D247A, D160A mutant and D160A/H162A double mutant of Mak1, respectively (Extended Data Fig. 6 and Supplementary Table 3). Finally, addition of the metal chelator EDTA fully abolishes the reaction, corroborating the metal-dependent activity of the enzyme (Extended Data Fig. 6). These results suggest that the two enzymes adopt the same acarbose phosphorylation mechanism, which is analogous to that of previously characterized ribokinases.
Mak1 provides acarbose resistance
We engineered an oral Actinomyces viscosus strain to express mak1 and compared its complex carbohydrate-dependent growth in the presence of acarbose with that of an isogenic strain harbouring an empty-vector control (Methods). We selected oral A. viscosus for two reasons: mak1 is naturally harboured by related oral Actinomyces spp. (Supplementary Table 1), and genetic manipulation has been successful in this strain34. Expression of mak1 resulted in a significant rescue of growth for several acarbose concentrations, after both 24 h and 48 h of growth (Fig. 4a, Extended Data Fig. 8 and Supplementary Table 6). These results demonstrate the ability of Mak1 to protect the bacterium expressing it from the carbohydrate-dependent growth inhibitory effects of acarbose, reminiscent of resistance through inactivation, albeit to a non-antibiotic drug.
Fig. 4 |. Biological relevance of Maks and a potential origin for Mak1 in the human oral microbiome.
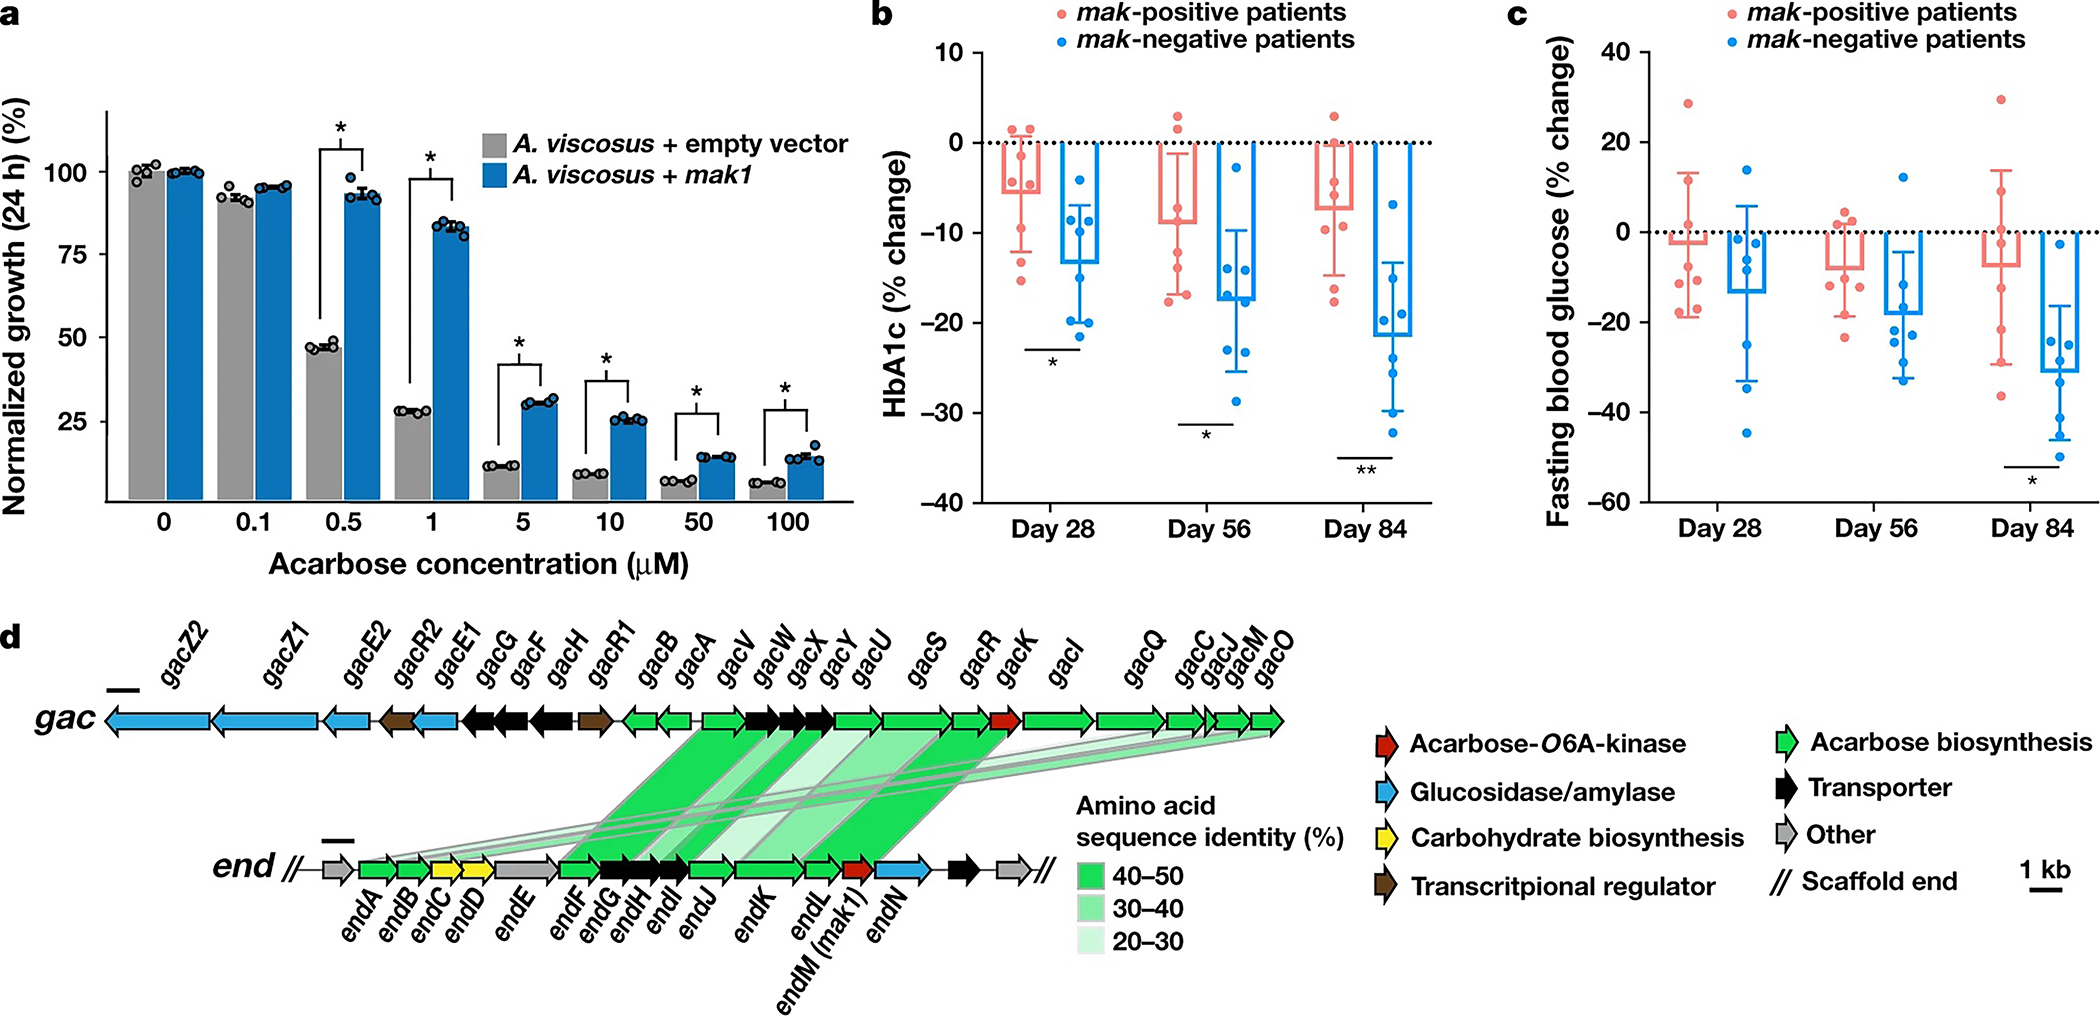
a, Normalized bacterial growth at 24h, measured as the optical density at 600 nm and presented as a percentage of the untreated control. The bars indicate treatments with varying acarbose concentrations for each of the tested strains: A. viscosus expressing mak1 (blue) and A. viscosus harbouring an empty-vector control (grey). mak1 expression resulted in a statistically significant rescue of the carbohydrate-dependent growth inhibitory activity of acarbose. The error bars represent the s.e.m. n = 4. Statistical analysis was performed using two-sample t-tests assuming unequal variances; *P < 0.01: P = 1.02 × 10⁻⁵ (0.5 μM), P = 2.48 × 10⁻⁶ (1 μM), P= 1.07 × 10⁻⁹ (5 μM), P= 1.45 × 10⁻⁴ (10 μM), P = 7.07 × 10⁻⁸ (50 μM) and P=1.26 × 10⁻³ (100 μM). The raw experimental data are provided in Supplementary Table 6 and a similar plot of data measured after 48 h of growth is shown in Extended Data Fig. 8. b, c, The percentage change in HbA1c (b) and fasting blood glucose (c) levels in mak-positive (n = 8, red) and mak-negative (n = 8, blue) patients with type 2 diabetes who were treated with acarbose. Two-sided Student’s t-tests were used to compare mak-positive and mak-negative patients at days 28, 56 and 84 after acarbose treatment initiation; *P < 0.05, **P < 0.01: HbA1c, P =0.031 (day 28), P = 0.046 (day 56) and P = 0.003 (day 84); fasting blood glucose, P = 0.026 (day 84). Data are mean ± s.d. d, Comparison of the gac BGC for acarbose biosynthesis from Streptomyces glaucescens and the end BGC discovered here from metagenomic sequencing data of the human oral microbiome. The green shaded bars connect homologous genes in the two BGCs, according to the indicated colour code for pairwise protein sequence identity.
mak carriage and therapeutic response
To test whether acarbose inactivation by Maks could impact its therapeutic efficacy, we analysed data from a recent human clinical trial that we performed using acarbose16. Although the study was originally designed to assess the impact of dietary fibres on the gut microbiome and antidiabetic therapy, the control arm of this trial (the U group, 16 patients) comprised patients with type 2 diabetes who were treated only with acarbose for 84 d without dietary intervention; faecal metagenomic sequencing data and disease relevant biomarkers were collected at days 0, 28, 56 and 84. We mapped faecal metagenomic sequencing reads of the 16 patients to the sequences of the 21 mak and pmak genes discovered above to determine whether a patient was mak positive (encodes any mak or pmak in their microbiome) or mak negative (no mak or pmak genes were detected in any of the patient samples). Using this criterion, half of the patients were deemed to be mak positive, whereas the other half were deemed to be mak negative, with no difference in sex or age between the two groups of patients (Methods and Supplementary Table 7). Next, we examined whether mak-positive and mak-negative patients responded differently to acarbose treatment. Interestingly, we observed a statistically significant difference between the two patient groups in the percentage change of haemoglobin A1c (HbA1c) levels (at all three time points after treatment), and fasting blood glucose levels (at day 84; Fig. 4b, c). Similar results were observed when comparing the absolute values instead of percentage change (Extended Data Fig. 8). Notably, these differences followed a pattern that is consistent with potential acarbose inactivation by intestinal Maks–mak-positive patients showed a diminished therapeutic response compared with mak-negative patients. Although promising, these results should be interpreted with caution given the small sample size in the trial and the multitude of other patient-intrinsic factors that could have a role in antidiabetic therapeutic response.
Endogenous acarbose-like molecules
The peculiar near omnipresence of genes encoding acarbose resistance in the human oral microbiome (99% of HMP participants in supragingival plaque samples) led us to hypothesize that there exists an endogenous natural source of acarbose or acarbose-like molecules at this site. To test this hypothesis, we assembled and annotated the genomic loci harbouring mak genes from several corresponding metagenomes or isolate genomes (Methods), then searched for encoded proteins that resemble known acarbose biosynthetic enzymes in the same genetic neighbourhood: the three known acarbose BGCs (acb,gac and scat) encode an acarbose kinase within the same cluster17,27,28. Notably, we discovered one microbiome-encoded BGC that closely resembles gac and encodes homologues of core acarbose biosynthetic enzymes27 (Fig. 4d, Extended Data Fig. 8 and Supplementary Tables 8 and 9). We termed this BGC end, for endogenously produced acarbose-like molecule, or endocarbose.
end was discovered in a metagenomic scaffold from the oral microbiome, and includes mak1 (referred to as endM when it is encoded within end). end is predicted to be present in an oral Actinomyces sp. based on its flanking genes (Fig. 4d, Extended Data Fig. 8 and Supplementary Table 1). By mapping metagenomic reads from all 3,212 samples to end, we discovered that it is found exclusively in the oral microbiome (in both HMP and Fijicomp) and that, similar to mak1, it is most prevalent in supragingival plaque samples. Interestingly, analysis of individual end genes revealed that they can exist in five different genetic contexts (genetic variants) in supragingival plaque samples: as an intact 14-gene BGC (in 69/230, 30% of the HMP participants), as a truncated 8-gene, 4-gene or 2-gene cluster (all include mak1 (endM); in 12%, 7% and 19% of the HMP participants, respectively), or as a stand-alone mak1 gene (in 39/230,17% of the HMP participants). Our analysis also revealed several metagenomic samples with varying coverages across the end genes, consistent with the co-occurrence of at least two genetic variants in the same sample (Methods, Extended Data Fig. 9 and Supplementary Table 10). The discovery of end, its striking similarity to gac, and the surprising spectrum of genetic contexts for end and mak1 in supragingival plaque samples suggest a scenario of resistance gene dissemination from an original local producer of endocarbose to non-producing inhabitants of the same niche.
Discussion
Our findings have two main implications. First, the potential endogenous production of acarbose-like molecules, and the resistance of certain members of the microbiome to the effects of these molecules through inactivation by phosphorylation represent a potential mechanism for microbial competition for complex carbohydrates in the human body. This is reminiscent of the presumed ecological role of acarbose in the soil environment as a conditional bacteriostatic agent17,27,28, and adds a new layer to the complex network of carbohydrate-mediated interactions between members of the human microbiome35–37. Second, the discovery of Maks represents an example of accidental yet specific microbiome resistance to a non-antibiotic, human-targeted drug, and unveils a clinically important mechanism of microbiome–acarbose interaction. Our human clinical trial data suggest that mak carriage in the gut microbiome may affect antidiabetic response; notably, the gut-specific mak (mak16, encoded by T. sanguinis), and oral mak genes that are occasionally detected in the gut (such as mak1 and mak5 from oral Actinomyces spp.) are encoded by bacteria that typically inhabit the small intestine in which most of the therapeutic effects of acarbose take place38–41. Longitudinal metagenomic analysis of the gut and oral microbiome, paired with detailed evaluation of clinical response in a large number of patients treated with acarbose over an extended period of time will be necessary to unequivocally assess whether the carriage of mak genes predicts microbiome changes and/or therapeutic efficacy.
Online content
Any methods, additional references, Nature Research reporting summaries, source data, extended data, supplementary information, acknowledgements, peer review information; details of author contributions and competing interests; and statements of data and code availability are available at https://doi.org/10.1038/s41586-021-04091-0.
Methods
Computational search for acarbose kinases in the human microbiome
AcbK (NCBI Protein: CAD29481.2) was used as the query for a BLASTp search against the entire non-redundant protein database of NCBI (focusing on human isolates), as well as a tBLASTn search against assembled scaffolds from 759 metagenomic samples from the Human Microbiome Project (HMP-1-1)26. Hits with an E value of lower than 1 × 10⁻¹⁰ were selected from both searches. Similar hits (>99% identity at the amino acid level) were dereplicated, and the sequence originating from the longest source genome or metagenome scaffold was selected as the representative protein of that hit (Supplementary Table 1).
We next ran MetaBGC (v.1.3.3; https://github.com/donia-lab/MetaBGC)26 using our identified hits from the BLAST-based computational search (corresponding to Mck1-18), as well as AcbK, GacK and ScatK, to constitute the seed alignment in the MetaBGC-Build module. As previously described in the MetaBGC publication26, MetaBGC-Build was used to construct, evaluate and select high-performance segmented profile Hidden Markov Models (spHMMs) for the aligned AcbK homologues, defined by having an F1 score of ≥0.5. For the MetaBGC-Build step, we used the synthetic metagenomic dataset number 2 from the MetaBGC publication26 (Extended Data Fig. 1). MetaBGC-Search was then used to search all of the samples of each cohort for AcbK homologues. MetaBGC-Search combines three MetaBGC modules: (1) MetaBGC-Identify for the identification of quality-filtered, translated metagenomic reads matching the high-performance spHMMs selected by MetaBGC-Build; (2) MetaBGC-Quantify, for the dereplication and quantification of the identified metagenomic reads; and (3) MetaBGC-Cluster, for clustering the identified and quantified reads into ‘metagenomic read bins’. MetaBGC-Search was run with the parameters ‘--max_dist 0.1 --min_samples 1 --min_reads_bin 10 --min_abund_bin 10’ to select metagenomic read bins composed of at least 10 reads for further analysis, while requiring a ‘metagenomic read bin abundance’ of ≥10 reads to call a bin ‘present’ in a given sample. The MetaBGC outputs are provided in Supplementary Table 2. After identifying the matching ‘metagenomic read bins’, we performed targeted and untargeted metagenomic assemblies in the samples showing the highest ‘metagenomic read bin abundance’ for each bin to obtain full-length sequences26, which resulted in a total of 70 complete and 12 partial mck genes between all of the computational search strategies used (Supplementary Table 1).
Read mapping against mak and pmak genes in metagenomic and metatranscriptomic datasets
In this study, we used the following datasets for gut metatranscriptomic analyses: Abu-Ali et al.43, HMP-2-IBD-Pilot44 and HMP-2-IBD-Final45; and the following datasets for oral metatranscriptomic analyses: NCBI BioProject PRJNA383868, Peterson et al.46, Benitez-Píez et al.47, Jorth et al.48 and Szafranski et al.49. Raw Illumina reads were downloaded as deposited in each study and quality-filtered using PRINSEQ50 according to the protocol described in the MetaBGC publication26. Quality-filtered reads were mapped to the DNA sequence of the 21 mak and pmak genes using Bowtie2 (--end-to-end, --fast, --score-min L, --0.6, --0.3)51. The breadth of coverage for each gene (that is, the percentage of gene length covered by reads) and abundance (in reads per kb per million reads (RPKM)) were calculated based on the Bowtie2 results (Supplementary Table 2). The exact same analysis was performed on faecal metagenomic sequencing data of the ‘U group’ (16 patients with type 2 diabetes treated only with acarbose, four time points each) from the human clinical trial performed in Zhao et al.16 (Supplementary Table 7).
Phylogenetic analysis of mck genes
Phylogenetic analyses were conducted in MEGA7 (ref. 42). The amino acid sequences of 74 full-length homologues (70 discovered using the two methods above, in addition to AcbK, GacK, ScatK and PfkB) were aligned using MUSCLE and the phylogenetic tree was computed using the maximum likelihood method and a bootstrap test of 1,000 replicates. All of the remaining settings were the default in MEGA7 (ref. 42).
Cloning of acbK and mck genes
Nucleotide sequences of acbK, and nine mck genes (the names, source and sequences of which are provided in Supplementary Table 1) were codon-optimized for E. coli K12 using the IDT codon optimization tool (Integrated DNA Technologies). gBLOCKs (Integrated DNA Technologies) of the codon-optimized genes were ordered with engineered 20-bp overlaps for cloning into a double-digested pET28a vector (using the restriction enzymes Notl and Ndel, New England Biolabs). Ligation of the gBLOCK into the linearized pET28a vector was performed using the In-Fusion HD cloning kit (Takara Bio), resulting in an N-terminal hexa histidine tag. The ligation product was then transformed into chemically competent E. coli BL-21 (DE3) cells (NEB) and plasmids were purified from transformants and verified by sanger sequencing.
Expression and purification of AcbK and Mcks
E. coli BL-21 (DE3) cells harbouring a pET28a vector with the cloned acbK or one of the 9 mck genes were cultured in Luria-Bertani medium at 37 °C until an optical density at 600 nm (OD600) of 0.4 was reached, followed by induction of protein expression using 0.2 mM isopropyl-β-d-thiogalactopyranoside (IPTG) (Sigma-Aldrich) for approximately 16h at 20 °C. The cells were pelleted at4,600gfor 20 min, resuspended in lysis buffer (20 mM Tris-HCl (pH 8), 1 M KCl, 10 mM imidazole, 10% (v/v) glycerol, 2 mM 2-mercaptoethanol and 1× Roche Complete protease inhibitors) and lysed on an EmulsiFlex C3 (Avestin). Crude lysates were clarified by centrifugation at 35,000g for 30 min at 4 °C. His60 Ni superflow resin (Takara Bio) was added to the clarified lysates to isolate His-tagged proteins. After washing with at least 20 column volumes of lysis buffer, the protein was eluted with 250 mM imidazole-containing lysis buffer and further purified by Superdex 200 size-exclusion chromatography on an AKTA FPLC system (GE Healthcare Life Sciences) equilibrated with size-exclusion buffer (20 mM HEPES (pH 7.4), 350 mM KCl, 1 mM EDTA, 10% (v/v) glycerol and 5 mM dithiothreitol).
For seleno-methionine incorporation in Mak1, E. coli BL21 (DE3)-CodonPlus RIPL transformed with mak1 was cultured in 5 ml of medium A plus 5 μl of 50 mg ml−1 methionine, where medium A is M9 minimal medium (11) supplemented with 1 ml of both 1 mg ml−1 biotin and 1 mg ml−1 thiamin and 10 ml of 100× trace elements (5 g EDTA, 0.83 g FeCl3·6H2O, 84 mg ZnCl2, 13 mg CuCl2·2H2O, 10 mg CoCl2·6H2O, 10 mg H3BO3, 1.6 mg MnCl2·6H2O, all dissolved in 1 l H2O). The overnight culture was added to 1 l of medium A plus 1 ml of 50 mg ml−1 methionine and cultured until the OD600 was 1.0. The cells were then centrifuged for 10 min at 4,500 rpm and resuspended in 1 l of medium A and incubated for 4–8 h at 37 °C. Next, we added an inhibitory amino acids mix (1 g of lysine, threonine, phenylalanine and 0.5 g of leucine, isoleucine and valine in 50 ml H2O) as well as 2 ml of a 50 mg ml−1 mix of seleno-methionine and moved the culture to 20 °C. After 30 min, protein expression was induced by adding 0.2 mM IPTG and expressed for an additional 8–16 h. The expression, and purification steps were the same as described above. All proteins were purified to more than 95% purity and concentrations were quantified by ultraviolet spectrophotometry.
Evaluation of acarbose phosphorylation by HPLC–MS
Acarbose was detected by running samples on an Agilent 6120 Quad-rupole HPLC-MS instrument (Agilent Technologies). The mobile phase system used was: A, 0.1% formic acid in acetonitrile; B, 0.1% formic acid in H2O. HPLC elution was performed using the following gradient: 0% A, 0–2 min; 0–50% A, 2–12 min; 50–100% A, 12–15 min; and 100% A, 15–20 min, with a 5 min post-run to equilibrate to the starting conditions, a flow rate of 0.6 ml min−1 and a 10 μl injection. Samples were run on an Agilent Poroshell 120 EC-C18, 4.6 × 100 mm, 2.7 μm column (Agilent Technologies).
When additional carbohydrates and aminoglycosides were tested and they were not retained by the reverse-phase column, we instead used a HILIC column (InfinityLab Poroshell 120 HILIC, 4.6 × 100 mm, 2.7 μm, Agilent Technologies). The mobile phase system used was: A, 0.1% formic acid in acetonitrile; B, 0.15% formic acid in 150 mM ammonium formate. For the HILIC column, HPLC elution was performed using the following gradient: 98% A, 0–2 min; 98–90% A, 2–5 min; 90–75% A, 5–10 min; 75–25% A, 10–15 min; 25–2% A, 15–18 min; 2–98% A, 18–20 min; with a 5 min post-run to equilibrate to the starting conditions and a flow rate of 0.7 ml min−1.
HPLC-HR–MS analysis of phosphorylated acarbose
HPLC-HR-MS analysis was performed on an Agilent 6545 LC/QTOF machine. Reverse-phase chromatography was performed using an Agilent Poroshell 120 EC-C18, 4.6 × 150 mm, 2.7 μm column (Agilent Technologies) and the column was kept at 25 °C. The mobile phase system used was: A, 0.1% formic acid in H2O; B, 0.1% formic acid in acetonitrile. The gradient used was 0–2 min 100% A, 2–4 min 10–95% A, 4–12 min 95–5% A, 12–16 min 5% A, 16–16.1 min 5–100% A, with a 7 min post-run at initial conditions, a flow rate of 0.5 ml min−1 and 0.5 μl of sample was injected. The MS acquisition parameters were in a 4 GHz high-resolution mode with the following parameters: positive ion polarity, 0.5 min delay before MS measurement, 325 °C gas temperature, 10 l min−1 drying gas flow rate, 20 p.s.i. nebulizer pressure, 325 °C sheath gas temperature, 12 l min−1 sheath gas flow rate, 4,000 V capillary voltage, 500 V nozzle voltage, 135 V fragmentor voltage, 45 V skimmer voltage, MS and MS/MS mass range of 100–1,700 m/z, acquisition of 5 MS1 spectra per s, acquisition of 3 MS2 spectra per s, 20 eV collision energy, a maximum of 2 precursors per cycle, and a precursor selection threshold of 200 counts absolute or 0.01% relative. The system was run in auto MS/MS mode.
Quantification of strain-to-strain variation in mak genes
To quantify how many strains of the same organism encode a mak, we performed a BLASTn against all sequenced strains within the same species using the Integrated Microbial Genomes & Microbiomes system v.5.0 by the Joint Genome Institute52. The presence of mak genes is a strain-specific trait; for example, only 2/14 sequenced genomes of A. oris, 2/3 sequenced genomes of S. moorei, 2/4 sequenced genomes of Kytococcus sedentarius and 4/8 genomes of Turicibacter spp. encode a mak.
Enzyme kinetics
Analyses of acarbose phosphorylation was carried out at 37 °C using 1 mM acarbose (Abcam, ab141891), 2 mM ATP (Sigma-Aldrich) and 10 μM recombinant protein, unless otherwise noted. Reactions were constituted on ice, contained 20 mM TRIS-HCl (pH 8), 70 mM NaCl, 2 mM MgCl2 and were prewarmed to 37 °C for 10 min (with the added protein) before the addition of acarbose to start the reaction. The reactions were stopped at the indicated times by instant heating to 95 °C. The samples were then diluted 1:10 in milliQ water, centrifuged at maximum rpm for 5 min to remove any precipitate and then analysed using HPLC–MS as described above. Quantification was based on calculating the area under the curve for the extracted ion chromatogram of either acarbose (m/z = 646.4, [M+H]+) or acarbose-O6A-phosphate (m/z = 726.4, [M+H]+). To properly compare the levels of substrate (acarbose) and product (acarbose-O6A-phosphate), a corrective calculation of the product ion counts was implemented to account for the difference in ionization efficiency between the two molecules on the HPLC-MS (Supplementary Table 3). This calculation was based on ion counts observed for known standard amounts of substrate and product on the same instrument. Data points were then fit and plotted using SigmaPlot (Systat Software).
Alpha amylase assay
The Amylase Activity Assay Kit (Sigma-Aldrich, MAK009) was used in testing the inhibitory effect of acarbose against both human salivary amylase (HSA) (Sigma-Aldrich, A1031) and porcine pancreatic amylase (PPA) (Sigma-Aldrich, A6255). The standard kit instructions were followed by mixing the amylase assay buffer and amylase substrate mix 1:1 to start the reaction. Before starting the reaction, the amylase assay buffer was supplemented with either HSA or PPA (2 U ml−1), and water, 10 μM acarbose or 10 μM acarbose-O6A-phosphate. Measurements were carried out on the Tecan Infinite 200 Pro device in Corning 96-well flat-bottom plates black polystyrene (Corning, 3631). Measurements were taken at 405 nM every 30 s for 45 min, and the wells were shaken for 3 s before measurement to ensure proper mixing. The buffers were all prewarmed, and the experiments were run at 30 °C.
Crystallization conditions
Seleno-methionine-labelled Mak1 was concentrated to 20 mg ml−1 in the presence of 10 mM CaCl2, 6 mM ATP and 50 mM acarbose. Seleno-methionine Mak1 crystals were grown from a 1:1 mixture of protein with a reservoir solution containing 1.25 M ammonium dihydrogen phosphate and 0.1 M Tris-HCl pH 8.3 using the hanging-drop vapour diffusion method. Crystals were cryoprotected using the reservoir solution supplemented with 20% (v/v) ethylene glycol. The acarbose ligand was not well ordered in this structure, and the γ-PO4 of ATP disordered or partially hydrolysed, so we grew crystals of Mak1 and AcbK in the presence of a non-hydrolysable ATP analogue to visualize the substrate complex. Mak1 used for the ligand complex structure was concentrated to 20 mg ml−1 in the presence of 10 mM MnCl2, 6 mM AMP-PNP (Sigma-Aldrich) and 50 mM acarbose. Mak1 crystals were grown using the hanging-drop vapour diffusion method by mixing protein 1:1 with reservoir solution (0.4 M disodium sulfate, 13% (w/v) PEG 3350, 5% (v/v) tert-butanol). Crystals were cryoprotected using the reservoir solution supplemented with 20% (v/v) ethylene glycol. AcbK was concentrated to 25 mg ml−1 in the presence of 10 mM MnCl2, 6 mM AMP-PNP and 50 mM acarbose and mixed 1:1 with a reservoir solution comprising 0.05 M NaCl and 18% (w/v) PEG 3350. AcbK crystals were cryoprotected in paraffin oil after removal of surrounding crystallization solution. All crystals used for data collection were flash-cooled in liquid nitrogen.
X-ray data collection and structure determination
All data collection was performed at 100 K from crystals flash-cooled in liquid nitrogen. X-ray diffraction data were collected at the AMX (17-ID-1) and FMX (17-ID-2) beam lines at Brookhaven National Laboratory (NSLS-II). Data were collected at a wavelength of 0.9793 Å at FMX on an Eiger 16M detector for the seleno-methionine-labelled Mak1 bound to ATP, acarbose and CaCl2. For both Mak1 and AcbK with bound ligands (AMP-PMP, acarbose and MnCl2) data were collected at AMX at a wavelength of 0.9201 Å on an Eiger 9M detector. Data were integrated, scaled and merged using XDS and AIMLESS as part of the CCP4 package53–55. Seleno-methonine Mak1 crystals were in space group C2221 with two molecules in the asymmetric unit, Mak1 crystals grown in the presence of AMP-PNP and acarbose were in space group P65 with two molecules in the asymmetric unit and AcbK crystals grown in the presence of AMP-PNP and acarbose were in space group P1 with four molecules in the asymmetric unit. Unit cell dimensions and data processing statistics are shown in Supplementary Table 5. The Mak1 structure was solved by single-wavelength anomalous phasing with data collected at the Selenium K Edge. SHELX was used to find the selenium substructure and calculate experimental SAD phases56. Surface areas were calculated using PDBePISA (the protein interfaces, surfaces and assemblies service (PISA) at the European Bioinformatics Institute; http://www.ebi.ac.uk/pdbe/prot_int/pistart.html)57. The structure of seleno-methionine-incorporated Mak1 was used to solve AMP-PNP–acarbose–MnCl2-bound crystals of both Mak1 and AcbK by molecular replacement using PHASER58. Structures were built in COOT and refined using PHENIX59,60. Refinement statistics are given in Supplementary Table 5. Ramachandran statistics were: 96.0% favoured, 0.7% outliers (seleno-methionine Mak1); 94.3% favoured, 0.7% outliers (Mak1); 97.5% favoured, 0.4% outliers (AcbK). Structures of seleno-methionine Mak1, Mak1 bound to AMP-PNP and acarbose and AcbK bound to AMP-PMP and acarbose were deposited at the PDB under accession codes 6WB4, 6WB5 and 6WB7, respectively.
Structure visualization
Structures were visualized using PyMol (DeLano Scientific build), and molecular graphics images were produced using the UCSF Chimera package from the Computer Graphics Laboratory, University of California, San Francisco61.
Generation of mak1 mutants
The D247A mutant was generated by synthesizing a gBlock gene fragment (Integrated DNA Technologies). The other point mutants (D160A, D160A-H162A) were generated in the previously constructed pET28a + mak1 using one-primer site-directed mutagenesis. After the PCR reaction, overnight digestion with DpnI was performed before transformation into competent E. coli BL-21 cells. All of the constructs used in this study were verified by Sanger DNA sequencing. The primers ordered were as follows: D160A_F, GTCGCTGCGGGTCG CTCAACTTCAACTGC GTTACATGATTGGGATG GTGTAGCTGATTAT; and D160A_H162A_F, GCTGCGGGTC GCTCAACTTCAA CTGCGTTAGCGGA TTGGGATGGTGTAGC TGATTATCAC.
Cloning and growth experiments in A. viscosus
The native sequence of the mak1 gene was synthesized as a gBlock gene fragment (Integrated DNA Technologies) and cloned into pJRD215 (ATCC, 37533). As pJRD215 encodes two antibiotic-resistance markers (for kanamycin and streptomycin), primers were designed such that mak1 was cloned in lieu of the streptomycin resistance gene of pJRD215 and its expression is driven by the streptomycin gene promoter. The primers ordered were as follows: pJRD215_IF_F2_SmR, ATATCAAGCGAC TTCTCCTATCCCC; pJRD215_IF_R2_SmR, TGGAGGTTCCTTCAGTTTTCTGATGAAG; Mak1_IF_F_SmR, AACTGAAGGAACCTCCAATGACTCAGGCAGATGTTCTGGTG; and Mak1_IF_R_SmR, GAGAAGTCGCTTGATATATTTCACCGAGCCAGAAGCCG. Cloning was carried out using In-Fusion Cloning (Takara Bio). Generation of A. viscosus (ATCC, 43146) electrocompetent cells and their transformation with pJRD215-mak1 were carried out according to the protocols described by Yeung et al.34. Transformants were selected on tryptic soy agar plates with 50 μg ml−1 kanamycin and then grown in tryptic soy broth (Thermo Fisher Scientific) with 50 μg ml−1 kanamycin. Genomic DNA was extracted from the transformants, and the presence of pJRD215-mak1 was verified using PCR with the following primers and subsequent DNA sequencing of the resulting amplicons: Mak1_Seq_F, ATGACTCAGGCAGATGTTCTGG; and Mak1_Seq_R, CGTACCTCGCCCAGTTCATG.
For growth experiments, an A. viscosus strain containing pJRD215-mak1 as well as a control with the empty pJRD215 vector were grown from frozen glycerol stocks and cultured in a modified TSB plus 50 μg ml−1 kanamycin. Modified TSB was designed to have sucrose instead of glucose as the sole carbon source, to confer dependence on α-glucosidases and sensitivity to acarbose. Modified TSB was prepared as follows: 17 g of pancreatic digest of casein, 3 g of papaic digest of soybean, 5 g of sodium chloride, and 2.5 g of dipotassium phosphate in 1 l of water. After autoclaving and allowing the medium to cool, 5 ml of sterile 20% sucrose was added. Strains were cultured in the AnaeroPack Anerobic gas generator system (2.5 l or 7 l) (Thermo Fisher Scientific, R681001) or in a Coy Lab’s Vinyl Anaerobic Chamber (Coy Laboratory Products) at 37 °C until confluency (typically 24–48 h). Cultures were then diluted 1:250 into fresh modified TSB with 50 μg ml−1 kanamycin, and the desired concentration of acarbose (0.1–100 μM) was added for testing. One set of cultures, for both the strain harbouring mak1 and the empty vector control, was kept free of acarbose and used as the basis for growth normalization for all of the treatment conditions. Each set of conditions was performed in quadruplicate and all the cultures in a single experiment were derived from the same starting culture. OD600 readings were measured at 24 h and 48 h. Data were then entered into Microsoft Excel, where two-tailed students t-tests, assuming unequal variances, were used to compare the relative growths of the control and experimental groups.
mak genetic context analysis and identification of end
Full-length genomic and metagenomic scaffolds that harboured mak genes were annotated using Geneious (https://www.geneious.com, Geneious Prime 2019.2.3)62, and manually scanned for known biosynthetic enzymes that are involved in acarbose biosynthesis. Sequences were annotated beginning at the mak gene and moving outwards in both directions for at least 10 kb or until the scaffold ended. If a gene that is involved in carbohydrate metabolism was identified, annotation would continue outwards until at least three genes that are not involved in carbohydrate metabolism were identified or the scaffold ended.
Human clinical trial with acarbose treatment
The human clinical trial was a randomized, open-label, parallel-group trial in patients with type 2 diabetes. The study protocol was approved by the Ethics Committee at School of Life Sciences and Biotechnology, Shanghai Jiao Tong University (2014–016), and the study was conducted in accordance with the principles of the Declaration of Helsinki. All of the participants provided written informed consent. The trial was registered in the Chinese Clinical Trial Registry (ChiCTR-TRC-14004959). The trial was conducted from 2014 to 2015. The recruitment and research settings included Shanghai General Hospital, Sijing Hospital and Sijing community health service centre, Songjiang District, Shanghai. The control arm of this clinical trial, which included acarbose treatment as the sole intervention, was used here to compare the therapeutic response to acarbose between mak-positive and mak-negative patients.
Prevalence of mak1 and end variants in metagenomic samples
Bowtie2 (--end-to-end, --fast, --score-min L, --0.6 --0.3) was used to map quality-filtered metagenomic reads from all cohorts to mak1 and end51. Breadth coverage (in percentage of gene length) and abundance (in RPKM) were calculated for mak1 and end for all samples. Mak1 was considered to be present in a given sample if any reads mapped to it, and end was considered to be present in a given sample if it had a breadth coverage of ≧25% of its length (detailed results of this analysis are provided in Extended Data Fig. 9 and Supplementary Table 8).
Furthermore, we calculated the abundance (in RPKM) of each of the individual end genes in supragingival plaque samples (HMP-1-1 and HMP-1-2 cohorts) to determine the most plausible genetic variant of end present in each sample. For this analysis, we considered a given end gene present if any reads mapped to it. On the basis of the pattern of present genes, we assigned an end genetic variant to each sample (14-gene, 8-gene, 4-gene, 2-gene or stand-alone mak1). For individuals who had multiple visits, we classified them as concordant individuals, that is, individuals who had the same genetic variants across different visits, or ‘discordant individuals’, that is, individuals who had different genetic variants across different visits (detailed results of these analyses are provided in Supplementary Table 10).
Extended Data
Extended Data Fig. 1 |. Identification of AcbK homologues using MetaBGC.
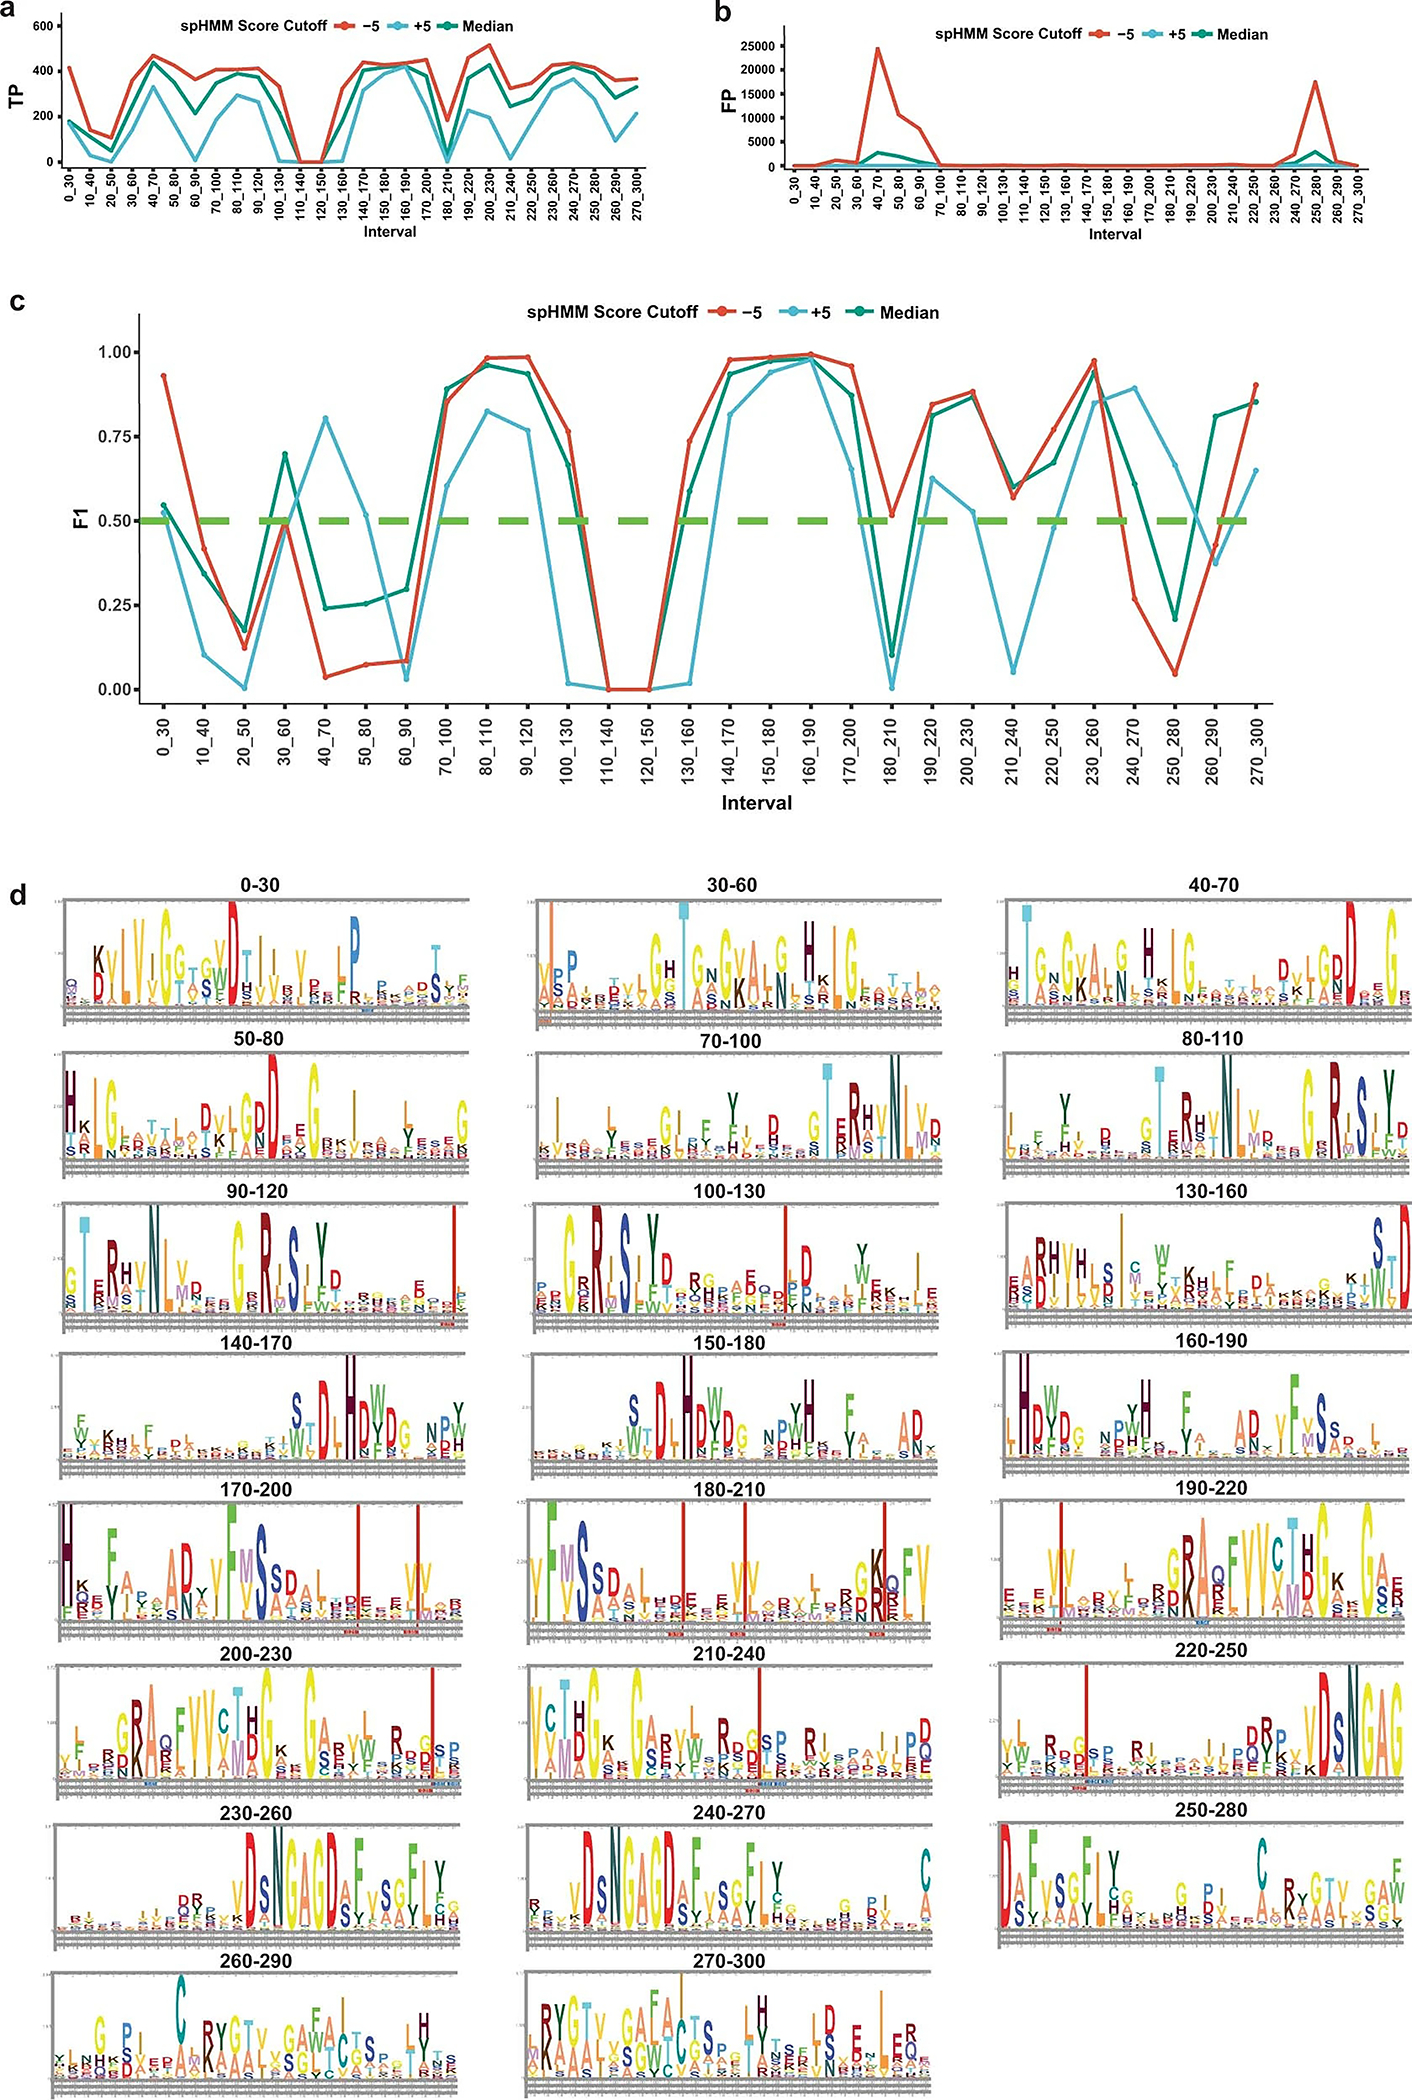
a. Number of true positive (TP) reads identified in synthetic metagenomic dataset number 2 for all spHMMs created by MetaBGC-Build. b. Number of false positive (FP) reads identified in synthetic metagenomic dataset number 2 for all spHMMs created by MetaBGC-Build. c. F1 scores of all spHMMs created by MetaBGC-Build. Only spHMMs with F1 scores ≥ 0.5 were used in MetaBGC-Identify runs with real metagenomic data. d. spHMM logos for spHMMs included in MetaBGC-Identify. Please see Supplementary Table 2 for spHMM cutoffs used for all intervals.
Extended Data Fig. 2 |. Phylogenetic analysis of Mcks/Maks and prevalence of selected maks and pmaks in metagenomic samples of various human cohorts.
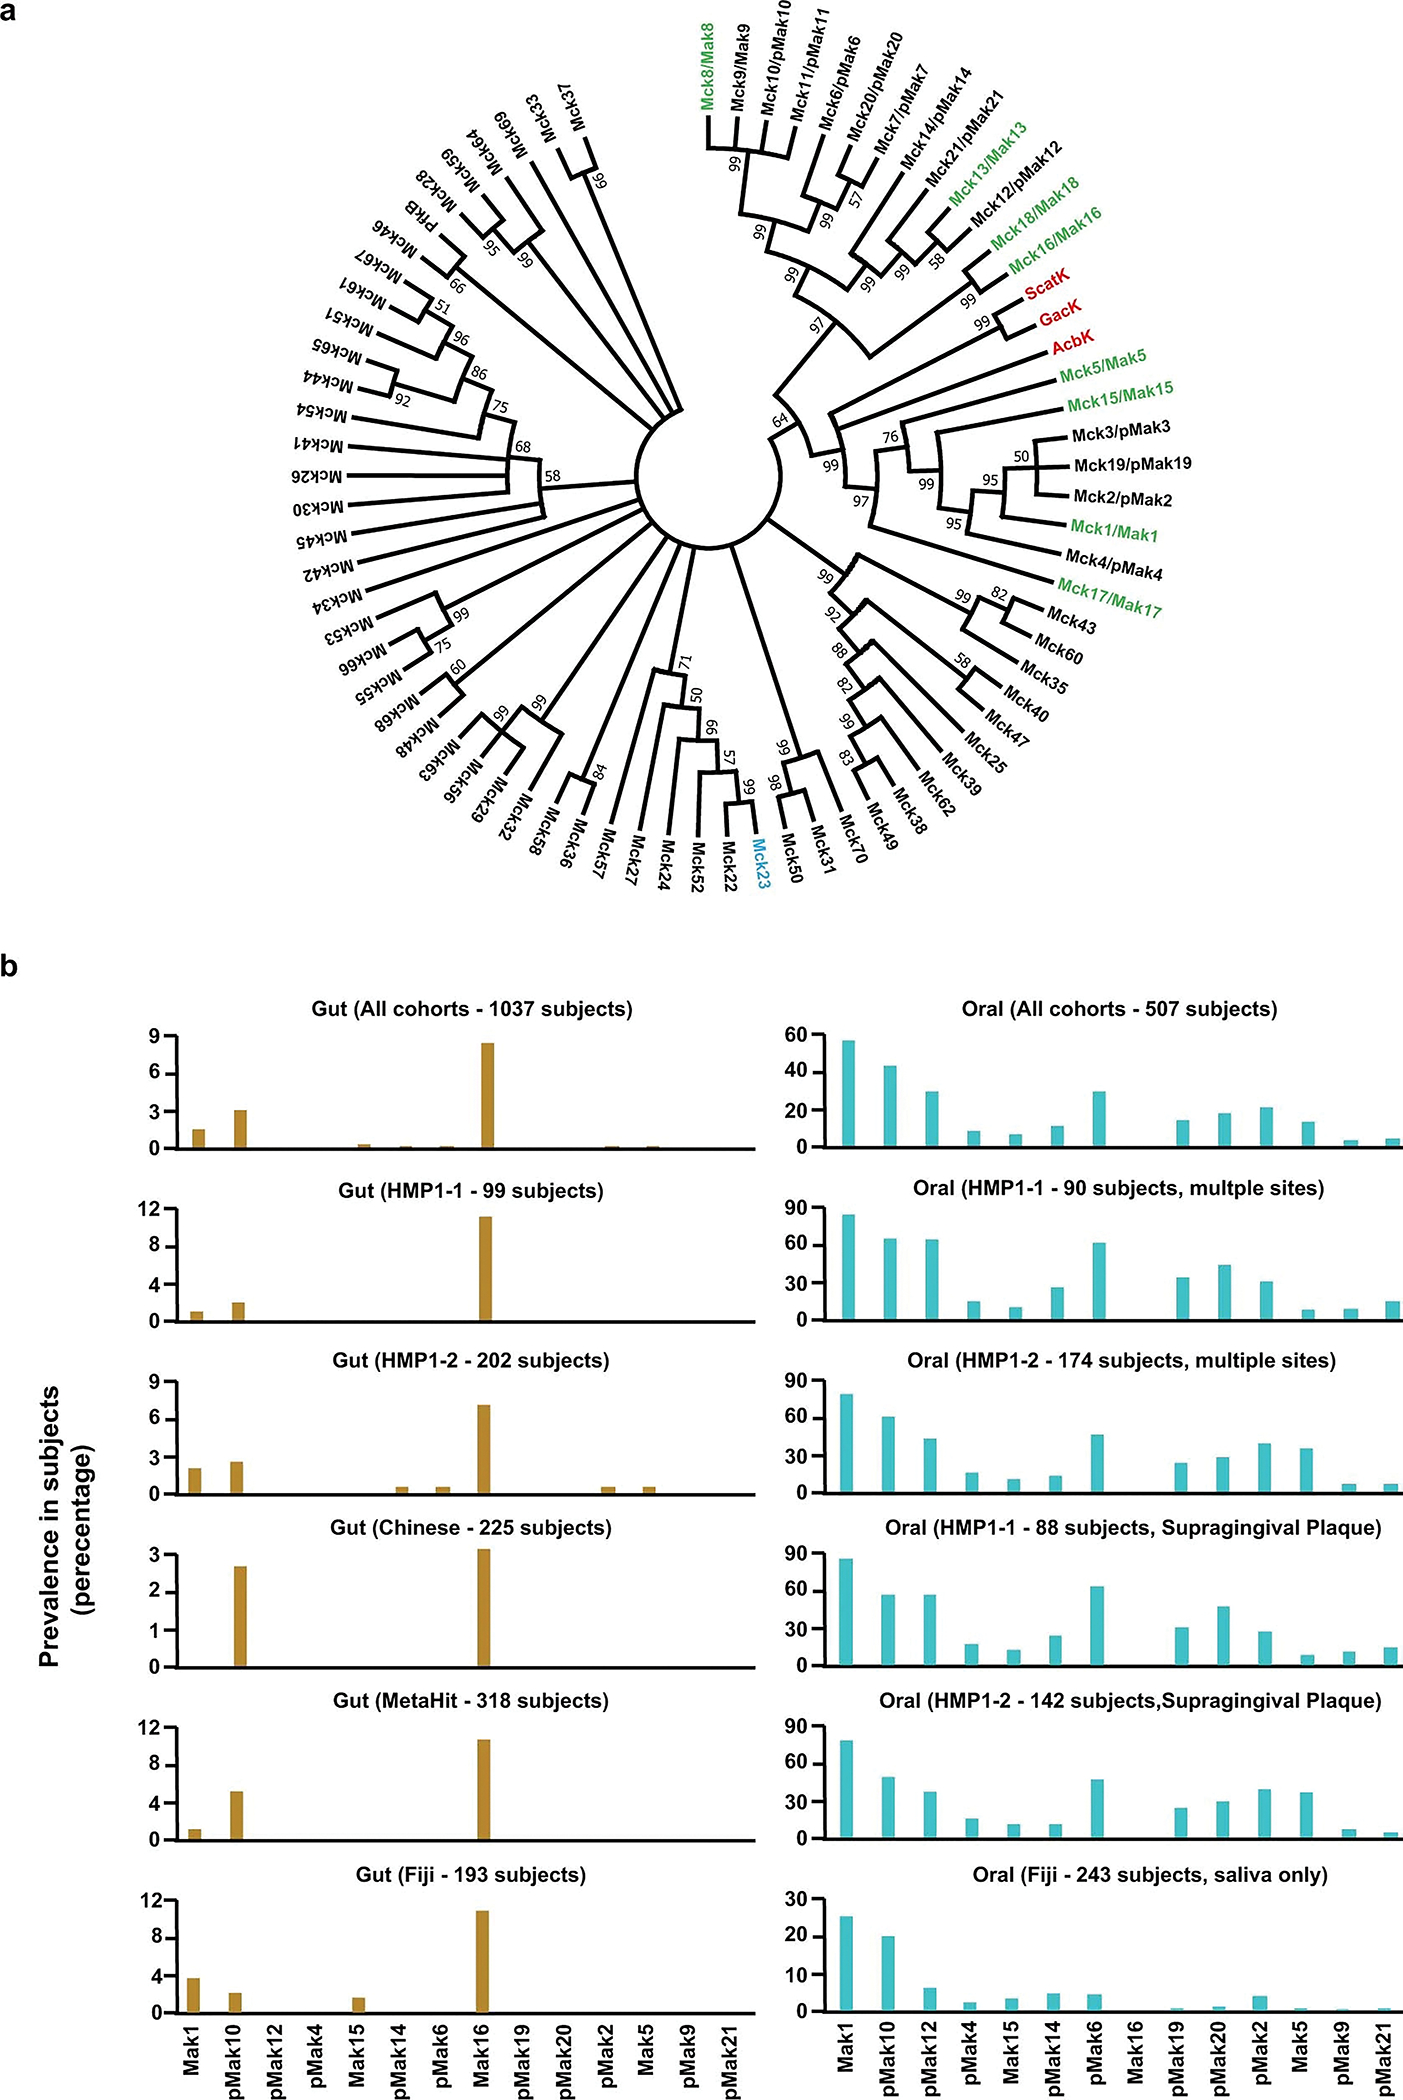
a. A maximum likelihood phylogenetic tree for all AcbK homologues discovered in this study (Mcks). The tree was constructed using MEGA7, with bootstrap values of more than 50% out of 1000 replicates displayed at the branch points (see Methods). The tree includes previously characterized acarbose kinases from soil-derived Actinobacteria (red label, AcbK, GacK, and ScatK), the canonical phosphofructokinase from E. coli (PfkB), Mcks that were experimentally verified to have (green label, designated as Maks) or lack (blue label) an acarbose-O6A-kinase activity, and ones that have not been experimentally tested (black label). pMaks indicate putative Maks in the AcbK clade. b. Prevalence of selected maks and pmaks expressed as the percentage of positive individuals out of the total, across different cohorts and sampling sites and subsites (brown: gut; teal: oral). The total number of individuals in each cohort is indicated above their corresponding bar chart. Prevalence of all mcks in all cohorts can be found in Supplementary Table 2.
Extended Data Fig. 3 |. Purification and biochemical characterization of a subset of Mcks/Maks.
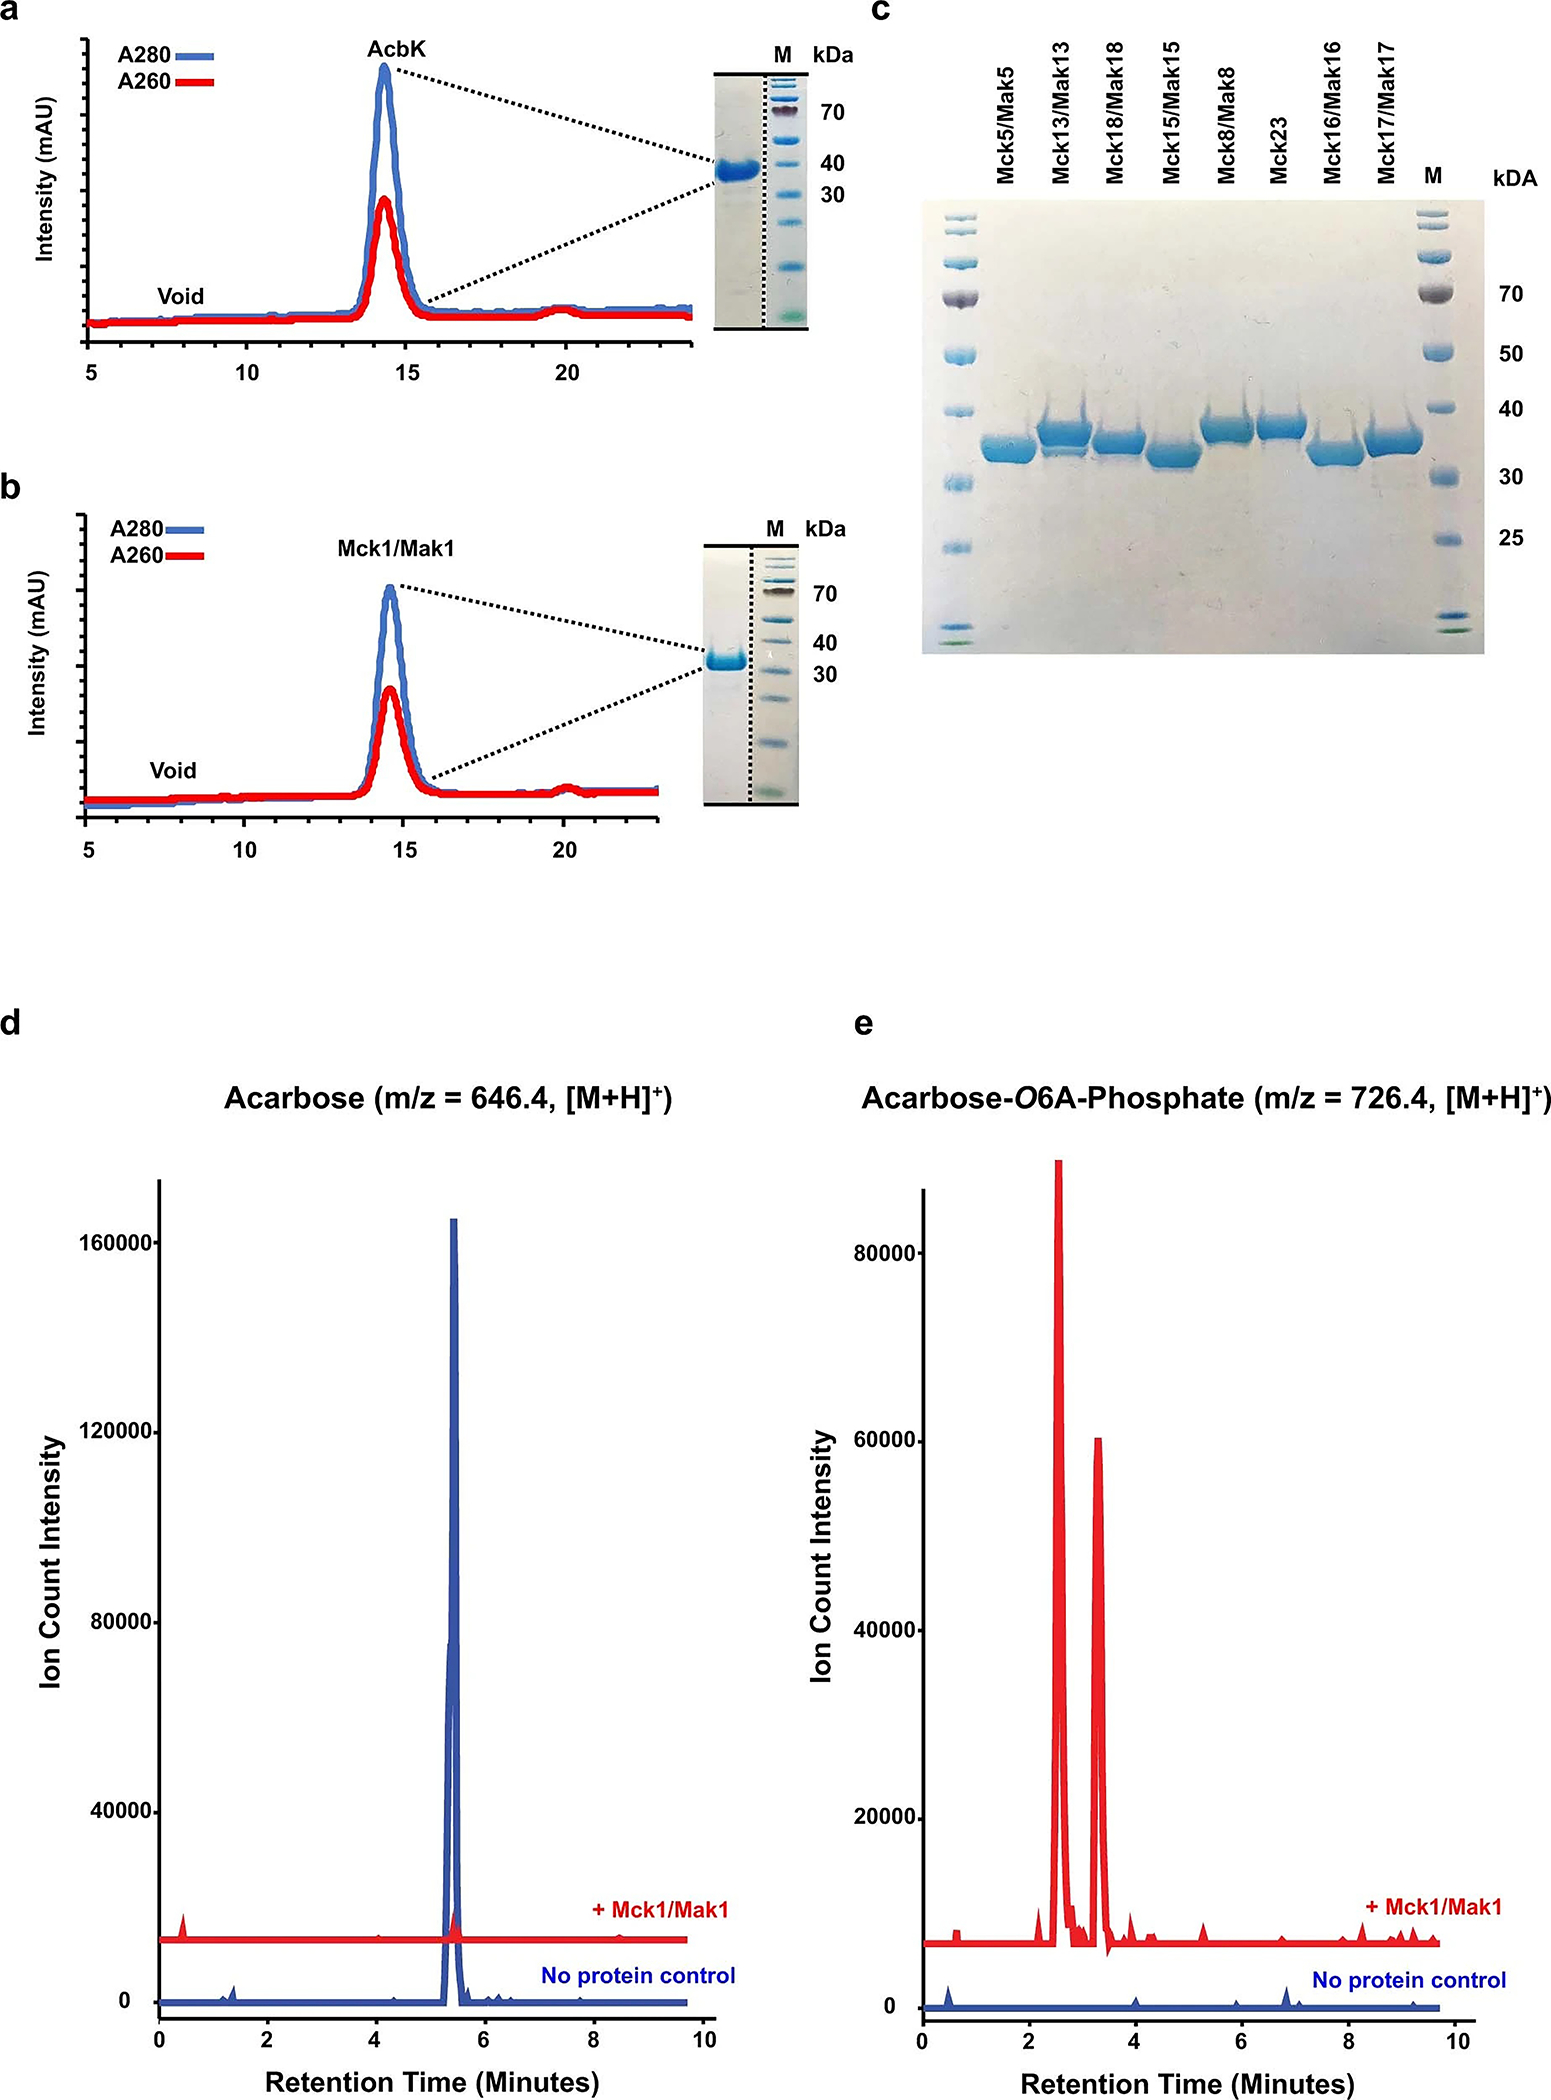
a. Fast Protein Liquid Chromatography (FPLC) chromatograms of AcbK (a) and Mck1/Mak1 (b) purification by size exclusion chromatography, monitored at the indicated absorbance wavelengths. Coomassie stained SDS-PAGE of the collected fraction is shown on the right side of each chromatogram. c. Coomassie stained SDS-PAGE of the collected fractions for the eight additional Mcks that were tested. All Mcks were purified in the same manner as AcbK and Mck1/Mak1 (see Methods). The data shown in a, b are representative examples from among at least three different times the same experiment was performed and produced similar results. The data shown in in c is a representative example from among at least two different times the same experiment was performed and produced similar results. d. Representative Extracted Ion Chromatograms (EICs) for acarbose (m/z = 646.4, [M+H]+) from the products of a reaction of Mck1/Mak1 (red) or a no-protein control (blue) with acarbose. e. Representative EICs for acarbose-O6A-phosphate (m/z = 726.4, [M+H]+) from the products of a reaction of Mck1/Mak1 (red) or a no-protein control (blue) with acarbose (the two peaks have identical MS, HRMS, and HRMS/MS and are likely isomers of the same molecule or charge variants that elute differently, as seen with AcbK, see Extended Data Fig. 5). This product is often referred to as acarbose-7-phosphate in the literature, but for consistency, we will refer to all acarbose positions based on their displayed numbering in Fig. 1a, which matches previous PDB depositions (PDB Ligand Code: ACR). Note the complete conversion of acarbose to acarbose-O6A-phosphate. See Methods for the complete experimental details.
Extended Data Fig. 4 |. Abundances of all metagenomic read bins discovered by MetaBGC.
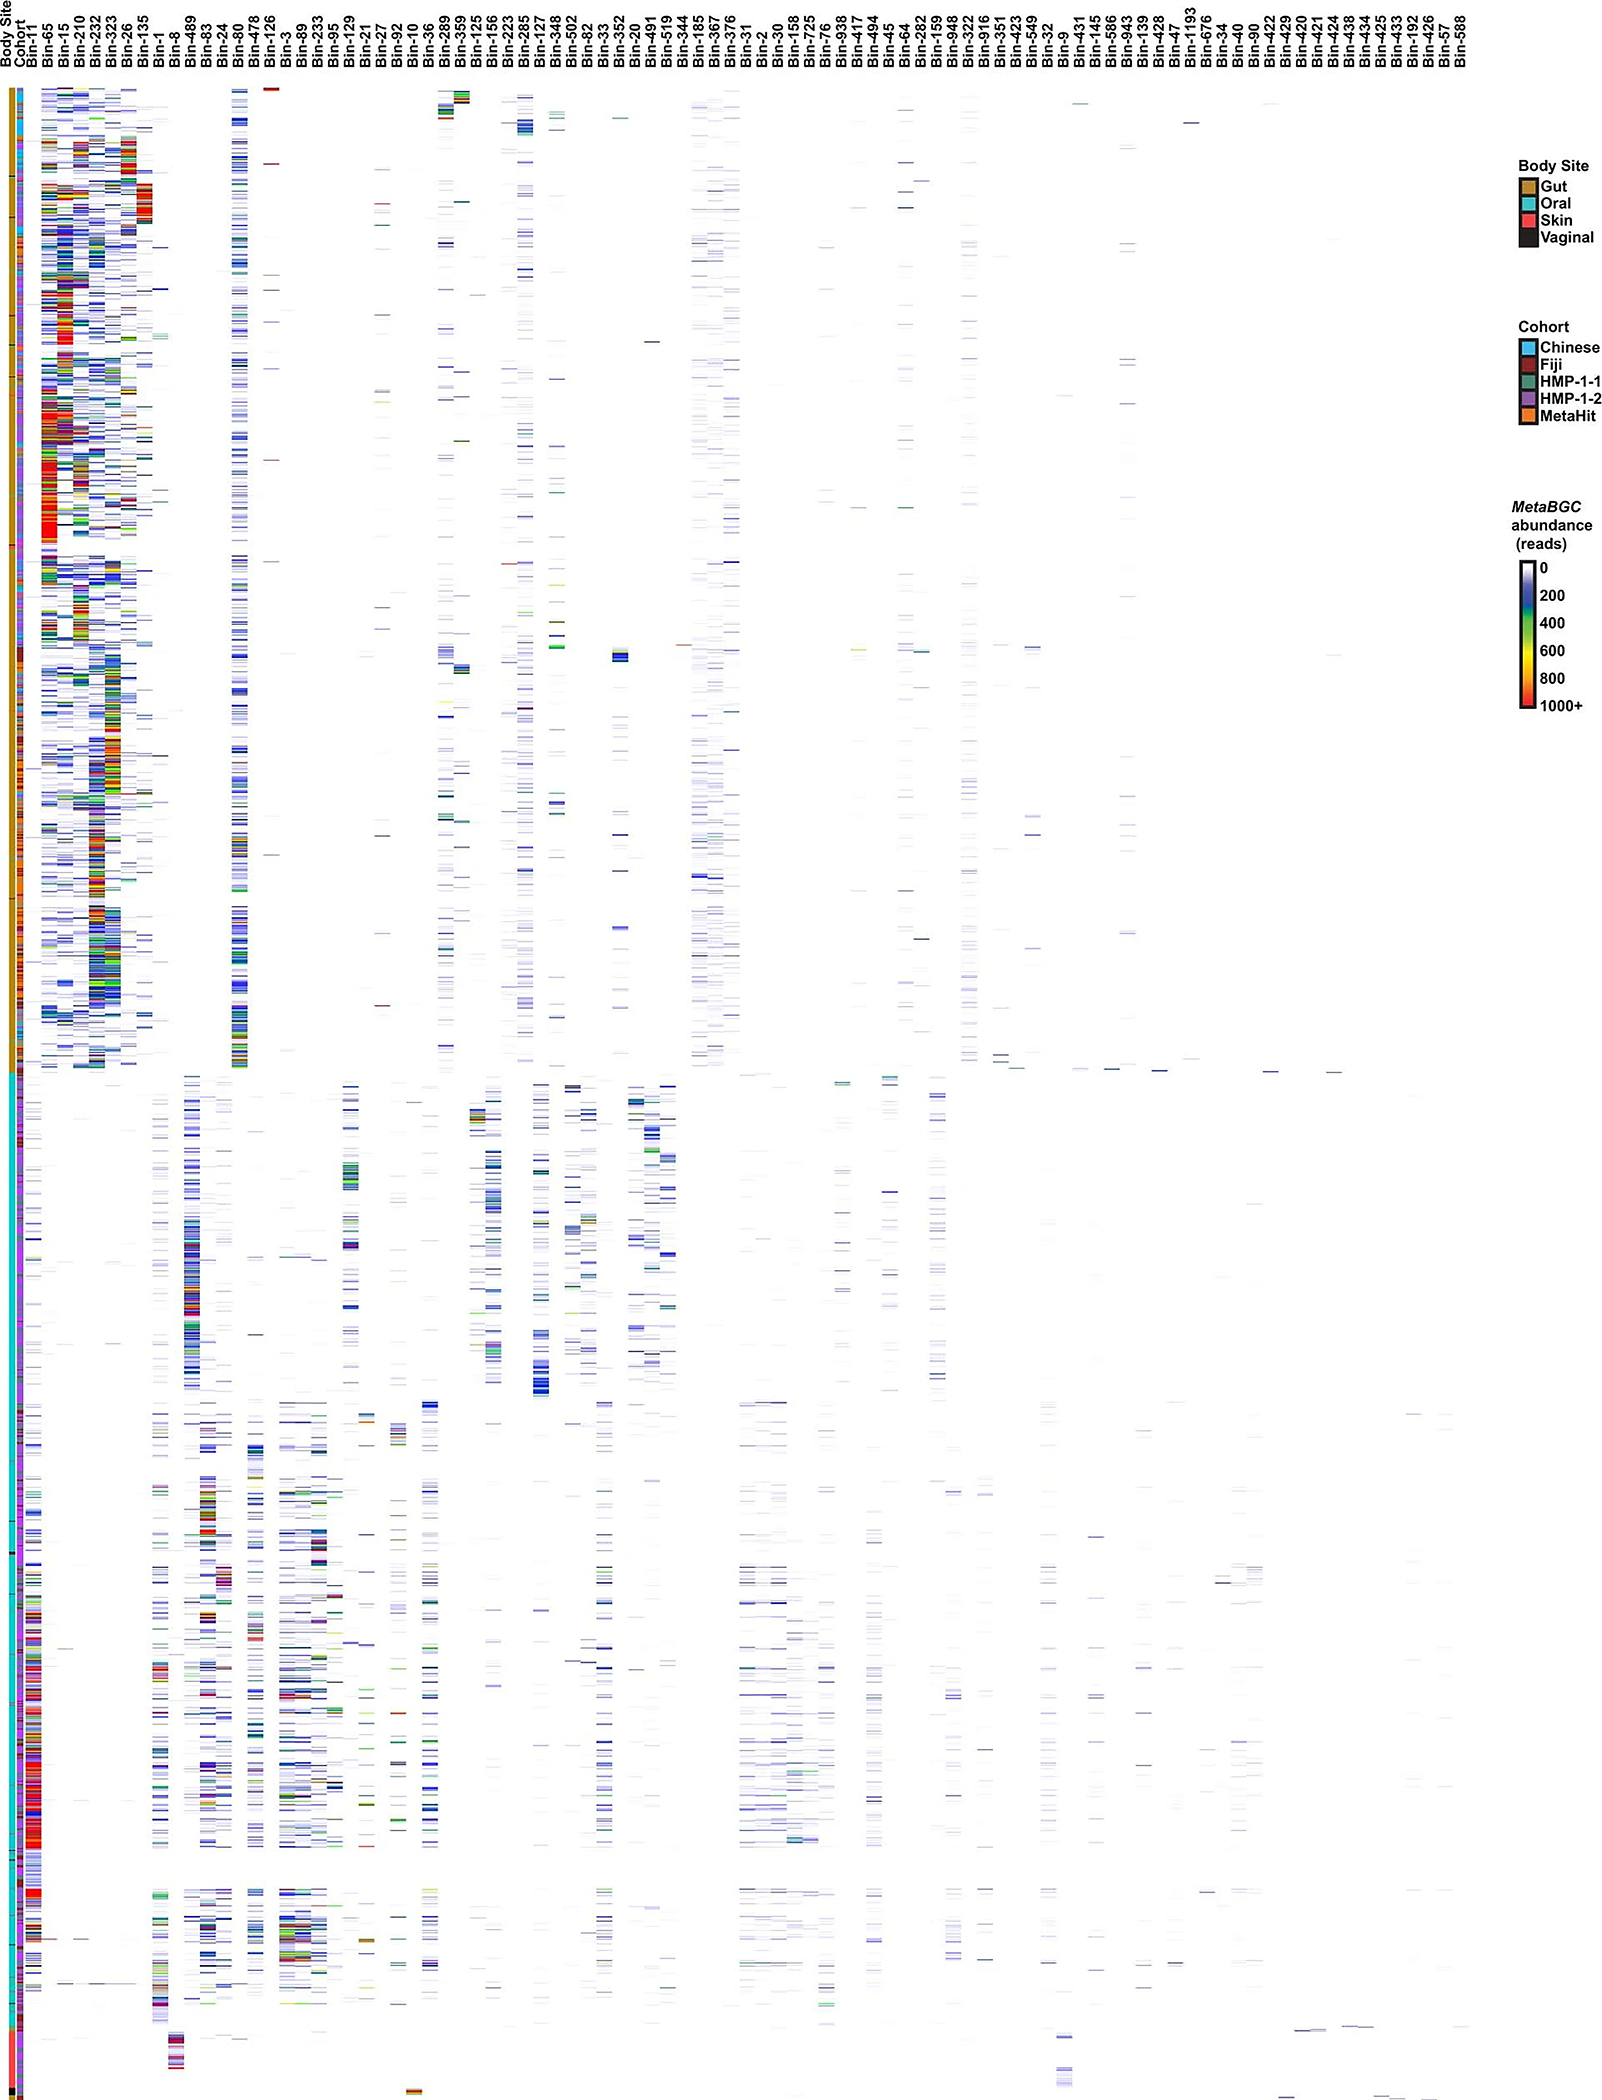
Heatmap showing the abundance of all identified bins in the five analysed cohorts as calculated by MetaBGC, and following the colour codes to the right. See Supplementary Table 2 for the complete results of this analysis and Supplementary Table 1 for corresponding Mck/Mak identifiers for each bin. Samples that had no reads mapped to any bin were excluded from the heatmap. Hierarchical clustering of the samples and bins was performed using UPGMA (unweighted pair group method with arithmetic mean) in pheatmap in R.
Extended Data Fig. 5 |. HPLC-HR-MS and HPLC-HR-MS/MS analyses of acarbose-O6A-phosphate produced by AcbK and Mak1.
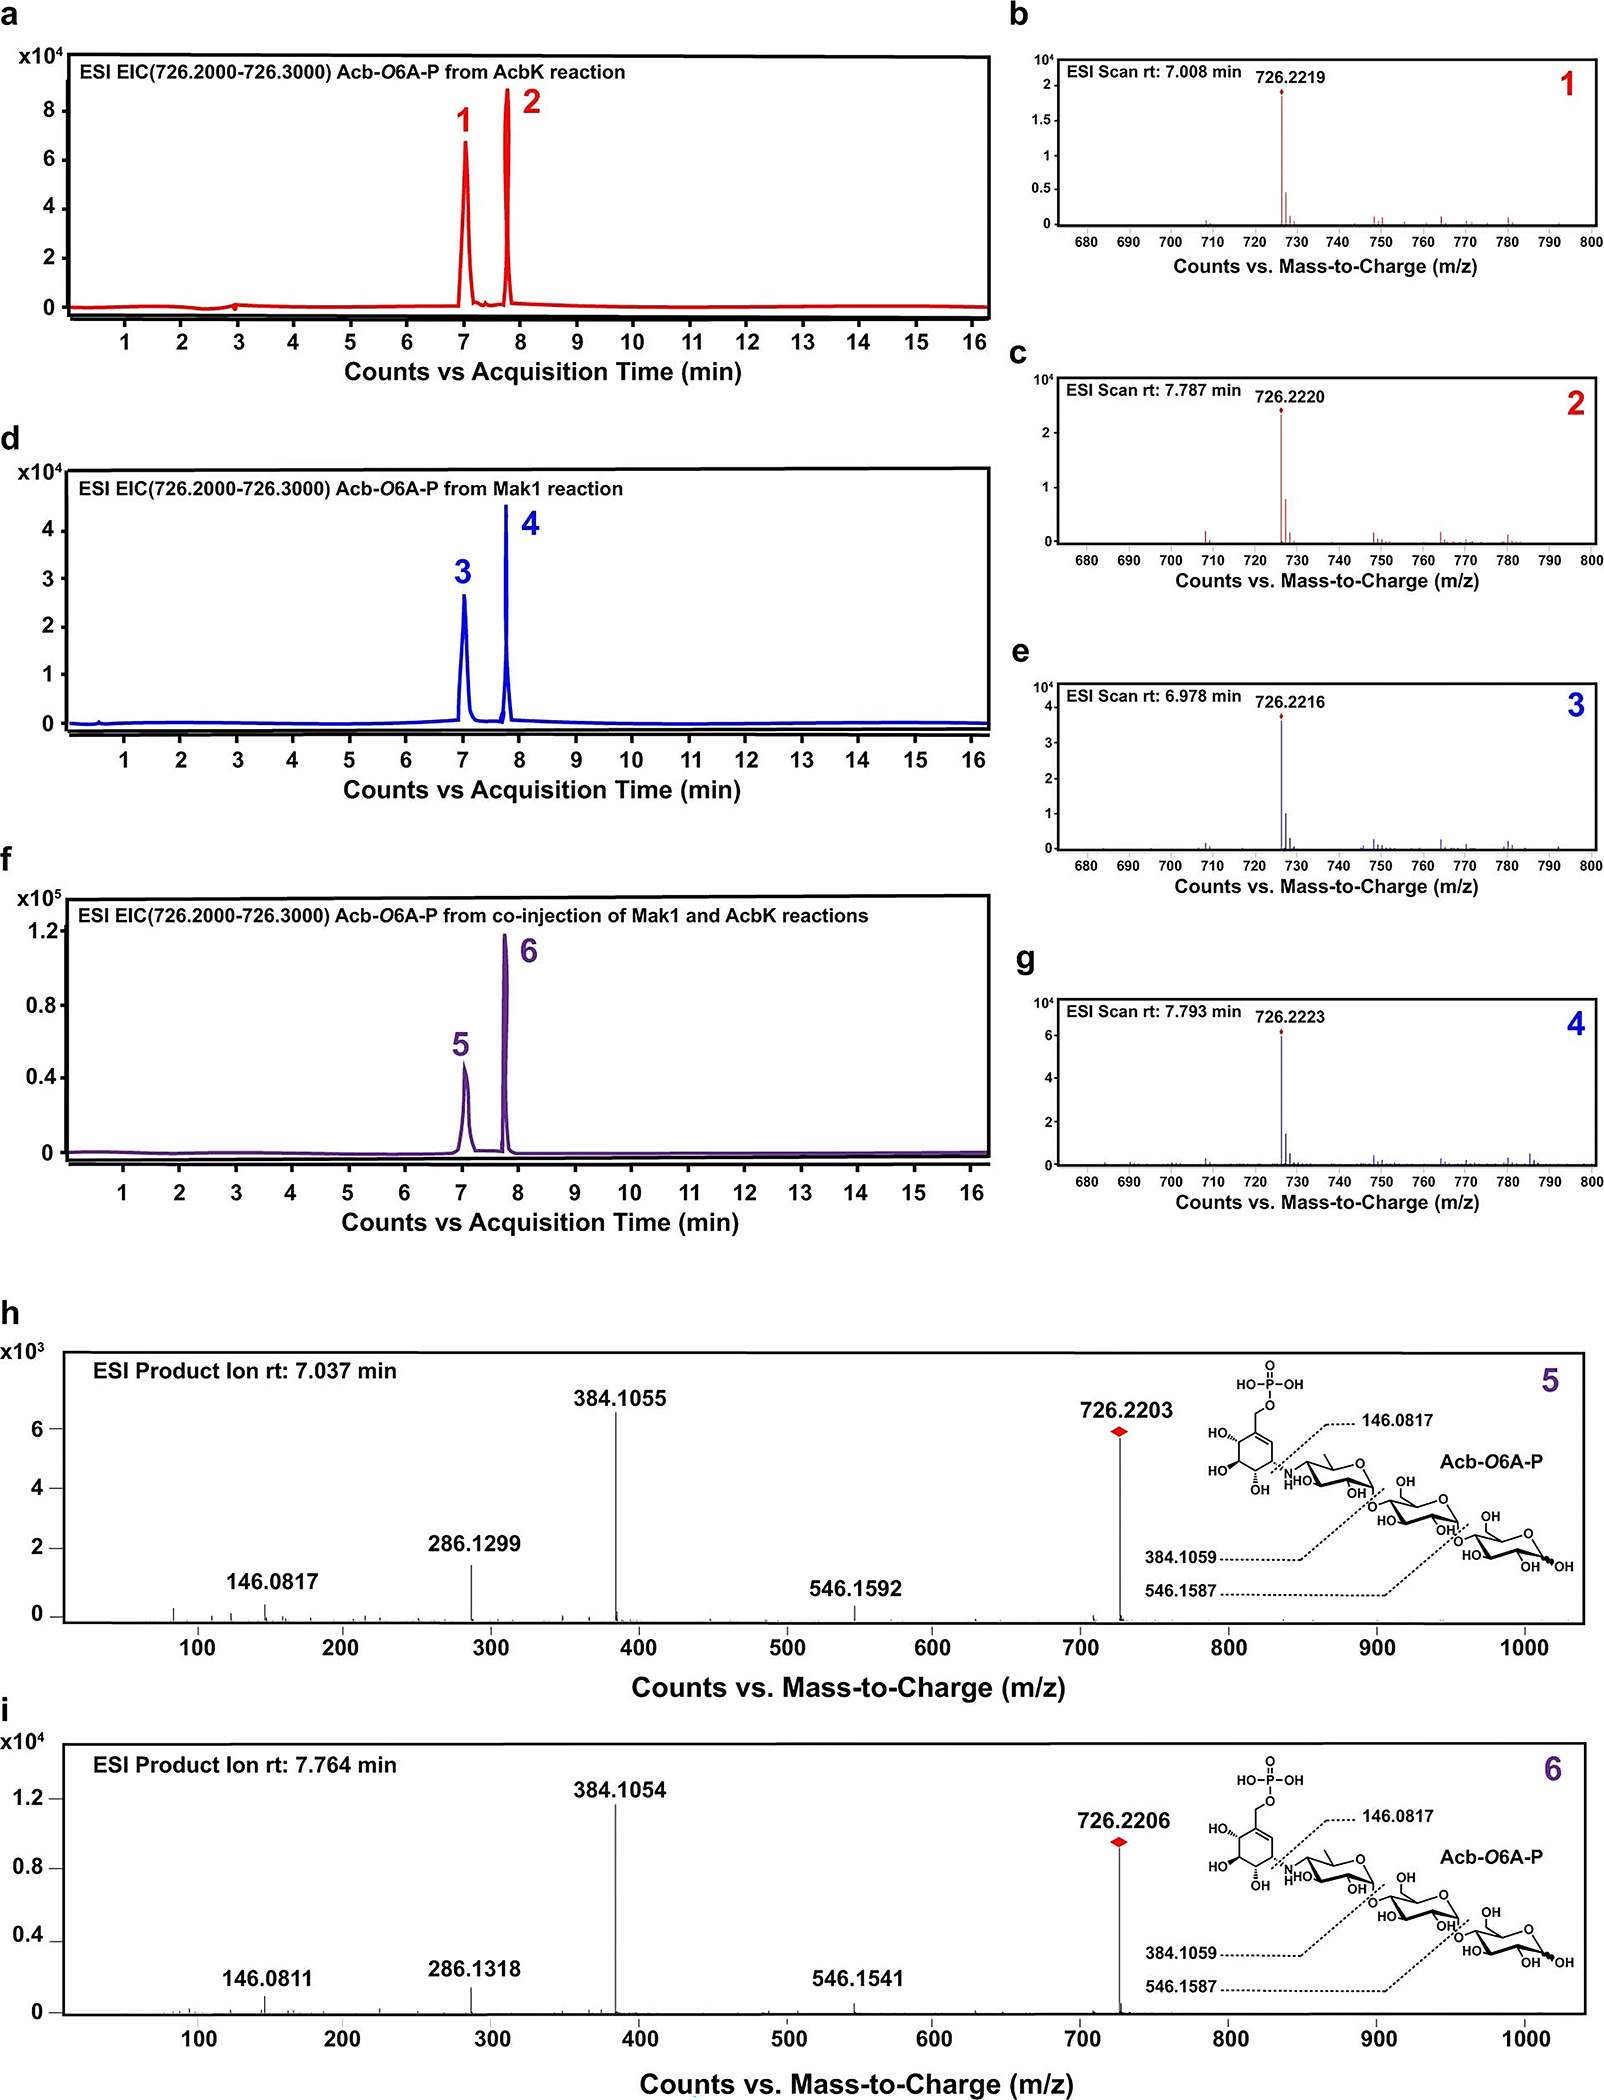
Extracted ion Chromatograms (EICs) of acarbose-O6A-phosphate produced by AcbK (a), Mak1 (d), and a co-injection of the two (f), indicating that their products are identical. EIC is displayed for m/z = 726.2–726.3 [M+H]+ in all cases. b, c, e, g, HR-MS of the two acarbose-O6A-phosphate peaks produced by either AcbK (b, c) or Mak1 (e, g), following the numbering scheme on the individual EIC peaks. h, i, identical HR-MS/MS fragmentation patterns of the two EIC peaks of acarbose-O6A-phosphate from the co-injection analysis in f. The structure of acarbose-O6A-phosphate is shown on the right, along with its predicted fragments and their calculated mass to charge ratios that match observed ones.
Extended Data Fig. 6 |. Additional biochemical characterization of Mak1 and AcbK.
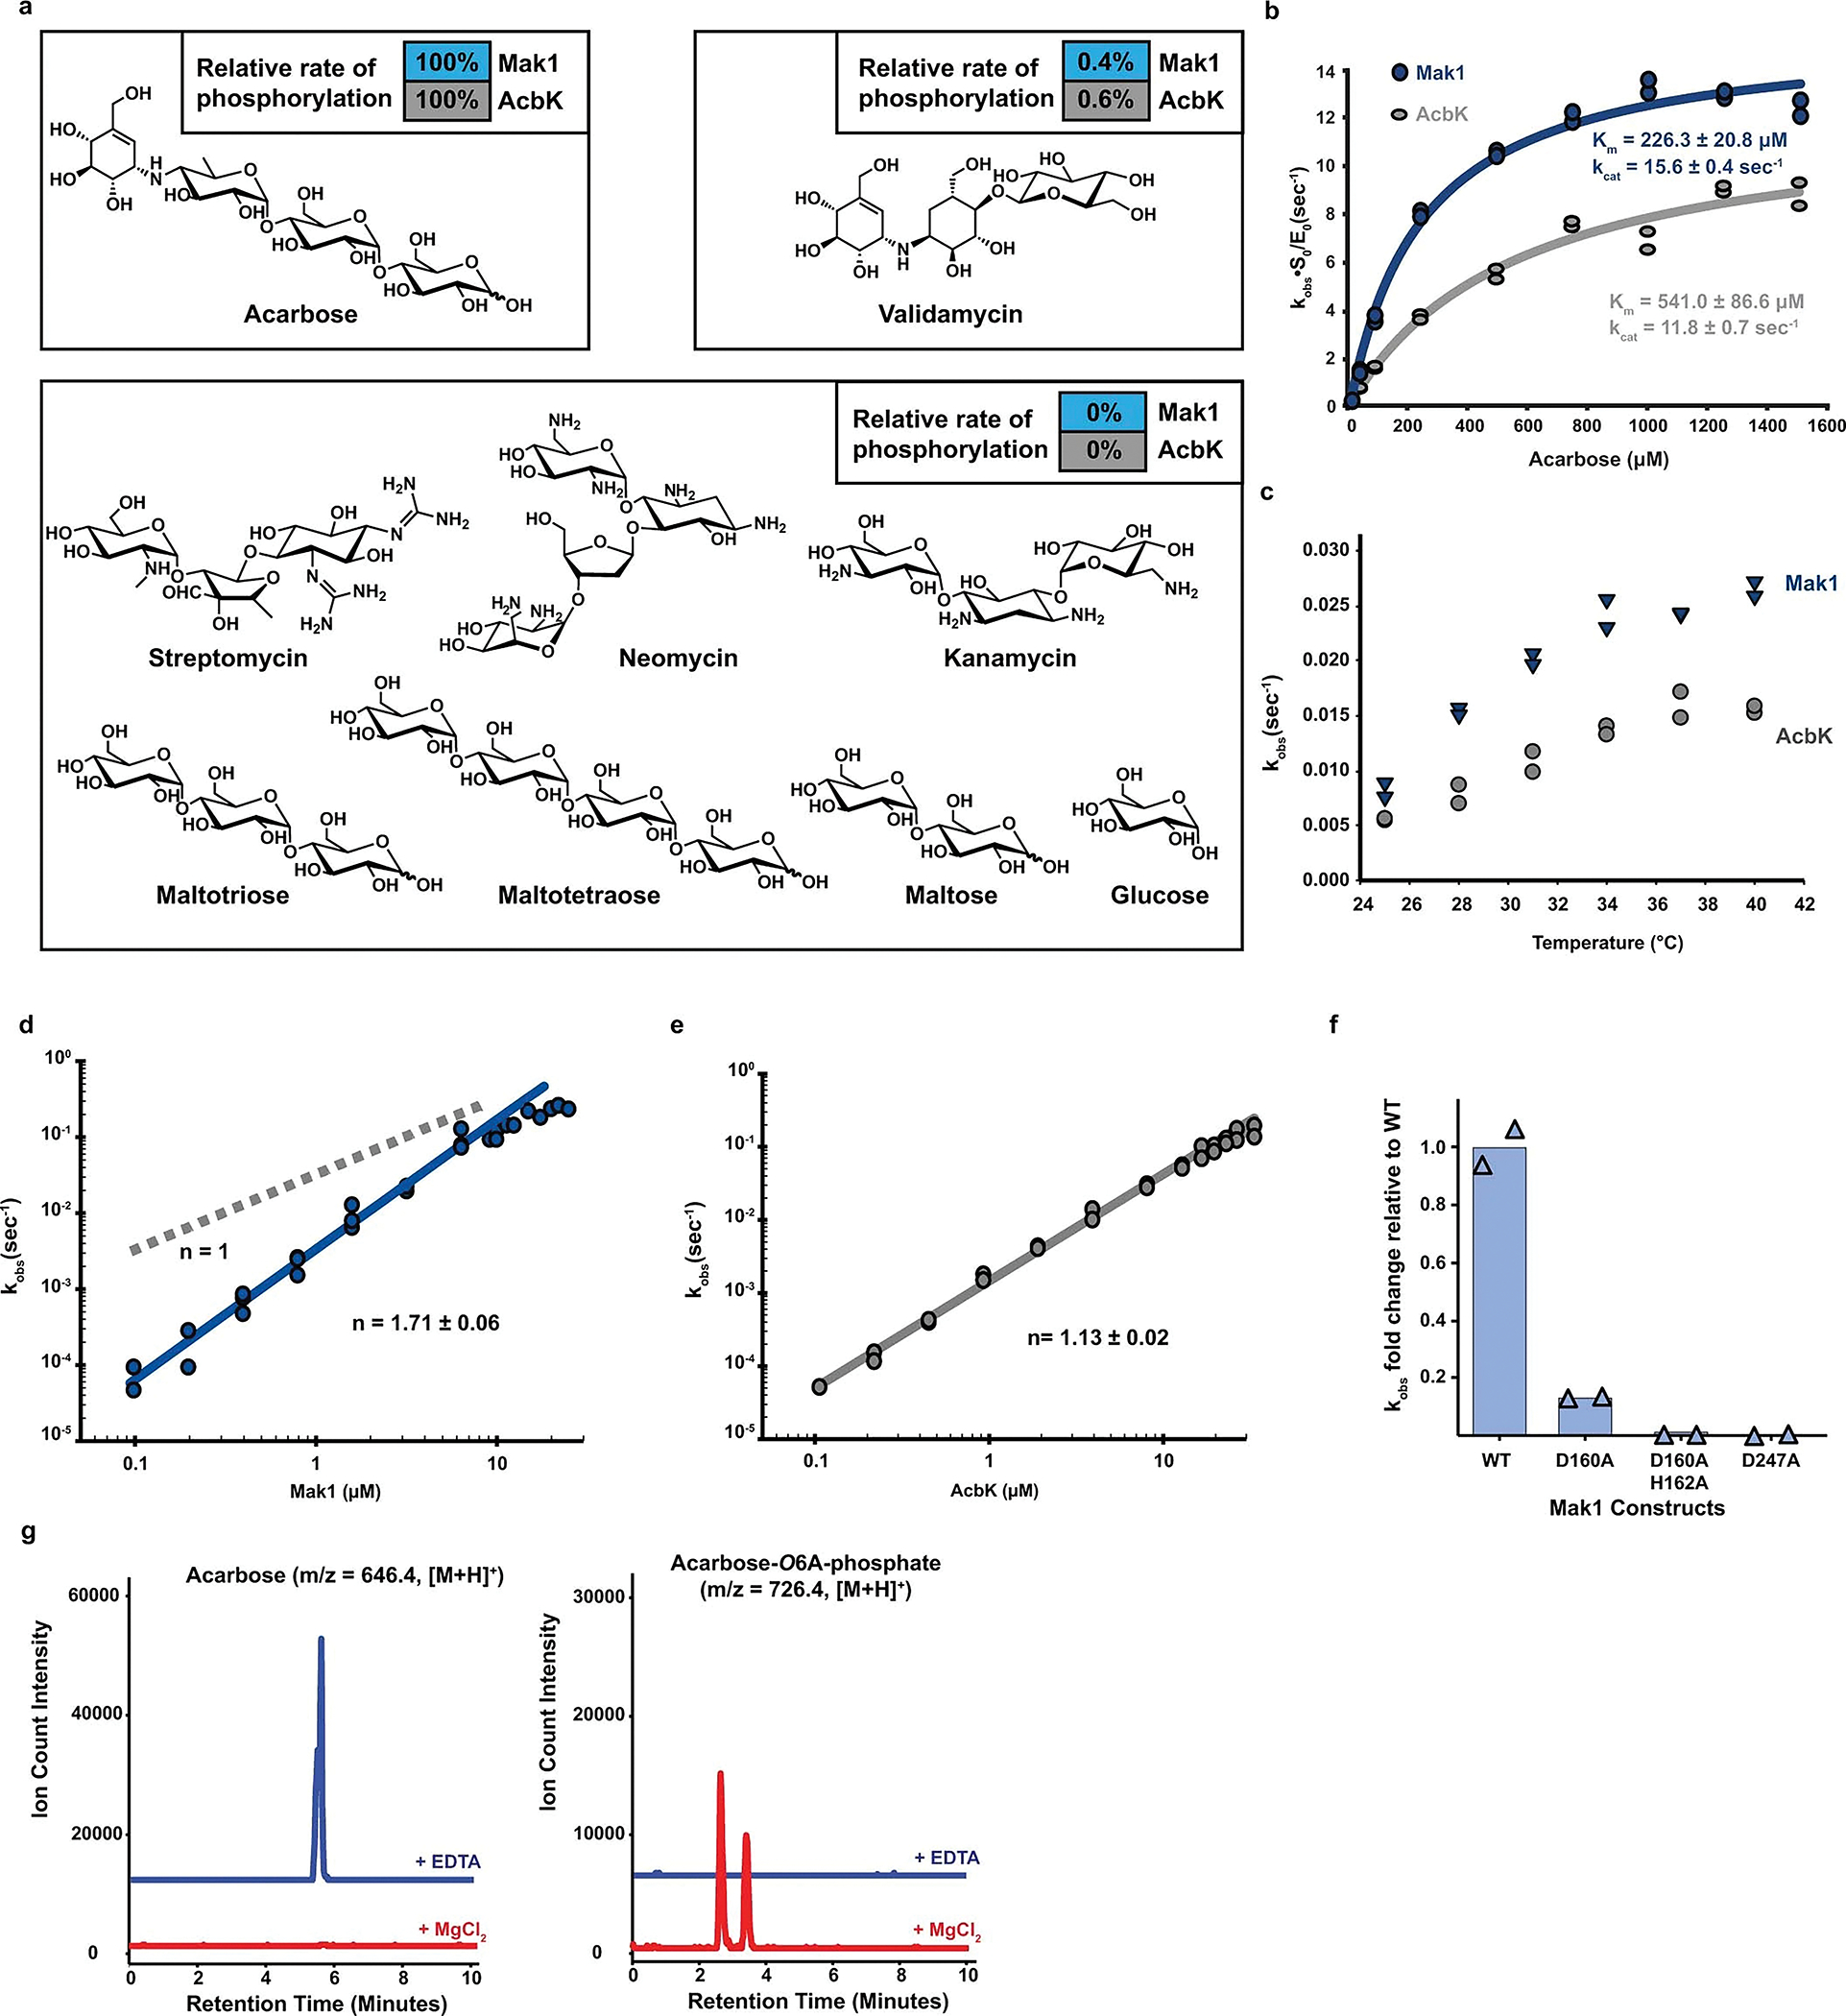
a. Phosphorylation rates (relative to the acarbose phosphorylation rate, which is set as 100%) at which Mak1 and AcbK phosphorylate a diverse panel of carbohydrates and aminoglycosides with structural similarities to acarbose. No phosphorylation was detected for all but one (validamycin) of the substrates under the same experimental conditions (see Methods). Experiments were done in duplicates with the average value used for rate comparisons; raw data is available in Supplementary Table 3. b. Michaelis-Menten saturation curves for AcbK (grey) and Mak1 (blue) performed at 1 μm enzyme concentration. Km and kcat values are indicated in their respective colours and individual kobs measurement replicates are shown on the graph for both enzymes. Raw data is available in Supplementary Table 3. c. kobs of both AcbK (grey) and Mak1 (blue) across different temperatures from 25–40 °C in 3 °C steps. The difference in kobs between the two enzymes can be seen across different temperatures. d, e. Hill plot (logarithm of kobs on the the y axis and logarithm of protein concentration on the x axis) of Mak1 (d) and AcbK (e). The Hill coefficient (slope) is greater than 1 for Mak1 (d, n=1.71 ± 0.06, n=1 is shown in grey dashed line for reference) but not for AcbK (e, n=1.13 ± 0.02), suggesting that only Mak1 is a cooperative enzyme. f. Relative change in kobs (y axis) for the single mutants D160A and D247A as well as the double mutant (D160A, H162A) of Mak1 as compared to wild type protein (N = 2). g. Extracted Ion Chromatograms (EICs) for acarbose (left, m/z = 646.4, [M+H]+) and acarbose-O6A-phosphate (right, m/z = 726.4, [M+H]+), showing that the addition of EDTA (blue traces) abolishes the activity of Mak1, while the addition of excess MgCl2 (red traces) restores it.
Extended Data Fig. 7 |. Additional structural details of AcbK.
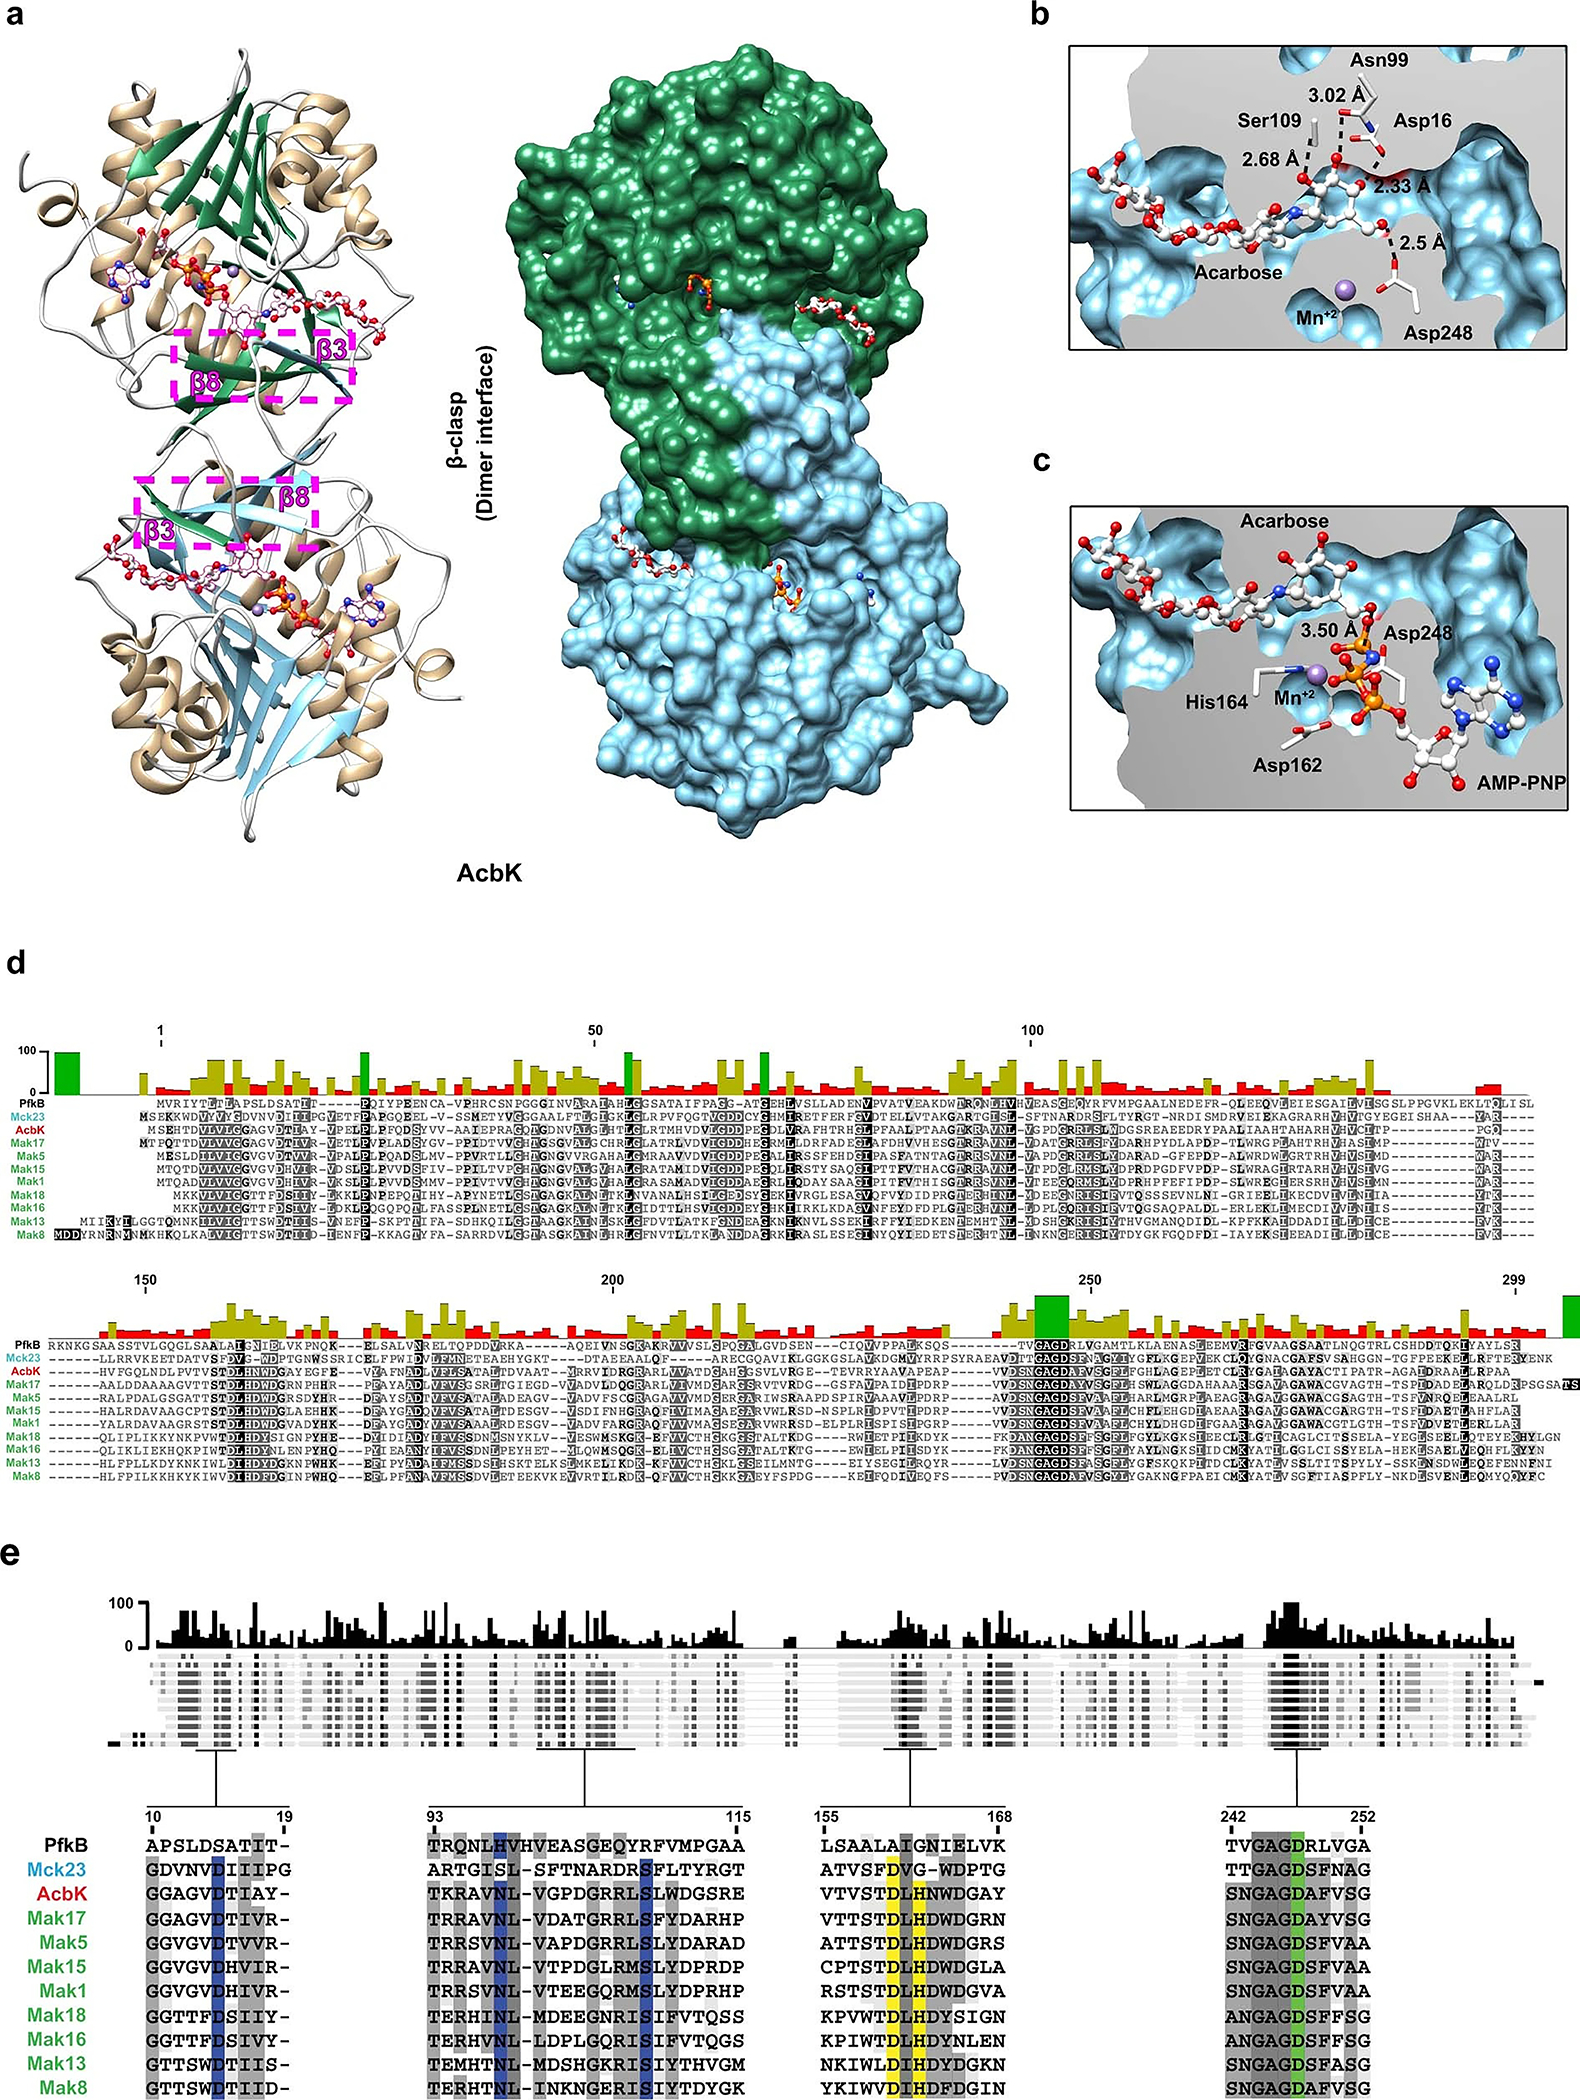
a. AcbK forms homodimers with extensive interactions between the two monomers. These interactions include multiple β strands in the β-clasp domain, most notably the β3 of one monomer and the β8 of the other (magenta highlighted box, with β strands from each monomer shaded differently for clarity). A molecular surface view is shown on the right with one AcbK monomer coloured green and the other coloured blue, highlighting the extensive surface area (1,298 Å2) involved in forming the dimer via the β-clasp domains. b. Zoomed in view of the AcbK substrate binding pocket where an extensive network of hydrogen bonds (from residues Asp16, Asn99, Ser109, and Asp248) form with all the hydroxyl groups in the acarbose A ring and hold it in place. Distances are shown for each of the hydrogen bonds mentioned above. c. Zoomed in view of the AcbK active site with important residues shown (Asp162, His164, Asp248), all involved in priming the O6A hydroxyl of acarbose for nucleophilic attack and in facilitating the transfer of the phosphate from an ATP (AMP-PNP shown) to the O6A hydroxyl of acarbose. Distance shown is from the O6A hydroxyl to the γ-phosphate. d. Full-length amino acid sequence alignment of experimentally tested Mcks/Maks, as well as AcbK and PfkB. The bars on the top of the alignment denote the average pairwise percent identity at each residue. e. Selected segments of the amino acid sequence alignment of experimentally tested Mcks/Maks, as well as AcbK and PfkB. Blue colours highlight amino acid residues that are deemed important for hydrogen bonding with the A ring of acarbose, yellow colours highlight those involved in the transfer of the phosphate group to acarbose and green indicates a residue involved in both processes. Grey colours indicate other conserved residues in the alignment. The bars on the top of the alignment denote the average pairwise percent identity at each residue.
Extended Data Fig. 8 |. Additional functional and genetic analyses of maks and end.
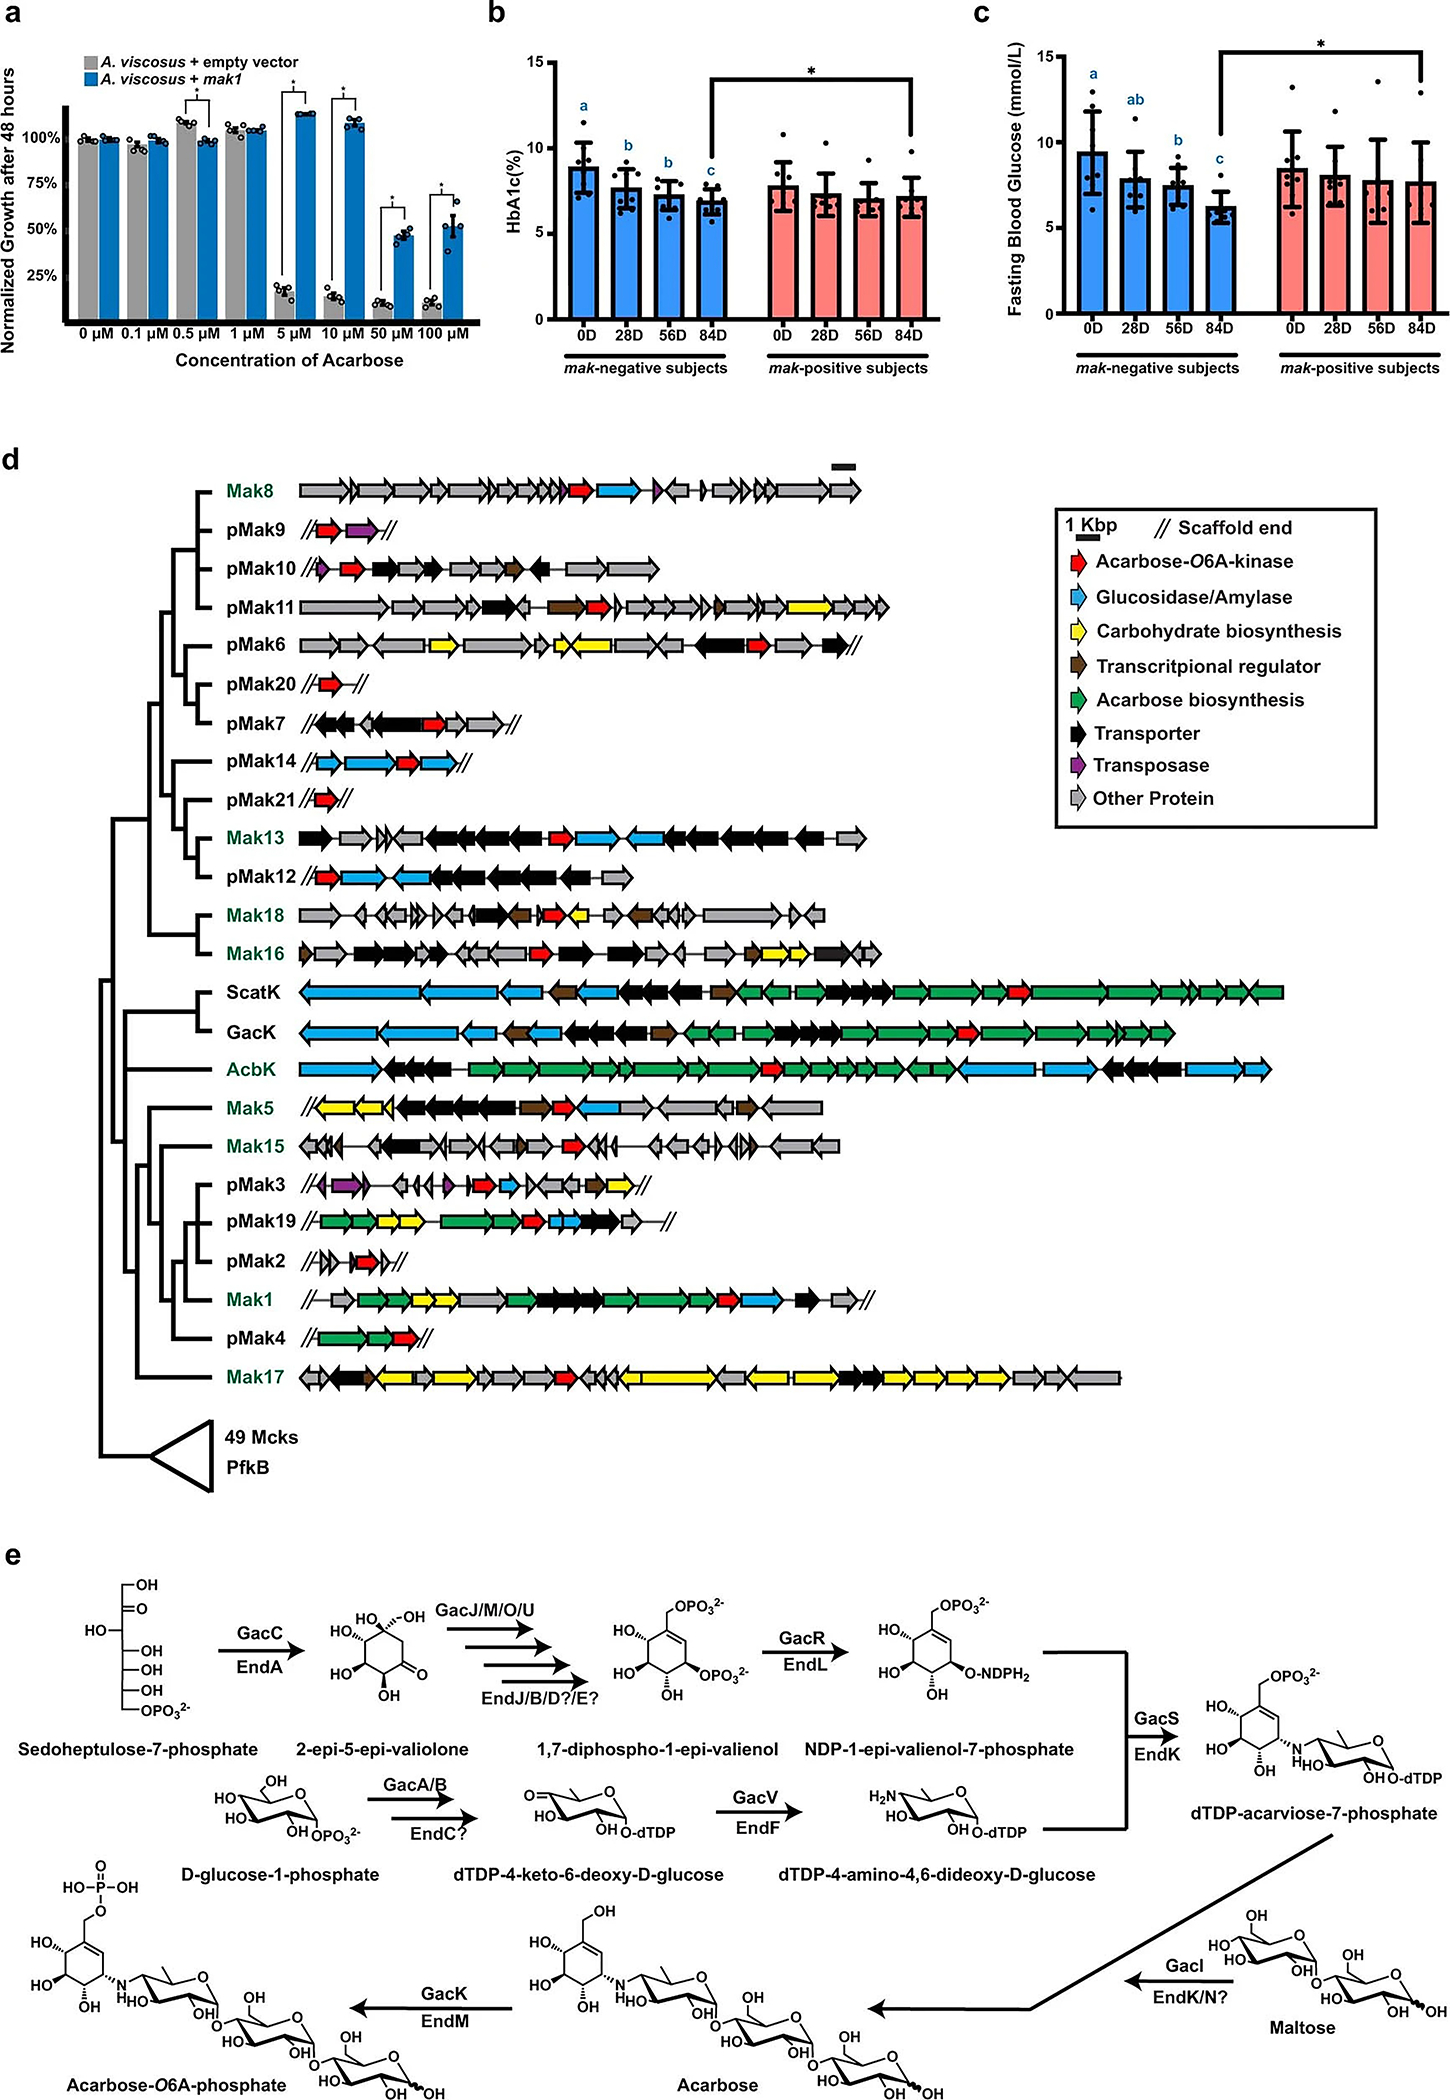
a. Normalized bacterial growth at 48 h, measured as the optical density at 600 nm and presented as a percentage of the untreated control. Different bars indicate treatments with varying acarbose concentrations for each of the tested strains: A. viscosus expressing mak1 (blue) and A. viscosus harbouring an empty-vector control (grey). Mak1 expression resulted in a statistically significant rescue of the carbohydrate-dependent growth inhibitory activity of acarbose at several concentrations. Error bars represent the standard error of the mean among four replicates and “*” denotes a p-value < 0.01 (using a two-sample t-test assuming unequal variances): 0.5 μM, p=3.33×10⁻⁵; 5 μM, p=2.17×10⁻⁵; 10 μM, p=2.37×10⁻⁸; 50 μM, p=2.96×10⁻⁵; and 100 μM, p=5.94×10⁻³. See Supplementary Table 6 for the raw experimental data. b, c. HbA1c (b) and fasting blood glucose (c) levels in mak-negative (N=8, blue) and mak-positive (N=8, red) Type 2 Diabetes patients treated with acarbose. The bar graphs show mean ± SD. Repeated measures analysis of variance (ANOVA) with Tukey’s post hoc test was used for comparing different time points in each group. Compact letter displays were used to indicate the statistical differences (P < 0.05) between different time points. The difference between groups at each post-treatment time point was evaluated by an ANCOVA model controlling for the baseline measurements. * P < 0.05. We observed statistically significant reductions in both HbA1c and fasting blood glucose levels only in mak-negative patients. In addition, at day 84, mak-negative patients showed significantly larger reduction of HbA1c (PANCOVA = 0.011) and fasting blood glucose levels (PANCOVA = 0.024) from baseline than mak-positive patients. d. Genetic context of all maks and pmaks, as well as acbK, gacK and scatK, following the colour key to the right. e. A simplified biosynthetic scheme for acarbose by gac, with gac proteins involved at each step shown above the arrows. Homologous end proteins are shown below the arrow, accounting for most of the core biosynthetic steps needed for acarbose production.
Extended Data Fig. 9 |. Distribution of mak1 and end variants in the human microbiome.

a. Percentage of samples across different cohorts that are positive for either mak1 (blue) or end (green). Mak1 was considered “present” in a given sample if any reads mapped to it, and end was considered “present” in a given sample if it had a breadth coverage of ≥25% of its length. SP stands for supragingival plaque. See Supplementary Table 8 for detailed results of this analysis. b. Genetic context of all five end variants discovered, following the colour code on the right. Note that most variants exist in close proximity to a transposase gene, suggesting a role in their mobility. c. Relative RPKM (y axis, defined as the RPKM of the gene of interest divided by the RPKM of the entire end cluster) of each end gene (x axis). Ten examples of human metagenomic samples (supragingival plaque, HMP) are shown in the top graph, where the depth of coverage is uniform across all end genes. Ten examples of human metagenomic samples (supragingival plaque, HMP) are shown in the bottom graph, where a clear spike in the depth of coverage can be observed around the endM/mak1 gene, indicating the presence of at least two different end genetic variants in these samples. Next to each graph is a representative example of metagenomic reads from supragingival plaque samples mapped to the end BGC. See Supplementary Table 10 for detailed results of this analysis. d. A heatmap showing the abundance (in RPKM) of all end genes in supragingival plaque samples of the HMP cohorts (HMP-1-1 and HMP-1-2). Different samples harbour different genetic contexts (or variants) of the end BGC: 14-gene, 8-gene, 4-gene, 2-gene, or stand-alone mak1/endM. Samples are sorted according to their classification into one of these five genetic variants listed above. e. Metagenomic reads from five different supragingival plaque samples mapped to the end BGC (see Methods). Each of the five samples illustrates an example for one of the unique genetic variants described above. f. A Pie chart showing the distribution of the five genetic variants amongst HMP participants (supragingival plaque samples). If participants had multiple visits and different variants across visits, they were classified into end (multiple variants) (see Supplementary Table 10).
Supplementary Material
Acknowledgements
We thank the NSLS-2 AMX and FMX beamline staff for their assistance with data collection and the crystallography core facility at the Department of Molecular Biology, Princeton University. We thank M. Cahn and M. Elmassry for assistance with metagenomic data analysis; S. Chatterjee for general assistance; and the rest of the Donia laboratory for discussions. Funding for this project was provided by an NIH Director’s New Innovator Award (1DP2AI124441) and the Pew Biomedical Scholars Program to M.S.D.; an NIH grant (1R01GM110161), a Burroughs Wellcome Foundation Grant (1013579) and an award from The Vallee Foundation to A.K. J.B. is funded by a training grant from the National Institute of General Medicine Sciences (NIGMS) (T32GM007388) and L.Z. is a CIFAR fellow. This research used the AMX and FMX beamlines of the National Synchrotron Light Source II, a United States Department of Energy (DOE) Office of Science User Facility operated for the DOE Office of Science by Brookhaven National Laboratory under contract no. DE-SC0012704. The Life Science Biomedical Technology Research resource, which supports AMX and FMX, is primarily supported by the NIH (NIGMS) through a Biomedical Technology Research Resource P41 grant (P41GM111244), and by the DOE Office of Biological and Environmental Research (KP1605010).
Footnotes
Competing interests M.S.D. is a member of the scientific advisory board of Deepbiome Therapeutics, and L.Z. is a co-founder of Notitia Biotechnologies.
Reporting summary
Further information on research design is available in the Nature Research Reporting Summary linked to this paper.
Code availability
MetaBGC (v.1.3.3, https://github.com/donia-lab/MetaBGC) was used to discover AcbK homologues in unassembled metagenomic sequencing data, following the details and parameters described in the Methods.
Additional information
Supplementary information The online version contains supplementary material available at https://doi.org/10.1038/s41586-021-04091-0.
Peer review information Nature thanks Sofia Forslund and the other, anonymous, reviewer(s) for their contribution to the peer review of this work.
Reprints and permissions information is available at http://www.nature.com/reprints.
Data availability
Associated data are provided in Extended Data Figs. 1–9 and Supplementary Tables 1–10. Structures of seleno-methionine Mak1, Mak1 bound to AMP-PNP and acarbose and AcbK bound to AMP-PMP and acarbose are available in the Protein Data Bank under accession codes 6WB4, 6WB5 and 6WB7, respectively. Publicly available datasets used in the metagenomic analyses performed here were obtained as follows: HMP-1-1 (43021), Chinese (PRJNA422434), MetaHIT (PRJEB1220), Fijicomp (PRJNA217052), HMP-1-2 (PRJNA275349, PRJNA48479), human clinical trial with acarbose (PRJEB14155). The following datasets were used in metatranscriptomic analyses: PRJNA354235, PRJNA389280, PRJNA398089, PRJEB4673, PRJNA221620, https://www.mg-rast.org/linkin.cgi?project=mgp5148, PRJNA383868.
References
- 1.Chiasson JL et al. Acarbose for prevention of type 2 diabetes mellitus: the STOP-NIDDM randomised trial. Lancet 359, 2072–2077 (2002). [DOI] [PubMed] [Google Scholar]
- 2.Wehmeier UF & Piepersberg W Biotechnology and molecular biology of the alpha-glucosidase inhibitor acarbose. Appl. Microbiol. Biotechnol. 63, 613–625 (2004). [DOI] [PubMed] [Google Scholar]
- 3.Yoon S-H & Robyt JF Study of the inhibition of four alpha amylases by acarbose and its 4IV-α-maltohexaosyl and 4IV-α-maltododecaosyl analogues. Carbohydr. Res. 338, 1969–1980 (2003). [DOI] [PubMed] [Google Scholar]
- 4.Maurice CF, Haiser HJ & Turnbaugh PJ Xenobiotics shape the physiology and gene expression of the active human gut microbiome. Cell 152, 39–50 (2013). [DOI] [PMC free article] [PubMed] [Google Scholar]
- 5.Wu H et al. Metformin alters the gut microbiome of individuals with treatment–naive type 2 diabetes, contributing to the therapeutic effects of the drug. Nat. Med. 23, 850–858 (2017). [DOI] [PubMed] [Google Scholar]
- 6.Maier L et al. Extensive impact of non-antibiotic drugs on human gut bacteria. Nature 555, 623–628 (2018). [DOI] [PMC free article] [PubMed] [Google Scholar]
- 7.Whang A, Nagpal R & Yadav H Bi-directional drug-microbiome interactions of anti-diabetics. eBioMedicine 39, 591–602 (2019). [DOI] [PMC free article] [PubMed] [Google Scholar]
- 8.Le Bastard Q et al. Systematic review: human gut dysbiosis induced by non-antibiotic prescription medications. Aliment. Pharmacol. Ther. 47, 332–345 (2018). [DOI] [PubMed] [Google Scholar]
- 9.Maruhama Y et al. Effects of a glucoside-hydrolase inhibitor (Bay g 5421) on serum lipids, lipoproteins and bile acids, fecal fat and bacterial flora, and intestinal gas production in hyperlipidemic patients. Tohoku J. Exp. Med. 132, 453–462 (1980). [DOI] [PubMed] [Google Scholar]
- 10.Su B et al. Acarbose treatment affects the serum levels of inflammatory cytokines and the gut content of bifidobacteria in Chinese patients with type 2 diabetes mellitus. J. Diabetes 7, 729–739 (2015). [DOI] [PubMed] [Google Scholar]
- 11.Zhang X et al. Effects of acarbose on the gut microbiota of prediabetic patients: a randomized, double-blind, controlled crossover trial. Diabetes Ther. 8, 293–307 (2017). [DOI] [PMC free article] [PubMed] [Google Scholar]
- 12.Santilli AD, Dawson EM, Whitehead KJ & Whitehead DC Nonmicrobicidal small molecule inhibition of polysaccharide metabolism in human gut microbes: a potential therapeutic avenue. ACS Chem. Biol. 13, 1165–1172 (2018). [DOI] [PubMed] [Google Scholar]
- 13.Baxter NT, Lesniak NA, Sinani H, Schloss PD & Koropatkin NM The glucoamylase inhibitor acarbose has a diet-dependent and reversible effect on the murine gut microbiome. mSphere 4, 10.1128/mSphere.00528-18 (2019). [DOI] [PMC free article] [PubMed] [Google Scholar]
- 14.Zhang M et al. Effects of metformin, acarbose, and sitagliptin monotherapy on gut microbiota in Zucker diabetic fatty rats. BMJ Open Diabetes Res. Care 7, e000717 (2019). [DOI] [PMC free article] [PubMed] [Google Scholar]
- 15.Ahr HJ et al. Pharmacokinetics of acarbose. Part I: absorption, concentration in plasma, metabolism and excretion after single administration of [14C]acarbose to rats, dogs and man. Arzneimittelforschung 39, 1254–1260 (1989). [PubMed] [Google Scholar]
- 16.Zhao L et al. Gut bacteria selectively promoted by dietary fibers alleviate type 2 diabetes. Science 359, 1151–1156 (2018). [DOI] [PubMed] [Google Scholar]
- 17.Wehmeier UF The biosynthesis and metabolism of acarbose in Actinoplanes sp. SE 50/110: a progress report. Biocatal. Biotransform. 21, 279–284 (2003). [Google Scholar]
- 18.Schmidt DD et al. Alpha-glucosidase inhibitors. New complex oligosaccharides of microbial origin. Naturwissenschaften 64, 535–536 (1977). [DOI] [PubMed] [Google Scholar]
- 19.Drepper A & Pape H Acarbose 7-phosphotransferase from Actinoplanes sp.: purification, properties, and possible physiological function. J. Antibiot. 49, 664–668 (1996). [DOI] [PubMed] [Google Scholar]
- 20.Goeke K, Drepper A & Pape H Formation of acarbose phosphate by a cell-free extract from the acarbose producer Actinoplanes sp. J. Antibiot. 49, 661–663 (1996). [DOI] [PubMed] [Google Scholar]
- 21.Human Microbiome Project C Structure, function and diversity of the healthy human microbiome. Nature 486, 207–214 (2012). [DOI] [PMC free article] [PubMed] [Google Scholar]
- 22.Qin J et al. A metagenome-wide association study of gut microbiota in type 2 diabetes. Nature 490, 55–60 (2012). [DOI] [PubMed] [Google Scholar]
- 23.Nielsen HB et al. Identification and assembly of genomes and genetic elements in complex metagenomic samples without using reference genomes. Nat. Biotechnol. 32, 822–828 (2014). [DOI] [PubMed] [Google Scholar]
- 24.Brito IL et al. Mobile genes in the human microbiome are structured from global to individual scales. Nature 535, 435–439 (2016). [DOI] [PMC free article] [PubMed] [Google Scholar]
- 25.Lloyd-Price J et al. Strains, functions and dynamics in the expanded Human Microbiome Project. Nature 550, 61–66 (2017). [DOI] [PMC free article] [PubMed] [Google Scholar]
- 26.Sugimoto Y et al. A metagenomic strategy for harnessing the chemical repertoire of the human microbiome. Science 366, eaax9176 (2019). [DOI] [PMC free article] [PubMed] [Google Scholar]
- 27.Rockser Y & Wehmeier UF The gac-gene cluster for the production of acarbose from Streptomyces glaucescens GLA.O: identification, isolation and characterization. J. Biotechnol. 140, 114–123 (2009). [DOI] [PubMed] [Google Scholar]
- 28.Guo X et al. Draft genome sequence of Streptomyces coelicoflavus ZG0656 reveals the putative biosynthetic gene cluster of acarviostatin family alpha-amylase inhibitors. Lett. Appl. Microbiol. 55, 162–169 (2012). [DOI] [PubMed] [Google Scholar]
- 29.Parducci RE, Cabrera R, Baez M & Guixe V Evidence for a catalytic Mg2+ ion and effect of phosphate on the activity of Escherichia coli phosphofructokinase-2: regulatory properties of a ribokinase family member. Biochemistry 45, 9291–9299 (2006). [DOI] [PubMed] [Google Scholar]
- 30.Miller BG & Raines RT Identifying latent enzyme activities: substrate ambiguity within modern bacterial sugar kinases. Biochemistry 43, 6387–6392 (2004). [DOI] [PubMed] [Google Scholar]
- 31.Fong DH & Berghuis AM Substrate promiscuity of an aminoglycoside antibiotic resistance enzyme via target mimicry. EMBO J. 21, 2323–2331 (2002). [DOI] [PMC free article] [PubMed] [Google Scholar]
- 32.McAuley M, Huang M & Timson DJ Dynamic origins of substrate promiscuity in bacterial galactokinases. Carbohydr. Res. 486, 107839 (2019). [DOI] [PubMed] [Google Scholar]
- 33.Sigrell JA, Cameron AD, Jones TA & Mowbray SL Structure of Escherichia coli ribokinase in complex with ribose and dinucleotide determined to 1.8å resolution: insights into a new family of kinase structures. Structure 6, 183–193 (1998). [DOI] [PubMed] [Google Scholar]
- 34.Yeung MK & Kozelsky CS Transformation of Actinomyces spp. by a gram-negative broad-host-range plasmid. J. Bacteriol. 176, 4173–4176 (1994). [DOI] [PMC free article] [PubMed] [Google Scholar]
- 35.Flint HJ, Scott KP, Duncan SH, Louis P & Forano E Microbial degradation of complex carbohydrates in the gut. Gut Microbes 3, 289–306 (2012). [DOI] [PMC free article] [PubMed] [Google Scholar]
- 36.Patnode ML et al. Interspecies competition impacts targeted manipulation of human gut bacteria by fiber-derived glycans. Cell 179, 59–73 (2019). [DOI] [PMC free article] [PubMed] [Google Scholar]
- 37.Rakoff-Nahoum S, Coyne MJ & Comstock LE An ecological network of polysaccharide utilization among human intestinal symbionts. Curr. Biol. 24, 40–49 (2014). [DOI] [PMC free article] [PubMed] [Google Scholar]
- 38.Leimena MM et al. A comprehensive metatranscriptome analysis pipeline and its validation using human small intestine microbiota datasets. BMC Genom. 14, 530 (2013). [DOI] [PMC free article] [PubMed] [Google Scholar]
- 39.Goodrich JK et al. Genetic determinants of the gut microbiome in UK twins. Cell Host Microbe 19, 731–743 (2016). [DOI] [PMC free article] [PubMed] [Google Scholar]
- 40.Villmones HC et al. Species level description of the human ileal bacterial microbiota. Sci. Rep. 8, 4736 (2018). [DOI] [PMC free article] [PubMed] [Google Scholar]
- 41.Fung TC et al. Intestinal serotonin and fluoxetine exposure modulate bacterial colonization in the gut. Nat. Microbiol. 4, 2064–2073 (2019). [DOI] [PMC free article] [PubMed] [Google Scholar]
- 42.Kumar S, Stecher G & Tamura K MEGA7: Molecular Evolutionary Genetics Analysis version 7.0 for bigger datasets. Mol. Biol. Evol. 33, 1870–1874 (2016). [DOI] [PMC free article] [PubMed] [Google Scholar]
- 43.Abu-Ali GS et al. Metatranscriptome of human faecal microbial communities in a cohort of adult men. Nat. Microbiol. 3, 356–366 (2018). [DOI] [PMC free article] [PubMed] [Google Scholar]
- 44.Schirmer M et al. Dynamics of metatranscription in the inflammatory bowel disease gut microbiome. Nat. Microbiol. 3, 337–346 (2018). [DOI] [PMC free article] [PubMed] [Google Scholar]
- 45.Lloyd-Price J et al. Multi-omics of the gut microbial ecosystem in inflammatory bowel diseases. Nature 569, 655–662 (2019). [DOI] [PMC free article] [PubMed] [Google Scholar]
- 46.Peterson SN et al. Functional expression of dental plaque microbiota. Front. Cell Infect. Microbiol. 4, 108 (2014). [DOI] [PMC free article] [PubMed] [Google Scholar]
- 47.Benitez-Paez A, Belda-Ferre P, Simon-Soro A & Mira A Microbiota diversity and gene expression dynamics in human oral biofilms. BMC Genom. 15, 311 (2014). [DOI] [PMC free article] [PubMed] [Google Scholar]
- 48.Jorth P et al. Metatranscriptomics of the human oral microbiome during health and disease. mBio 5, e01012–14 (2014). [DOI] [PMC free article] [PubMed] [Google Scholar]
- 49.Szafranski SP et al. Functional biomarkers for chronic periodontitis and insights into the roles of Prevotella nigrescens and Fusobacterium nucleatum; a metatranscriptome analysis. NPJ Biofilms Microbiomes 1, 15017 (2015). [DOI] [PMC free article] [PubMed] [Google Scholar]
- 50.Schmieder R & Edwards R Quality control and preprocessing of metagenomic datasets. Bioinformatics 27, 863–864 (2011). [DOI] [PMC free article] [PubMed] [Google Scholar]
- 51.Langmead B & Salzberg SL Fast gapped-read alignment with Bowtie 2. Nat. Methods 9, 357–359 (2012). [DOI] [PMC free article] [PubMed] [Google Scholar]
- 52.Chen IA et al. IMG/M v.5.0: an integrated data management and comparative analysis system for microbial genomes and microbiomes. Nucleic Acids Res. 47, D666–D677 (2019). [DOI] [PMC free article] [PubMed] [Google Scholar]
- 53.Kabsch W Xds. Acta Crystallogr. D 66, 125–132 (2010). [DOI] [PMC free article] [PubMed] [Google Scholar]
- 54.Evans PR & Murshudov GN How good are my data and what is the resolution? Acta Crystallogr. D 69, 1204–1214 (2013). [DOI] [PMC free article] [PubMed] [Google Scholar]
- 55.Winn MD et al. Overview of the CCP4 suite and current developments. Acta Crystallogr. D 67, 235–242 (2011). [DOI] [PMC free article] [PubMed] [Google Scholar]
- 56.Sheldrick GM A short history of SHELX. Acta Crystallogr. A 64, 112–122 (2008). [DOI] [PubMed] [Google Scholar]
- 57.Krissinel E & Henrick K Inference of macromolecular assemblies from crystalline state. J. Mol. Biol. 372, 774–797 (2007). [DOI] [PubMed] [Google Scholar]
- 58.McCoy AJ et al. Phaser crystallographic software. J. Appl. Crystallogr. 40, 658–674 (2007). [DOI] [PMC free article] [PubMed] [Google Scholar]
- 59.Emsley P & Cowtan K Coot: model-building tools for molecular graphics. Acta Crystallogr. D 60, 2126–2132 (2004). [DOI] [PubMed] [Google Scholar]
- 60.Adams PD et al. PHENIX: a comprehensive Python-based system for macromolecular structure solution. Acta Crystallogr. D 66, 213–221 (2010). [DOI] [PMC free article] [PubMed] [Google Scholar]
- 61.Pettersen EF et al. UCSF Chimera—a visualization system for exploratory research and analysis. J. Comput. Chem. 25, 1605–1612 (2004). [DOI] [PubMed] [Google Scholar]
- 62.Kearse M et al. Geneious Basic: an integrated and extendable desktop software platform for the organization and analysis of sequence data. Bioinformatics 28, 1647–1649 (2012). [DOI] [PMC free article] [PubMed] [Google Scholar]
Associated Data
This section collects any data citations, data availability statements, or supplementary materials included in this article.
Supplementary Materials
Data Availability Statement
Associated data are provided in Extended Data Figs. 1–9 and Supplementary Tables 1–10. Structures of seleno-methionine Mak1, Mak1 bound to AMP-PNP and acarbose and AcbK bound to AMP-PMP and acarbose are available in the Protein Data Bank under accession codes 6WB4, 6WB5 and 6WB7, respectively. Publicly available datasets used in the metagenomic analyses performed here were obtained as follows: HMP-1-1 (43021), Chinese (PRJNA422434), MetaHIT (PRJEB1220), Fijicomp (PRJNA217052), HMP-1-2 (PRJNA275349, PRJNA48479), human clinical trial with acarbose (PRJEB14155). The following datasets were used in metatranscriptomic analyses: PRJNA354235, PRJNA389280, PRJNA398089, PRJEB4673, PRJNA221620, https://www.mg-rast.org/linkin.cgi?project=mgp5148, PRJNA383868.