Abstract
There has been growing attention on the effect of COVID‐19 on white‐matter microstructure, especially among those that self‐isolated after being infected. There is also immense scientific interest and potential clinical utility to evaluate the sensitivity of single‐shell diffusion magnetic resonance imaging (MRI) methods for detecting such effects. In this work, the performances of three single‐shell‐compatible diffusion MRI modeling methods are compared for detecting the effect of COVID‐19, including diffusion‐tensor imaging, diffusion‐tensor decomposition of orthogonal moments and correlated diffusion imaging. Imaging was performed on self‐isolated patients at the study initiation and 3‐month follow‐up, along with age‐ and sex‐matched controls. We demonstrate through simulations and experimental data that correlated diffusion imaging is associated with far greater sensitivity, being the only one of the three single‐shell methods to demonstrate COVID‐19‐related brain effects. Results suggest less restricted diffusion in the frontal lobe in COVID‐19 patients, but also more restricted diffusion in the cerebellar white matter, in agreement with several existing studies highlighting the vulnerability of the cerebellum to COVID‐19 infection. These results, taken together with the simulation results, suggest that a significant proportion of COVID‐19 related white‐matter microstructural pathology manifests as a change in tissue diffusivity. Interestingly, different b‐values also confer different sensitivities to the effects. No significant difference was observed in patients at the 3‐month follow‐up, likely due to the limited size of the follow‐up cohort. To summarize, correlated diffusion imaging is shown to be a viable single‐shell diffusion analysis approach that allows us to uncover opposing patterns of diffusion changes in the frontal and cerebellar regions of COVID‐19 patients, suggesting the two regions react differently to viral infection.
Keywords: brain microstructure, cerebellum, correlated diffusion imaging, COVID‐19, Diffusion‐tensor imaging, orthogonal‐tensor decomposition, self‐isolated, single‐shell diffusion, white matter
We used simulations and experimental data to demonstrate the feasibility of the novel correlated diffusion imaging for detecting microstructural changes in human white matter. We demonstrate in the case of mild COVID‐19, correlated diffusion imaging is superior to diffusion tensor imaging when only single‐shell data are available. Moreover, correlated diffusion imaging may exhibit sensitivities to different pathologies at different b‐values.
1. INTRODUCTION
It is increasingly recognized that the central‐nervous system (CNS) is highly vulnerable to the Coronavirus Disease 2019 (COVID‐19) (Iadecola et al., 2020). On the strength of earlier evidence from SARS and MERS, the nasal passage and blood–brain barrier (BBB) serve as the main points of entry into the brain (Krasemann et al., 2022; Meinhardt et al., 2021). The regions surrounding the olfactory cortex, including the orbitofrontal cortex, may be affected as suggested by reports of loss of olfaction (anosmia) in some COVID‐19 patients with early variants (ENT UK at The Royal College of Surgeons of England, 2020). Consequently, COVID‐19 is associated with significant neurological effects, potentially driven by more subtle microstructural brain effects that are not visible on conventional clinical scans. There is evidence that even mild COVID‐19 can induce CNS damage (Fernández‐Castañeda et al., 2022), although these issues remain understudied among nonhospitalized cohorts. This is a significant concern as, in an increasing portion of infected individuals, COVID‐19 neurological and psychiatric effects may be prolonged substantially beyond the period of infection (i.e., the post‐COVID condition) (Callard & Perego, 2020; Stefanou et al., 2022). There is, nonetheless, limited understanding of the pathophysiological mechanisms of the post‐COVID condition.
Neuroinflammation has been suggested as the core pathophysiological change associated with viral infections of the CNS in both acute COVID‐19 and the post‐COVID stage (Lee et al., 2022; Shankar et al., 2008). The inflammatory response can lead to immune‐cell recruitment and edema, and a hallmark of the early inflammatory process is the destruction of the myelin sheaths protecting cerebral white matter (demyelination), which can be a promising search target. As the degree of neuroinflammation depends on the context, duration, and course of the primary viral invasion (DiSabato et al., 2016), so does the manifestation of inflammation. To this point, different types of neuroimaging tools are useful for capturing the early‐acute, late‐acute and subacute phases of infection. For instance, neuronal death can be observed as edema, ischemic lesions and tissue loss by macrostructural T1 and T2 magnetic resonance imaging (MRI) (Russo & McGavern, 2015), particularly in the white matter bordering gray‐matter (Gilden, 2008). Conversely, white‐matter microstructural changes captured using diffusion MRI has been well correlated with disruptions in the BBB and with biomarkers of infection and inflammation in the cerebrospinal fluid (Wright et al., 2015). Conventional diffusion tensor imaging (DTI) metrics describe the size and shape of the diffusion tensor under the Gaussian‐diffusion assumption (Pierpaoli & Basser, 1996), and typically can be derived from single‐shell diffusion MRI acquisitions, which are the dominant type of acquisition in clinical research. The DTI method of acquisition and analysis provides estimates of mean diffusivity (MD) and fractional anisotropy (FA), but the latter is confounded by concurrent MD effects. The DT‐DOME (orthogonal decomposition based on the eigenvalue moments) method was proposed as a simple solution to this confounding effect, whereby the diffusion pattern is characterized by the norm of anisotropy (NA) and mode of anisotropy (MO) instead of FA (Chad et al., 2021).
There has been a recent increase in studies that assess brain microstructure in COVID‐19 (Esposito et al., 2022; Lu et al., 2020). Notably, one was conducted among 60 hospitalized patients at initial visit and 3‐month follow‐up (Lu et al., 2020); reduced MD and axial diffusivity (AD) were found in the superior fronto‐occipital fasciculus, the external capsule and the corona radiata. These observations were attributed to the accumulation of necrotic debris following neuroinflammation that impedes extracellular diffusion (Bhatt et al., 2017; Westman et al., 2019). The other study, focusing on a 1‐year follow‐up of hospitalized COVID‐19 patients (Huang et al., 2021; Lu et al., 2020), reported an absence of any significant patient‐control difference in conventional DTI and diffusional‐kurtosis parameters.
The literature presents several knowledge gaps: (1) both of these diffusion MRI studies were conducted on hospitalized patients, whereas the majority of patients are not being hospitalized during the pandemic, are self‐isolated while infectious, and have not been well studied by medical imaging modalities; (2) these two studies disagree on the nature of microstructural effects of COVID‐19, possibly as they were conducted at different follow‐up times; (3) the lack of evidence regarding the post‐COVID condition hamper our efforts to trace possible underlying disease mechanisms; and (4) whereas one of the two studies showed COVID‐related effects only when using multi‐compartmental analysis of multi‐shell data, single‐shell DTI acquisitions are more practical clinically, and assessing the sensitivity of single‐shell based metrics to COVID effects is valuable to the research community. It is thus likely beneficial to broaden the exploration of single‐shell methods beyond what has been reported. One potential alternative presented in this work is a single‐shell compatible method called correlated diffusion imaging (CDI) was proposed to enhance the difference between normal and cancerous prostate tissue (Wong et al., 2013). Given its sensitivity to prostate cancer, it would be useful to explore its utility in imaging COVID‐19 effects. Thus, in this study, we aim to compare the sensitivity of single‐shell DTI, DT‐DOME, and CDI in their abilities to address the above research gaps related to the imaging of COVID‐19 effects on white matter microstructure.
2. METHODS
2.1. Simulations
The theory of DTI, DT‐DOME, and CDI are detailed in the Theory section of the Supplementary Materials. Briefly, DT‐DOME uses orthogonal tensor decomposition to generate unbiased estimates of anisotropy parameters NA and MO (Chad et al., 2021), while CDI provides a marker based on multiplicative diffusion‐image intensities that is sensitized to restricted diffusion (Wong et al., 2013). To better understand the relationship between conventional DTI, DT‐DOME, and CDI parameters and their sensitivities to pathology, and to demonstrate the application of the CDI concept to conventional brain diffusion imaging protocols, we simulated a set of diffusion signals arising from 34 diffusion directions, with a single b‐value of 700 s/mm2, plus a single b = 0 volume. The signal intensity is simulated for two types of ground truth for anisotropic diffusion (NA = 1 mm2/s):
healthy white matter, MD of 0.6 mm2/s;
diseased white matter, with a range of MD values from 80 to 120% of healthy tissue.
We generated diffusion‐weighted signals using Equation (1), and added multiple instances of Rician noise, with the noisy signal defined as
| (1) |
where and are the real and imaginary components of the noise signal, both normally distributed. The SNR, defined as , is set to vary from 10 to 110, and signals were obtained using 100 independent instances of Rician noise for each SNR, as is typical of diffusion images at 3 Tesla.
Since the CDI intensity is based on a product, it can quickly exhaust our data range. To compress the dynamic range of CDI values, a log transformation is applied to the product in Equation (A7) (Supplementary Materials) to provide the final CDI value (log(CDI)). A typical log(CDI) map generated from in vivo DTI data are shown in Figure A4 in Supplementary Materials. We further defined a range of fractional MD deviation of the simulated tissue from “healthy” (i.e., ground‐truth MD of disease tissue)/(ground‐truth MD of healthy tissue). We assessed the following metrics for comparing DTI and CDI performance over this range:
Effect size = {(estimated parameter for disease tissue) − (estimated parameter for healthy tissue)}/(estimated parameter for healthy tissue);
Contrast‐to‐noise ratio (CNR) = mean(effect size)/std(effect size) across multiple noise instances and SNRs.
2.2. Study participants
Participants in the current study were recruited between May 2020 and September 2021 (period of spread of early COVID‐19 variants) through the Department of Emergency Medicine at Sunnybrook Health Sciences Centre, Toronto, Canada, physician referral, and community advertisements. Eligibility and consenting procedures were performed over phone or email. The Research Ethics Board at Sunnybrook Health Sciences Centre approved this study. Inclusion criteria for this study included being between 20 and 75 years of age and having documented evidence of a positive or negative COVID‐19 diagnosis, as determined by a provincially approved facility through a nasopharyngeal or oropharyngeal swab and subsequent real‐time reverse transcription polymerase chain reaction (PCR) test. Exclusion criteria for this study included previous diagnosis of dementia, an existing neurological disorder, severe psychiatric illness, previous traumatic brain injury, on‐going unstable cardiovascular disease, or contraindications to MRI (e.g., ferromagnetic implants).
2.3. Study design
Data used in the current study were acquired as part of the Toronto‐based NeuroCOVID‐19 observational cohort study (MacIntosh et al., 2021). The study design is illustrated in Figure 1. We report on participants who were recruited to one of two groups: (1) COVID positive (COVID+) (N = 39) individuals that had tested positive for COVID‐19 at an Ontario‐approved facility, went into home isolation and were imaged well outside the window of acute symptoms; (2) COVID‐negative (COVID−) (N = 14) individuals who experienced flu‐like symptoms but tested negative for COVID‐19. COVID status was assessed using a molecular PCR test, and the criterion of having “flu‐like” symptoms was included to help minimize the confounding effects of non‐COVID‐specific respiratory abnormalities of a similar nature as COVID‐19 (Voudris et al., 2001). There was no statistical difference between the mean age of the COVID+ and COVID− groups (see Table 1). Nineteen of the COVID+ participants were imaged at 3 months following the initial imaging session.
FIGURE 1.
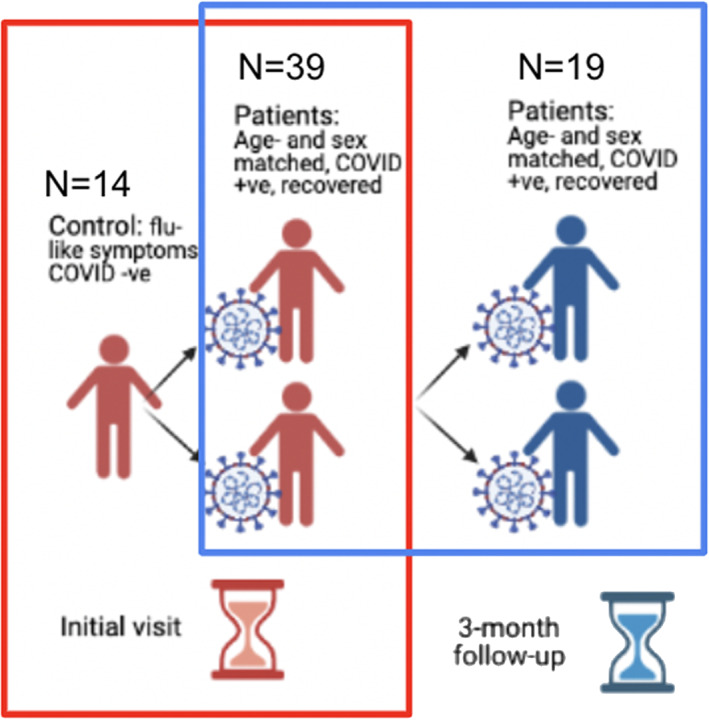
Flowchart of study design. Two sets of comparison were performed: (i) between COVID+ and COVID− groups (outlined by red box) and (ii) between the initial and 3‐month time points in the COVID+ group (outlined by blue box). N = cohort size.
TABLE 1.
Patient demographics
| Category | COVID+ (initial) (STDEV) | COVID+ (follow‐up) (STDEV) | COVID−(STDEV) | COVID+ vs. COVID− | COVID+ initial vs. follow‐up |
|---|---|---|---|---|---|
| n | 39 | 19 | 14 | N/A | N/A |
| Age | 42.1 (12.7) | 44.8 (10.7) | 43 (13.7) | p = .83 | N/A |
| Sex | M:11; F:28 | M:8; F:11 | M:5; F:9 | N/A | N/A |
| Crystallized Composite Score | 100.3 (13.0) | 105.6 (13.1) | 107.9 (9.8) | p = .05 | p = .63 |
| Fluid Composite Score | 104.5 (16.1) | 109.6 (18.6) | 99.5 (17.5) | p = .38 | p = .47 |
| Negative Affect Summary | 60.4 (9.5) | 56.2 (8.2) | 58.1 (14.0) | p = .50 | p = .54 |
| Well‐Being Summary | 45.8 (11.6) | 46.8 (8.0) | 42.8 (8.8) | p = .40 | p = .67 |
| Social Satisfaction Summary | 48.1 (11.5) | 46.4 (9.6) | 39.9 (12.7) | p = .04 | p = .81 |
Note: p values indicate the statistical significance of inter‐group differences.
2.4. Cognitive and emotional scores
The assessments are detailed in our recent publication (MacIntosh et al., 2021). Briefly, the NIH Toolbox full Cognition and Emotional Battery as well as the PROMIS tools (The Patient Reported Outcomes Measurement Information System, PROMIS‐Canada) were administered using an iPad app, yielding Crystalized Intelligence Composite Scores, Fluid Intelligence Composite Score, Negative Affect Memory, Well‐being Summary and Social Satisfaction Summary Scores. Scores are summarized in Table 1.
2.5. Image acquisition
Diffusion MRI data were acquired on a Siemens Prisma 3 T system, consisting of three separate acquisitions at b = 700, 1400, and 2100 s/mm2, with each acquisition also including four b = 0 s/mm2 scans interspersed throughout the multiple diffusion directions, with TR = 4.3 s, TE = 62 ms, matrix size = 96 × 96 × 60 (2.5 × 2.5 × 2.5 mm3 voxel resolution), twofold through‐plane simultaneous multi‐slice acceleration with two field‐of‐view shifts. A 1 mm isotropic T1 anatomical image was also acquired for each participant, with TR/TE/TI = 2500/4.7/1100 ms, flip angle = 7°, FOV = 256 × 256 × 192 mm.
2.6. Data processing
All data sets were manually screened for excessive head motion and processed using the DiPy library (available at: dipy.org). Images were denoised using the nonlocal means (nlmeans) method, then brain‐masked (median_otsu), before the single‐shell tensor model was fit to the data to obtain parameter maps of FA, MD, AD, and RD. We used the b = 0 and the 700 s/mm2 shells alone for the tensor fit in order to avoid kurtosis effects of higher b‐values. NA and MO were computed from the diffusion tensor eigenvalues using an in‐house bash script. CDI maps were computed based on the log transform of Equation A9 with an in‐house MATLAB script, applied separately to each of the three diffusion‐weighted acquisitions, generating a CDI map for each b‐value separately. These resulted in FA, MD, AD, RD, NA, MO, and three sets of CDI maps for all participants.
As a supplementary analysis, we also performed NODDI model fits (Zhang et al., 2012) by using the 700, 1400, and 2100 s/mm2 shells of the diffusion data, using the NODDI MATLAB Toolbox (available at http://mig.cs.ucl.ac.uk/index.php?n=Tutorial.NODDImatlab). This step produced maps of intracellular volume fraction (v ic), extracellular isotropic volume (v iso), and fiber orientation dispersion index for all participants.
2.7. Statistical analysis
FSL's tract‐based spatial statistics protocol was used to conduct statistical analysis of the FA, MD, AD, RD, NA, MO, and CDI data. Voxelwise differences for each parameter were assessed for COVID+ versus COVID− using a two‐sample t‐test setup, as well as between initial visit and follow‐up for the COVID+ group using a repeated‐measures ANOVA setup. Mean differences were then subjected to significance testing using FSL randomize with 500 permutations, with significant regions identified via threshold‐free cluster enhancement. Region of interest analyses were performed on regions of significance from the voxelwise comparison. Group differences in cognitive and emotional scores were assessed using unpaired t tests, thresholded at the 0.05 significance level. Cognitive and emotional scores with significant group differences were used as correlates in FreeSurfer's general linear model analysis to assess correlation with DTI parameters.
3. RESULTS
3.1. Simulations
The simulations, which have never been performed previously, revealed an inverse relationship between CDI and MD values. As shown in Figure A1 in Supplementary Materials, increasing MD (mm2/s) is reflected in decreasing CDI, shown as increasingly negative log values (in this case for an SNR of 110). This is the case for both isotropic and anisotropic diffusion. However, no such relationship is discernible for CDI versus FA.
Shown in Figure 2, are the estimated log(CDI) and corresponding MD, FA, NA, and MO values for healthy and diseased tissue, averaged across all SNR and noise instances. When diseased tissue is modeled as variations in MD alone, increasing MD corresponds to decreasing log(CDI) and FA values, most consistently in anisotropic diffusion (Figure 2b). The distinction between healthy and diseased tissue is unclear when viewed through NA and MO (Figure 2d,e). The effect sizes, i.e., percent differences between healthy and diseased tissue, computed for the estimated MD, FA, and corresponding log(CDI) values, and averaged across all SNR and noise instances, are shown in Figure A2 of the Supplementary Materials. The log(CDI) and MD exhibit similar effect sizes, much higher than that of FA, NA, and MO.
FIGURE 2.
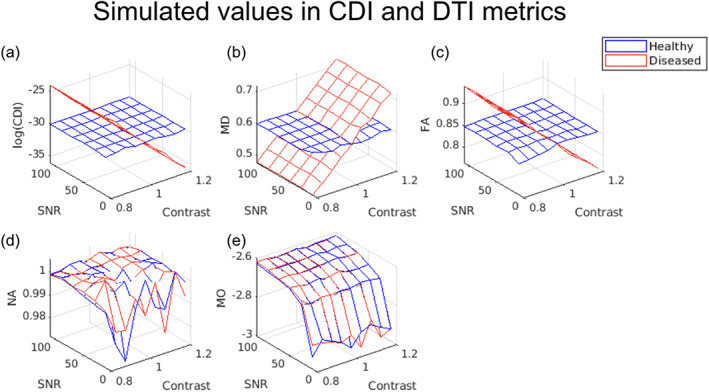
Estimated mean correlated diffusion imaging (CDI) and diffusion tensor imaging (DTI)‐parameter values for simulated healthy and diseased white‐matter tissue. Each vertex on the 3D mesh represents one data point, computed as the average across all noise instances at each SNR. In all cases, a contrast value >1 indicates higher mean diffusivity (MD) in diseased tissue. Increasing MD (b) is reflected as decreasing log(CDI) for diseased tissue (a), with fractional anisotropy (FA) showing minimal difference between health and disease (c). Note that the difference between the simulated healthy and diseased tissues is in MD alone, so as expected, norm of anisotropy (NA) (d) and mode of anisotropy (MO) (e) exhibit negligible contrast between tissue types.
Shown in Figure 3 are the CNR comparisons for log(CDI), MD, FA, NA, and MO. As CNR is based on both effect size and noise‐related variability (encoded by the color bar), a higher CNR is a robust indication of superior sensitivity to disease effects. log(CDI) is associated with maximum CNRs of 40 and higher (Figure 3a) while MD and FA exhibit maximum CNRs of only 5–20 (Figure 3b,c). Finally, NA and MO exhibit negligible CNR (Figure 3d,e).
FIGURE 3.
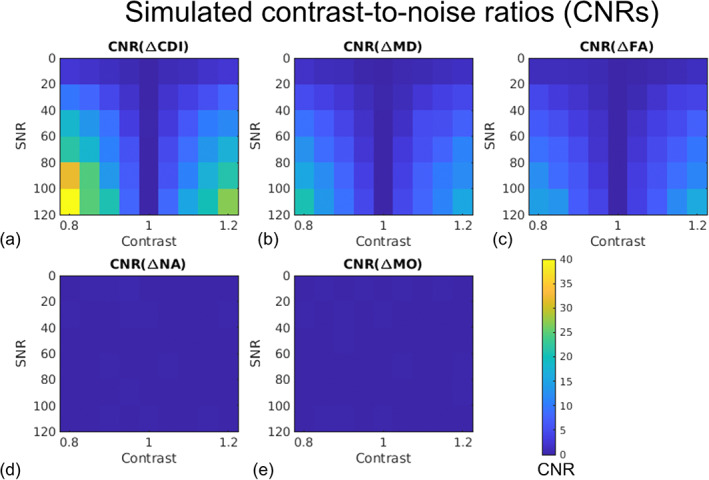
Estimated average contrast‐to‐noise ratios (CNRs) associated with correlated diffusion imaging (CDI) and diffusion tensor imaging (DTI) metrics for distinguishing simulated healthy and diseased white‐matter tissue. Each vertex on the 3D mesh represents one data point. The CNR represents the effect size normalized by estimation variability, and is encoded by the color bar. Note that the difference between the simulated healthy and diseased tissues is in MD alone, so as expected, NA (d) and MO (e) exhibit negligible contrast between tissue types.
3.2. Experimental results
We observed no significant difference between the initial‐visit COVID+ and COVID− groups in terms of both DTI and DTI‐DOME parameters, including MD, FA, NA, AD, RD, and MO. However, we observed significant group differences through CDI values. Regions showing significantly higher log(CDI) in the COVID− group are shown in Figure 4. The highest statistical significance and spatial extent in log(CDI) differences between groups are encoded by the lowest b‐values. The b = 1400 analysis reveals additional significant regions relative to the b = 700 s/mm2 results, such as the genu of the corpus callosum. The b = 2100 s/mm2 analysis shows the least spatially extensive pattern of significant effects, although the superior corona radiata remains significant. Figure 5 shows boxplots of DTI metrics averaged over regions showing significant group differences in CDI at b = 700 s/mm2. Significant group differences are observed in the corona radiata, with the highest significance in the age‐controlled analysis. High significance is also evident in superior longitudinal fasciculus in all three analyses. Regions of high significance are consistent with literature (Huang et al., 2021), however with widespread frontal effects. Figure 5 demonstrates a general lack of significant group differences in these regions exhibited by conventional DTI and DT‐DOME metrics. Moreover, the NODDI parameters also failed to show group differences (data not shown).
FIGURE 4.
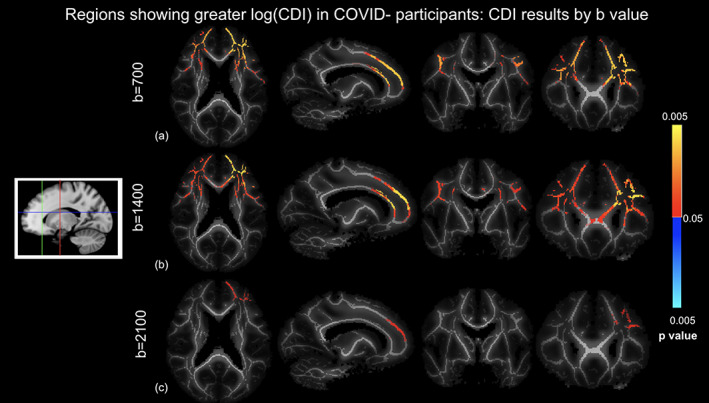
Correlated diffusion imaging (CDI) comparison of COVID+ and COVID− groups based on different b‐values controlled for age and sex differences, where log(CDI) is greater in COVID− participants. (a) b = 700 s/mm2, (a) b = 1400 s/mm2, and (c) b = 2100 s/mm2. Orange‐yellow indicate regions of statistically significant difference, with yellow indicating greater significance. Highest significance in the b = 700 s/mm2 analysis. Slices are taken as shown in the icon to the left.
FIGURE 5.
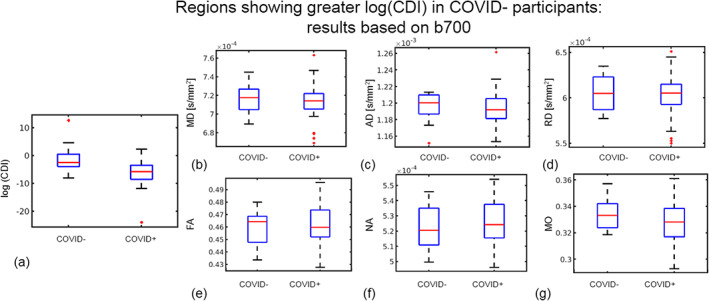
Region of interest (ROI) plots of diffusion tensor imaging (DTI) and log(CDI) values in regions where log(CDI) is greater in COVID− participants. The ROI is defined as tract‐based spatial statistics (TBSS) analysis regions where log(CDI) was greater in COVID− participants based on all gradient directions at b = 700 s/mm2 in the TBSS analysis. Red line represents the median, the blue box represents the interquartile range, and black lines represent minimum and maximum. The left and right boxes represent COVID− and COVID+ groups, respectively. Larger median in the COVID− group is evident in log(CDI) (a), mean diffusivity (MD) (b), axial diffusivity (AD) (c), RD (d), fractional anisotropy (FA) (e), and mode of anisotropy (MO) (g). Larger median in the COVID+ group is evident in norm of anisotropy (NA) (f).
Regions showing significantly higher log(CDI) in the COVID+ group are shown in Figure 6. The biggest log(CDI) differences between groups are encoded by the highest b‐value. The b = 2100 s/mm2 analysis reveals the highest significance and spatial extent of significantly affected voxels, the greatest effect sizes, particularly within the cerebellum. The b = 700 s/mm2 analysis also reveals a less extensive pattern of significant differences in the cerebellum, whereas the b = 1400 s/mm2 analysis reveals no significant differences. Figure 7 shows boxplots of DTI metrics averaged regions of significant group difference in CDI at b = 700 s/mm2. As seen in Figure 6, high significance is evident in the cerebellum. Figure 7 demonstrates a general lack of significant group differences in these regions exhibited by conventional DTI and DT‐DOME metrics.
FIGURE 6.
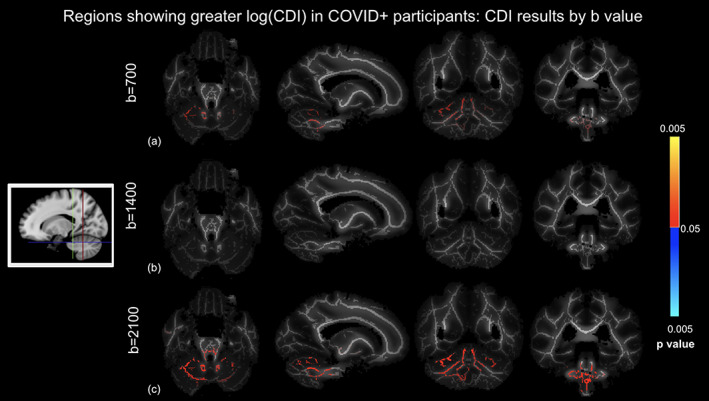
Correlated diffusion imaging (CDI) comparison of COVID+ and COVID− groups using different b‐values controlled for age and sex differences, where log(CDI) is greater in COVID+ participants. (a) b = 700 s/mm2, (b) b = 1400 s/mm2, and (c) b = 2100 s/mm2. Red regions are statistically significant. Highest significance in the b = 2100 s/mm2 analysis. Slices are taken as shown in the icon to the left.
FIGURE 7.
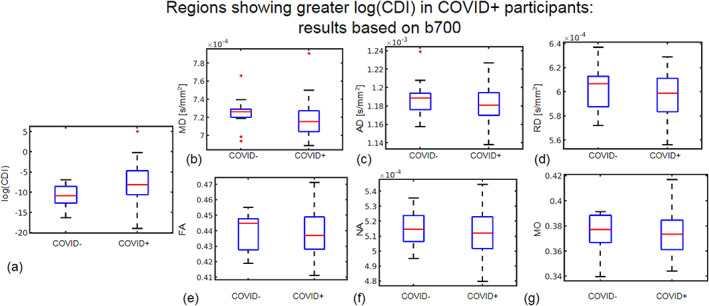
Region of interest (ROI) plots of diffusion tensor imaging (DTI) and log(CDI) values in regions where log(CDI) is greater in COVID+ participants. The ROI is defined as regions where log(CDI) was greater in COVID+ participants based on all gradient directions at b = 700 s/mm2 in the tract‐based spatial statistics (TBSS) analysis. Red line represents the median, the blue box represents the interquartile range, and black lines represent minimum and maximum. The left and right boxes represent the COVID− and COVID+ groups, respectively. Larger median in the COVID+ group is evident in log(CDI) (a) and MO (g). Larger median in the COVID− group is evident in mean diffusivity (MD) (b), axial diffusivity (AD) (c), RD (d), fractional anisotropy (FA) (e), and norm of anisotropy (NA) (f).
4. DISCUSSION
There are numerous well‐documented impacts of COVID‐19 on the brain in the literature (Ardellier et al., 2023; Esposito et al., 2022; Kim et al., 2022; Kremer et al., 2020; Lu et al., 2020; Qin et al., 2021; Voudris et al., 2001). It is clear that COVID can not only enter the brain (Reiken et al., 2022), but can also have numerous metabolic, immune, and hematologic effects (Shaikh et al., 2022). In this work, we pioneer the application of CDI in neuroimaging of COVID‐19. We show that whereas DTI metrics did not reveal differences between the white matter of COVID− and COVID+ groups, log(CDI) exhibits significant, spatially extensive differences. Compared to the previous instances of CDI applications (so far limited to prostate cancer) (Khalvati et al., 2016; Wong et al., 2013; Wong et al., 2015; Wong et al., 2021), our implementation of CDI involves three key differences: (i) instead of relying on images acquired at multiple gradient strengths, we rely mainly on the multiple diffusion directions, which are part of typical brain DTI acquisitions; (ii) given the small spatial scale of white‐matter structures, we opted to not use a spatial probability distribution function in order to avoid spatial blurring and partial‐volume effects; and (iii) to compress the large dynamic range of brain CDI values and normalize the data distribution, we used log(CDI) in this work.
Through simulations and experimental data, we demonstrate that CDI's sensitivity to disease processes is independent of these processing choices. Based on prior literature in prostate cancer (Wong et al., 2013; Wong et al., 2021), a higher log(CDI) can be loosely interpreted as reflecting a denser tissue structure with restricted diffusion. Interestingly, we find two dichotomous trends in log(CDI) of COVID patients: (i) in anterior white matter, patients exhibit lower log(CDI) than controls, suggesting less restricted diffusion in patients (detailed in later section titled “Potential sources of less restricted diffusion”) and (ii) in the cerebellum, patients exhibit higher log(CDI) than controls, suggesting more restricted diffusion in patients (detailed in later section titled “Potential sources of more restricted diffusion”). Furthermore, while we do not have experimental evidence to that effect, the simulations suggest that the high CNR afforded by log(CDI) partially validates the simulation assumption that the lesion under investigation is strongly characterized by altered WM diffusivity. This in itself is informative of the COVID‐19 disease process.
4.1. Simulations
In our simulations, we assumed only single‐shell diffusion data were available, and compared the sensitivities of DTI (MD, FA); DT‐DOME (NA, MO); and CDI metrics through CNR. The simulated case covers a single‐b‐value scenario, with the number of diffusion directions (i.e., 34) identical to that of our MRI acquisitions. Disease conditions were assumed to range from reduced to enhanced diffusivity, relative to healthy tissue. Noise was added over a large range of SNRs, from 10 to 120, to cover a variety of image qualities. We demonstrated that in principle, CDI can be viewed as inversely proportional to MD, but that its sensitivity to disease is more than twice that of MD. Note that the disease effect is modeled as a difference in MD alone, so as expected, FA was less affected by the condition, whereas NA and MO do not exhibit contrast between healthy and disease, as they are not confounded by MD (unlike FA). Based on the simulated results, we hypothesized that in cases where the pathology is defined by a change in diffusivity rather than anisotropy, the in vivo performance of CDI would be superior to that of DTI and DT‐DOME. This was indeed borne out in the experimental results.
4.2. Potential sources of less restricted diffusion
Huang et al. acquired multi‐shell diffusion MRI data with b‐values of 1000 and 2000 s/mm2, and showed that the NODDI parameter of v ic alone demonstrated significant differences between patient and control groups. The reduced v ic in patients was interpreted as a reduction in axonal density following edema and axonal apoptosis (Huang et al., 2021). The affected areas include the superior longitudinal fasciculus, the genu of the corpus callosum and the bilateral corona radiata. The strong anterior emphasis of these effects may be traced back to the role of the olfactory bulb (OB) as the most likely entry point for SARS‐CoV‐2 in the brain (Serrano et al., 2022; Xydakis et al., 2021). The OB has been shown to be the most likely brain region to contain SARS‐CoV‐2 and shows significant changes in gene expression in COVID‐19 (Serrano et al., 2022). Moreover, studies examining the brain vasculature in deceased COVID‐19 patients showed strong fibrinogen staining in the OB, indicating a leaky BBB at autopsy (Lee et al., 2022). Neurovascular studies demonstrated widespread BBB leakage and immune cell infiltration in the brains of COVID‐19 patients (Lee et al., 2022). BBB breakdown in COVID‐19 is characterized by fibrinogen accumulation in perivascular space (Lee et al., 2022; Wenzel & Schwaninger, 2022). Fibrinogen has been demonstrated to contribute to neuronal loss in animal models (Ryu & McLarnon, 2009). Fibrinogen has also been shown to activate microglia, the brain's resident immune cells, in patients with Alzheimer's disease (McLarnon, 2021). The products of microglial activation include pro‐inflammatory cytokines and reactive oxygen species which contribute to inflammation and neurodegeneration (Akiyama et al., 2000). Thus, abnormalities in diffusion observed in this work may be a consequence of neuroinflammatory effects. Note however that the frontal WM is vulnerable to geometric distortions, warranting further validation of our findings.
Finally, in Figure 8, we show the comparison of the log(CDI) results against recently published results using multi‐compartmental diffusion modeling (NODDI). The three‐compartment NODDI model revealed reduced (v ic in the genu of the corpus callosum, the superior longitudinal fasciculus and the corona radiata, suggesting reduced axonal density in patients (Huang et al., 2021)). Note that the regions of significant group difference in the current study are highly similar to those revealed by NODDI in a different population. Finally, no significant differences were found between the initial and 3‐month follow‐up analysis, and expanded longitudinal evaluation is in progress.
FIGURE 8.
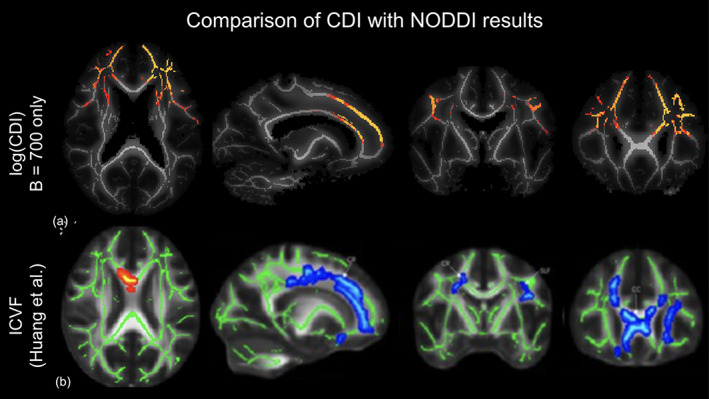
Comparison of current correlated diffusion imaging (CDI) findings to previous NODDI findings in the literature. tract‐based spatial statistics (TBSS) of log(CDI) results from the b = 700 analysis (a) to ICVF results from NODDI analysis (b) (Huang et al., 2021). Orange‐yellow regions in CDI analysis indicate regions of statistically significant higher log(CDI) in the COVID− group, with yellow indicating greater significance. Blue‐light blue in the ICVF analysis indicates regions of higher v ic in a control group than a COVID+ group with dark blue representing higher v ic and light blue representing lower v ic. Both analyses reveal abnormal diffusion in the bilateral corona radiata of patients.
In our study, the regions with significantly lower log(CDI) in patients align well with those identified by Huang et al. (2021) (Figure 8). As lower log(CDI) suggests less restricted diffusion, the interpretation also aligns with that of Huang et al. However, when we performed NODDI on our data, we did not detect statistically significant group differences in any NODDI parameter. This may be because our patients experienced milder COVID‐19 symptoms, thus having more subdued microstructural abnormalities. Alternatively, the standard NODDI model involves assumptions about neurite geometry and diffusion properties of the medium which may not be as appropriate in the COVID context, and further refinements may be warranted. More interestingly perhaps, our study suggests that multi‐shell data are not necessary for uncovering the microstructural differences reported by Huang et al. in our group, as shown in Figure 4. In fact, the use of the b = 700 s/mm2 shell alone yielded the most sensitive log(CDI) values. As the lowest b‐value is sensitive to the fastest diffusion, and as CDI is boosted by restricted diffusion, this finding may indicate that the lower log(CDI) in patients is preferentially reflecting an enhancement of the fastest‐moving water molecules, potentially reflecting enlargement of extracellular spaces (Huang et al., 2021) and/or leakage of the BBB. The literature indicates that the BBB is compromised early in the disease process, which also allows for viral effects to persist (Malerba et al., 2021). Although the precise mechanism of vascular damage remains hypothetical, it has been suggested that immunoglobulin complexes, cytokines, autoantibodies, and the SARS‐CoV‐2 virus itself may activate the endothelium and induce BBB leakage (Wenzel & Schwaninger, 2022).
4.3. Potential sources of more restricted diffusion
For the first time, the current study reports diffusion abnormalities in the white matter of the cerebellum, where the higher log(CDI) values suggest more restricted diffusion. While this finding echoes findings by Lu et al. in anterior cerebral white matter (Lu et al., 2020), it is opposite those of the anterior cerebral white matter found in the current study. Lu et al. reported generally reduced diffusivity, interpreted as the result of post‐inflammatory debris accumulation (Lu et al., 2020).
Several studies provide precedent for the impact of COVID‐19 on the cerebellum. Notably, an MRI study from the UK Biobank discovered cerebellum volume loss in COVID patients (Douaud et al., 2022). Several case reports of COVID patients found acute cerebellitis following infection with SARS‐CoV‐2 (Fadakar et al., 2020; Moreno‐Escobar et al., 2021). Furthermore, there is significant neuropathological evidence that COVID‐19 enters the cerebellum, as several studies indicate that immune cell infiltration is most pronounced in the cerebellum (Colombo et al., 2021; Matschke et al., 2020). Moreover, one study examining biochemistry in the brains of COVID‐19 patients found that the cerebellum in COVID‐19 patients exhibits leaky Ca2+ channels and activity consistent with intracellular calcium leakage, which were suggested to contribute to the disease process (Reiken et al., 2022).
The BBB is compromised in the cerebellum of COVID‐19 patients, as evidenced by fibrinogen infiltration in the perivascular space (Lee et al., 2022). Strong fibrinogen staining was evident in both the forebrain and cerebellum; however, weak fibrinogen staining was only evident in the cerebellum (Lee et al., 2022). Furthermore, immune cell infiltration is most pronounced in the cerebellum (Colombo et al., 2021; Matschke et al., 2020) which may be indicative of susceptible vasculature. These findings are taken from postmortem studies in individuals who died days or weeks after infection, indicating that viral entry in the OB and BBB leakage occurs early in the disease process. Our finding that log(CDI) is greater in patients in the cerebellum at the initial visit may be explained by debris accumulation following immune cell infiltration (Lee et al., 2022).
In our study, we also uncovered previously unseen regions of significantly higher log(CDI) value in patients, which suggests more restricted diffusion. As shown in Figure 6, multi‐shell data are not necessary for uncovering this effect, either. In fact, the use of the b = 2100 s/mm2 shell alone yielded the greatest CDI sensitivity to this effect. As the highest b‐value is sensitive to the slowest diffusion, and as CDI is boosted by restricted diffusion, this finding may indicate that the greater log(CDI) in patients is preferentially reflecting a restriction of the slowest‐moving water molecules. Such molecules could be intracellular or myelinated water, and their restriction could reflect cytotoxic intracellular edema, which in turn can be caused by hypoxic insults in COVID‐19 (van den Enden et al., 2020). As to why such effects are only seen in the cerebellum, this region consistently displays neuropathological abnormalities including immune cell infiltration which may be indicative of susceptible vasculature or increased viral entry (Matschke et al., 2020). Furthermore, while in the forebrain, fibrinogen staining is localized around the damaged vessels; in the cerebellum, fibrinogen staining is evident at greater distances from the vessels (Lee et al., 2022). Despite the OB being the most probable site of entry for COVID‐19, pathological brain findings are consistently most prominent in the cerebellum. Immune cell infiltration, widespread fibrinogen leakage, and debris accumulation may be responsible for the restricted diffusion identified in this investigation.
4.4. Limitations
This is the first instance of CDI technique being applied in neuroimaging, and we are cognizant of the uncertainties in our understanding of COVID‐19 afforded by diffusion MRI. We recognize that although DTI is sensitive to microstructure changes, it is not specific. For example, it is unclear whether, in the long term, restricted diffusion is an indicator of compensatory neurogenesis or persistent inflammation (Goldberg et al., 2021). To shed light on the interpretation of our findings, further research (potentially involving autopsy) is key.
Second, in this study, we mainly focused on single‐shell compatible modeling methods. While this led to interesting findings regarding the b‐value sensitivity of CDI performance, future studies could investigate the added value of combining multiple b‐values in the CDI and DTI context.
Third, we did not distinguish COVID+ individuals by clinical severity, symptomatic duration and inflammatory markers. We understand that this may introduce variability that limit the sensitivity of our markers. Our next step will target longitudinal data, the collection of which remains in progress.
Fourth, we are also constrained by the limited longitudinal follow‐up. Although short‐term COVID brain effects appear to manifest principally in the cortex and cerebellum, long‐term effects are more widespread. One area of the brain that becomes affected in long COVID is the cingulate cortex, which exhibited hypometabolism in patients with brain fog several months after contracting COVID (Hugon et al., 2022). The literature also indicates that the globus pallidus and substantia nigra show restricted diffusion at follow‐up (Abdo et al., 2021). It is possible the sample size of the longitudinal follow‐up was insufficiently powered to detect the changes observed in the literature. However, our longitudinal evaluations are ongoing, and our future work will involve a larger sample size, particularly in the initial visit versus follow‐up analysis, to provide greater power to the analysis.
Finally, the fact that CDI was exceptionally sensitive to self‐isolated COVID‐19 white‐matter pathology is encouraging, but also raises questions: (1) How does CDI perform in the gray matter? (2) How does it reflect neurodegenerative processes in other conditions, such as aging and Alzheimer's disease? (3) Under what circumstances would CDI fail to show sensitivity to pathology? These questions will propel our future studies to further validate and characterize this novel and simple technique.
Supporting information
DATA S1 Supplementary Information
ACKNOWLEDGMENTS
The authors thank the CIHR, NSERC, Sandra Black Centre for Brain Resilience & Recovery, and the Sunnybrook Hospital Foundation for financial support. The authors are also grateful to Ms. Ruby Andre, Mr. Garry Detzler, and Mr. Sangkyu Moon for their work in imaging the research participants associated with the study.
Teller, N. , Chad, J. A. , Wong, A. , Gunraj, H. , Ji, X. , Goubran, M. , Gilboa, A. , Roudaia, E. , Sekuler, A. , Churchill, N. , Schweizer, T. , Gao, F. , Masellis, M. , Lam, B. , Heyn, C. , Cheng, I. , Fowler, R. , Black, S. E. , MacIntosh, B. J. , … Chen, J. J. (2023). Feasibility of diffusion‐tensor and correlated diffusion imaging for studying white‐matter microstructural abnormalities: Application in COVID‐19. Human Brain Mapping, 44(10), 3998–4010. 10.1002/hbm.26322
DATA AVAILABILITY STATEMENT
All codes used in this work can be provided upon request. Data‐sharing requests will be reviewed on a case‐by‐case basis in accordance with research‐ethics approval.
REFERENCES
- Abdo, W. F. , Broerse, C. I. , Grady, B. P. , Wertenbroek, A. A. A. C. M. , Vijlbrief, O. , Buise, M. P. , Beukema, M. , van der Kuil, M. , Tuladhar, A. M. , Meijer, F. J. A. , & van der Hoeven, J. G. (2021). Prolonged unconsciousness following severe COVID‐19. Neurology, 96, e1437–e1442. [DOI] [PMC free article] [PubMed] [Google Scholar]
- Akiyama, H. , Arai, T. , Kondo, H. , Tanno, E. , Haga, C. , & Ikeda, K. (2000). Cell mediators of inflammation in the Alzheimer disease brain. Alzheimer Disease and Associated Disorders, 14, S47–S53. 10.1097/00002093-200000001-00008 [DOI] [PubMed] [Google Scholar]
- Ardellier F‐D, Baloglu S, Sokolska M, Noblet V, Lersy F, Collange O, Ferré J‐C, Maamar A, Carsin‐Nicol B, Helms J, Schenck M, Khalil A, Gaudemer A, Caillard S, Pottecher J, Lefèbvre N, Zorn P‐E, Matthieu M, Brisset JC, Boulay C, Mutschler V, Hansmann Y, Mertes P‐M, Schneider F, Fafi‐Kremer S, Ohana M, Meziani F, Meyer N, Yousry T, Anheim M, Cotton F, Jäger HR, Kremer S, SFNR‐COVID Group (2023) Cerebral perfusion using ASL in patients with COVID‐19 and neurological manifestations: A retrospective multicenter observational study. Journal of Neuroradiology. Online ahead of print. 10.1016/j.neurad.2023.01.005. [DOI] [PMC free article] [PubMed] [Google Scholar]
- Bhatt, N. , Gupta, N. , Soni, N. , Hooda, K. , Sapire, J. M. , & Kumar, Y. (2017). Role of diffusion‐weighted imaging in head and neck lesions: Pictorial review. The Neuroradiology Journal, 30, 356–369. 10.1177/1971400917708582 [DOI] [PMC free article] [PubMed] [Google Scholar]
- Callard, F. , & Perego, E. (2020). How and why patients made long COVID. Social Science & Medicine, 268, 113426. [DOI] [PMC free article] [PubMed] [Google Scholar]
- Chad, J. A. , Pasternak, O. , & Chen, J. J. (2021). Orthogonal moment diffusion tensor decomposition reveals age‐related degeneration patterns in complex fibre architecture. Neurobiology of Aging. Retrieved from https://www.sciencedirect.com/science/article/pii/S0197458020304310, 101, 150–159. [DOI] [PMC free article] [PubMed] [Google Scholar]
- Colombo D, Falasca L, Marchioni L, Tammaro A, Adebanjo GAR, Ippolito G, Zumla A, Piacentini M, Nardacci R, Del Nonno F (2021): Neuropathology and inflammatory cell characterization in 10 autoptic COVID‐19 brains. Cell 10, 2262. 10.3390/cells10092262. [DOI] [PMC free article] [PubMed] [Google Scholar]
- DiSabato, D. J. , Quan, N. , & Godbout, J. P. (2016). Neuroinflammation: The devil is in the details. Journal of Neurochemistry, 139, 136–153. 10.1111/jnc.13607 [DOI] [PMC free article] [PubMed] [Google Scholar]
- Douaud, G. , Lee, S. , Alfaro‐Almagro, F. , Arthofer, C. , Wang, C. , McCarthy, P. , Lange, F. , Andersson, J. L. R. , Griffanti, L. , Duff, E. , Jbabdi, S. , Taschler, B. , Keating, P. , Winkler, A. M. , Collins, R. , Matthews, P. M. , Allen, N. , Miller, K. L. , Nichols, T. E. , & Smith, S. M. (2022). SARS‐CoV‐2 is associated with changes in brain structure in UK Biobank. Nature, 604, 697–707. 10.1038/s41586-022-04569-5 [DOI] [PMC free article] [PubMed] [Google Scholar]
- ENT UK at The Royal College of Surgeons of England . (2020). Loss of sense of smell as marker of COVID‐19 infection. Royal College of Surgeons of England. [Google Scholar]
- Esposito, F. , Cirillo, M. , De Micco, R. , Caiazzo, G. , Siciliano, M. , Russo, A. G. , Monari, C. , Coppola, N. , Tedeschi, G. , & Tessitore, A. (2022). Olfactory loss and brain connectivity after COVID‐19. Human Brain Mapping, 43, 1548–1560. [DOI] [PMC free article] [PubMed] [Google Scholar]
- Fadakar, N. , Ghaemmaghami, S. , Masoompour, S. M. , Shirazi Yeganeh, B. , Akbari, A. , Hooshmandi, S. , & Ostovan, V. R. (2020). A first case of acute cerebellitis associated with coronavirus disease (COVID‐19): A case report and literature review. Cerebellum, 19, 911–914. [DOI] [PMC free article] [PubMed] [Google Scholar]
- Fernández‐Castañeda A, Lu P, Geraghty AC, Song E, Lee M‐H, Wood J, Yalçın B, Taylor KR, Dutton S, Acosta‐Alvarez L, Ni L, Contreras‐Esquivel D, Gehlhausen JR, Klein J, Lucas C, Mao T, Silva J, Peña‐Hernández MA, Tabachnikova A, Takahashi T, Tabacof L, Tosto‐Mancuso J, Breyman E, Kontorovich A, McCarthy D, Quezado M, Hefti M, Perl D, Folkerth R, Putrino D, Nath A, Iwasaki A, Monje M (2022) Mild respiratory SARS‐CoV‐2 infection can cause multi‐lineage cellular dysregulation and myelin loss in the brain. bioRxiv. 10.1101/2022.01.07.475453. [DOI]
- Gilden, D. H. (2008). Brain imaging abnormalities in CNS virus infections. Neurology, 70, 84. [DOI] [PubMed] [Google Scholar]
- Goldberg, E. , Podell, K. , Sodickson, D. K. , & Fieremans, E. (2021). The brain after COVID‐19: Compensatory neurogenesis or persistent neuroinflammation? eClinicalMedicine, 31, 100684. [DOI] [PMC free article] [PubMed] [Google Scholar]
- Huang S, Zhou Z, Yang D, Zhao W, Zeng M, Xie X, Du Y, Jiang Y, Zhou X, Yang W, Guo H, Sun H, Liu P, Liu J, Luo H, Liu J (2021): Persistent white matter changes in recovered COVID‐19 patients at the 1‐year follow‐up. Brain, 145, 1830–1838. 10.1093/brain/awab435/6464331. [DOI] [PMC free article] [PubMed] [Google Scholar]
- Hugon, J. , Msika, E.‐F. , Queneau, M. , Farid, K. , & Paquet, C. (2022). Long COVID: Cognitive complaints (brain fog) and dysfunction of the cingulate cortex. Journal of Neurology, 269, 44–46. [DOI] [PMC free article] [PubMed] [Google Scholar]
- Iadecola, C. , Anrather, J. , & Kamel, H. (2020). Effects of COVID‐19 on the nervous system. Cell, 183, 16–27.e1. 10.1016/j.cell.2020.08.028 [DOI] [PMC free article] [PubMed] [Google Scholar]
- Khalvati, F. , Zhang, J. , Baig, S. , Haider, M. A. , & Wong, A. (2016). Sparse correlated diffusion imaging: A new computational diffusion MRI modality for prostate cancer detection. Journal of Computational Vision and Imaging Systems, 2. 10.15353/vsnl.v2i1.107 [DOI] [Google Scholar]
- Kim WSH, Ji X, Roudaia E, Chen JJ, Gilboa A, Sekuler A, Gao F, Lin Z, Jegatheesan A, Masellis M, Goubran M, Rabin JS, Lam B, Cheng I, Fowler R, Heyn C, Black SE, Graham SJ, MacIntosh BJ (2022): MRI assessment of cerebral blood flow in nonhospitalized adults who self‐isolated due to COVID‐19. Journal of Magnetic Resonance Imaging. Online ahead of print. 10.1002/jmri.28555. [DOI] [PMC free article] [PubMed] [Google Scholar]
- Krasemann, S. , Haferkamp, U. , Pfefferle, S. , Woo, M. S. , Heinrich, F. , Schweizer, M. , Appelt‐Menzel, A. , Cubukova, A. , Barenberg, J. , Leu, J. , Hartmann, K. , Thies, E. , Littau, J. L. , Sepulveda‐Falla, D. , Zhang, L. , Ton, K. , Liang, Y. , Matschke, J. , Ricklefs, F. , … Pless, O. (2022). The blood‐brain barrier is dysregulated in COVID‐19 and serves as a CNS entry route for SARS‐CoV‐2. Stem Cell Reports, 17, 307–320. [DOI] [PMC free article] [PubMed] [Google Scholar]
- Kremer, S. , Lersy, F. , de Sèze, J. , Ferré, J.‐C. , Maamar, A. , Carsin‐Nicol, B. , Collange, O. , Bonneville, F. , Adam, G. , Martin‐Blondel, G. , Rafiq, M. , Geeraerts, T. , Delamarre, L. , Grand, S. , Krainik, A. , Caillard, S. , Marc Constans, J. , Metanbou, S. , Heintz, A. , … Cotton, F. (2020). Brain MRI findings in severe COVID‐19: A retrospective observational study. Radiology, 297, E242–E251. [DOI] [PMC free article] [PubMed] [Google Scholar]
- Lee, M. H. , Perl, D. P. , Steiner, J. , Pasternack, N. , Li, W. , Maric, D. , Safavi, F. , Horkayne‐Szakaly, I. , Jones, R. , Stram, M. N. , Moncur, J. T. , Hefti, M. , Folkerth, R. D. , & Nath, A. (2022). Neurovascular injury with complement activation and inflammation in COVID‐19. Brain, 145, 2555–2568. 10.1093/brain/awac151 [DOI] [PMC free article] [PubMed] [Google Scholar]
- Lu, Y. , Li, X. , Geng, D. , Mei, N. , Wu, P.‐Y. , Huang, C.‐C. , Jia, T. , Zhao, Y. , Wang, D. , Xiao, A. , & Yin, B. (2020). Cerebral micro‐structural changes in COVID‐19 patients—An MRI‐based 3‐month follow‐up study. eClinicalMedicine, 25, 100484. [DOI] [PMC free article] [PubMed] [Google Scholar]
- MacIntosh, B. J. , Ji, X. , Chen, J. J. , Gilboa, A. , Roudaia, E. , Sekuler, A. B. , Gao, F. , Chad, J. A. , Jegatheesan, A. , Masellis, M. , Goubran, M. , Rabin, J. , Lam, B. , Cheng, I. , Fowler, R. , Heyn, C. , Black, S. E. , & Graham, S. J. (2021). Brain structure and function in people recovering from COVID‐19 after hospital discharge or self‐isolation: A longitudinal observational study protocol. CMAJ Open, 9, E1114–E1119. [DOI] [PMC free article] [PubMed] [Google Scholar]
- Malerba, P. , Agabiti Rosei, C. , Nardin, M. , Gaggero, A. , Chiarini, G. , Rossini, C. , Fama', F. , Brami, V. , Coschignano, M. A. , Muiesan, M. L. , Rizzoni, D. , & De Ciuceis, C. (2021). Early microvascular modifications in patients previously hospitalized for COVID‐19: Comparison with healthy individuals. European Heart Journal, 42, ehab724.3387. [Google Scholar]
- Matschke, J. , Lütgehetmann, M. , Hagel, C. , Sperhake, J. P. , Schröder, A. S. , Edler, C. , Mushumba, H. , Fitzek, A. , Allweiss, L. , Dandri, M. , Dottermusch, M. , Heinemann, A. , Pfefferle, S. , Schwabenland, M. , Sumner Magruder, D. , Bonn, S. , Prinz, M. , Gerloff, C. , Püschel, K. , … Glatzel, M. (2020). Neuropathology of patients with COVID‐19 in Germany: A post‐mortem case series. Lancet Neurology, 19, 919–929. [DOI] [PMC free article] [PubMed] [Google Scholar]
- McLarnon JG (2021) A leaky blood–brain barrier to fibrinogen contributes to oxidative damage in Alzheimer's disease. Antioxidants 11(1), 102. 10.3390/antiox11010102. [DOI] [PMC free article] [PubMed] [Google Scholar]
- Meinhardt, J. , Radke, J. , Dittmayer, C. , Franz, J. , Thomas, C. , Mothes, R. , Laue, M. , Schneider, J. , Brünink, S. , Greuel, S. , Lehmann, M. , Hassan, O. , Aschman, T. , Schumann, E. , Chua, R. L. , Conrad, C. , Eils, R. , Stenzel, W. , Windgassen, M. , … Heppner, F. L. (2021). Olfactory transmucosal SARS‐CoV‐2 invasion as a port of central nervous system entry in individuals with COVID‐19. Nature Neuroscience, 24, 168–175. [DOI] [PubMed] [Google Scholar]
- Moreno‐Escobar, M. C. , Feizi, P. , Podury, S. , Tandon, M. , Munir, B. , Alvi, M. , Adcock, A. , & Sriwastava, S. (2021). Acute cerebellitis following SARS‐CoV‐2 infection: A case report and review of the literature. Journal of Medical Virology, 93, 6818–6821. [DOI] [PMC free article] [PubMed] [Google Scholar]
- Pierpaoli, C. , & Basser, P. J. (1996). Toward a quantitative assessment of diffusion anisotropy. Magnetic Resonance in Medicine, 36, 893–906. [DOI] [PubMed] [Google Scholar]
- Qin Y, Wu J, Chen T, Li J, Zhang G, Wu D, Zhou Y, Zheng N, Cai A, Ning Q, Manyande A, Xu F, Wang J, Zhu W (2021): Long‐term microstructure and cerebral blood flow changes in patients recovered from COVID‐19 without neurological manifestations. The Journal of Clinical Investigation 131. e147329 10.1172/JCI147329. [DOI] [PMC free article] [PubMed] [Google Scholar]
- Reiken, S. , Sittenfeld, L. , Dridi, H. , Liu, Y. , Liu, X. , & Marks, A. R. (2022). Alzheimer's‐like signaling in brains of COVID‐19 patients. Alzheimer's & Dementia, 18, 955–965. [DOI] [PMC free article] [PubMed] [Google Scholar]
- Russo, M. V. , & McGavern, D. B. (2015). Immune surveillance of the CNS following infection and injury. Trends in Immunology, 36, 637–650. 10.1016/j.it.2015.08.002 [DOI] [PMC free article] [PubMed] [Google Scholar]
- Ryu, J. K. , & McLarnon, J. G. (2009). A leaky blood‐brain barrier, fibrinogen infiltration and microglial reactivity in inflamed Alzheimer's disease brain. Journal of Cellular and Molecular Medicine, 13, 2911–2925. [DOI] [PMC free article] [PubMed] [Google Scholar]
- Serrano, G. E. , Walker, J. E. , Tremblay, C. , Piras, I. S. , Huentelman, M. J. , Belden, C. M. , Goldfarb, D. , Shprecher, D. , Atri, A. , Adler, C. H. , Shill, H. A. , Driver‐Dunckley, E. , Mehta, S. H. , Caselli, R. , Woodruff, B. K. , Haarer, C. F. , Ruhlen, T. , Torres, M. , Nguyen, S. , … Beach, T. G. (2022). SARS‐CoV‐2 brain regional detection, histopathology, gene expression, and immunomodulatory changes in decedents with COVID‐19. Journal of Neuropathology and Experimental Neurology, 81, 666–695. 10.1093/jnen/nlac056 [DOI] [PMC free article] [PubMed] [Google Scholar]
- Shaikh, A. G. , Manto, M. , & Mitoma, H. (2022). 2 years into the pandemic: What did we learn about the COVID‐19 and cerebellum? Cerebellum, 21, 19–22. [DOI] [PMC free article] [PubMed] [Google Scholar]
- Shankar, S. K. , Mahadevan, A. , & Kovoor, J. M. E. (2008). Neuropathology of viral infections of the central nervous system. Neuroimaging Clinics of North America, 18, 19–39. 10.1016/j.nic.2007.12.009 [DOI] [PubMed] [Google Scholar]
- Stefanou, M.‐I. , Palaiodimou, L. , Bakola, E. , Smyrnis, N. , Papadopoulou, M. , Paraskevas, G. P. , Rizos, E. , Boutati, E. , Grigoriadis, N. , Krogias, C. , Giannopoulos, S. , Tsiodras, S. , Gaga, M. , & Tsivgoulis, G. (2022). Neurological manifestations of long‐COVID syndrome: A narrative review. Therapeutic Advances in Chronic Disease, 13, 20406223221076890. [DOI] [PMC free article] [PubMed] [Google Scholar]
- van den Enden, A. J. M. , van Gils, L. , Labout, J. A. M. , van der Jagt, M. , & Moudrous, W. (2020). Fulminant cerebral edema as a lethal manifestation of COVID‐19. Radiology Case Reports, 15, 1705–1708. 10.1016/j.radcr.2020.06.053 [DOI] [PMC free article] [PubMed] [Google Scholar]
- Voudris, K. A. , Skaardoutsou, A. , Haronitis, I. , Vagiakou, E. A. , & Zeis, P. M. (2001). Brain MRI findings in influenza A‐associated acute necrotizing encephalopathy of childhood. European Journal of Paediatric Neurology, 5, 199–202. [DOI] [PubMed] [Google Scholar]
- Wenzel, J. , & Schwaninger, M. (2022). How COVID‐19 affects microvessels in the brain. Brain, 145, 2242–2244. [DOI] [PMC free article] [PubMed] [Google Scholar]
- Westman, J. , Grinstein, S. , & Marques, P. E. (2019). Phagocytosis of necrotic debris at sites of injury and inflammation. Frontiers in Immunology, 10, 3030. [DOI] [PMC free article] [PubMed] [Google Scholar]
- Wong, A. , Glaister, J. , Cameron, A. , & Haider, M. (2013). Correlated diffusion imaging. BMC Medical Imaging, 13, 26. [DOI] [PMC free article] [PubMed] [Google Scholar]
- Wong, A. , Gunraj, H. , Sivan, V. , & Haider, M. A. (2021). Synthetic correlated diffusion imaging hyperintensity delineates clinically significant prostate cancer. arXiv [physics.med‐ph]. arXiv. Retrieved from http://arxiv.org/abs/2108.04427 [DOI] [PMC free article] [PubMed]
- Wong, A. , Khalvati, F. , & Haider, M. A. (2015). Dual‐stage correlated diffusion imaging. 2015 IEEE 12th International Symposium on Biomedical Imaging (ISBI). 75–78. [DOI] [PubMed]
- Wright, P. W. , Vaida, F. F. , Fernández, R. J. , Rutlin, J. , Price, R. W. , Lee, E. , Peterson, J. , Fuchs, D. , Shimony, J. S. , Robertson, K. R. , Walter, R. , Meyerhoff, D. J. , Spudich, S. , & Ances, B. M. (2015). Cerebral white matter integrity during primary HIV infection. AIDS, 29, 433–442. 10.1097/qad.0000000000000560 [DOI] [PMC free article] [PubMed] [Google Scholar]
- Xydakis, M. S. , Albers, M. W. , Holbrook, E. H. , Lyon, D. M. , Shih, R. Y. , Frasnelli, J. A. , Pagenstecher, A. , Kupke, A. , Enquist, L. W. , & Perlman, S. (2021). Post‐viral effects of COVID‐19 in the olfactory system and their implications. Lancet Neurology, 20, 753–761. [DOI] [PMC free article] [PubMed] [Google Scholar]
- Zhang, H. , Schneider, T. , Wheeler‐Kingshott, C. A. , & Alexander, D. C. (2012). NODDI: Practical in vivo neurite orientation dispersion and density imaging of the human brain. NeuroImage, 61, 1000–1016. 10.1016/j.neuroimage.2012.03.072 [DOI] [PubMed] [Google Scholar]
Associated Data
This section collects any data citations, data availability statements, or supplementary materials included in this article.
Supplementary Materials
DATA S1 Supplementary Information
Data Availability Statement
All codes used in this work can be provided upon request. Data‐sharing requests will be reviewed on a case‐by‐case basis in accordance with research‐ethics approval.


