

Abstract
In this study, hyperpolarized 13C MRI (HP‐13C MRI) was used to investigate changes in the uptake and metabolism of pyruvate with age. Hyperpolarized 13C‐pyruvate was administered to healthy aging individuals (N = 35, ages 21–77) and whole‐brain spatial distributions of 13C‐lactate and 13C‐bicarbonate production were measured. Linear mixed‐effects regressions were performed to compute the regional percentage change per decade, showing a significant reduction in both normalized 13C‐lactate and normalized 13C‐bicarbonate production with age: per decade for 13C‐lactate and per decade for 13C‐bicarbonate. Certain regions, such as the right medial precentral gyrus, showed greater rates of change while the left caudate nucleus had a flat 13C‐lactate versus age and a slightly increasing 13C‐bicarbonate versus age. The results show that both the production of lactate (visible as 13C‐lactate signal) as well as the consumption of monocarboxylates to make acetyl‐CoA (visible as 13C‐bicarbonate signal) decrease with age and that the rate of change varies by brain region.
Keywords: aerobic glycolysis, aging, carbon‐13, lactate, metabolism, MRI, parcellation
In this work, hyperpolarized 13C MRI was used to investigate lactate and bicarbonate production in the brain versus age. The results show that both the production of lactate (visible as 13C‐lactate signal) as well as the consumption of monocarboxylates to make acetyl‐CoA (visible as 13C‐bicarbonate signal) decrease with age and that the rate of change varies by brain region.

Abbreviations
- ANOVA
analysis of variance
- B p
bicarbonate‐to‐pyruvate ratio
- CBF
cerebral blood flow
- CMRO2
cerebral metabolic rate of oxygen consumption
- FDG
fluorodeoxyglucose
- FSL
FMRIB software library
- ID
identification
- L B
lactate‐to‐bicarbonate ratio
- L p
lactate‐to‐pyruvate ratio
- MCT
monocarboxylate transporter
- MRI
magnetic resonance imaging
- MRS
magnetic resonance spectroscopy
- OGI
oxygen–glucose index
- PET
positron emission tomography
1. INTRODUCTION
Aging is associated with well documented changes in brain physiology and cognitive performance (López‐Otín et al., 2013). Cerebral blood flow (CBF) tends to decrease in the brain with age, while the rate of oxygen consumption (CMR02) increases slightly (Hanzhang et al., 2011), resulting in a net decrease in venous oxygenation. Imaging with fluorodeoxyglucose positron emission tomography ([18F] FDG‐PET) has demonstrated a 7% per decade decrease in FDG uptake with age (Greve et al., 2016).
These changes in oxygen consumption versus age are consistent with decreasing usage of glucose in nonoxidative metabolic pathways and/or increasing usage of alternative energy substrates such as ketones in the brain with age. Glucose can be metabolized nonoxidatively via lactate production as well as the nonoxidative branch of the pentose‐phosphate pathway. The degree of nonoxidative metabolism of glucose has been estimated in vivo using the oxygen–glucose index (OGI) (the ratio between 15O2 and 18F‐FDG uptake measured with PET). The OGI has been shown to be less than 6.0 (the value for purely oxidative glucose metabolism) throughout much of the brain and varies regionally (Vaishnavi et al., 2010). The OGI increases throughout the brain as a part of physiological aging (Goyal et al., 2017). Whether or not this change is mainly due to decreasing lactate production in the brain, as hypothesized by Goyal et al. (2017), is still under investigation (Drulis‐Fajdasz et al., 2018).
Lactate plays an important role in the brain (Pellerin et al., 1998), as it is involved in neuroprotection during ischemia (Castillo et al., 2015), the formation of long‐term memories (Suzuki et al., 2011), hippocampal neurogenesis (Lev‐Vachnish et al., 2019), and signaling (Magistretti & Allaman, 2018). Current methods for probing lactate production in the human brain, namely proton magnetic resonance spectroscopy (MRS) to measure the lactate pool size or PET to measure the OGI, provide an incomplete picture. Proton MRS can be used to measure the net lactate concentration, which does increase locally during brain activation (Koush et al., 2019, 2021; Mangia et al., 2006). The OGI reflects the relative rate of all nonoxidative uses of glucose, which includes lactate production and other fates.
In this study, HP‐13C MRI was used to measure 13C‐metabolite signals in a cohort of 35 cognitively normal individuals to investigate global and regional changes in 13C‐metabolite production with age. This recently developed method enables imaging of the conversion of 13C‐labeled substrates into downstream 13C‐labeled metabolites, such as the conversion of 13C‐pyruvate to 13C‐lactate or 13C‐bicarbonate. The relative signal from each downstream 13C‐labeled metabolite provides information about the chain of events that results in that downstream metabolite. Thus 13C‐lactate signal is a marker of the anaerobic conversion of 13C‐pyruvate to 13C‐lactate, while 13C‐bicarbonate signal is a marker of 13C‐pyruvate conversion to acetyl‐CoA. The major rate‐limiting factors for these reactions include the transmembrane transport of pyruvate and lactate through monocarboxylate transporters, the local availability of the required enzymes and co‐factors, as well as the enzyme activities and pre‐existing metabolite concentrations. We hypothesized that 13C‐lactate signal would decrease with age in parallel to the decreasing OGI observed using PET imaging (Goyal et al., 2017).
2. MATERIALS AND METHODS
The cohort consisted of 35 individuals (male: 14, female: 21) ranging in age from 21 to 77. All but one of the participants were screened using the Montreal Cognitive Assessment (MoCA) to exclude individuals with cognitive impairment. The study was conducted under a protocol approved by the Research Ethics Board of Sunnybrook Health Sciences Centre and approved by Health Canada as a Clinical Trial Application. Informed written consent was provided by all participants.
2.1. Scan workflow
The experimental workflow and the image postprocessing used for data analysis is shown in Figure 1. A General Electric SPINLab polarizer system (GE, Waukesha, WI) was used to polarize each 1.47 g sample of [1‐13C]pyruvic acid (Sigma Aldrich, St. Louis, MO) as previously described (Lee et al., 2020). Prior to scanning, a 20‐gauge intravenous catheter was inserted into the forearm of each participant to allow for the injection. The volume for injection was preset based on a dose of 0.43 mL/kg of the 250 mM hyperpolarized [1‐13C]pyruvate solution.
FIGURE 1.
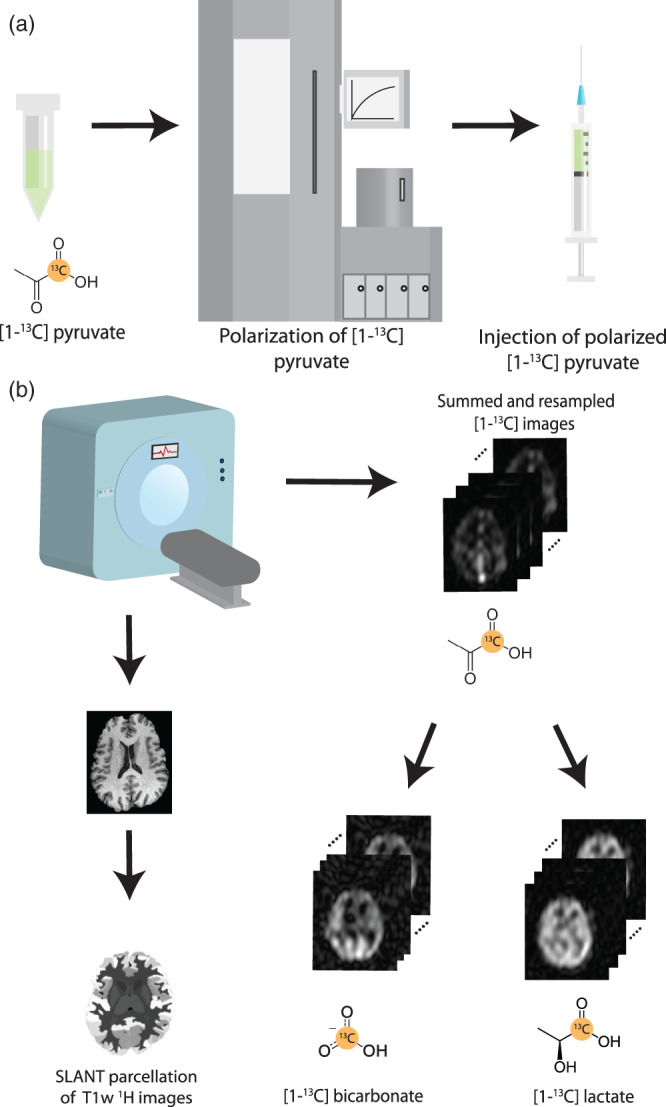
Schematic of the experiment workflow used. (a) Prior to injection, [1‐13C]pyruvate is polarized for up to 3 h prior to dissolution and release by a pharmacy technician. (b) The 13C image acquisition starts at the end of injection of polarized 13C‐pyruvate and 13C‐metabolite images covering the whole brain are acquired. Then conventional anatomical images are acquired, which are parcellated into 132 regions during postprocessing. The parcellation maps are then used to compute mean 13C‐metabolite signals for each atlas region.
Participants were positioned within a GE MR750 3.0T MRI scanner (GE Healthcare, Waukesha, WI) with a custom‐built 13C head coil (26 cm diameter, 25 cm long, 8‐rung lowpass birdcage). The dose of hyperpolarized 13C‐pyruvate was injected at 4 mL/s, followed by a 20 mL saline flush at 5 mL/s. Immediately following the flush, whole‐brain 13C‐lactate, 13C‐bicarbonate, and 13C‐pyruvate images were acquired every 5 s over a 60 s imaging window, with 1.5 cm isotropic spatial resolution.
Each volume‐timepoint was imaged using 24 excitations to encode the 3D volume, with net tip angles of 80° for 13C‐lactate, 80° for 13C‐bicarbonate, and 11° for 13C‐pyruvate (Cunningham et al., 2008; Geraghty et al., 2018). The pulse sequence also included a slab‐localized spectroscopy acquisition from a 4 cm thickness axial slab centered on the corpus callosum, applied once each 5 s, after each block of 13C‐metabolite imaging. This spectroscopy data were used for quality control of the metabolic image acquisitions.
After the 13C imaging and spectroscopy were collected, the participants remained in the scanner in the same position, while the 13C head coil was replaced with an 8‐channel 1H neurovascular array (Invivo Inc., Pewaukee, WI) to permit standard anatomical imaging (axial fast spoiled gradient echo images, FOV 25.6 × 25.6 cm2, 1 mm isotropic resolution, TR 7.6 ms, TE 2.9 ms, flip angle 11°). Foam padding was used to minimize head movement between the metabolic and anatomic scans. The 13C‐images were reconstructed and resampled in Matlab (MATLAB, 2019) and saved in DICOM format for further analysis.
2.2. Regional metabolite signal normalization
The regional 13C‐metabolite signals were computed using the BrainCOLOR labeling protocol (Klein & Tourville, 2012). First, the T1‐weighted images were parcellated using the SLANT (Spatially Localized Atlas Network Tiles) method (Huo et al., 2019), providing 132 regions for each participant. The 13C‐lactate images were registered to the corresponding T1‐weighted images with an affine registration using FSL (Jenkinson et al., 2002). The resulting transformation matrix was then used to register the corresponding 13C‐bicarbonate and 13C‐pyruvate images for each participant. The participant‐specific parcellation map was used to compute the mean 13C‐pyruvate, 13C‐lactate, and 13C‐bicarbonate signal for each region in each participant.
To normalize for the variable polarization of the 13C‐pyruvate substrate at the time of delivery, each regional 13C‐metabolite signal was integrated over the 12 timepoints and divided by the time integral of the 13C‐pyruvate in the same region, giving the lactate‐to‐pyruvate ratio (), bicarbonate‐to‐pyruvate ratio (), and lactate‐to‐bicarbonate ratio () for each region and participant.
The spectroscopy data were phased and baseline corrected using the SAGE spectral processing package (GE Healthcare). The 12 timepoints were summed together to produce spectra for comparison to the imaging data.
2.3. Statistical analysis
The analysis was performed on the logarithm transform of , denoted as log(L p ), to produce a more homoscedastic residual distribution, (see e.g., Figure S12). This was also done for .
Initial mixed‐effects ANOVAs were performed for dependent variables log(L p ) and log(B p ) with age categorized as “young” or “old” (below or above the median age), and brain region and age–region interaction as the independent variables to establish that these effects were significant.
Post hoc pairwise comparisons of estimated marginal means (Lenth, 2022) were done between the “young” and “old” groups for each of the 132 brain regions. The false‐discovery rate method (Benjamini & Hochberg, 1995) was used to adjust the threshold for significance, accounting for the 132 comparisons. Brain regions with a significant p‐value after this procedure are listed in Tables S6 and S7.
To further explore the details of lactate dependence on age and region, log(L p ) and log(B p ) were also analyzed with linear mixed‐effects regression in R (version 3‐3 using the nlme package [R Core Team et al., 2013]). This form of regression was chosen because multiple measurements from each individual were being analyzed. The regression was repeated for log(B p ).
The independent variables were added one by one, with models of increasing complexity compared using ANOVA to test whether each independent variable accounted for any additional variance. Biological sex and body weight were not found to explain any additional variance and were thus not included (see Tables S2 and S3). The random effect (participant ID) term was included to account for baseline metabolite levels on administration and other between‐participant differences. An age–region interaction term was included to explore how the regional age effect differed from the mean age effect, and was found to be a statistically significant source of the observed variance.
Once fit, the mixed‐effects regression coefficients were used to compute regional percent change per decade for and (see Supporting Information for equation) and are color coded from lowest to highest in Figure 7 and 8. Note that color‐coding of the rendering matches the rendering, and showed more extreme changes than .
FIGURE 7.
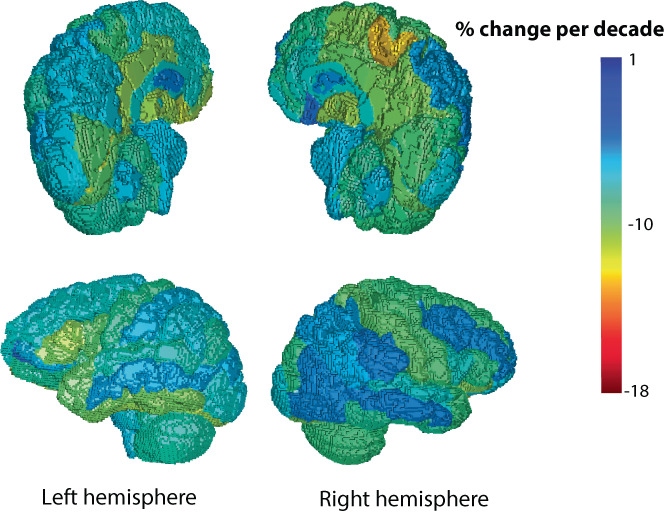
The fitted regression model was used to compute a percent change in per decade for each region, displayed as a color on the rendering.
FIGURE 8.
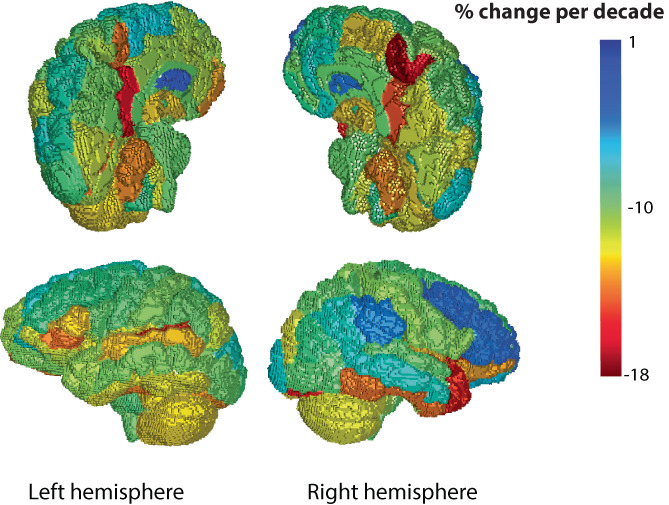
The fitted regression model was used to compute a percent change in per decade for each region, displayed as a color on the rendering.
An apparent increase in log(L p ) and log(B p ), and decrease in log(L B ) was observed for subjects aged 25–30. This was tested for statistical significance with a secondary mixed‐effects ANOVA on the subgroup of participants with age ≤30 years (N = 20). Fixed effects in the ANOVA were brain region, and age, categorized as younger (age ≤25) and older (age = 26–30). Participant ID was designated a random effect.
3. RESULTS
3.1. Lactate
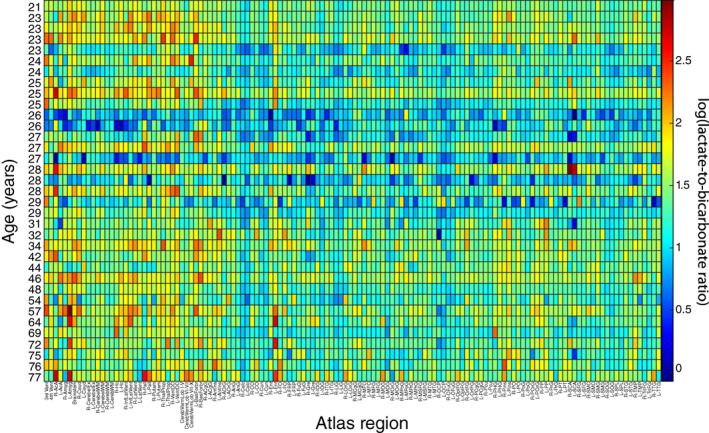
The log of the ratio is plotted versus region and age in Figure 2. In the plot, there is a notable reduction in log(L p ) with increasing age, but with an apparent temporary increase for individuals in their late twenties.
FIGURE 2.
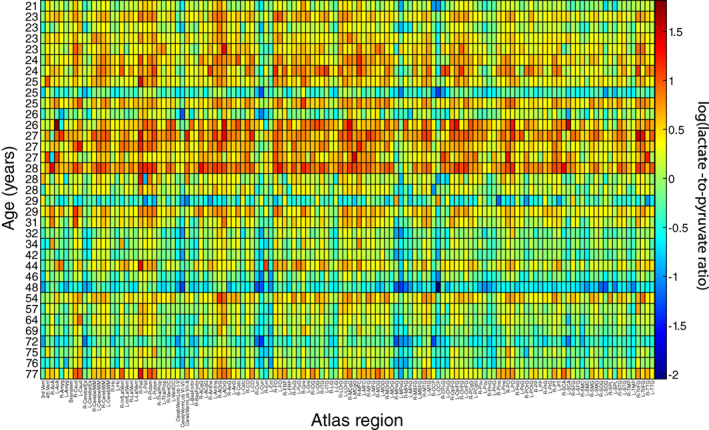
Heatmap of the log transformed lactate‐to‐pyruvate ratio, log(L p ), for each atlas region, with age on the vertical axis and the BrainCOLOR atlas region across the horizontal axis.
The initial mixed‐effects ANOVA for log(L p ) with age categorized as “young” or “old” (below or above the median age), brain region and age–region interaction as the independent variables showed that all three were significant (see Table S4). The corresponding box plots are shown in Figure 4a–c.
FIGURE 4.
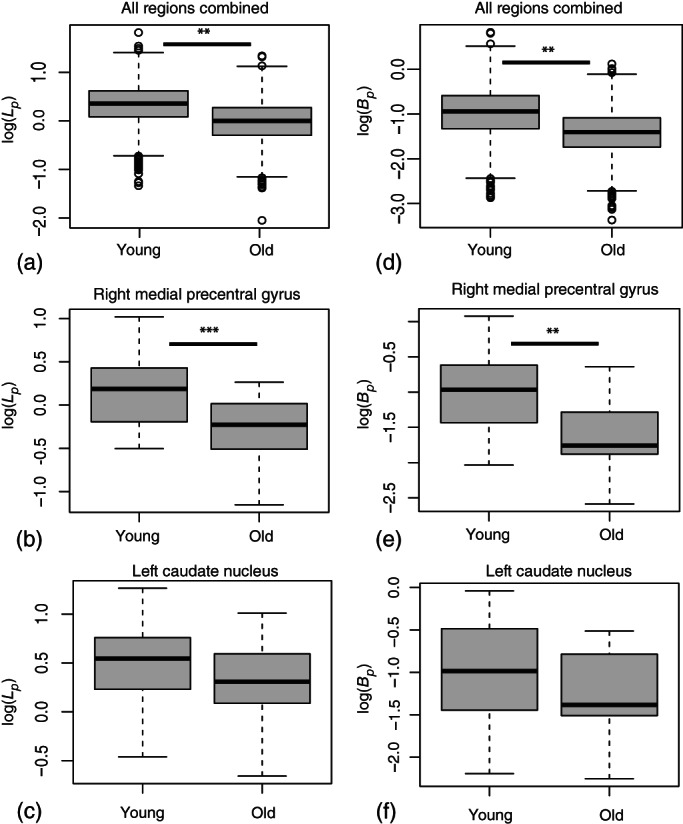
Box plots showing the log transformed lactate‐to‐pyruvate ratio for all regions (a) with age categorized as “young” or “old.” The midline shows the median value, the upper and lower limits of the box show the third and first quartile (75th and 25th percentile), respectively. The whiskers show 1.5 times the interquartile range and any data beyond that is plotted as a point. The plots for the two example regions shown in Figure 6 are shown in (b) and (c). The corresponding plots for bicarbonate‐to‐pyruvate ratio (d–f). **: p < .01, ***: p < .001.
The mixed‐effects regression of log(L p ) with age as a continuous variable gave a global age beta coefficient of () for log(L p ) which corresponds to a change per decade. All reported plus/minus values are based on the standard errors from the regression.
3.2. Bicarbonate
The log of the ratio is plotted versus region and age in Figure 3. There is a visible reduction in log(B p ) with increasing age, again with an apparent increase for individuals in their late twenties.
FIGURE 3.
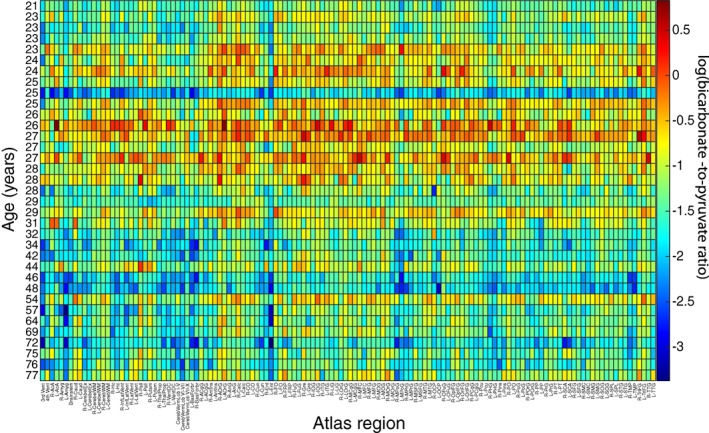
Heatmap of the log transformed bicarbonate‐to‐pyruvate ratio, log(B p ), for each atlas region, with age on the vertical axis and the BrainCOLOR atlas region label across the horizontal axis.
The initial mixed‐effects ANOVA for log(B p ) with age categorized as “young” or “old” (below or above the median age), brain region and age–region interaction as the independent variables showed that all but the age–region interaction were significant (see Table S5). The corresponding box plots are shown in Figure 4d–f.
The mixed‐effects regression of log(B p ) with age as a continuous variable gave a global age beta coefficient of () for log(B p ) which corresponds to a change per decade.
Figure 5 displays log(L B ) versus atlas region for all subjects, showing no notable change in this ratio with age, which was supported by the results of the corresponding regression. However, a regional variation in the lactate‐to‐bicarbonate ratio can be observed in this plot and thus will be explored in future experiments.
FIGURE 5.
Heatmap of the log transformed lactate‐to‐bicarbonate ratio, log(L B ), for each atlas region, with age on the vertical axis and the BrainCOLOR atlas region across the horizontal axis.
3.3. Regional differences
The mixed‐effects regression models provided coefficients for the fitted change per year for each of the 132 brain regions. The coefficients were used to compute the regional percent change per decade. The region with one of the greatest percent changes per decade in log(L p ) and log(B p ), the right medial precentral gyrus, and the region with the smallest percent change per decade in both log(L p ) and log(B p ), the left caudate nucleus, are plotted versus age in Figure 6. Comparison of the region plots highlights the region–age interaction effect that gives different slopes against age for different regions. The map of regional change with age in log(L p ) and log(B p ) are shown in Figures 7 and 8, respectively. Overall, a similar pattern of region‐dependent change versus age was observed for both and , with matching regions showing fast and slow change.
FIGURE 6.
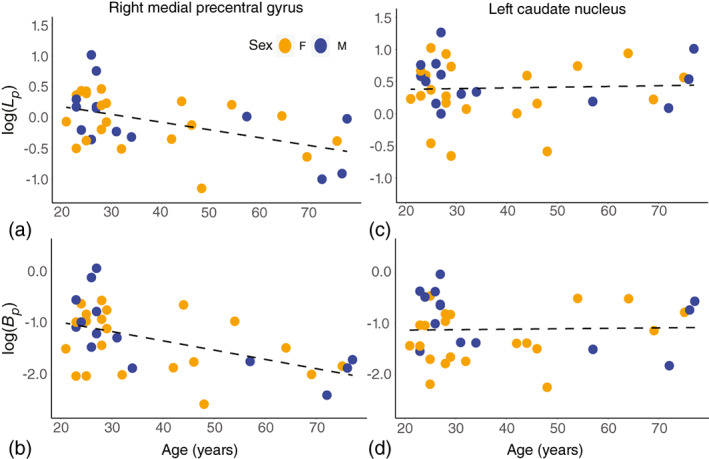
Scatter plots of the brain regions with the greatest and least change in both and . The measured values for log(L p ) and log(B p ) are shown as dots and the fitted regression line for each region as a dashed line. Each point is color‐coded by the sex of the corresponding participant. The y‐intercept was computed from the mean of all participant ID beta coefficients plus the intercept coefficient from the regression model. The steepest slope with age for both (a) log(L p ) and (b) log(B p ) was observed in the right medial precentral gyrus. The left caudate nucleus showed a flat versus age (c) and that was slightly increasing (d).
Comparing hemispheres, the right medial precentral gyrus showed a change in per decade and change in versus the left medial precentral gyrus with per decade in and per decade in . The left caudate showed a change of in per decade and in versus the right caudate with per decade in and per decade in .
Example images from a mid‐saggital slice in a younger and older subject are shown in Figure 9. Note that, the raw (non‐normalized) signal from 13C‐lactate and 13C‐bicarbonate is significantly lower in the older subject, while the 13C‐pyruvate signal is similar. The raw 13C‐metabolite signal and log transformed 13C‐metabolite ratios measured from the summed whole‐brain data are plotted versus age in Figure 10 and are in agreement with the overall decrease measured from the parcellated 13‐metabolite data.
FIGURE 9.
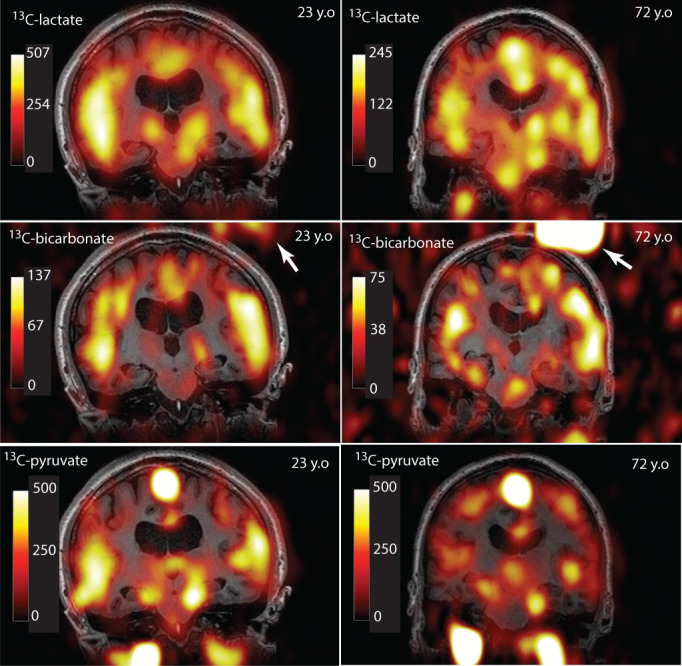
Representative mid‐saggital slice from a younger (23 years old [y.o.]) and older (72 y.o.) subject. The color overlay indicates the raw (non‐normalized) 13C‐lactate (upper row), 13C‐bicarbonate (middle row), or 13C‐pyruvate (lower row) signal. Lower signal is apparent for both 13C‐lactate and 13C‐bicarbonate in the older subject (note the color scale), whereas the 13C‐pyruvate signal is similar. The bright object (arrows) is the 13C‐urea reference used for prescan calibration.
FIGURE 10.
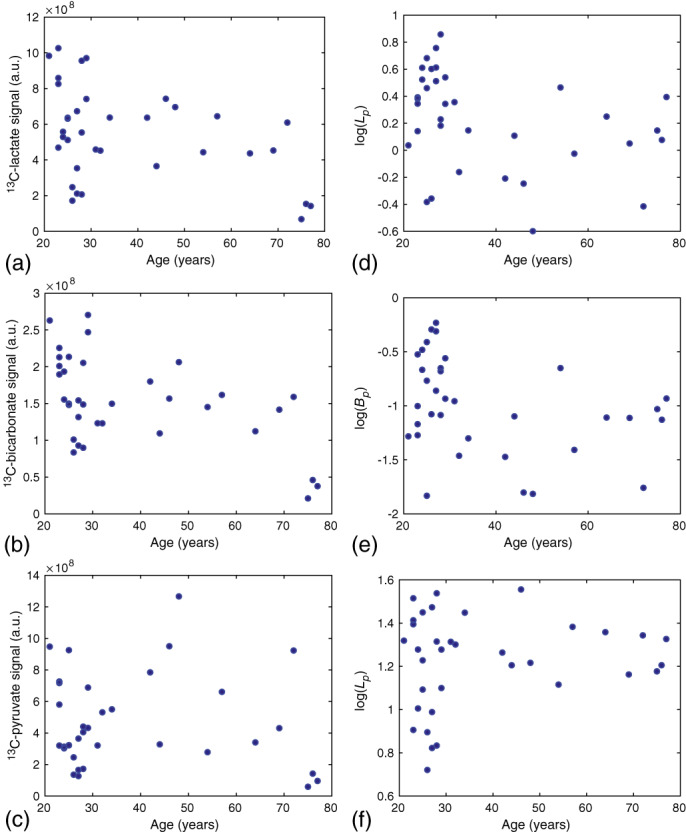
Summed whole‐brain 13C‐metabolite signal versus age. The raw 13C‐lactate signal (a) and 13C‐bicarbonate signal (b) display a trend toward lower values with increasing age. The 13C‐pyruvate signal does not show this trend. The log signal ratios (d–f) computed from the whole‐brain signals are in agreement with those from the parcellated results, with a trend toward lower values with increasing age for (d) and (e), and absence of a downward trend for (f).
3.4. Spectroscopy
Representative spectroscopy data from a single participant are shown in Figure 11. Besides the metabolites that are typically observed in the brain in studies utilizing [1‐13C]pyruvate, [1‐13C]aspartate (SNR > 5) was also measurable in 26 of the 35 participants, and [4‐13C]aspartate was measurable in 8 participants after summing the spectra from all 12 time points. To our knowledge, these data represent the first observation of pyruvate carboxylation in humans using hyperpolarized 13C MRI.
FIGURE 11.
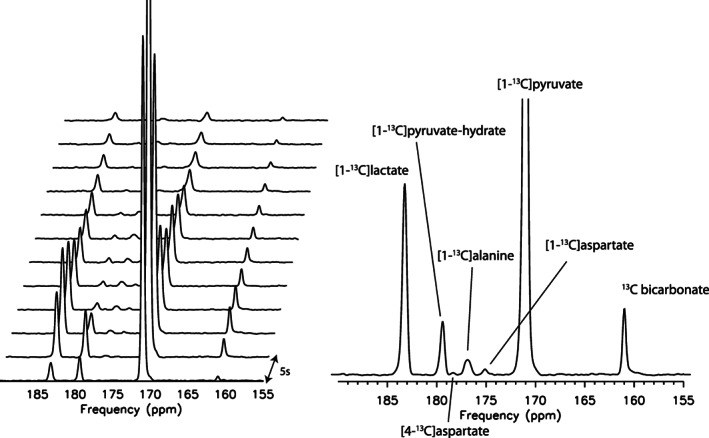
Representative spectroscopy data from one participant. Spectra were acquired every 5 s, separately plotted (left) and summed (right). Note the peaks from [1‐13C]aspartate and [4‐13C]aspartate, indicative of pyruvate carboxylation in the brain.
3.5. Subjects ≤ 30 years old
The mixed‐effects regression on the subgroup of participants with age ≤ 30 (N = 20) showed no significant age effect in log(L p ), log(B p ), or log(L B ). However, log(B p ) and log(L B ) had a significant age–region interaction term ( and , respectively), suggesting that opposing directions of change among different brain regions may have caused a crossing effect, producing no net age on average.
4. DISCUSSION
In this study, hyperpolarized 13C‐MRI was used to measure 13C‐lactate and 13C‐bicarbonate production in 132 brain regions versus age. Evidence of decreasing 13C‐lactate and 13C‐bicarbonate production was found, as reflected by significant negative regression coefficients for both L p and B p versus age, with significant differences in this aging effect between brain regions.
The observed reduction in 13C‐lactate production with age is consistent with the decreasing FDG uptake and glucose to oxygen ratio versus age observed with PET (Goyal et al., 2017). With both methods, regions of the cerebral cortex like the medial precentral gyrus were among the fastest decreasing regions, while regions of the striatum like the left caudate had minimal change with age.
Reduced CBF with aging (Hanzhang et al., 2011), which would cause reduced vascular 13C‐pyruvate signal and/or reduced 13C‐pyruvate delivery to the brain, does not explain an age‐related decrease in or because 13C‐pyruvate signal is in the denominator. It is possible that an age‐related increase in blood–brain barrier permeability contributed to increased 13C‐pyruvate uptake in some older subjects (Verheggen et al., 2020). However, raw 13C‐lactate and 13C‐bicarbonate signal showed a decrease with age (Figure 10).
The conversion of 13C‐pyruvate to 13C‐lactate has been shown to be dominated by the “exchange‐of‐label” effect in some conditions, where the steady‐state lactate pool size prior to the 13C‐pyruvate is injected is the main determinant of the observed 13C‐lactate signal (Day et al., 2007). However, the steady‐state lactate concentration in the human brain measured by proton spectroscopy is low (0.3–1 mM) (Merboldt et al., 1992; Prichard et al., 1991) and increases with age (Grachev & Apkarian, 2000). Thus, any lactate pool‐size effect would be expected to increase with age and does not explain the observed reduction in 13C‐lactate production. Nor does it explain the age‐associated reduction in 13C‐bicarbonate, which is produced in an irreversible reaction within mitochondria (Merritt et al., 2007) and thus not subject to the exchange phenomenon.
The fact that 13C‐bicarbonate production decreased with age in most brain regions largely in proportion to the reduction in 13C‐lactate production was not anticipated. A hypothesis for why these two signals change in tandem is that the reduction in 13C‐lactate and 13C‐bicarbonate production with age are caused by a change in a common pathway involving lactate production and matched consumption.
The limitations of the study include the spatial resolution of the 13C‐metabolite images, which was relatively coarse (isotropic 1.5 cm voxels), causing partial‐volume errors for the smallest regions in the BrainCOLOR atlas. It is likely that the age‐associated variation in 13C‐metabolite signal in some smaller regions was deemed statistically insignificant due to this source of error. The parcellation was performed automatically without human input and may contain errors. Neither of these issues would change the main findings. The sub‐analysis of participants of age ≤30 years showed that neither 13C‐lactate, nor 13C‐bicarbonate production change with age during this specific timeframe. However, this may be an artifact of the limited sample size.
5. CONCLUSIONS
Hyperpolarized 13C MRI was used to measure regional 13C‐lactate and 13C‐bicarbonate production in a healthy aging cohort. A significant global decrease in both 13C‐lactate and 13C‐bicarbonate production with age was observed. A mixed effects linear regression analysis identified regions that were changing with a significantly higher or lower rate with age than the mean global change. These findings are in agreement with the PET literature showing decreasing glucose uptake and nonoxidative glucose consumption with increasing age and supports the hypothesis that this is due to decreasing lactate production in the brain with age.
AUTHOR CONTRIBUTIONS
Casey Y. Lee, Benjamin Geraghty, Albert P. Chen, and Charles H. Cunningham developed the data acquisition methods. Biranavan Uthayakumar, Nadia D. Bragagnolo, Nicole I. C. Cappelletto, Casey Y. Lee, and Ruby Endre operated the MRI scanner. Biranavan Uthayakumar, Casey Y. Lee, and Benjamin Geraghty did the image reconstruction. Biranavan Uthayakumar did the image analysis. Hany Soliman assessed the participants and performed the 13C‐pyruvate injections. Ruby Endre operated the injector. William J. Perks and Nathan Ma performed compounding and pharmacy release of the 13C‐pyruvate doses. Albert P. Chen and Charles H. Cunningham built the 13C head coil. Chris Heyn and Sandra E. Black interpreted the images. All authors critically reviewed and edited the manuscript.
Supporting information
Data S1: Supporting Information
ACKNOWLEDGMENTS
Funding support from the Canadian Cancer Society grants 705246 and 707455 and Canadian Institutes of Health Research grant PJT‐152928. Albert P. Chen is employed by GE Healthcare, the manufacturer of the SPINLab polarizer.
Uthayakumar, B. , Soliman, H. , Bragagnolo, N. D. , Cappelletto, N. I. C. , Lee, C. Y. , Geraghty, B. , Chen, A. P. , Perks, W. J. , Ma, N. , Heyn, C. , Endre, R. , MacIntosh, B. J. , Stanisz, G. J. , Black, S. E. , & Cunningham, C. H. (2023). Age‐associated change in pyruvate metabolism investigated with hyperpolarized 13C‐MRI of the human brain. Human Brain Mapping, 44(10), 4052–4063. 10.1002/hbm.26329
DATA AVAILABILITY STATEMENT
The data that support the findings of this study are available from the corresponding author upon reasonable request.
REFERENCES
- Benjamini, Y. , & Hochberg, Y. (1995). Controlling the false discovery rate: A practical and powerful approach to multiple testing. Journal of the Royal Statistical Society: Series B (Methodological), 57(1), 289–300. [Google Scholar]
- Castillo, X. , Rosafio, K. , Wyss, M. T. , Drandarov, K. , Buck, A. , Pellerin, L. , Weber, B. , & Hirt, L. (2015). A probable dual mode of action for both l‐and d‐lactate neuroprotection in cerebral ischemia. Journal of Cerebral Blood Flow & Metabolism, 35(10), 1561–1569. [DOI] [PMC free article] [PubMed] [Google Scholar]
- Cunningham, C. H. , Chen, A. P. , Lustig, M. , Hargreaves, B. A. , Lupo, J. , Duan, X. , Kurhanewicz, J. , Hurd, R. E. , Pauly, J. M. , Nelson, S. J. , et al. (2008). Pulse sequence for dynamic volumetric imaging of hyperpolarized metabolic products. Journal of Magnetic Resonance, 193(1), 139–146. [DOI] [PMC free article] [PubMed] [Google Scholar]
- Day, S. E. , Kettunen, M. I. , Gallagher, F. A. , De‐En, H. , Lerche, M. , Wolber, J. , Golman, K. , Ardenkjaer‐Larsen, J. H. , & Brindle, K. M. (2007). Detecting tumor response to treatment using hyperpolarized 13C magnetic resonance imaging and spectroscopy. Nature Medicine, 13(11), 1382–1387. [DOI] [PubMed] [Google Scholar]
- Drulis‐Fajdasz, D. , Gizak, A. , Wójtowicz, T. , Wiśniewski, J. R. , & Rakus, D. (2018). Aging‐associated changes in hippocampal glycogen metabolism in mice. Evidence for and against astrocyte‐to‐neuron lactate shuttle. Glia, 66(7), 1481–1495. [DOI] [PMC free article] [PubMed] [Google Scholar]
- Geraghty, B. J. , Lau, J. Y. C. , Chen, A. P. , & Cunningham, C. H. (2018). Dual‐echo EPI sequence for integrated distortion correction in 3d time‐resolved hyperpolarized 13c MRI. Magnetic Resonance in Medicine, 79(2), 643–653. [DOI] [PubMed] [Google Scholar]
- Goyal, M. S. , Vlassenko, A. G. , Blazey, T. M. , Yi, S. , Couture, L. E. , Durbin, T. J. , Bateman, R. J. , Benzinger, T. L.‐S. , Morris, J. C. , & Raichle, M. E. (2017). Loss of brain aerobic glycolysis in normal human aging. Cell Metabolism, 26(2), 353–360. [DOI] [PMC free article] [PubMed] [Google Scholar]
- Grachev, I. D. , & Apkarian, A. V. (2000). Chemical heterogeneity of the living human brain: A proton MR spectroscopy study on the effects of sex, age, and brain region. NeuroImage, 11(5), 554–563. [DOI] [PubMed] [Google Scholar]
- Greve, D. N. , Salat, D. H. , Bowen, S. L. , Izquierdo‐Garcia, D. , Schultz, A. P. , Ciprian Catana, J. , Becker, A. , Svarer, C. , Knudsen, G. M. , Sperling, R. A. , et al. (2016). Different partial volume correction methods lead to different conclusions: An 18F‐FDG‐PET study of aging. NeuroImage, 132, 334–343. [DOI] [PMC free article] [PubMed] [Google Scholar]
- Hanzhang, L. , Feng, X. , Rodrigue, K. M. , Kennedy, K. M. , Cheng, Y. , Flicker, B. , Hebrank, A. C. , Jinsoo, U. , & Park, D. C. (2011). Alterations in cerebral metabolic rate and blood supply across the adult lifespan. Cerebral Cortex, 21(6), 1426–1434. [DOI] [PMC free article] [PubMed] [Google Scholar]
- Huo, Y. , Zhoubing, X. , Xiong, Y. , Aboud, K. , Parvathaneni, P. , Bao, S. , Bermudez, C. , Resnick, S. M. , Cutting, L. E. , & Landman, B. A. (2019). 3d whole brain segmentation using spatially localized atlas network tiles. NeuroImage, 194, 105–119. [DOI] [PMC free article] [PubMed] [Google Scholar]
- Jenkinson, M. , Bannister, P. , Brady, M. , & Smith, S. (2002). Improved optimization for the robust and accurate linear registration and motion correction of brain images. NeuroImage, 17(2), 825–841. [DOI] [PubMed] [Google Scholar]
- Klein, A. , & Tourville, J. (2012). 101 labeled brain images and a consistent human cortical labeling protocol. Frontiers in Neuroscience, 6, 171. [DOI] [PMC free article] [PubMed] [Google Scholar]
- Koush, Y. , de Graaf, R. A. , Jiang, L. , Rothman, D. L. , & Hyder, F. (2019). Functional MRS with j‐edited lactate in human motor cortex at 4 T. NeuroImage, 184, 101–108. [DOI] [PubMed] [Google Scholar]
- Koush, Y. , de Graaf, R. A. , Kupers, R. , Dricot, L. , Ptito, M. , Behar, K. L. , Rothman, D. L. , & Hyder, F. (2021). Metabolic underpinnings of activated and deactivated cortical areas in human brain. Journal of Cerebral Blood Flow & Metabolism, 41(5), 986–1000. [DOI] [PMC free article] [PubMed] [Google Scholar]
- Lee, C. Y. , Soliman, H. , Geraghty, B. J. , Chen, A. P. , Connelly, K. A. , Endre, R. , Perks, W. J. , Heyn, C. , Black, S. E. , & Cunningham, C. H. (2020). Lactate topography of the human brain using hyperpolarized 13C‐MRI. NeuroImage, 204, 116202. [DOI] [PubMed] [Google Scholar]
- Lenth, R. V. (2022). emmeans: Estimated marginal means, aka least‐squares means. R package version 1.7.3.
- Lev‐Vachnish, Y. , Cadury, S. , Rotter‐Maskowitz, A. , Feldman, N. , Roichman, A. , Illouz, T. , Varvak, A. , Nicola, R. , Madar, R. , & Okun, E. (2019). L‐lactate promotes adult hippocampal neurogenesis. Frontiers in Neuroscience, 13, 403. [DOI] [PMC free article] [PubMed] [Google Scholar]
- López‐Otín, C. , Blasco, M. A. , Partridge, L. , Serrano, M. , & Kroemer, G. (2013). The hallmarks of aging. Cell, 153(6), 1194–1217. [DOI] [PMC free article] [PubMed] [Google Scholar]
- Magistretti, P. J. , & Allaman, I. (2018). Lactate in the brain: From metabolic end‐product to signalling molecule. Nature Reviews Neuroscience, 19(4), 235–249. [DOI] [PubMed] [Google Scholar]
- Mangia, S. , Tkáč, I. , Gruetter, R. , Van De Moortele, P.‐F. , Giove, F. , Maraviglia, B. , & Uğurbil, K. (2006). Sensitivity of single‐voxel 1H‐MRS in investigating the metabolism of the activated human visual cortex at 7 T. Magnetic Resonance Imaging, 24(4), 343–348. [DOI] [PubMed] [Google Scholar]
- MATLAB . (2019). Version 7.10.0 (R2019b). The MathWorks Inc. [Google Scholar]
- Merboldt, K.‐D. , Bruhn, H. , Hanicke, W. , Michaelis, T. , & Frahm, J. (1992). Decrease of glucose in the human visual cortex during photic stimulation. Magnetic Resonance in Medicine, 25(1), 187–194. [DOI] [PubMed] [Google Scholar]
- Merritt, M. E. , Harrison, C. , Storey, C. , Jeffrey, F. M. , Sherry, A. D. , & Malloy, C. R. (2007). Hyperpolarized 13C allows a direct measure of flux through a single enzyme‐catalyzed step by NMR. Proceedings of the National Academy of Sciences, 104(50), 19773–19777. [DOI] [PMC free article] [PubMed] [Google Scholar]
- Pellerin, L. , Pellegri, G. , Bittar, P. G. , Charnay, Y. , Bouras, C. , Martin, J.‐L. , Stella, N. , & Magistretti, P. J. (1998). Evidence supporting the existence of an activity‐dependent astrocyte‐neuron lactate shuttle. Developmental Neuroscience, 20(4–5), 291–299. [DOI] [PubMed] [Google Scholar]
- Prichard, J. , Rothman, D. , Novotny, E. , Petroff, O. , Kuwabara, T. , Avison, M. , Howseman, A. , Hanstock, C. , & Shulman, R. (1991). Lactate rise detected by 1H NMR in human visual cortex during physiologic stimulation. Proceedings of the National Academy of Sciences of the United States of America, 88(13), 5829–5831. [DOI] [PMC free article] [PubMed] [Google Scholar]
- R Core Team . (2013). R: A language and environment for statistical computing .
- Suzuki, A. , Stern, S. A. , Bozdagi, O. , Huntley, G. W. , Walker, R. H. , Magistretti, P. J. , & Alberini, C. M. (2011). Astrocyte‐neuron lactate transport is required for long‐term memory formation. Cell, 144(5), 810–823. [DOI] [PMC free article] [PubMed] [Google Scholar]
- Vaishnavi, S. N. , Vlassenko, A. G. , Rundle, M. M. , Snyder, A. Z. , Mintun, M. A. , & Raichle, M. E. (2010). Regional aerobic glycolysis in the human brain. Proceedings of the National Academy of Sciences, 107(41), 17757–17762. [DOI] [PMC free article] [PubMed] [Google Scholar]
- Verheggen, I. , de Jong, J. J. A. , van Boxtel, M. P. J. , Gronenschild, E. H. B. M. , Palm, W. M. , Postma, A. A. , Jansen, J. F. A. , Verhey, F. R. J. , & Backes, W. H. (2020). Increase in blood–brain barrier leakage in healthy, older adults. Geroscience, 42(4), 1183–1193. [DOI] [PMC free article] [PubMed] [Google Scholar]
Associated Data
This section collects any data citations, data availability statements, or supplementary materials included in this article.
Supplementary Materials
Data S1: Supporting Information
Data Availability Statement
The data that support the findings of this study are available from the corresponding author upon reasonable request.