

SUMMARY
Alpha-synuclein (αS) is causally involved in the development of Parkinson disease (PD); however, its role in normal vertebrate physiology has remained unknown. Recent studies demonstrate that αS is induced by noroviral infection in the enteric nervous system of children and protects mice against lethal neurotropic viral infection. Additionally, αS is a potent chemotactic activator of phagocytes. In this report, using both wild-type and αS knockout mice, we show that αS is a critical mediator of inflammatory and immune responses. αS is required for the development of a normal inflammatory response to bacterial peptidoglycan introduced into the peritoneal cavity as well as antigen-specific and T cell responses following intraperitoneal immunization. Furthermore, we show that neural cells are the sources of αS required for immune competence. Our report supports the hypothesis that αS accumulates within the nervous system of PD individuals because of an inflammatory/immune response.
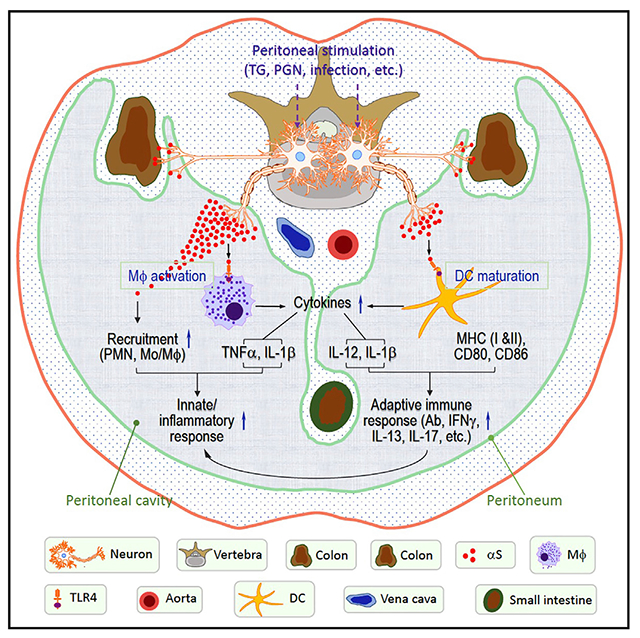
Graphical Abstract
In brief
Alam et al. show that αS produced by the neurons of the gastrointestinal system is critical for the manifestation of peritoneal inflammation and systemic antigen-specific immune responses, which may in turn, promote neuronal αS accumulation and contribute to the development and/or progression of Parkinson disease.
INTRODUCTION
Alpha synuclein (αS) plays a key role in the pathogenesis of Parkinson disease (PD). The best evidence for this is that expression of multiple genes for αS results in severe inherited familial PD (Chartier-Harlin et al., 2004; Polymeropoulos et al., 1997; Singleton et al., 2003). The protein is synthesized within the peripheral nervous system (PNS) and central nervous system (CNS), as well as some non-neuronal tissues such as hematopoietic tissues and several exocrine glands (Bartels et al., 2011; Bloch et al., 2006; Fauvet et al., 2012; Wang et al., 2011, 2013), locations likely to first encounter an immune challenge. In our current understanding of the pathophysiology of PD, membrane-disruptive aggregated forms of αS accumulate within neurons, impairing neuronal function. As the process continues, the neurons die and a secondary inflammatory process ensues, creating further tissue damage (de Groot and Burgas, 2015; Giasson et al., 2000; Reynolds et al., 2011; Zhang et al., 2018). The motor symptoms of PD, such as a resting tremor, a shuffling gait, and a masklike facial expression result from destruction of the substantia nigra, the dopamine-rich center of the brainstem involved in movement (DeMaagd and Philip, 2015; Helmich et al., 2012; Magrinelli et al., 2016). Examination of pathological specimens from the brains of PD patients reveal Lewy bodies, consisting of intracellular aggregates of αS, lipids, and protein within dying neurons (Fanning et al., 2020; Power et al., 2017). Recent studies, pioneered by Braak et al. (2002, 2006), suggest that, although PD has been traditionally thought of as a disease of the brain, the process actually begins in most cases within the nervous system of the GI tract. Indeed, Lewy bodies can be detected in the enteric nervous system (ENS) of individuals years before the onset of the movement disorder, and constipation, a reflection of dysfunction of the ENS, frequently precedes the onset of the movement disorder by many years (Rota et al., 2019). It is believed that αS accumulates within the ENS and traffics up the vagus, sympathetic, and sensory nerves to the brainstem and ultimately to higher centers of the CNS (Breit et al., 2018; Kim et al., 2019). In addition, αS-reactive immune cells can be isolated from individuals with PD, implicating auto-immunity in the disease process (Sulzer et al., 2017).
Until recently, αS had no clearly identified function and, although highly conserved across vertebrate evolution, shared no significant homology with any protein of known function. Because of its physical association with secretory vesicles on fractionation of neurons, it was believed to play a role in neurotransmission (George, 2002). However, mice engineered without synuclein genes (alpha, beta, and gamma) exhibit normal development and a normal neurological and behavioral phenotype but do exhibit deficient host defense against infectious agents (Barbut et al., 2019; Greten-Harrison et al., 2010).
In 2015, Beatman et al. (2015) reported that αS appeared to protect mice from lethal infections of the neurotropic virus, West Nile virus, as reflected by the greater susceptibility and mortality of αS knockout mice than wild-type animals to the infection. Although the antiviral mechanism was not identified, the antiviral benefits of αS could not be ascribed to the expression of antiviral cytokines). In 2017, Tomlinson et al. (2017) reported that αS knockout mice were more likely than wild-type animals to develop a fatal encephalitis following nasal inoculation with reovirus or sepsis following intravenous inoculation of Salmonella typhimurium. Together these studies demonstrated, for the first time in animals, that αS plays a role in immune defense. In 2017, Stolzenberg et al. (2017) reported that αS was induced in the upper-GI tract in children in response to viral infections. αS was shown to exhibit, in vitro, potent chemoattractant activity toward macrophages and neutrophils and stimulate phenotypic maturation of dendritic cells.
In this report, we show that intraperitoneal (i.p.) administration of inflammation inducers such as bacterial peptidoglycan (PGN) or thioglycolate (TG) can stimulate αS production in the inflammatory milieu of the peritoneal cavity and the expression of neuronal αS in the diaphragm and colon. Studies of αS−/− mice show them to be markedly deficient in intraperitoneal leukocyte recruitment in response to inflammatory stimuli and the subsequent induction of antigen-specific immune responses. Conversely, intraperitoneal administration of exogenous αS enhances peritoneal inflammatory and adaptive immune responses. αS appears to support inflammatory and adaptive immune responses in part by the activation of macrophages and dendritic cells (DCs). These data establish that αS plays a critical role in the induction of normal inflammatory and immune responses. In addition, our studies help explain the immune-incompetence to infection observed in αS−/− mice, and the increase in neuronal αS expression in the human GI tract following viral infection. Taken together these observations support the hypothesis that neuronal αS is induced in PD as a consequence of an immune challenge.
RESULTS
Endogenous αS is required for the induction of peritonitis by bacterial proteoglycan
We have shown previously that human αS acts as a potent chemoattractant in vitro of both human monocytes/neutrophils and mouse neutrophils (Stolzenberg et al., 2017). To extend these studies to an in vivo setting, we assayed the extent of peritoneal infiltration of inflammatory cells and concentrations of proinflammatory cytokines in peritoneal fluid following i.p. injection of bacterial PGN in αS+/+ and αS−/− mice. In αS+/+ mice, PGN induced the infiltration of leukocytes, polymorphonuclear neutrophils (PMN), and macrophages (Mφ) at 4 and 24 h, respectively (Figures 1A and 1B). As expected, the proportion of resident peritoneal macrophages (RPMs) decreased (Figure 1A). The decrease in RPMs is due to their migration and adherence to the omentum (Okabe and Medzhitov, 2014). In addition, PGN elevated the production of inflammatory cytokines (tumor necrosis factor-α [TNF-α] and interleukin-1β [IL-1β]). In contrast, following intraperitoneal administration of PGN into βS−/− mice fewer inflammatory cells invaded the peritoneal cavity and lower concentrations of proinflammatory cytokines were produced (Figure 1C). These studies demonstrate that endogenous αS plays a role in the early stages of an inflammatory response to an inflammatory stimulus within the peritoneal cavity, since the decreases were more evident at 4 than at 24 h after injection of PGN.
Figure 1. αS deletion reduced PGN-induced peritoneal inflammation.
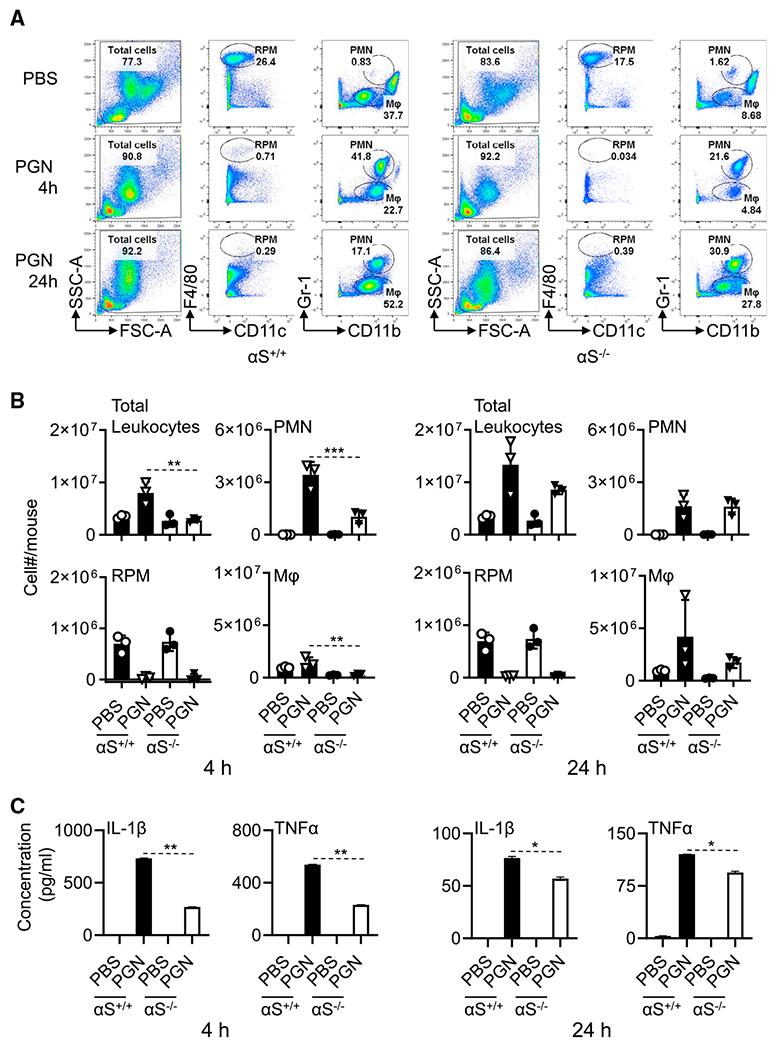
6-week old female αS+/+ and αS−/− mice (n = 3) were injected i.p. with PBS or PBS-containing PGN (100 μg/mice) for 4 and 24 h. Leukocytes in the peritoneal lavage were enumerated and immunostained with anti-mouse CD11c, CD11b, F4\80, Gr-1, B220, CD19, and CD14 antibodies.
(A) Dot plots of one mouse.
(B) The average (mean ± SD) cell number of two experiments.
(C) Peritoneal lavage fluid (4 mL/mouse) was concentrated to a final volume 40 μL and used for quantitation of cytokines (n = 3).
Shown is the average concentration of cytokines of two experiments. *p < 0.05, **p < 0.01, and ***p < 0.001 using one-way ANOVA followed by Tukey’s post hoc test.
αS is induced and secreted at sites of inflammation
Since αS is required for a robust PGN-induced peritoneal innate/inflammatory response (Figure 1), we asked whether endogenous αS appeared within the peritoneal cavity following i.p. administration of PGN. Indeed, there was some αS present in peritoneal fluid of PBS-injected mice, and we observed a marked increase in the concentration of αS protein in the peritoneal lavage of PGN-injected mice in comparison with that of PBS-injected mice, indicating that αS production and secretion was augmented during PGN-induced peritonitis (Figure 2A). The peritoneal αS protein appeared to be dimeric (Figure 2A). Intraperitoneal injection of TG, another well-studied inflammatory stimulant, also produced higher levels of αS dimer in mouse peritoneal cavity (Figure S1).
Figure 2. αS is produced by neural cells in response to inflammation.
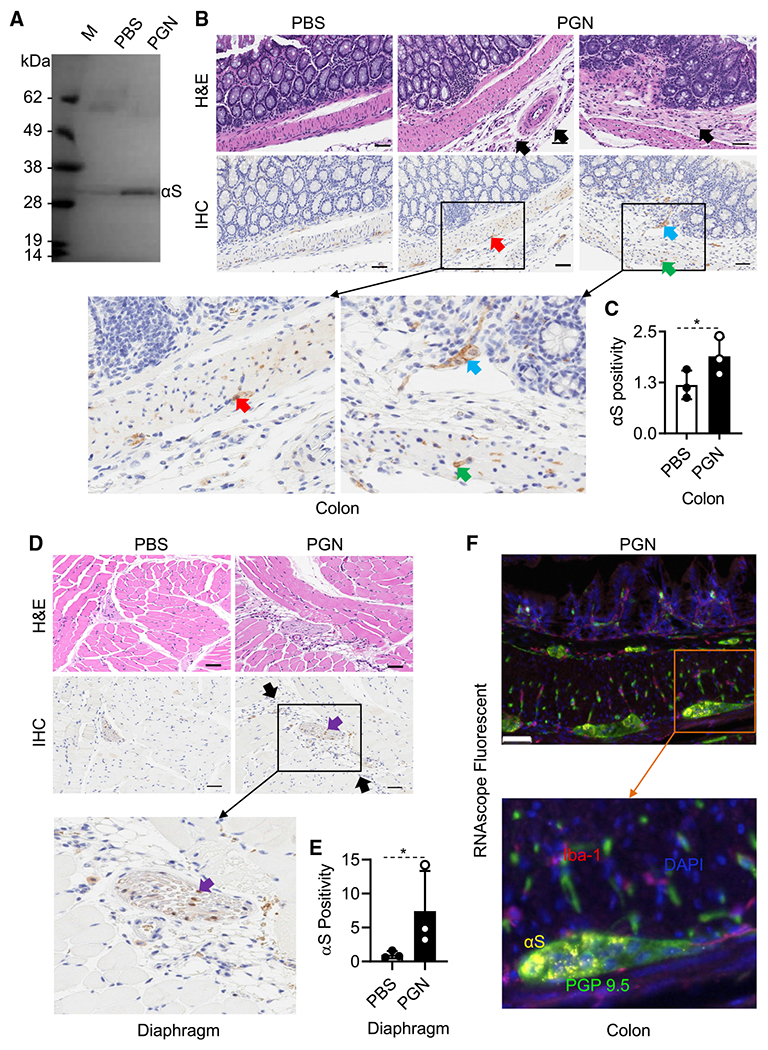
Female C57BL/6 mice (8-week-old, n = 3) were i.p. injected with PBS or PBS containing PGN (100 μg/mouse). After 24 h, peritoneal lavage fluid and colonic and diaphragmatic tissues were collected.
(A) 1 mL lavage fluid was concentrated to a final volume of 10 μl, separated on an SDS-PAGE gel, and western-blotted with anti-αS antibody. Shown are the results of one experiment representative of two.
(B) H&E and IHC of the colon.
(C and E) The expression level of αS in colon and diaphragm tissues (mean ± SD, n = 3) was scanned. αS positivity was calculated using the formula: αS positivity = (total pixels – negative pixels)/total pixels. Shown is the result of one experiment. Black-and-white bar: 50 μm; black arrows, infiltrating leukocytes; red arrows, Myenteric plexus; blue arrow, Meissner’s plexus; purple arrows: nerve fibers; green arrows, axons. Epithelial cells are negative. *p < 0.05 by t test (C and E).
(D) H&E and IHC of the diaphragm.
(F) Representative RNAscope ISH and IHC colon image of mice with PGN-induced peritonitis generated using a specific probe to detect αS (Cy3: yellow) with counter staining for nuclei (DAPI: blue) and immunostaining for macrophages (Iba-1, OPAL690: red) and neuronal marker (PGP 9.5, OPAL520: green).
See also Figures S1 and S2.
The most abundant source of αS in the blood has been reported to be red blood cells (RBCs), and most of the αS in the red cell is dimeric, so it is possible that the inflammatory process was promoted by extravasation of red blood cells within the peritoneal cavity rather than secreted by neurons or by monocyte-derived DCs (MoDCs) and peripheral blood mononuclear cells (PBMCs) (Barbour et al., 2008). Since cultured human macrophages (Tanji et al., 2002) have also been shown to express αS, we confirmed that αS protein can be produced by cultured human MoDCs as well as PBMCs. The expression of αS by MoDC and PBMC was increased in response to many TLR ligands (Figures S2A and S2B). Therefore, the production of αS in the peritoneal cavity could also derive from peritoneal leukocytes.
To identify other potential source(s) of the peritoneal αS, we examined tissues in contact with the peritoneal cavity. The peritoneum consists of a single layer of mesothelial cells on a bed of loose connective tissue. The parietal peritoneum covers the diaphragm as well as the wall of the abdominal cavity, while the visceral peritoneum encloses the GI tract. Both are innervated by the sensory and autonomic nervous systems. When we examined various sub-peritoneal anatomical sites for the presence of αS using immune staining with an anti-αS antibody, we observed a marked increase in expression in the nervous tissue of the diaphragm and the myenteric plexus of the colon following i.p. administration of PGN (Figures 2B and 2D). A quantitative pixel count of positivity of all IHC slides of each group of mice using an Aperio AT2 scanner revealed that PGN stimulated about a 2- and 7-fold increase of αS protein levels in the colon (Figure 2C) and diaphragm (Figure 2E), respectively. We could not detect any significant expression of αS by any non-neuronal tissue, including inflammatory cells within the colon. To further determine the source of αS, colon sections of PGN-induced peritonitis mice were immunohistochemically analyzed for the expression of αS mRNA by RNAScope in situ hybridization (ISH) coupled with immunofluorescent staining of PGP 9.5 (specific for neurons) and Iba-1 (specific for macrophages). αS mRNA was found as discrete puncta located exclusively within the PGP 9.5 positive neuronal cells (Figure 2F). No αS signal could be found in other types of cells, such as epithelial cell, leukocytes, or RBCs (Figure 2). Thus, neurons rather than any other type of cells are the probable source of αS during the development of peritonitis.
To determine whether αS production occurs in a different inflammatory setting, we induced colitis in Rag1−/− mice by the transfer of T effector (T-eff) cells of C57BL/6 mice (Chen et al., 2016b). H&E staining revealed that a large number of macrophages, lymphocytes, and some neutrophils were present in the mucosal and submucosal layer in Rag1−/− following transfer of T-eff cells, but not in the intestinal tissues of C57BL/6 or only Rag1−/− control mice, confirming the induction of colitis in Rag1−/− mice by T-eff cell transfer (Figures S3A and S3B). We examined the expression of αS by immune staining using anti-αS antibody. αS signals were predominantly found in the intramural neuronal tissues, including the myenteric plexus and the submucosal plexus. Minimal αS expression was noted within inflammatory cells. The intensity of staining was significantly greater in specimens with colitis than those from control mice. RNAscope ISH coupled with multi-color immunostaining revealed that αS signals colocalized only with PGP 9.5+ neuronal cells, but not Iba-1+ macrophages or epithelial cells, indicating that neurons in the mouse peritoneal tissue are the source of αS in the course of Teff-induced colitis (Figure S3C). These observations demonstrate that neuronal αS is induced not only at the initiation of inflammation, as we have shown above, but also during its progression, suggesting that neuronal αS can play a major role in inflammation.
αS polarizes macrophages toward M1 phenotype
αS is chemotactic for both human monocytes/neutrophils and mouse neutrophils with the requirement that the neutrophils express CD11b (Stolzenberg et al., 2017). To determine whether αS could activate macrophages, we treated mouse bone-marrow-derived macrophages (BMDMs) with αS for an additional 24 h and subsequently analyzed their characteristics. Flow-cytometry analysis revealed that αS dose-dependently upregulated BMDM expression of CD80, CD86, and F4/80 (Figure 3A). Measurement of cytokines in the culture supernatants showed that αS promoted the production of proinflammatory cytokines TNF-α and IL-12p70 at 1 μM αS by BMDMs (Figure 3B). Further analysis of surface markers revealed that 24 h after αS treatment: (1) close to 99% of the treated cells were CD11b+/F4/80+ macrophages, (2) the frequency of M1 (CD11c+/CD206−) subpopulation increased whereas the percentage of M2 (CD11c−/CD206+) subpopulation decreased, and (3) αS-treated BMDMs had higher levels of activation markers (CD80 and CD86). The elevated production of cytokines (TNF-α and IL12-p70) and the increased mRNA expression of IL12p40, TNF-α, and NOS2 in response to αS are typical for M1 polarization (Figures 3C–3E). Therefore, human αS is capable of promoting M1 polarization of mouse macrophages.
Figure 3. αS polarizes mouse BMDM into M1 type macrophages.
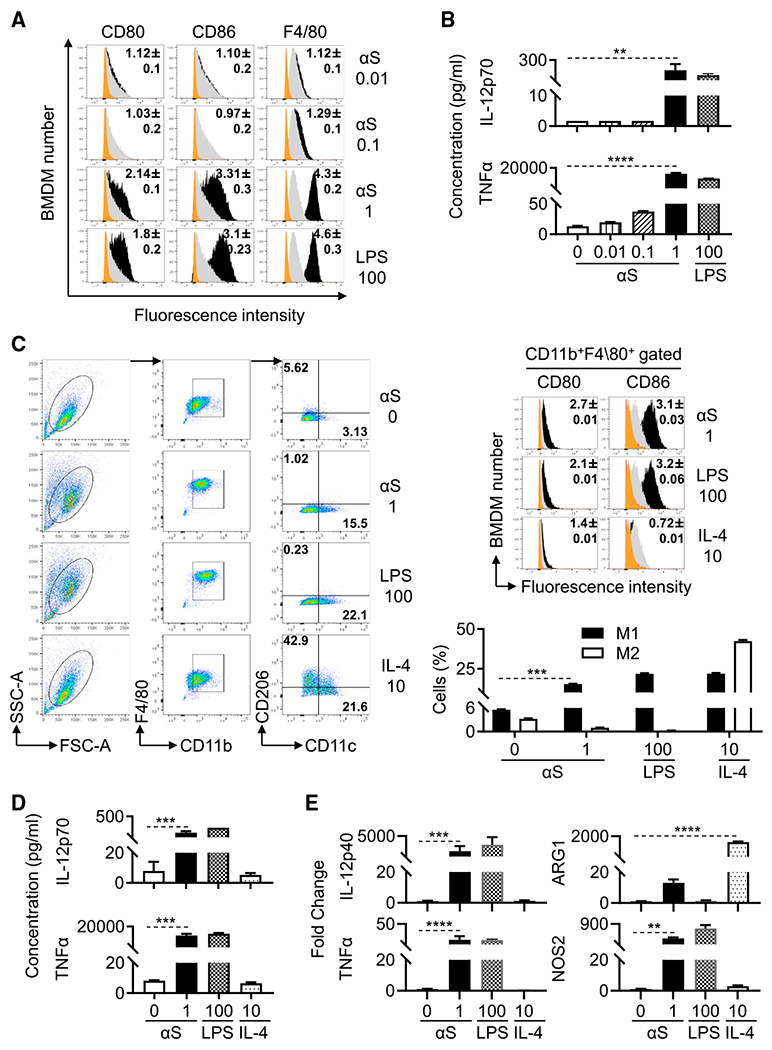
Mouse BMDMs were treated without (sham) or with αS (μM), LPS (ng/mL), or IL-4 (ng/mL) for 24 h to assess their activation and polarization.
(A) Overlay histogram of treated BMDM (orange area = isotype control; gray area = sham-treated; the number inside the histograms is the average [mean ± SD] fold increase in terms of geometric fluorescent intensity of five experiments).
(B) Cytokine levels (production) in the culture supernatant of treated BMDM (the average [mean ± SD] of five experiments).
(C) Relative expression of indicated surface markers and percentage of M1 and M2 polarization of treated BMDM.M1 polarized macrophages characteristically are CD11b+F4/80+CD11c+ CD206− cells, whereas M2 macrophages are CD11b+F4/80+CD11c−CD206+ cells.
(D) IL-12 and TNFα production in the supernatant of treated BMDM.
(E) Fold increase of IL-12p40, TNFα, NOS2, and ARG1 of treated BMDM.
Shown are the plots of one experiment and the average fold increase in the expression of CD80 and CD86 (mean ± SD) or percentage of M1 and M2 types of macrophages or the fold change of cytokines and in genes products representative of three experiments. *p < 0.05, **p < 0.01, ***p < 0.001, and ****p < 0.0001 between sham- and αS-treated group using one-way ANOVA followed by Tukey’s post hoc test.
αS promotes phenotypic and functional maturation of DCs
We next explored the effects of αS on the functional characteristics of DCs. We had previously shown that both monomeric and oligomeric αS upregulates the surface maturational markers on human MoDCs (Stolzenberg et al., 2017). To determine whether αS could induce full (both phenotypic and functional) DC maturation, MoDCs were incubated with various concentrations (0.01–1 μM) of human monomeric αS for 24 h and subsequently analyzed for phenotypic markers and cytokine production. αS upregulated DC surface expression of co-stimulatory (CD80, CD83, and CD86) and MHC (HLA-ABC) molecules (Figure 4A). In addition, αS elevated mRNA expression of TNF-α, IL-1β, and IL-12p40 (Figure S4) and production of proinflammatory cytokines TNF-α, IL-1β, and IL-12p70 in a dose- (Figure 4B) and time- (data not shown) dependent manner. When αS-treated human MoDCs were cocultured with allogenic human CD4+ T cells in a mixed lymphocyte reaction (MLR), αS dose-dependently enhanced DC’s capacity to stimulate CD4+ T cell proliferation (Figure 4C). Measurement of the cytokines in the supernatants of allogeneic MLR revealed that αS treatment of DCs dose-dependently promoted the production of IFN-γ, IL-5, IL-13, and IL-17A by human CD4+ T cells (Figure 4D), suggesting that αS enabled DCs to promote differentiation of CD4+ T cells into Th1, Th2, and Th17 cells. Noticeably, αS at less than 1 μM enabled DCs to promote Th1, Th2, and Th17 differentiation, whereas at 1 μM αS endowed DCs with the capacity to still promote Th1 and Th17 but less Th2 differentiation raising the possibility that αS may have distinct concentration-dependent biological effects. Overall, these data demonstrate that αS has the capacity to induce functional maturation of human MoDCs.
Figure 4. αS induces phenotypic and functional maturation of human and mouse DCs.
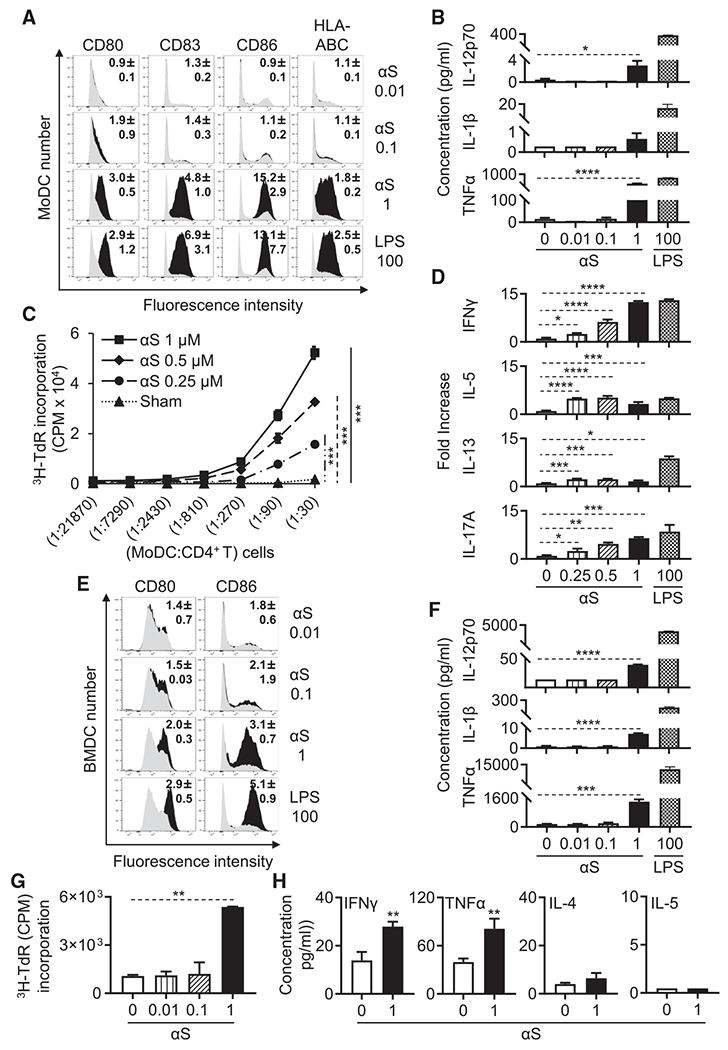
(A and B) Human MoDCs treated without or with αS (μM) or LPS (ng/mL) for 24 h were immunostained for measurement by flow cytometry of their expression of indicated surface markers (gray area = sham-treated; number inside the histograms is the average [mean ± SD] fold increase in terms of geometric fluorescent intensity of three experiments) or the cytokine levels (the average [mean ± SD] of three experiments) present in the supernatants.
(C) αS-treated human MoDCs were co-cultured with allogenic CD4+ T cells at indicated ratios for 4 days and pulsed with [3H]-TdR for the last 12 h. CD4+ T cell proliferation was measured by [3H]-TdR incorporation.
(D) Supernatants from human CD4+ T cells cocultured with LPS (ng/mL) or αS μM)-treated MoDCs (CD4+ T:MoDCs = 50:1) for 3 days were quantitated for cytokine production (the average [mean ± SD] of three separate experiments is shown).
(E and F) Mouse BMDCs treated without or with αS (μM) or LPS (ng/mL) for 24 h were assessed for DC expression of indicated surface markers (gray area, sham-treated), and their cytokine production was determined as in (A) and (B).
(G) OVA-loaded and αS (μM)-treated mouse BMDCs were co-cultured with naive syngeneic OT-II lymphocytes at a BMDCs:OT-II T cells ratio of 1:10 for 4 days and pulsed with [3H]-TdR (1 μCi/well) for the last 18 h. The OT-II T cell proliferation was measured by [3H]-TdR incorporation.
(H) Supernatants of OT-II T cells co-cultured with OVA-loaded BMDCs that were treated without or with αS (μM) for 2 days were assessed for the indicated cytokines (the average [mean ± SD] of three experiments).
*p < 0.05, **p < 0.01, ***p < 0.001, and ****p < 0.0001 between sham- and αS-treated group using t test (H), using repeated-measures of ANOVA (C), or one-way ANOVA followed by Tukey’s post hoc test (B, D, F, and G). See also Figure S3.
Next, we investigated whether αS has similar activating effects on mouse DCs. When mouse bone marrow-derived DCs (BMDCs) were treated, αS dose-dependently increased DC expression of co-costimulatory molecules (CD80 and CD86) (Figure 4E) and production of pro-inflammatory cytokines (IL-12p70, IL-1β, and TNF-α) (Figure 4F) in comparison with sham treatment. OVA-loaded BMDCs treated by monomeric αS acquired the capacity to promote OT-II T cell proliferation (Figure 4G) and production of IFN-γ and TNF-α (Figure 4H). Thus, human αS can stimulate phenotypic and functional maturation of both human and mouse DCs, endowing them with enhanced antigen-presenting capacity.
Activation of APCs by αS requires TLR4 and MyD88 signaling pathways
To identify the signal transduction initiated by αS, we stimulated human MoDCs with monomeric αS for 0–120 min. αS treatment resulted in a decrease in I-κ-Bα and increased the phosphorylated form of phospho-p65 in both a dose- and time-dependent manner suggesting that monomeric human αS triggered the activation of nuclear factor κB (NF-κB) signaling pathway in human DCs (Figures S5A and S5B).
Next, we identified the receptor for αS on APCs. αS stimulation of BMDCs and BMDMs from MyD88−/− mice revealed that αS activation of DCs and macrophages was partially dependent on MyD88. BMDCs and BMDMs from MyD88−/− mice showed only partially decreased expression of costimulatory molecules (CD80, CD86, and F4/80) as well as TNF-α production (Figures 5A, 5B, S6A, and S6B). We further determined whether αS-induced activation of DCs is partially dependent on TRIF (TIR domain containing adaptor protein inducing IFN-β). BMDCs from TRIF−/− mice treated with αS produced many fewer IL-12p70 and TNF-α cytokines than the BMDCs from TRIF+/+ mice under the identical conditions, indicating that activation of DCs by αS was also partially dependent on TRIF (Figure S7). This suggests that αS uses a receptor that activates both MyD88 and TRIF pathways. Since GM-CSF-containing mouse bone-marrow cultures contain both DCs and macrophages (Helft et al., 2015), we gated on both DCs (CD11c+CD115−MHC IIhigh) and macrophages (CD11c+CD115+MHC IIintermediate), and the results showed that both DCs and macrophages were activated by αS (Figure S8). Many toll-like receptor (TLR) ligands and IL-1 family members activate DCs and macrophages in a MyD88-dependent manner (Akira and Takeda, 2004). We therefore investigated whether monomeric αS uses any of the TLRs as its receptor and confirmed that αS monomer completely failed to stimulate the expression of costimulatory molecules (CD80, CD86, F4/80) and the production of TNF-α by DCs or macrophages from TLR4−/− mice. Consequently, αS induces APCs activation in a TLR4-dependent manner (Figures 5C, 5D, S6C, and S6D).
Figure 5. Effect of deletion of MyD88 and TLR4 on response of mouse APCs to αS.
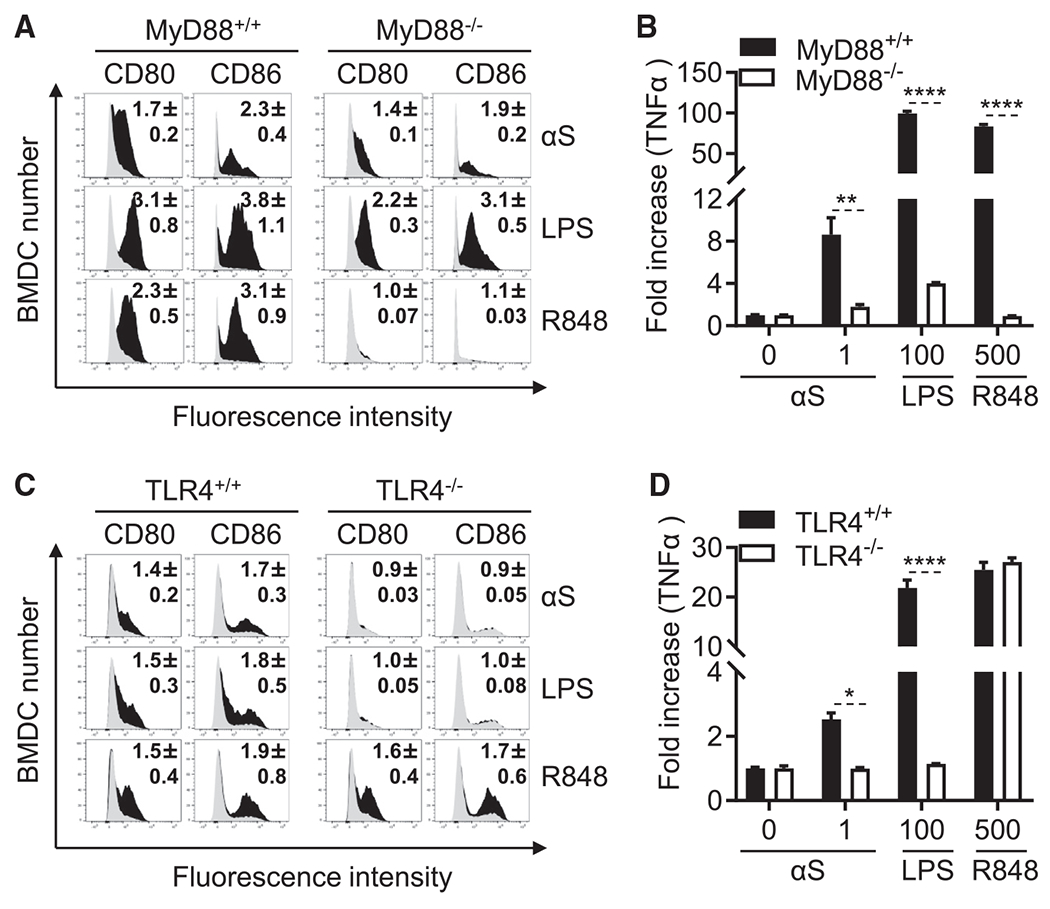
(A and C) Mouse BMDCs from MyD88+/+, MyD88−/−, TLR4+/+, and TLR4−/− mice were treated without or with recombinant αS (μM), LPS (ng/mL), or R848 (ng/mL) for 24 h before they were immuno-stained and analyzed by flow cytometry for expression of the indicated surface molecules (gray area = sham-treated; number inside the histograms is the average [mean ± SD] fold increase in terms of relative fluorescent intensity of three experiments).
(B and D) Cytokine levels in the culture supernatants of (A) and (C) were quantitated and shown as mean ± SD. One representative experiment of three is shown.
*p < 0.05, **p < 0.01, and ****p < 0.0001 by t test. See also Figures S4–S8.
Monomeric αS used in this study was generated in E. coli. To ascertain whether it was free of endotoxin contamination, we boiled αS for 30 min or treated it with proteinase K (Prt K, 0.1 mg/mL) at 37°C for 1 h to determine the effect of heat and enzymatic digestion of αS preparation before addition to BMDCs and BMDMs. αS induction of the upregulation of APC (BMDC and BMDM) surface markers and production of pro-inflammatory cytokines were inhibited by boiling for 30 min or digestion with proteinase K, whereas both heating and digestion with proteinase K did not affect the effect of LPS (Figures S9A–S9D). These data indicate that the APC-activating effect of αS preparation was not caused by endotoxin contamination and was dependent on triggering TLR4.
Exogenous αS induces peritoneal inflammation and APC recruitment and promotes antigen-specific immune responses
Since αS is chemotactic for phagocytes (Stolzenberg et al., 2017) and has the capacity to activate APCs (Figures 3, 4, and 5), αS has the characteristics of an alarmin (Bianchi, 2007; Oppenheim and Yang, 2005). An alarmin is a constitutively expressed endogenous substance released in response to a threat that initiates an innate immune reaction effectively engaging the adaptive system to mount an appropriate immune defense (Bianchi, 2007; Chan et al., 2012; Matzinger, 2002). To determine whether αS behaved as an alarmin, αS was intraperitoneally injected into C57BL/6 mice, and 4 h later the leukocytes and APCs that had infiltrated into the peritoneal cavity were analyzed by flow cytometry. αS caused a marked intraperitoneal increase in total leukocytes as well as APCs (CD11c+ and CD11b+ cells) (Figure 6A), indicating that αS induced peritoneal inflammation and recruitment of APCs into the peritoneal cavity. Interestingly, in contrast to αS-induced APC activation, αS-induced recruitment of peritoneal cells was not dependent on TLR4 (Figures S10A and S10B).
Figure 6. αS induces DC recruitment and promotes OVA-specific T cell and antibody responses.
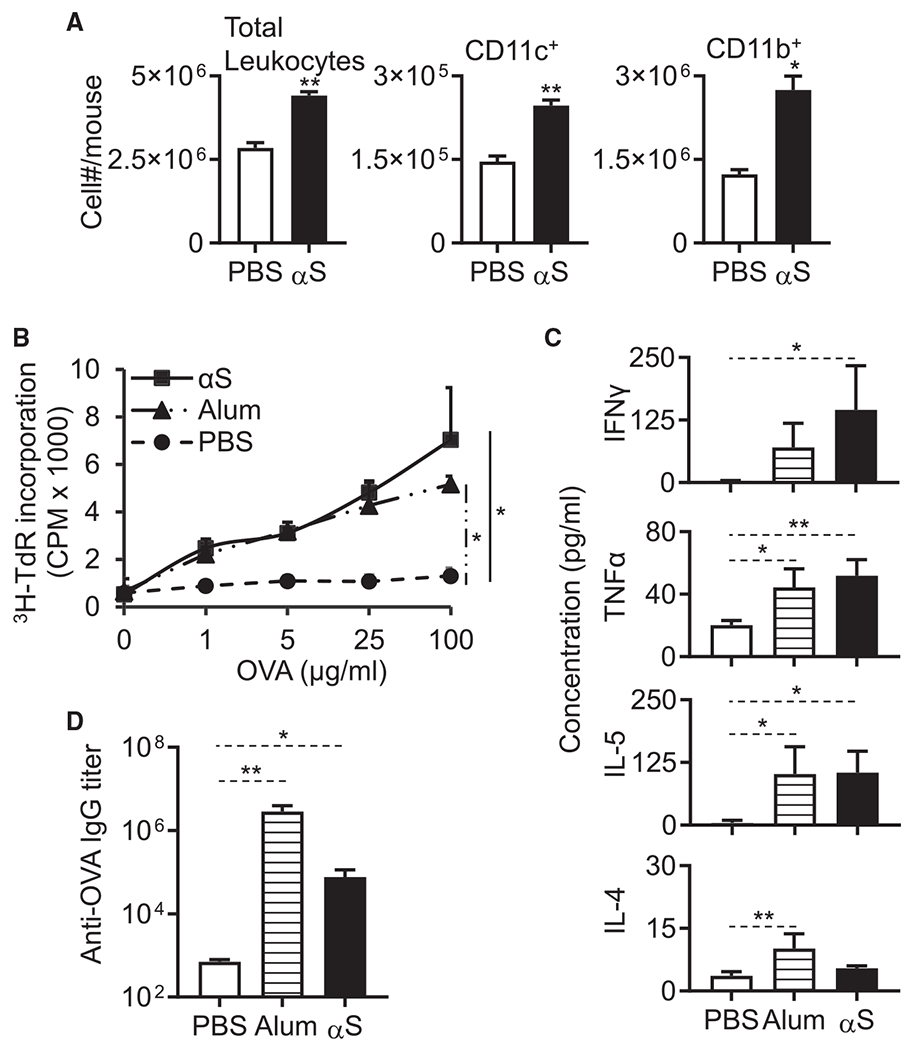
(A) 9-week old female C57BL/6 mice (n = 3) were injected i.p. with PBS or PBS containing monomeric αS (1 nmoles/mouse). After 4 h, leukocytes in the peritoneal cavity were enumerated and graphed as the average (mean ± SD) of two experiments. The indicated sub-populations of APCs (CD11c+ and CD11b+) were determined by flow cytometry. 7-week-old female C57BL/6 mice (n = 3) were immunized i.p. with OVA (100 μg/mouse), OVA (100 μg/mouse) + alum (3 mg/mouse), or OVA (100 μg/mouse) + αS (1 nmoles/mouse) on day 1 and boosted with OVA (100 μg/mouse) on day 14. On day 21, the spleens and sera of immunized mice were harvested for analysis.
(B) Splenocytes were cultured in the presence of specified concentrations of OVA for 4 days. The culture was pulsed with [3H]-TdR for the last 18 h before harvest for measurement of [3H]-TdR incorporation.
(C) Splenocytes were cultured in duplicate in the presence of 100 μg/mL OVA for 3 days, and cytokine levels in the supernatants were quantitated in triplicates. The average (mean ± SD) of two experiments is shown.
(D) Serum IgG specific for OVA was quantitated by anti-OVA ELISA and shown as the average (mean ± SD) of two experiments.
*p < 0.05 and **p < 0.01 between sham (PBS)- and αS-treated group using one-way ANOVA followed by Tukey’s post hoc test (A, C, and D) or repeated-measures of ANOVA (B). See also Figure S9.
We next determined whether exogenous αS could promote antigen-specific immune responses by comparing ovalbumin (OVA)-specific antibody and T cell responses of C57BL/6 mice i.p. immunized with OVA in the absence or presence of αS or alum. One week after a booster dose of OVA, splenocytes of immunized mice were collected to determine OVA-specific proliferation as well as the production of cytokines, while the serum samples were used for the measurement of anti-OVA immunoglobulin G (IgG) titers. The splenocytes from mice immunized with αS and OVA proliferated vigorously in response to OVA as compared to the lack of effect of OVA by itself (Figure 6B). The splenocytes of mice immunized with αS and OVA produced more cytokines such as IFN-γ, TNF-α, IL-4, and IL-5 than splenocytes from mice immunized only with OVA further confirming the enhancement by αS of OVA-specific cellular immune responses of both Th1 and Th2 types (Figure 6C). Immunization with OVA and alum, as expected, also enhanced the OVA-specific antibody and cellular immune responses (Figures 6C and 6D). However, mice immunized with OVA and αS produced significantly more OVA-specific IgG antibodies as compared with mice immunized with OVA alone (Figure 6D). Therefore, exogenous monomeric human αS acts to augment inflammation, DC recruitment, and antigen-specific humoral and cellular immune responses.
Endogenous αS is essential for the generation of antigen-specific immune response
We next asked whether αS is essential for the generation of an antigen-specific immune response. To test this hypothesis, we immunized αS−/− and littermate-matched αS+/+ mice by i.p. administration with OVA using PGN or TG as the adjuvant to compare their immune responses. The splenocytes of immunized αS−/− mice proliferated considerably less well than splenocytes of similarly immunized αS+/+ mice when stimulated with OVA ex vivo (Figure 7A). When the splenocytes of immunized mice were stimulated with OVA ex vivo, the production of IFN-γ, TNF-α, and IL-5 production was dramatically compromised by gene deletion of αS, indicating that endogenous αS was critical for OVA-specific immune responses induced by immunization with a combination of OVA and PGN (Figure 7B). Noticeably, there was much higher production of IL-5 than IFN-γ and TNF-α by splenocytes of αS+/+ mice immunized with OVA and PGN, consistent with the notion that PGN promotes a Th2 response by triggering TLR2-dependent events (Matsui and Nishikawa, 2013). The serum anti-OVA titer in immunized αS−/− mice was also considerably lower compared with that in immunized αS+/+ mice (Figure 7C). Therefore, αS is critical for the generation of antigen-specific immune responses upon immunization with OVA and PGN. Similar results were obtained in αS−/− mice when TG was used as adjuvant with OVA in place of PGN (Figures S11A–S11C).
Figure 7. Endogenous αS is essential for the development of OVA-specific immune responses and APC recruitment.
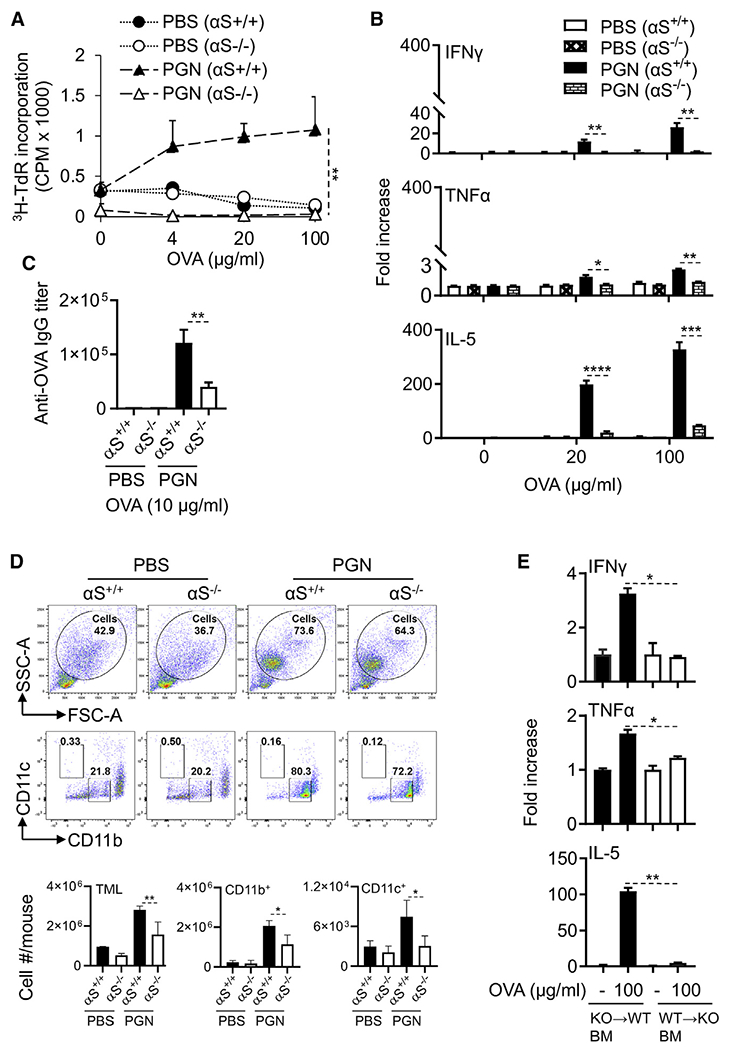
7-week old female αS−/− and littermate-matched αS+/+ mice (n = 3) were immunized i.p. with OVA (100 μg/mouse) in the presence or absence of PGN (100 μg/mouse) on day 1 and boosted with OVA on day 14. On day 21, the spleens and sera of immunized mice were harvested for measurement of OVA-specific immune responses.
(A) Splenocytes were cultured in triplicate in the presence of specified concentrations of OVA for 4 days and pulsed with [3H]-TdR for the last 12 h before harvest for the measurement of [3H]-TdR incorporation. Shown is the average counts per minute (CPM, mean ± SD) of each group. The result of one experiment out of two is shown.
(B) Splenocytes from αS−/− and αS+/+ were cultured in duplicate in the presence indicated concentration of OVA for 2 days, and cytokine levels in the supernatants were quantitated. Shown is the average (mean ± SD) of two experiments.
(C) Sera were measured for OVA-specific IgG by anti-OVA ELISA, and the average (mean ± SD) of two experiments is shown.
(D) αS+/+ and αS−/− male mice (n = 3) were injected i.p. with OVA (100 μg/mouse) with or without PGN (100 μg/mouse). Four hours later, peritoneal lavage was collected to determine the TML (total number of peritoneal myeloid leukocytes as a percentage of total cells) and the CD11b+ or CD11c+ DCs of TML by flow cytometry. Shown is the average (mean ± SD) of two experiments.
(E) Bone-marrow chimeric mice were generated by reconstituting lethally irradiated αS+/+ mice with littermate matched αS−/− bone-marrow mononuclear cells (KO→WT) or vice versa (WT→KO). After 7 weeks, the chimeric αS+/+ and αS−/− mice were immunized with PGN (100 μg/mouse) containing OVA (100 μg/mouse) on day 1 and boosted with OVA (100 μg/mouse) on day 14. On day 21, splenocytes from bone marrow of chimeric mice were cultured in the presence or absence of indicated concentration of OVA for 2 days in vitro, and the cytokines levels in the culture supernatants were measured and shown as the average (mean ± SD) of two experiments.
*p < 0.05 and **p < 0.01 using repeated-measure of ANOVA (A) or one-way ANOVA followed by Tukey’s post hoc test (B–E). See also Figures S10–S12.
The reduction in OVA-specific immune responses of immunized αS−/− mice was unlikely due to intrinsic deficiency in number or function of various subsets of leukocytes, since αS−/− and αS+/+ mice had similar numbers of immune cells in the bone marrow, spleen, lymph nodes, and peripheral blood (Figure S12A). Splenocytes of αS+/+ and αS−/− mice proliferated to the same extent to polyclonal stimulation with Con A (Figure S12B). In addition, R848-activated BMDCs from αS−/− or αS+/+ mice were equally able to present antigen to OT-I cells (Figure S12C). Furthermore, BMDCs from αS−/− or αS+/+ mice expressed similar surface co-stimulatory markers activation (CD80, CD83, CD86) and MHC (I-A/E) as well as proinflammatory cytokine production (IL-12p70, IL-1β, and TNF-α) in response to R848 (Figures S12D and S12E). Therefore, the available immune cells from αS−/− exhibited normal functional capacities and were neither hypernor hyporesponsive. These data suggested that reduced trafficking of immune cells into the peritoneal cavity may account for the immunodeficiency.
Since BMDCs from αS−/− mice showed similar in vitro activation capacities as DCs from αS+/+ mice, we investigated whether immunized αS−/− mice were deficient in APC recruitment. Indeed, intraperitoneal injection of OVA and PGN into αS+/+ mice resulted in the infiltration of CD11c+ and CD11b+ DCs, but this was substantially reduced in αS−/− mice (Figure 7D). The recruitment of DCs into the peritoneal cavity in response to PGN alone was also dramatically reduced by αS knockout (Figure S13). Thus, reduced recruitment of APCs by αS is an important contributor to the impaired induction of antigen-specific immune responses in vivo.
Because αS could be produced by bone-marrow-derived cells and/or neuronal cells, we next explored which of these sources contributed to the induction of antigen-specific immune responses. Bone marrow in αS+/+ and αS−/− mice was ablated by sub-lethal irradiation. The irradiated αS+/+ mice were then transplanted with marrow from αS−/− mice, while the irradiated αS−/− animals received marrow from αS+/+ mice. Mice were immunized with i.p. administration with OVA using PGN as the adjuvant. The splenocytes of immunized irradiated αS+/+ mice that received αS−/− bone marrow cells produced much more IFN-γ, TNF-α, and IL-5 when stimulated in vitro with OVA as compared with the same number of splenocytes from irradiated αS−/− mice that received αS+/+ marrow (Figure 7E). Thus, the presence of wild-type bone marrow failed to restore the immune response of the αS−/− animals, and bone marrow from αS−/− mice did not impair the immune response of the αS+/+ marrow recipient. We conclude that non-myeloid tissues are the source of αS within the peritoneal cavity to support the generation of antigen-specific immune responses.
DISCUSSION
This study provides further evidence that αS, the protein intimately linked with the pathogenesis of PD, is a critical component of the mammalian immune system. One of the important findings in this study is that αS appears to be necessary for the development of an innate inflammatory response in the peritoneal cavity. Intraperitoneal administration of exogenous αS promoted leukocyte recruitment into the peritoneal cavity. αS induced the expression of the pro-inflammatory cytokines TNF-α and IL-12p70 by DCs and macrophages. Furthermore, αS appeared in the peritoneal cavity in response to intraperitoneal injection of PGN or TG, two substances recognized to induce peritoneal inflammation. Remarkably, endogenous αS is critical for the manifestation of peritonitis induced by PGN or TG, since knockout of αS markedly compromised the peritoneal inflammation as evidenced by reduced infiltration of leukocytes (e.g., PMN, Mφ, etc.) and reduced production of proinflammatory cytokines (e.g., TNF-α, IL-1β) in the mouse peritoneal cavity of αS−/− mice. Our data strongly support the conclusion that αS contributes to the manifestation of inflammation in the peritoneal cavity in this experimental model.
We have shown previously that monomeric αS activates human DCs and is chemotactic for both human monocytes/neutrophils and mouse neutrophils (Stolzenberg et al., 2017). The data presented here show that this activation is exclusively mediated by TLR4, consistent with the report that exogenous αS induces TLR4-dependent inflammatory activation of astrocytes (Rannikko et al., 2015).
αS also appears to be critical for the induction of antigen-specific immune responses upon intraperitoneal immunization. This conclusion is based on both gain-of-function and loss-of-function experimental results. On the one hand, intraperitoneal immunization of mice with OVA in the presence of exogenous αS protein significantly promoted the generation of OVA-specific antibody and cell-mediated immune responses. On the other hand, the OVA-specific antibody and T cell responses induced by intraperitoneal immunization with OVA in the presence of PGN or TG were markedly compromised in αS−/− mice when compared to αS+/+ mice. The underlying mechanism by which αS promotes antigen-specific immune responses is likely based on the capacity of αS to stimulate the maturation and activation of DCs, since DC maturation/activation is pivotal for the generation of antigen-specific immune responses (Eisenbarth, 2019; Yang et al., 2017). Indeed, intraperitoneal injection of PGN alone with OVA resulted in greater mobilization of CD11c+ and CD11b+ DCs in the peritoneal cavity of αS+/+ mice than in littermate-matched αS−/− mice. We demonstrated that the spleens of αS−/− and αS+/+ mice used in our studies had comparable levels of B cells and CD4 and CD8 T cells dismissing the possibility that the spleens of αS−/− mice might not be competent to support a robust B and T cell response (Shameli et al., 2016). Taken together, the data paint a scenario in which αS induced by intraperitoneal administration of PGN or TG mobilizes peritoneal innate/inflammatory responses, stimulates DC activation/maturation, resulting in productive antigen-specific antibody and T cell responses. For these reasons, αS can be described as an “alarmin.”
During induction of peritoneal innate/inflammatory responses by PGN or TG, αS was released into the peritoneal cavity, mostly as dimers of αS. Although blood-borne cells such as erythrocytes and certain leukocytes could represent the source (Barbour et al., 2008), immune staining of the colon and diaphragm revealed significant inflammation-dependent expression of αS. Furthermore, αS expression was localized to neural tissues rather than areas rich in infiltrating leukocytes. These observations suggest that the source of αS in the inflamed peritoneal cavity could be of neuronal origin. In support of this conclusion is the demonstration, utilizing bone-marrow chimeras of αS−/− and αS+/+ mice, that non-myeloid cells/tissues contributed significantly to the promotion of antigen-specific immune responses. Since the peritoneum consists of a single layer of mesothelial cells on a bed of loose connective tissue, it would seem reasonable to suggest that αS appearing within the peritoneal cavity comes from neuronal tissues in close contact with the peritoneum. Even in colonic inflammation induced by transfer of CD4 effector T cells into Rag1−/− mice, the production of αS protein was induced, preferentially in areas rich in neuronal tissues. These observations are in agreement with our recent report (Stolzenberg et al., 2017) that αS expression in the enteric nervous system of the gastrointestinal (GI) tract of pediatric patients is positively correlated with the degree of intestinal acute and chronic inflammation triggered by allograft transplantation or norovirus infection. These studies represent the first intriguing example of neuronal cells as a source of an alarmin and thus provide a means by which the nervous system promotes immune defenses.
How does the identification of αS as a critical component of the immune system resolve its role in the pathogenesis of PD? First, it helps explain why αS is induced in the enteric nervous system in settings such as GI infection (Stolzenberg et al., 2017), LPS exposure (Bhattacharyya et al., 2019; Kim et al., 2016), and mucosal barrier damage (Chen et al., 2016a; Sampson et al., 2016, 2020). Second, if these stimuli persist chronically, either due to repeated infection or a failure to effectively contain commensal bacteria, the stimulation of αS would be unremitting. As intracellular concentrations of αS rise, toxic aggregates of αS will form (Barbut et al., 2019; Chen et al., 2016a), the extent dependent on the rate of formation and the rate of intracellular degradation. As proposed by Braak et al. (2002, 2006) aggregates of αS will gradually traffic from the enteric nerves to the brain leading to the subsequent clinical and pathological features of PD. Further, epidemiological data suggest that inflammatory bowel disease increases the risk of developing PD (Brudek, 2019).
In conclusion, we provide compelling in vivo and in vitro evidence that αS acts as an alarmin capable of promoting the enhancement of both innate and adaptive immune responses. Intraperitoneal immunization induces the expression of αS in sub-peritoneal neuronal tissues, including the diaphragm and colon. The secreted αS acts a critical alarmin signal to amplify innate/inflammatory and antigen-specific immune responses. By promoting the generation of inflammatory cytokines, antibody, Th1 and Th17 effector T cells, secreted αS potentially contributes to the orchestration of a functional immune response.
STAR★METHODS
RESOURCE AVAILABILITY
Lead contact
Further information and requests for resources and reagents should be directed to and will be fulfilled by the lead contact, Joost J Oppenheim (oppenhej@mail.nih.gov).
Materials availability
Further information and requests for resources and reagents should be directed to Joost J Oppenheim (oppenhej@mail.nih.gov).
Data and code availability
All data supporting the findings of this study are available within the paper or from the lead contact upon request. This paper does not report original code. Any additional information required to reanalyze the data reported in this paper is available from the lead contact upon request.
EXPERIMENTAL MODEL AND SUBJECT DETAILS
Mice
Female wild-type (WT) C57BL/6 Ncr, C57BL/6 J, TLR4 knock-out (KO) (TLR4−/−), TRIF−/− (Ticam1Lps2), OT I (Rag1tm) and OT II (RagB6) mice (7 to 8 weeks old) were provided by the animal production facility of the national cancer institute (NCI). MyD88−/− (B6.129P2(SJL)-MyD88tm1.1Defr/J), αS−/− (C57BL/6N-Sncatm1Mjff/J), Ly5.1 (B6.SJL-Ptprca Pepcb/BoyJ), and Rag1−/− (B6.129S7-Rag1tm1Mom/J) mice were purchased from the Jackson Laboratory. All experiments with mice were performed in compliance with the principles and procedures outlined in the National Institutes of Health Guide for the Humane Care and Use of Animals and were approved by the National Cancer Institute at Frederick Animal Care and Use Committee.
Primary Immune cells
Human peripheral blood samples were obtained from healthy donors (Transfusion medicine department, Clinical center, NIH, MD, with an approved human subject agreement) by leukopheresis (Alam et al., 2018; Yang et al., 2007). Based on the NIH guideline, the age and gender of the healthy blood donors can not be disclosed.
METHOD DETAILS
Reagents
Isolation and purification of cells
PBMCs were isolated by Ficol-Hypaque density gradient centrifugation (De Yang et al., 2000). Monocytes and CD4+ T/CD8+ T cells were purified (> 95%) from PBMC, spleens or lymph-nodes with the use of MACS cells isolation kits (Miltenyl Biotech) according to the manufacturer instructions. For CD4+CD25−CD45RBhigh T-eff cells sorting, naive CD4+ T cells were first collected from flow through using magnetic beads coated with anti-CD4 Ab biotin antibody cocktail (Cat# 130-104-454). Subsequently, the CD4+ T cells were stained with anti CD25 Ab (BD PharMingen, PE conjugated, clone PC61) to collect the CD4+CD25− T cells from flow through using anti-PE microbeads (Cat#130-048-801) according to the manufacturer’s instructions (Miltenyi Biotech). The resulting fraction was stained with anti-CD4 (BD PharMingen, APC conjugated, clone RM4-5), and anti-CD45RB (BioLegned, PB conjugated, clone C363-16A), Abs and sorted (BD FACSAria II SORP) into naive CD4+CD25−CD45RBhigh T-eff cells. Mouse bone marrow-derived hematopoietic progenitor cells (HPCs) were prepared by flushing from femur and tibia with the depletion of red blood cell (RBCs) by ammonium chloride treatment (Inaba et al., 1997).
Generation and stimulation of APCs
Human MoDCs were generated by culturing purified monocytes at 5 × 10⁵/ml in complete RPMI 1640 medium (RPMI 1640 medium supplemented with 10% FBS], 2 mM glutamine, 25 mM HEPES, 100 U/ml penicillin, 100 μg/ml streptomycin, and 50 μM of 2-mercaptoethanol containing 50 ng/ml hGM-CSF and 50 ng/ml hIL-4 at 37°C in a humidified CO2 (5%) incubator for 5 days with 50% of the culture medium replaced with prewarmed fresh complete RPMI 1640 medium containing hGM-CSF and hIL-4 at the same concentration on 3 days. On 5th day of culture, DCs suspensions were harvested as immature DCs and used for the subsequent experiments. Mouse BMDCs were generated by culturing mouse HPCs isolated from the femurs and tibias in complete RPMI 1640 containing 20 ng/ml mGM-CSF for 6 days. On the 2nd and 4th day of the culture, non-adherent cells were removed by mild pipetting and the remaining adherent cells were cultured in the complete medium containing mGM-CSF at the same concentration as indicated above (Yang et al., 2008). For BMDM generation, HPCs (1 × 10⁶/ml) were cultured for 6 days in complete RPMI 1640 medium in the presence of 50 ng/ml mM-CSF with 50% replacement of the cultured medium on day 3. On the 6th day of the culture, DCs or macrophages were harvested for the treatment with one or more of the following stimulators (e.g., αS, R848 and LPS, etc.) for indicated periods of time at 37°C in a CO2 incubator before being analyzed for phenotype, function and signaling. In some experiments, mouse BMDCs were pulsed with antigen by incubating with 100 μg/ml OVA for 24 h before induction of maturation.
Assessment of APCs phenotype by surface FACS analysis
Treated DCs/macrophages (106/samples) were washed for three times with flow cytometry buffer (PBS, 2% FBS, 0.05% NaN3, pH 7.4) and blocked for 10 min at 4°C in flow cytometry buffer containing 2% human AB serum or 2% normal mouse serum (C57BL/6 mouse). Subsequently, the cells were stained with monoclonal antibodies against human CD80, CD83, CD86, HLA-ABC or mouse CD80, CD83, CD86, I-A/E, CD11c, CD11b, CD206, F4/80, CD115, CD45, CD3e, B220, CD8a, CD4, CD40, and GR-1 with the isotype-matched control antibodies including eFluor 450 Rat IgG2a, PE Hamster IgG2, PerCP/Cy5.5 Rat IgG2a, PE-Cy7 Rat IgG2a, Alexa Fluor647 Rat IgG2a, FITC Rat IgG2b, APC/Cy7 Hamster IgG1 and PE/Cy7 Armenian Hamster IgG at 4°C for 20-30 min. Then, the cells were washed once with flow cytometry buffer and twice with PBS, suspended in PBS and analyzed the expression of surface molecules on LSR II/Sorp flowcytometry (BD FACSCalibur). Data were analyzed by FlowJo software version 10.7.1.
Measurement of cytokines in culture supernatant
Multiple cytokines in the culture supernatants of human and mouse DCs/macrophages were measured using V-PLEX (IL-1β, TNFα, IL-12p70, IL-4, or TNFα) and U-PLEX(IFNγ, IL-5, IL-13, or IL17A) ultrasensitive plate assays (Meso Scale Discovery, MSD). The plates were analyzed using a sector image 2400 (Meso Scale Discovery) according to the manufactures protocol. The data comparing the means of the treated samples to those of untreated control were analyzed by GraphPad Prism (Version 8.4.3).
Allogenic mixed lymphocyte reaction (MLR)
MLR was performed as described (Yang et al., 2007). Briefly, human MoDCs (4 × 10⁶/8ml/well) were plated in 6 wells flat bottomed plates and treated with αS (0 to 1 μM) in a complete media containing hGM-CSF (50 ng/ml) and hIL-4 (50 ng/ml) for 24 h at 37°C in a humidified air with a 5% CO2. The treated DCs were co-cultured with purified allogenic CD4+ T (105/well) cells at 1:30, 1:90, 1:270, 1:810, 1:2430, 1:7290, 1:21870 ratio in a complete medium (0.2 ml/well) in a triplicate in 96 well flat plate for 4 d at 37°C. After 4 d of co-culture, the cells were pulsed with 1 μCi/well [3H]-TdR, for an additional 12 h before harvesting. 3H-TdR incorporation was measured with microbeta counter for the proliferative response of allogenic CD4+ T cells. Human MoDCs cultured in the presence or absence of αS (0 to 1 μM) for 24 h and were incubated in triplicate with allogenic human peripheral blood CD4+ T cells (106/well) in 0.4 mL of medium in 48-well flat-bottomed plates at 1:50 DCs/CD4+ T cell ratios for 3 d. The supernatant cytokine levels were measured by cytokine arrays. Four days cultured mouse BMDCs (6x 10⁶/6ml/well) were incubated with OVA (100 μg/ml) for an additional 24 h and subsequently cultured with αS (0 to 1 μM) for 24 h more. The cells were washed, γ-irradiated (3000 rad), and co-cultured in 96-well plates with naive syngeneic OT-I or OT-II lymphocytes (105/well) at a BMDCs:CD4+ T cells at 1:30 and/or 1:10 for 2 or 4 d at 37°C. The cultures were pulsed with 1 μCi/well [3H]-TdR for another 12 or 18 h. The proliferation was measured as the average CPM (mean ± SD) of [3H]-TdR incorporation by triplicate wells. These OVA and αS stimulated murine BMDCs were cultured with the OT-II lymphocytes (106/well) at a BMDCs:CD4+ T cells ratio 1:50 for 2 d before assaying the indicated cytokine content of the supernatant.
Protein purification and concentration
C57BL/6 (8-10 weeks, female and male, 3 mice/group) were immunized i.p. with PBS, or peptidoglycan (PGN, 100 μg/mouse) or thioglycolate (TG 3%, 1ml/mouse) for 24 h. Peritoneal lavage were collected using 4 mL cold PBS. The total secreted lavage protein was purified and concentrated to a final volume 40 μl using amicon ultra-4 centrifugal filter as per manufacturer instruction.
SDS-PAGE and western blot analysis
SDS-PAGE and western blot analysis were performed as described previously (Alam et al., 2018). Briefly, human MoDCs starved in serum free medium containing 50 ng/ml hGM-CSF and 50 ng/ml hIL-4 at 37°C in a humidified CO2 (5%) incubator for 6 h were incubated with αS protein for a period as specified. The treated and untreated cells were lysed in SDS whole cell lysis buffer composed of 62.5 mM Tris-HCl, pH 6.8 at 25°C, 2% wt/vol SDS, 40 mM dithiothreitol at 107/ml for 30 min at room temperature. NuPAGE LDS sample buffer was added to these protein lysates. The samples were boiled for 5 min, cooled on ice, loaded (15 μl/lane for whole cell lysates and sepa-rated on a 4%–12% NuPAGE Bis-Tris Gel using 1x NuPAGE MOPS SDS running buffer as the electrode buffer. SeeBlue Plus2 were used as molecular size marker. After transfer of separated proteins onto polyvinylidene difluoride (PVDF) membranes using 1x NuPAGE transfer buffer containing 20% methanol (v/v), the membrane were rinsed with trisbuffered saline containing 0.05% tween 20 (TBST), blocked with blocking buffer (1x TBST containing 5% nonfat milk) at room temperature for 1 h and incubated overnight at 4°C with an-tibodies (1:1000 diluted in blocking buffer) against phospho-p65 (S3033), αS (2642S), or αS (ab212184) as the first antibody. After washing with TBST, the membranes were reacted with horseradish peroxidase (HRP)-conjugated goat anti-rabbit IgG (7074S) as the secondary antibody (1:2000 diluted in blocking buffer), washed and developed in the SuperSignal West Dura Extended Duration Substrate. The images were collected using the G BOX Chemi systems. Subsequently, the same membrane was stripped by blot strip-ping buffer and probed consecutively in the same manner using I-κ-Bα (44D4), and GAPDH (14C10) as the first antibodies.
RNA extraction, cDNA synthesis and Real-Time (RT)-PCR
Total RNA from the treated and control DCs was isolated using TRIzol reagent according to manufacturer’s instructions. The RNA was purified using RNeasy Micro Kit with an on-column DNase digestion to eliminate possible genomic DNA contamination. Purified RNA (500 ng) was reverse transcribed to cDNA with QuantiTect Reverse Transcription kit. Twenty nanograms of cDNA was used for qRT-PCRs. qRT-PCRs were performed with a RT2 DNA SYBR green ROX kit on LightCyclerR480 II RT-PCR (Roche) system to measure the expression of human and mouse cytokines using specific primers obtained from QIAGEN (key resources table). ΔCt values were obtained by deducting the raw cycle threshold (Ct values) obtained from β-Actin mRNA, the internal standard, from the Ct values obtained for investigated genes. For graphical representation, data are expressed as fold mRNA level increase compared to the expression level in unstimulated cells using GraphPad Prism (Version 8.4.3) (Alam et al., 2018).
KEY RESOURCES TABLE
| Reagent or resource | Source | Identifier |
|---|---|---|
| Antibodies | ||
| Anti-human CD80 Ab, APC (clone 2D10) | BioLegend | Cat# 305219 |
| Anti-human HLA-ABC Ab, PE/Cy7 (clone W6/32) | BioLegend | Cat# 311430 |
| Anti-human CD86 Ab, FITC (clone 2331) | BD PharMingen | Cat# 555657 |
| Anti-human CD83 Ab, PE (clone HB15E) | BD PharMingen | Cat# 556855 |
| Human CD14 Microbeads | Miltenyi Biotech | Cat# 130-050-201 |
| Human CD4 Microbeads | Miltenyi Biotech | Cat# 130-045-101 |
| Anti-mouse CD80 Ab, PE (clone 16-10A1) | BD PharMingen | Cat# 561955 |
| Anti-mouse CD80 Ab, PE (clone 16-10A1) | BD PharMingen | Cat# 553769 |
| Anti-mouse CD80 Ab, APC (clone 16-10A1) | BD PharMingen | Cat# 560016 |
| Anti-mouse CD83 Ab, PE (clone Michel- 19) | BD PharMingen | Cat# 552805 |
| Anti-mouse CD86 Ab, FITC (clone GL1) | BD PharMingen | Cat# 561962 |
| Anti-mouse CD11b Ab, FITC (clone M1/70) | BD PharMingen | Cat# 557396 |
| Anti-mouse CD11b, PE (clone | BD PharMingen | Cat# 553311 |
| Anti-mouse CD11c Ab, APC/cy7 (clone HL3) | BD PharMingen | Cat# 561241 |
| Anti-mouse CD206 Ab, Alexa Fluor® 647 (clone MR5D3) | BD PharMingen | Cat# 565250 |
| Anti-mouse CD25 Ab, PE (RM4-5) | BD PharMingen | Cat# 560989 |
| Anti-mouse CD4, APC (clone RM4-5) | BD PharMingen | Cat# 561091 |
| Anti-mouse CD4 Ab, PE/Cy7 (clone RM4-5) | BD PharMingen | Cat# 552775 |
| Anti-mouse B220 Ab, PerCP/Cy5.5 (clone RA3-6B2) | BD PharMingen | Cat# 552771 |
| Anti-mouse PE Hamster IgG2 (clone B81-3) | BD PharMingen | Cat# 550085 |
| Anti-mouse FITC Rat IgG2b (clone A95-1) | BD PharMingen | Cat# 553988 |
| Anti-mouse APC/Cy7 Hamster IgG1 (clone G235-2356) | BD PharMingen | Cat# 561206 |
| Anti-mouse Alexa Fluor® 647 Rat IgG2a (clone R35-95) | BD PharMingen | Cat# 557690 |
| Anti-mouse CD80 Ab, PB (clone 16-10A1) | BioLegend | Cat# 104723 |
| Anti-mouse CD86 Ab, PerCP/Cy5.5 (clone GL-1) | BioLegend | Cat# 105028 |
| Anti-mouse CD11c Ab, PE/Cy7 (clone N418) |
BioLegend | Cat# 117318 |
| Anti-mouse CD11c Ab, PE/Cy5 (clone N418) |
BioLegend | Cat# 117316 |
| Anti-mouse CD115 (CSF-1R) Ab, APC/Cy7 Ab (clone AFS98) | BioLegend | Cat# 135532 |
| Anti-mouse CD45RB Ab, PB (clone C363-16A) | BioLegend | Cat# 103315 |
| Anti-mouse I-A\E Ab, PB (clone M5/114.15.2) | BioLegend | Cat# 107619 |
| Anti-mouse CD40 Ab, PE (clone 3/23) | BioLegend | Cat# 124609 |
| Anti-mouse GR-1, APC (clone RB6-8C5) | BioLegend | Cat# 108412 |
| Anti-mouse GR-1 Ab, PerCP (clone RB6-8C5) | BioLegend | Cat# 108426 |
| Anti-mouse PerCP/Cy5.5 Rat IgG2a (clone RTK2758) | BioLegend | Cat# 400531 |
| Anti-mouse F4/80 Ab, eFluor 450 (clone BM8) |
Invitrogen | Cat# 48-4801-82 |
| Anti-mouse CD45 Ab, PE/Cy5.5 (30-F11) | Invitrogen | Cat# 35-0451-82 |
| Anti-mouse F4/80 Ab, FITC (clone BM8) | Invitrogen | Cat# 11-4801-82 |
| Anti-mouse eFluor 450 Rat IgG2a (clone eBR2a) | Invitrogen | Cat# 48-4321-82 |
| Anti-mouse CD45, PB (clone 30-F11) | Thermo Fisher Scientific | Ca# MCD4528 |
| Anti-mouse CD3e Ab, FITC (clone 17A2) | Tonbo Biosciences | Cat# 35-0032-U100 |
| Anti-mouse CD8a Ab, APC/Cy7 (clone 53-6.7) | Tonbo Biosciences | Cat# 25-0081-U100 |
| Anti-mouse CD11b Ab, APC (clone M1/70) | eBioscience | Cat# 17-0112-82 |
| Anti-mouse F4/80 Ab, PE (clone BM8) | eBioscience | Cat# 12-4801-82 |
| Anti-mouse CD11c, PE (clone N418) | eBioscience | Cat# 12-0114-83 |
| Anti-mouse CD4+ Biotin-Ab cocktail | Miltenyi Biotech | Cat# 130-104-454 |
| Anti-mouse PE microbeads | Miltenyi Biotech | Cat# 130-048-801 |
| Mouse CD4 Microbeads | Miltenyl Biotech | Cat# 130-116-475 |
| Mouse CD8 Microbeads | Miltenyl Biotech | Cat# 130-116-478 |
| phospho-p65 (S536) | Cell Signaling Technology | Cat# 3033S |
| αS | Cell Signaling Technology | Cat# 2642S |
| αS | Abcam | Cat# ab212184 |
| HRP-conjugated goat anti-rabbit IgG | Cell Signaling Technology | Cat# 7074S |
| I-κ-Bα (44D4) | Cell Signaling Technology | Cat# 4812S |
| GAPDH (14C10) | Cell Signaling Technology | Cat# 2118S |
| OVA specific total IgG Ab (anti-mouse IgG HRP) | GE healthcare UK limited | Cat# NA931V |
| PGP9.5 | Abcam | Cat# ab108986 |
| αS | (ACD: Mm-Scna-C1) | Cat# 313288 |
| Biological samples | ||
| LPS | Sigma Aldrich | Cat# L9764-5MG |
| Con A | Sigma Aldrich | Cat# C0412 |
| PGN | Sigma Aldrich | Cat# 77140 |
| TG | Sigma Aldrich | Cat# T0632 |
| Alum | Sigma Aldrich | Cat# 018K0761 |
| 2-mercaptoethanol | Sigma Aldrich | Cat# M3148 |
| Human AB serum | Sigma Aldrich | Cat# H4522 |
| Proteinase K | Roche | Cat# 03115879001 |
| Ficol-Paque Plus | Cytiva | Cat# 17144003 |
| FBS | R&D Systems | Cat# S12450H |
| L-Glutamine | Lonza | Cat# 17-605F |
| HEPES | Quality Biological | Cat# 118-089-721 |
| Penicillin/Steptomycin | Lonza | Cat# 17-602E |
| NaN3 | ThermoFisher Scientific | Cat# FL-01-0584 |
| [3H]-TdR | PerkinElmer | Cat# NET027005MC |
| Chemicals, peptides, and recombinant proteins | ||
| Human GM-CSF | PeproTech | Cat# 300-03 |
| Human IL-4 | PeproTech | Cat# 200-04 |
| Mouse GM-CSF | PeproTech | Cat# 315-03 |
| Mouse M-CSF | PeproTech | Cat# 315-02 |
| Mouse IL-4 | PeproTech | Cat# 214-14 |
| Mouse IFN-γ | PeproTech | Cat# 315-05 |
| OVA | Profos | Cat# 321002 |
| αS Lot No: 20162050 and 20162189 | Proteos Inc via the Michael J. Fox Foundation |
Cat# RP003 |
| HMGN1 | R&D Systems | Cat# 8187-HM-050 |
| MDP | InvivoGen | Cat# trl-mdp |
| LTA | Sigma Aldrich | Cat# L3265 |
| Pam3CSK4 | InvivoGen | Cat# tlrl-pms |
| FSL-1 | InvivoGen | Cat# tlrl-fsl |
| R848 | InvivoGen | Cat# tlrl-r848 |
| R837 | InvivoGen | Cat# tlrl-imq |
| CpGODN2395 | InvivoGen | Cat# tlrl-2395 |
| NuPAGE LDS sample buffer | Invitrogen | Cat# NP0007 |
| 4-12% NuPAGE Bis-Tris Gel | Invitrogen | Cat# NP0312BOX |
| SeeBlue Plus2 | Invitrogen | Cat# LC5925 |
| 1x NuPAGE transfer buffer | Invitrogen | Cat# NP00061 |
| TRIzol reagent | Invitrogen | Cat# 15596018 |
| Prolong Gold anti-fade reagent | Invitrogen | Cat# P36930 |
| Ammonium-chloride-potassium solution (ACK Lysing Buffer) | Quality Biological | Cat# 118-156-101 |
| Tris-HCl, pH 6.8 | Quality biological | Cat# 351-050-100 |
| SDS | Quality biological | Cat# 351-032-101 |
| Tris-buffered saline | Quality biological | Cat# 351-086-101 |
| Dithiothreitol | Sigma Aldrich | Cat# D-5545 |
| Tween 20 | Sigma aldrich | Cat# P-1379 |
| 1x NuPAGE MOPS SDS running buffer | Novex | Cat# NP0001 |
| Polyvinylidene difluoride (PVDF) membranes | Immobilon, Millipore | Cat# IPV00010 |
| Methanol | OmniSolv, Millipore | Cat# MX0488-1 |
| Nonfat milk | BIO-RAD | Cat# 1706404 |
| SuperSignal West Dura Extended Duration Substrate | ThermoFisher Scientific | Cat# 34076 |
| Stripping buffer | ThermoFisher Scientific | Cat# 46430 |
| RNeasy Micro Kit | QIAGEN | Cat# 74136 |
| QuantiTect Reverse Transcription kit | QIAGEN | Cat# 330404 |
| RT2 DNA SYBR green ROX kit | QIAGEN | Cat# 330523 |
| 10% formalin | Epredia | Cat# 5725 |
| RNAscope® LS multiplex Fluorescent Reagent Kit |
ACD | Cat# 322800 |
| RNAscope 2.5 LS Protease III | ACD | Cat# 322102 |
| OPAL Fluorophore 520 | AKOYA | Cat# FP1487001KT |
| Cyanine 3 | AKOYA | Cat# NEL744001KT |
| OPAL Fluorophore 690 | AKOYA | Cat# FP1497001KT |
| Bond Polymer Refine Kit | LeicaBiosystems | Cat# DS9800 |
| Macrophage/Microglia/Iba1 | Biocare | Cat# CP290 |
| Critical commercial assays | ||
| V-plex for human cytokines IL-12p70, IL-1β and TNFα | Meso Scale Discovery | Cat# K151A0H-2 |
| V-plex for mouse cytokines IL-12p70, IL-1β and TNFα | Meso Scale Discovery | Cat# K152A0H-2 |
| U-plexfor human cytokines IFNγ, IL-5, IL-13 and IL-17A | Meso Scale Discovery | Cat# K1567L-1 |
| V-plex for mouse cytokines IFNγ, IL-4, IL-5 and TNFα | Meso Scale Discovery | Cat# K152A0H-2 |
| Experimental models: Organisms/strains | ||
| C57BL/6 Ncr | Charles River Labs | Strain Code: 01C55 |
| C57BL/6 J | Jackson Laboratories | Strain Code: 01C54 |
| TLR4−/− | Dr Sher (Akira) | Strain Code: 01TTQ |
| TRIF−/− | Jackson Labs | Strain Code: 01CS8 |
| OT I | Jackson Labs | Strain Code: 01CWL |
| OT II | Dr. Andy Hurwitz | Strain Code: 01O51 |
| MyD88−/− | Jackson Laboratories | Stock No: 009088 |
| αS−/− | Jackson Laboratories | Stock No: 016123 |
| Ly5.1 | Jackson Laboratories | Stock No: 002014 |
| Rag−/− | Jackson Laboratories | Stock No: 002216 |
| Oligonucleotides | ||
| Human SNCA | PPH05943G-200 | NM_000345 |
| Human IL-1β | PPH00171C-200 | NM_000576 |
| Human IL12p40 | PPH00545A-200 | NM_002187 |
| Human TNFα | PPH00341F-200 | NM_000594 |
| Human β-actin | PPH00073G-200 | NM_001101 |
| Mouse IL12p40 | PPM03020E-200 | NM_001303244 |
| Mouse TNFα | PPM03113G-200 | NM_013693 |
| Mouse ARG1 | PPM31770C-200 | NM_007482 |
| Mouse NOS2 | PPM02928B-200 | NM_001313921 |
| Mouse β-actin | PPM02945B-200 | NM_007393 |
| Software and algorithms | ||
| FlowJo version 10.7.1 | Becton, Dickinson and Company Ashland. FlowJo was acquired by BD in 2017 | https://www.flowjo.com/solutions/flowjo/downloads |
| GraphPad Prism version 8.4.3. | GraphPad | https://www.graphpad.com/scientific-software/prism/ |
| LSR II Flow Cytometer (488nm/ 405nm/ 640nm lasers) | BD | https://www.bdbiosciences.com/en-au/products/instruments/flow-cytometers/research-cell-analyzers/lsr-ii-discontinuation |
| LSRII SORP Flow Cytometer | BD | N/A |
| FACSymphony A5 Flow Cytometer (488nm/ 355nm/ 405nm/ 561nm/ 640nm lasers) | BD | https://www.bdbiosciences.com/content/dam/bdb/marketing-documents/BD-FACSymphony-Brochure.pdf; |
| FACSAria II-SORP Cell Sorter (488nm/ 355nm/ 405nm/ 561nm/ 640nm lasers) | BD | https://www.bdbiosciences.com/content/dam/bdb/marketing-documents/BD_FACSAria_III_tech_specs.pdf; |
| Instrument control and Quality Assurance Software | BD | https://www.bdbiosciences.com/en-us/products/software/instrument-software/bd-facsdiva-software#Overview |
| Light microscope | Olympus | https://www.olympus-lifescience.com/en/microscopes/upright/bx46/ |
| Leica Biosystems Bond Autostainer | Leica Biosystems | https://www.leicabiosystems.com/ihc-ish-fish/fully-automated-ihc-ish-instruments/bond-rx/#features |
| Aperio AT2 scanner | Leica Biosystems | https://www.leicabiosystems.com/digital-pathology/scan/aperio-at2/ |
| Aperio Technologies Image Scope software | Indica Labs, Corrales | https://www.leicabiosystems.com/digital-pathology/manage/aperio-imagescope/ |
| Aperio Scanscope FL whole slide scanner | Aperio | https://www.lri.se/pdf/aperio/LRI_ScanScope_FL.pdf |
| LeicaBiosystems Bond RX autostainer | Leica Biosystems | https://www.leicabiosystems.com/ihc-ish-fish/fully-automated-ihc-ish-instruments/bond-rx/#features |
| MicroBeta LimitJET | PerkinElmer | https://www.perkinelmer.com/onesource |
| Amicon ultra-4 centrifugal filters | Merck Millipore Ltd | Cat# UFC800324 |
| G: BOX Chemi systems | Syngene | Cat# Gbox iChemi XR |
| LightCyclerR480 II | Roche | Cat# 5125-00-1113 |
In vivo recruitment analysis
WT C57BL/6, αS−/− or αS+/+ (7-9-week-old) mice were injected i.p. with exogenous human monomeric αS (1 nmoles/mouse), OVA (100 μg/mouse), PGN (100 μg/mouse) with OVA (100 μg/mouse). After 4 h, total leukocytes or TML were enumerated with a hemocytometer and the CD11c+ and CD11b+ cell fractions were calculated as the number of cells per mouse peritoneal cavity.
Immunization and detection of antigen specific immune responses
C57BL/6, αS−/− and αS+/+ (8-10 weeks, female 3 mice/group) were immunized i.p. with PBS, antigen OVA (100 μg/mouse) or in the presence of alum (3 mg/mouse), αS (1 nmoles/mouse), PGN (100 μg/mouse) or TG (3%, 1ml/mouse) on day 1 and i.p. booster of OVA (100 μg/mouse) on day 14. Serum samples were taken on day 20 for the measurement of antibody responses. On day 21, immunized mice were euthanized to remove spleens for the measurement of antigen specific cells proliferation and cytokine production. OVA specific total IgG antibody was measured by ELISA as previously described (Yang et al., 2012). OVA-specific splenocyte proliferation was measured by incubating splenocyte (5 × 10⁵/ well) in triplicate in 96- wells plates in complete RPMI 1640 medium (0.2 ml/well) in the presence or absence of the indicted concentration of OVA at 37°C in a CO2 incubator for time specified. The cultures were pulsed with 1 μCi/well [3H]-TdR for another 18 or 12 h. The proliferation was measured as the mean CPM (±SD) of [3H]-TdR incorporation by triplicate wells. For measuring OVA-specific cytokine production, splenocytes were cultured in complete RPMI 1640 in 48-well plates (2.5 × 10⁶/0.5ml/well) with the indicted concentration of OVA for time specified. Cytokines produced by splenocytes in the culture supernatants were quantitated by cytokine array.
Peritonitis and T cell transfer model of colitis
C57BL/6 WT, αS−/− and αS+/+ female mice were i.p. injected with PGN (100 μg/mouse) for 4 and 24 h respectively to induce peritonitis in the mice (Yang et al., 2012). Control C57BL/6 mice were received only PBS. For T cell transfer model of colitis, naive CD4+CD25−CD45RBhigh T-eff cells were isolated, flow sorted from C57BL/6 congenic Ly5.1 B6 (CD45.1+) mice (Chen et al., 2016b). The cells were Injected i.p. into Rag1−/− (CD45.2+) C57BL/6 immunodeficient recipients (4 × 10⁵ cells/mouse). Control Rag1−/− or C57BL/6 mice were received only PBS. Mice were monitored weekly for clinical symptoms of colitis such as rectal bleeding, loose feces/diarrhea, rough/hunched posture and loss of body weight by animal facility staff.
Histology examination, Immunohistochemical staining and RNAscope Fluorescent Assay
Rag1−/− recipients for 8 weeks with adoptive transfer of naive CD4+CD25−CD45RBhigh T-eff cells, Rag1−/− control, C57BL/6 control as well as PGN I.p. Injected C57BL/6 mice for 24 h were euthanized for histopathological examination. Intestinal tissue rolls were collected, fixed In buffered 10% formalin, embedded In paraffin, sectioned at five-micron thickness, and stained with H&E to assess morphological alterations and cellular infiltration for light microscopic evaluation. The intestinal tissue sections were evaluated In a blinded fashion at Pathology/HIstotechnology Laboratory, Laboratory Animal Sciences Program, NCI-Frederick. IHC was performed on paraffin-embedded tissues using primary antibodies for αS (ab212184) on the Leica Biosystems Bond Autostainer. IHC-stained intestinal tissue slides were blinded and scanned using Aperio AT2 scanner. The intestinal tissues were annotated and analyzed using Positive-Pixel-Count Algorithm of the Aperio Technologies Image Scope software. RNAscope fluorescent assay was performed on the LeicaBiosystems Bond RX autostainer using the sequential DS staining mode. The tissue sections were pretreated by baking at 60°C for 60 min and deparaffinization followed by HIER with bond epitope retrieval solution ER2 (15 min at 95°C). Sections were first stained with primary antibody PGP9.5 (ab108986, diluted 1:250) and RNAscope® LS multiplex fluorescent reagent Kit (ACD, 322800) using the RNA Protein co-detection assay method, which consists of a 30 min. Primary antibody incubation followed by a post-fixation with 10% NBF, protease III (ACD) digestion for 15 min at 40°C, and RNAScope ISH with a probe targeting mouse αS (ACD: Mm-Scna-C1, 313288) with a 1:750 dilution of TSA Plus Cyanine 3 (NEL744001KT). Second part of the sequential DS consisted of the PGP9.5 antibody detection using the bond polymer refine kit (DS9800) with a 1:150 dilution of OPAL Fluorophore 520 (FP1487001KT), antibody stripping with bond epitope retrieval solution ER2 (20 min at 95°C), and then a final 30 min incubation with a primary antibody specific for Macrophage/Microglia/Iba1 (CP290, diluted 1:250). The Iba1 antibody detection was also performed using bond polymer refine kit but with a 1:150 dilution of OPAL Fluorophore 690 (FP1497001KT). Slides were coverslipped with prolong gold anti-fade reagent (P36930) and Imaged at 20X magnification using an Aperio Scanscope FL whole slide scanner.
Bone marrow chimeric mice generation
10~11 weeks old αS+/+ and αS−/− mice were put In a sterile environment providing amoxicillin antibiotic In drinking water for one day before whole mice sublethal irradiation (Sub-lethal~1000 rad). The irradiated mice later put In a sterile environment providing amoxicillin antibiotic In drinking water and waited for 6 hr. Then the lethally irradiated αS+/+ mice were reconstituted with the Intravenous injection of bone marrow mononuclear cells (5 x10⁶ / 200 μl PBS/ mouse) Isolated from the sex and age matched normal αS−/− mice to generate KOBM→WT chimeric mice. For the generation of WTBM→KO chimeric mice, normal αS+/+ mice mononuclear cells were Intravenously Injected Into the sublethal irradiated αS−/− mice. After reconstitution, mice were housed under specific pathogen free conditions with amoxicillin In the drinking water for another 4 d and then housed under specific pathogen free conditions with normal drinking water for seven weeks to allow the development of chimeric mice. These chimeric mice were Injected i.p. with PGN (100 μg/mouse) plus OVA (100 μg/mouse) on day 1 and boosted with OVA (100 μg/mouse) on day 14. On day 21, the spleens of immunized mice were removed and evaluated for OVA-specific cellular Immune responses in vitro.
QUANTIFICATION AND STATISTICAL ANALYSIS
The statistical significance between groups were analyzed by GraphPad Prison version 8.4.3. Datasets with one variable (treatment) with more than two groups were analyzed by repeated-measure or one-way ANOVA followed by Tukey’s post hoc tests. Datasets with one variable (treatment) and two groups were analyzed by a Student’s t test. Data were log transformed where appropriate before analysis. P values of < 0.05 were considered significant. *p < 0.05, **p < 0.01, ***p < 0.001, ****p < 0.0001. All error bars represent the mean ± the standard deviation of the mean (SD).
Supplementary Material
Highlights.
Peritoneal inflammation triggers αS production by neurons that innervate peritoneum
αS activates APCs by triggering TLR4 and promotes innate and adaptive immune responses
Neuronal αS is required for the induction of peritonitis and immune responses
αS-triggered immune responses may contribute to PD development and/or progression
ACKNOWLEDGMENTS
The authors thank Dr. Daniel W. McVicar (LCIM, CCR, NCI-Frederick, NIH) for critical review of the manuscript. We thank Megan Karwan and Jeffrey Carrell (LCIM Flow Cytometry Core, CCR, NCI-Frederick, NIH) for sorting the T-eff cells, Stephen Lyonga and Yanyu Wang (CSL, CSP, Leidos Biomedical Research, Inc.) for Mesoscale cytokine’s assays, and Debra Tross (CIS, LCIM, CCR, NCI-Frederick, NIH) for administrative support during revision. This project has been funded in part with Federal funds from the Frederick National Lab, National Institutes of Health, under Contract No. HHSN261200800001E. The content of this publication does not necessarily reflect the views or policies of the Department of Health and Human Services, nor does mention of trade names, commercial products, or organizations imply endorsement by the U.S. Government. This research was supported in part by the Intramural Research Program of NIH, Frederick National Lab, and Center for Cancer Research.
Footnotes
SUPPLEMENTAL INFORMATION
Supplemental information can be found online at https://doi.org/10.1016/j.celrep.2021.110090.
DECLARATION OF INTERESTS
The authors declare no competing interests.
REFERENCES
- Akira S, and Takeda K (2004). Toll-like receptor signalling. Nat. Rev. Immunol 4, 499–511. [DOI] [PubMed] [Google Scholar]
- Alam MM, Yang D, Trivett A, Meyer TJ, and Oppenheim JJ (2018). HMGN1 and R848 Synergistically Activate Dendritic Cells Using Multiple Signaling Pathways. Front. Immunol 9, 2982. [DOI] [PMC free article] [PubMed] [Google Scholar]
- Barbour R, Kling K, Anderson JP, Banducci K, Cole T, Diep L, Fox M, Goldstein JM, Soriano F, Seubert P, and Chilcote TJ (2008). Red blood cells are the major source of alpha-synuclein in blood. Neurodegener. Dis 5, 55–59. [DOI] [PubMed] [Google Scholar]
- Barbut D, Stolzenberg E, and Zasloff M (2019). Gastrointestinal Immunity and Alpha-Synuclein. J. Parkinsons Dis 9 (s2), S313–S322. [DOI] [PMC free article] [PubMed] [Google Scholar]
- Bartels T, Choi JG, and Selkoe DJ (2011). α-Synuclein occurs physiologically as a helically folded tetramer that resists aggregation. Nature 477, 107–110. [DOI] [PMC free article] [PubMed] [Google Scholar]
- Beatman EL, Massey A, Shives KD, Burrack KS, Chamanian M, Morrison TE, and Beckham JD (2015). Alpha-Synuclein Expression Restricts RNA Viral Infections in the Brain. J. Virol 90, 2767–2782. [DOI] [PMC free article] [PubMed] [Google Scholar]
- Bhattacharyya D, Mohite GM, Krishnamoorthy J, Gayen N, Mehra S, Navalkar A, Kotler SA, Ratha BN, Ghosh A, Kumar R, et al. (2019). Lipopolysaccharide from Gut Microbiota Modulates α-Synuclein Aggregation and Alters Its Biological Function. ACS Chem. Neurosci 10, 2229–2236. [DOI] [PubMed] [Google Scholar]
- Bianchi ME (2007). DAMPs, PAMPs and alarmins: all we need to know about danger. J. Leukoc. Biol 81, 1–5. [DOI] [PubMed] [Google Scholar]
- Bloch A, Probst A, Bissig H, Adams H, and Tolnay M (2006). Alpha-synuclein pathology of the spinal and peripheral autonomic nervous system in neurologically unimpaired elderly subjects. Neuropathol. Appl. Neurobiol 32, 284–295. [DOI] [PubMed] [Google Scholar]
- Braak H, Del Tredici K, Bratzke H, Hamm-Clement J, Sandmann-Keil D, and Rub U (2002). Staging of the intracerebral inclusion body pathology associated with idiopathic Parkinson’s disease (preclinical and clinical stages). J. Neurol 249 {Suppl 3), III/1–5. [DOI] [PubMed] [Google Scholar]
- Braak H, de Vos RA, Bohl J, and Del Tredici K (2006). Gastric alpha-synuclein immunoreactive inclusions in Meissner’s and Auerbach’s plexuses in cases staged for Parkinson’s disease-related brain pathology. Neurosci. Lett 396, 67–72. [DOI] [PubMed] [Google Scholar]
- Breit S, Kupferberg A, Rogler G, and Hasler G (2018). Vagus Nerve as Modulator of the Brain-Gut Axis in Psychiatric and Inflammatory Disorders. Front. Psychiatry 9, 44. [DOI] [PMC free article] [PubMed] [Google Scholar]
- Brudek T (2019). Inflammatory Bowel Diseases and Parkinson’s Disease. J. Parkinsons Dis 9 (s2), S331–S344. [DOI] [PMC free article] [PubMed] [Google Scholar]
- Chan JK, Roth J, Oppenheim JJ, Tracey KJ, Vogl T, Feldmann M, Horwood N, and Nanchahal J (2012). Alarmins: awaiting a clinical response. J. Clin. Invest 122, 2711–2719. [DOI] [PMC free article] [PubMed] [Google Scholar]
- Chartier-Harlin MC, Kachergus J, Roumier C, Mouroux V, Douay X, Lincoln S, Levecque C, Larvor L, Andrieux J, Hulihan M, et al. (2004). Alpha-synuclein locus duplication as a cause of familial Parkinson’s disease. Lancet 364, 1167–1169. [DOI] [PubMed] [Google Scholar]
- Chen SG, Stribinskis V, Rane MJ, Demuth DR, Gozal E, Roberts AM, Jagadapillai R, Liu R, Choe K, Shivakumar B, et al. (2016a). Exposure to the Functional Bacterial Amyloid Protein Curli Enhances Alpha-Synuclein Aggregation in Aged Fischer 344 Rats and Caenorhabditis elegans. Sci. Rep 6, 34477. [DOI] [PMC free article] [PubMed] [Google Scholar]
- Chen X, Nie Y, Xiao H, Bian Z, Scarzello AJ, Song NY, Trivett AL, Yang D, and Oppenheim JJ (2016b). TNFR2 expression by CD4 effector T cells is required to induce full-fledged experimental colitis. Sci. Rep 6, 32834. [DOI] [PMC free article] [PubMed] [Google Scholar]
- de Groot NS, and Burgas MT (2015). Is membrane homeostasis the missing link between inflammation and neurodegenerative diseases? Cell. Mol. Life Sci 72, 4795–4805. [DOI] [PMC free article] [PubMed] [Google Scholar]
- De Yang, Chen Q, Schmidt AP, Anderson GM, Wang JM, Wooters J, Oppenheim JJ, and Chertov O (2000). LL-37, the neutrophil granule- and epithelial cell-derived cathelicidin, utilizes formyl peptide receptor-like 1 (FPRL1) as a receptor to chemoattract human peripheral blood neutrophils, monocytes, and T cells. J. Exp. Med 192, 1069–1074. [DOI] [PMC free article] [PubMed] [Google Scholar]
- DeMaagd G, and Philip A (2015). Parkinson’s Disease and Its Management: Part 1: Disease Entity, Risk Factors, Pathophysiology, Clinical Presentation, and Diagnosis. P&T 40, 504–532. [PMC free article] [PubMed] [Google Scholar]
- Eisenbarth SC (2019). Dendritic cell subsets in T cell programming: location dictates function. Nat. Rev. Immunol 19, 89–103. [DOI] [PMC free article] [PubMed] [Google Scholar]
- Fanning S, Selkoe D, and Dettmer U (2020). Parkinson’s disease: proteinopathy or lipidopathy? NPJ Parkinsons Dis. 6, 3. [DOI] [PMC free article] [PubMed] [Google Scholar]
- Fauvet B, Mbefo MK, Fares MB, Desobry C, Michael S, Ardah MT, Tsika E, Coune P, Prudent M, Lion N, et al. (2012). α-Synuclein in central nervous system and from erythrocytes, mammalian cells, and Escherichia coli exists predominantly as disordered monomer. J. Biol. Chem 287, 15345–15364. [DOI] [PMC free article] [PubMed] [Google Scholar]
- George JM (2002). The synucleins. Genome Biol. 3, REVIEWS3002. [DOI] [PMC free article] [PubMed] [Google Scholar]
- Giasson BI, Duda JE, Murray IV, Chen Q, Souza JM, Hurtig HI, Ischiropoulos H, Trojanowski JQ, and Lee VM (2000). Oxidative damage linked to neurodegeneration by selective alpha-synuclein nitration in synucleinopathy lesions. Science 290, 985–989. [DOI] [PubMed] [Google Scholar]
- Greten-Harrison B, Polydoro M, Morimoto-Tomita M, Diao L, Williams AM, Nie EH, Makani S, Tian N, Castillo PE, Buchman VL, and Chandra SS (2010). αβγ-Synuclein triple knockout mice reveal age-dependent neuronal dysfunction. Proc. Natl. Acad. Sci. USA 107, 19573–19578. [DOI] [PMC free article] [PubMed] [Google Scholar]
- Helft J, Böttcher J, Chakravarty P, Zelenay S, Huotari J, Schraml BU, Goubau D, and Reis e Sousa C (2015). GM-CSF Mouse Bone Marrow Cultures Comprise a Heterogeneous Population of CD11c(+)MHCII(+) Macrophages and Dendritic Cells. Immunity 42, 1197–1211. [DOI] [PubMed] [Google Scholar]
- Helmich RC, Hallett M, Deuschl G, Toni I, and Bloem BR (2012). Cerebral causes and consequences of parkinsonian resting tremor: a tale of two circuits? Brain 135, 3206–3226. [DOI] [PMC free article] [PubMed] [Google Scholar]
- Inaba K, Pack M, Inaba M, Sakuta H, Isdell F, and Steinman RM (1997). High levels of a major histocompatibility complex II-self peptide complex on dendritic cells from the T cell areas of lymph nodes. J. Exp. Med 186, 665–672. [DOI] [PMC free article] [PubMed] [Google Scholar]
- Kim C, Lv G, Lee JS, Jung BC, Masuda-Suzukake M, Hong CS, Valera E, Lee HJ, Paik SR, Hasegawa M, et al. (2016). Exposure to bacterial endotoxin generates a distinct strain of α-synuclein fibril. Sci. Rep 6, 30891. [DOI] [PMC free article] [PubMed] [Google Scholar]
- Kim S, Kwon SH, Kam TI, Panicker N, Karuppagounder SS, Lee S, Lee JH, Kim WR, Kook M, Foss CA, et al. (2019). Transneuronal Propagation of Pathologic α-Synuclein from the Gut to the Brain Models Parkinson’s Disease. Neuron 103, 627–641. [DOI] [PMC free article] [PubMed] [Google Scholar]
- Magrinelli F, Picelli A, Tocco P, Federico A, Roncari L, Smania N, Zanette G, and Tamburin S (2016). Pathophysiology of Motor Dysfunction in Parkinson’s Disease as the Rationale for Drug Treatment and Rehabilitation. Parkinsons Dis. 2016, 9832839. [DOI] [PMC free article] [PubMed] [Google Scholar]
- Matsui K, and Nishikawa A (2013). Peptidoglycan-induced T helper 2 immune response in mice involves interleukin-10 secretion from Langerhans cells. Microbiol. Immunol 57, 130–138. [DOI] [PubMed] [Google Scholar]
- Matzinger P. (2002). The danger model: a renewed sense of self. Science 296, 301–305. [DOI] [PubMed] [Google Scholar]
- Okabe Y, and Medzhitov R (2014). Tissue-specific signals control reversible program of localization and functional polarization of macrophages. Cell 157, 832–844. [DOI] [PMC free article] [PubMed] [Google Scholar]
- Oppenheim JJ, and Yang D (2005). Alarmins: chemotactic activators of immune responses. Curr. Opin. Immunol 17, 359–365. [DOI] [PubMed] [Google Scholar]
- Polymeropoulos MH, Lavedan C, Leroy E, Ide SE, Dehejia A, Dutra A, Pike B, Root H, Rubenstein J, Boyer R, et al. (1997). Mutation in the alpha-synuclein gene identified in families with Parkinson’s disease. Science 276, 2045–2047. [DOI] [PubMed] [Google Scholar]
- Power JH, Barnes OL, and Chegini F (2017). Lewy Bodies and the Mechanisms of Neuronal Cell Death in Parkinson’s Disease and Dementia with Lewy Bodies. Brain Pathol. 27, 3–12. [DOI] [PMC free article] [PubMed] [Google Scholar]
- Rannikko EH, Weber SS, and Kahle PJ (2015). Exogenous α-synuclein induces toll-like receptor 4 dependent inflammatory responses in astrocytes. BMC Neurosci. 16, 57. [DOI] [PMC free article] [PubMed] [Google Scholar]
- Reynolds NP, Soragni A, Rabe M, Verdes D, Liverani E, Handschin S, Riek R, and Seeger S (2011). Mechanism of membrane interaction and disruption by α-synuclein. J. Am. Chem. Soc 133, 19366–19375. [DOI] [PubMed] [Google Scholar]
- Rota L, Pellegrini C, Benvenuti L, Antonioli L, Fornai M, Blandizzi C, Cattaneo A, and Colla E (2019). Constipation, deficit in colon contractions and alpha-synuclein inclusions within the colon precede motor abnormalities and neurodegeneration in the central nervous system in a mouse model of alpha-synucleinopathy. Transl. Neurodegener 8, 5. [DOI] [PMC free article] [PubMed] [Google Scholar]
- Sampson TR, Debelius JW, Thron T, Janssen S, Shastri GG, Ilhan ZE, Challis C, Schretter CE, Rocha S, Gradinaru V, et al. (2016). Gut Microbiota Regulate Motor Deficits and Neuroinflammation in a Model of Parkinson’s Disease. Cell 167, 1469–1480. [DOI] [PMC free article] [PubMed] [Google Scholar]
- Sampson TR, Challis C, Jain N, Moiseyenko A, Ladinsky MS, Shastri GG, Thron T, Needham BD, Horvath I, Debelius JW, et al. (2020). A gut bacterial amyloid promotes α-synuclein aggregation and motor impairment in mice. eLife 9, e53111. [DOI] [PMC free article] [PubMed] [Google Scholar]
- Shameli A, Xiao W, Zheng Y, Shyu S, Sumodi J, Meyerson HJ, Harding CV, and Maitta RW (2016). A critical role for alpha-synuclein in development and function of T lymphocytes. Immunobiology 221, 333–340. [DOI] [PMC free article] [PubMed] [Google Scholar]
- Singleton AB, Farrer M, Johnson J, Singleton A, Hague S, Kachergus J, Hulihan M, Peuralinna T, Dutra A, Nussbaum R, et al. (2003). alpha-Synuclein locus triplication causes Parkinson’s disease. Science 302, 841. [DOI] [PubMed] [Google Scholar]
- Stolzenberg E, Berry D, Yang D, Lee EY, Kroemer A, Kaufman S, Wong GCL, Oppenheim JJ, Sen S, Fishbein T, et al. (2017). A Role for Neuronal Alpha-Synuclein in Gastrointestinal Immunity. J. Innate Immun 9, 456–463. [DOI] [PMC free article] [PubMed] [Google Scholar]
- Sulzer D, Alcalay RN, Garretti F, Cote L, Kanter E, Agin-Liebes J, Liong C, McMurtrey C, Hildebrand WH, Mao X, et al. (2017). T cells from patients with Parkinson’s disease recognize α-synuclein peptides. Nature 546, 656–661. [DOI] [PMC free article] [PubMed] [Google Scholar]
- Tanji K, Mori F, Imaizumi T, Yoshida H, Matsumiya T, Tamo W, Yoshimoto M, Odagiri H, Sasaki M, Takahashi H, et al. (2002). Upregulation of alpha-synuclein by lipopolysaccharide and interleukin-1 in human macrophages. Pathol. Int 52, 572–577. [DOI] [PubMed] [Google Scholar]
- Tomlinson JJ, Shutinoski B, Dong L, Meng F, Elleithy D, Lengacher NA, Nguyen AP, Cron GO, Jiang Q, Roberson ED, et al. (2017). Holocranohistochemistry enables the visualization of α-synuclein expression in the murine olfactory system and discovery of its systemic anti-microbial effects. J. Neural Transm. (Vienna) 124, 721–738. [DOI] [PMC free article] [PubMed] [Google Scholar]
- Wang W, Perovic I, Chittuluru J, Kaganovich A, Nguyen LT, Liao J, Auclair JR, Johnson D, Landeru A, Simorellis AK, et al. (2011). A soluble α-synuclein construct forms a dynamic tetramer. Proc. Natl. Acad. Sci. USA 108, 17797–17802. [DOI] [PMC free article] [PubMed] [Google Scholar]
- Wang N, Gibbons CH, Lafo J, and Freeman R (2013). α-Synuclein in cutaneous autonomic nerves. Neurology 81, 1604–1610. [DOI] [PMC free article] [PubMed] [Google Scholar]
- Yang D, Chen Q, Yang H, Tracey KJ, Bustin M, and Oppenheim JJ (2007). High mobility group box-1 protein induces the migration and activation of human dendritic cells and acts as an alarmin. J. Leukoc. Biol 81, 59–66. [DOI] [PubMed] [Google Scholar]
- Yang D, Chen Q, Su SB, Zhang P, Kurosaka K, Caspi RR, Michalek SM, Rosenberg HF, Zhang N, and Oppenheim JJ (2008). Eosinophil-derived neurotoxin acts as an alarmin to activate the TLR2-MyD88 signal pathway in dendritic cells and enhances Th2 immune responses. J. Exp. Med 205, 79–90. [DOI] [PMC free article] [PubMed] [Google Scholar]
- Yang D, Postnikov YV, Li Y, Tewary P, de la Rosa G, Wei F, Klinman D, Gioannini T, Weiss JP, Furusawa T, et al. (2012). High-mobility group nucleosome-binding protein 1 acts as an alarmin and is critical for lipopolysaccharide-induced immune responses. J. Exp. Med 209, 157–171. [DOI] [PMC free article] [PubMed] [Google Scholar]
- Yang D, Han Z, and Oppenheim JJ (2017). Alarmins and immunity. Immunol. Rev 280, 41–56. [DOI] [PMC free article] [PubMed] [Google Scholar]
- Zhang G, Xia Y, Wan F, Ma K, Guo X, Kou L, Yin S, Han C, Liu L, Huang J, et al. (2018). New Perspectives on Roles of Alpha-Synuclein in Parkinson’s Disease. Front. Aging Neurosci 10, 370. [DOI] [PMC free article] [PubMed] [Google Scholar]
Associated Data
This section collects any data citations, data availability statements, or supplementary materials included in this article.
Supplementary Materials
Data Availability Statement
All data supporting the findings of this study are available within the paper or from the lead contact upon request. This paper does not report original code. Any additional information required to reanalyze the data reported in this paper is available from the lead contact upon request.