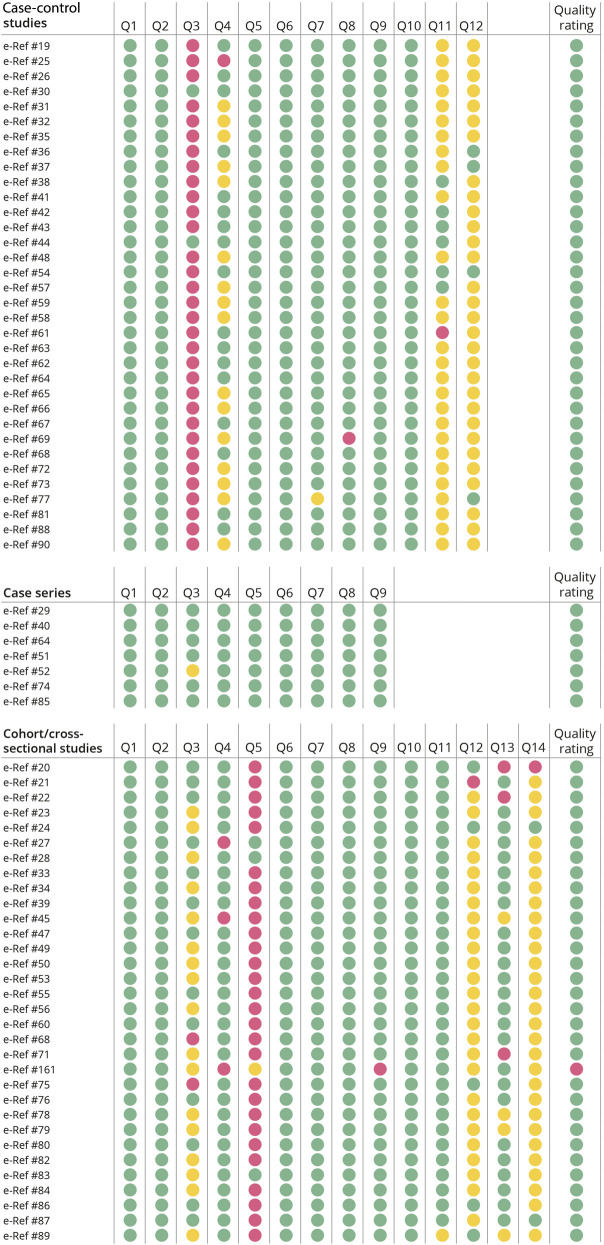
Figure 2. Quality Assessment.
NIH quality assessment tools for case series studies (top), case-control studies (middle), and observational cohort and cross-sectional studies (bottom). Color codes: green indicates yes, not applicable, good quality rating, and fair quality rating; yellow indicates unclear or cannot determine; red indicates no or poor quality rating. One study (Romo-Nava 2010) had headache data that received a poor quality rating (although this rating is not a reflection of its other data); this study was excluded from the systematic review and meta-analysis. Details are available in eTable 2 (links.lww.com/WNL/C709).

