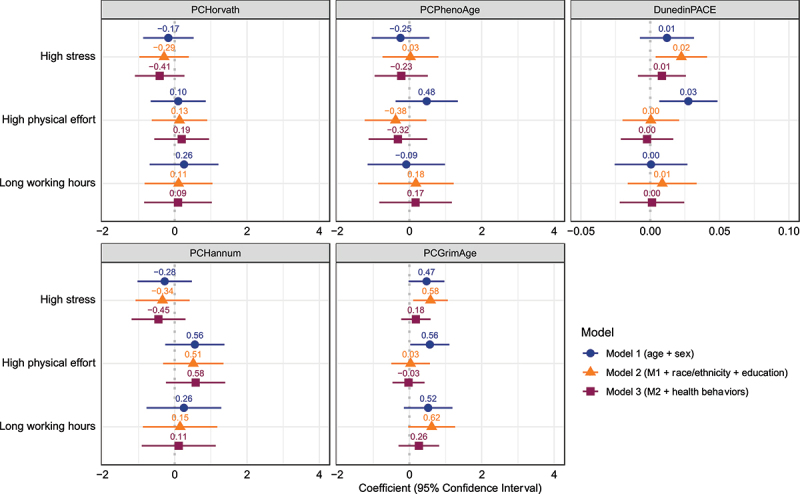
Figure 3.

Associations between self-reported working conditions in 2010 and epigenetic age measures in 2016. The displayed effect sizes are the coefficients from linear regressions along with the 95% confidence intervals around these coefficients. These self-reported working conditions are all binary measures and the coefficients refer to the estimated difference in a measure between individuals with and without this occupational characteristic after accounting for the other included covariates. Model 1 adjusts for age and sex. Model 2 additionally includes race/ethnicity and educational attainment. Model 3 additionally includes smoking status, alcohol consumption, physical inactivity, and Body Mass Index (BMI) category.
