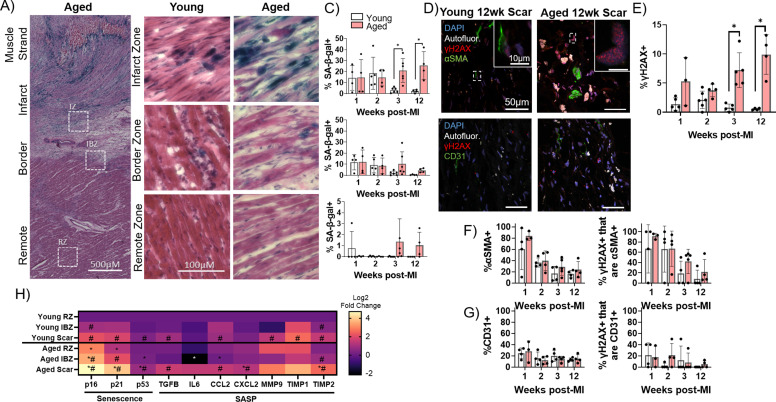
Figure 4. Senescence of myofibroblasts is elevated and persistent in the aged rabbit heart post-MI and correlates with increased inflammation.
(A) Representative senescence-associated β-galactosidase (SA-β-gal)-stained image showing examples of infarct zone, border zone, and remote zone (RZ). (B) Representative SA-β-gal-stained images showing infarct zone, border zone, and RZ from young and aged rabbits at 3 weeks post-MI. (C) Quantification of percent SA-β-gal+ cells from the scar (top), infarct border zone (IBZ) (middle), and RZ (bottom) in young and aged rabbits at 1, 2, 3, and 12 weeks post-MI. (D) Representative confocal images of αSMA/γH2AX double immunofluorescence staining (top row) and CD31/γH2AX double immunofluorescence staining (bottom row) from young (left) and aged (right) in the infarct zone of rabbits at 12 weeks post-MI. White indicates autofluorescence and was used to avoid false positive fluorescence signal. (E) Quantification of % of nuclei with three or more γH2AX foci. (F) Quantification of percent αSMA+ cells (left) and the percent of γH2AX+ cells that are αSMA+ (right). (G) Quantification of percent CD31+ cells (left) and the percent of γH2AX+ cells that are CD31+ (right). (H) Quantification of expression of senescence and senescence-associated secretory phenotype (SASP) genes via RT-qPCR from young and aged rabbits 3 weeks post-MI. N=3 rabbits per condition. Dots represent average data for each rabbit, error bars SEM. Two-tailed exact test: *p<0.05 compared to young, # p<0.05 compared to respective RZ.


