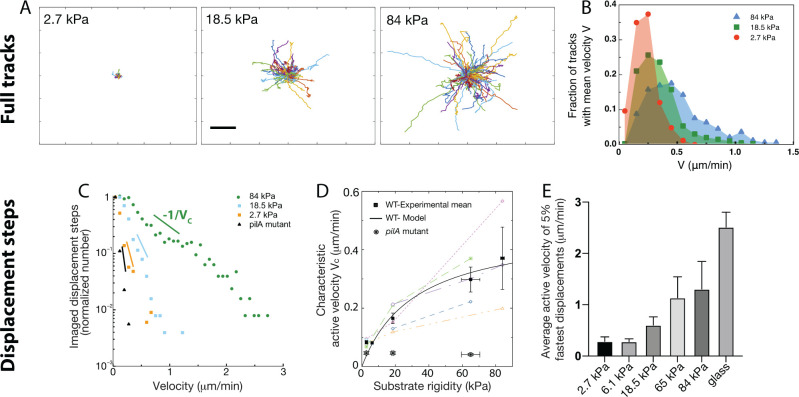
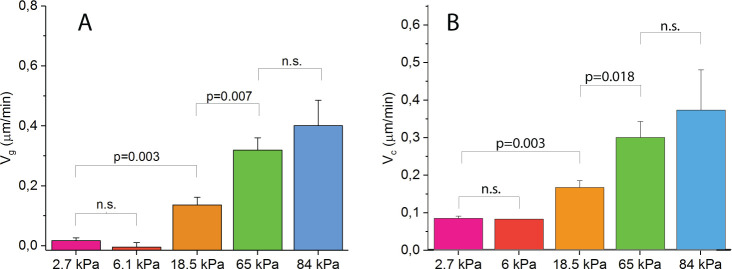
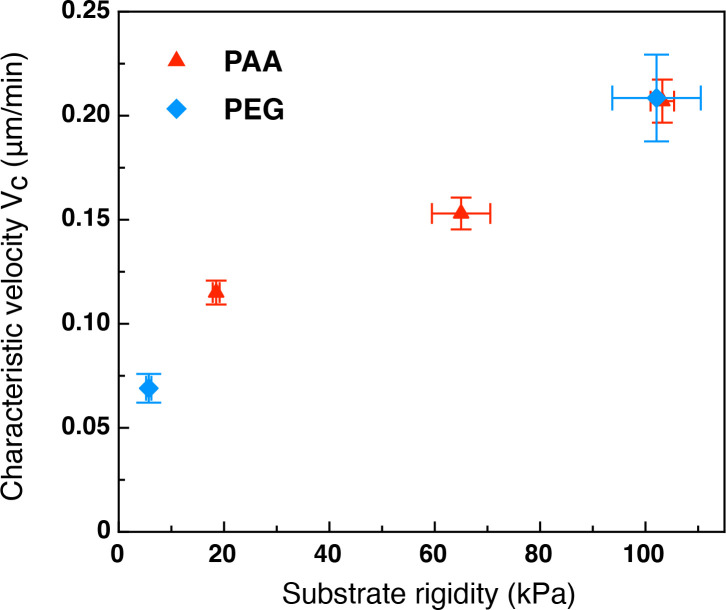
Figure 3. Twitching motility depends on substrate rigidity and is highly distributed in the bacterial population.
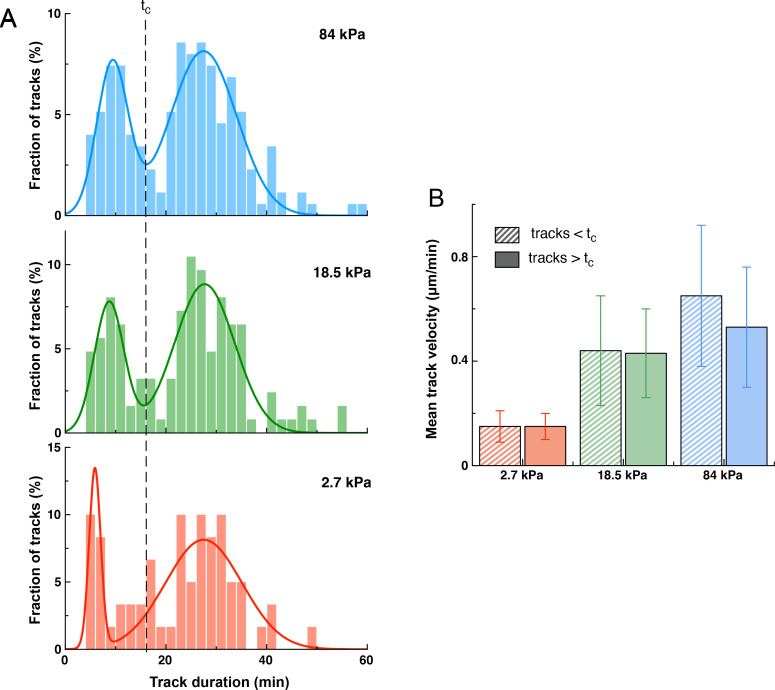
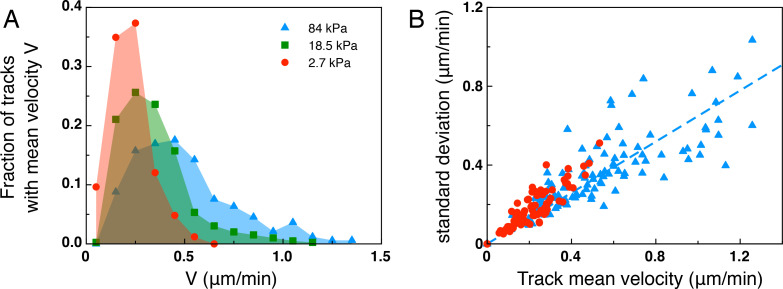
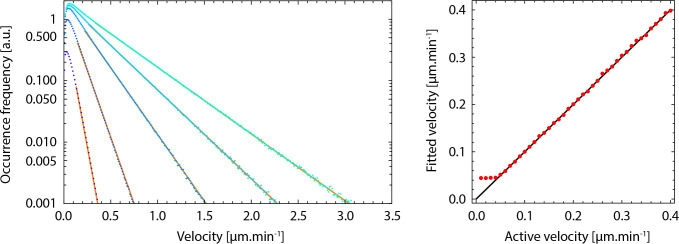
Analysis of full tracks (top row) and 1 min displacement steps (bottom row). (A) Individual bacterial tracks on soft (2.7 kPa), intermediate (18.5 kPa) and stiff (84 kPa) PAA during the first 3 hours after bacterial inoculation (total number of tracks is respectively 60, 123, and 175). Scale bar: 10 μm (B) Mean track velocity distribution for different values of the substrate rigidity. Only full tracks were considered (corresponding to the right peak in Figure 3—figure supplement 1). 84 kPa: 330 tracks from 2 independent experiments, 18.5 kPa: 394 tracks from 3 independent experiments, 2.7 kPa: 83 tracks from 2 independent experiments. (C) Normalized velocity distributions for the whole bacterial population on different PAA surfaces. The exponential decrease yields a characteristic active velocity on each substrate. Displacement steps were measured every minute for 100 min, and two positions were acquired on each rigidity. The average of T4P-defective mutant on all surfaces is shown as a reference. (D) Characteristic active velocity values obtained by fitting velocity distributions (6 independent experiments, 16 different surfaces). Values measured on different surfaces in a single experiment (same channel) are shown with the same symbols and connected. Black squares(circled stars) are mean values obtained for the WT(pilA mutant), and error bars show the SEM. The black line is the fit of WT values with the kinetic model-derived equation A11, with μm.min-1 and kPa. (E) Average velocity values of the top 5% fastest displacement steps for different substrates. Error bars are standard errors.

