

Abstract
Material extrusion 3D printing has been widely used in industrial, educational and residential environments, while its exposure health impacts have not been well understood. High levels of ultrafine particles are found being emitted from 3D printing and could pose a hazard when inhaled. However, metals that potentially transfer from filament additives to emitted particles could also add to the exposure hazard, which have not been well characterized for their emissions. This study analyzed metal (and metalloid) compositions of raw filaments and in the emitted particles during printing; studied filaments included pure polymer filaments with metal additives and composite filaments with and without metal powder. Our chamber study found that crustal metals tended to have higher partitioning factors from filaments to emitted particles; silicon was the most abundant element in emitted particles and had the highest yield per filament mass. However, bronze and stainless-steel powder added in composite filaments were less likely to transfer from filament to particle. For some cases, boron, arsenic, manganese, and lead were only detected in particles, which indicated external sources, such as the printers themselves. Heavy metals with health concerns were also detected in emitted particles, while their estimated exposure concentrations in indoor air were below air quality standards and occupational regulations. However, total particle exposure concentrations estimated for indoor environments could exceed ambient air fine particulate standards.
Keywords: Fused filament fabrication (FFF), Particulate matter, Heavy metal, Exposure modeling, Health implication
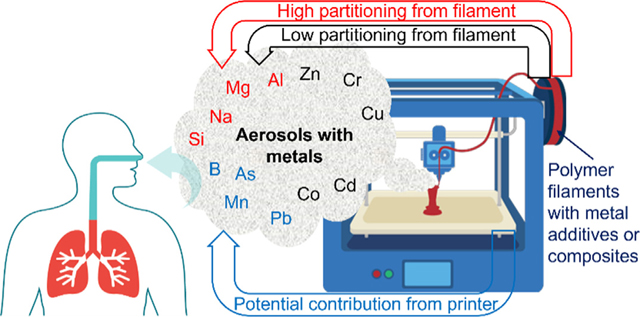
Graphical Abstract
1. Introduction
Fused filament fabrication (FFF) 3D printing is a material extrusion based additive manufacturing technique, which heats and extrudes a filament shape material through an extruder nozzle onto a moving platform layer by layer to construct the desired object. FFF 3D printers are widely used in workplaces, residential and educational settings (Bharti and Singh, 2017), due to their low cost, flexibility, and ease of operation. Commonly used filaments are thermoplastics like acrylonitrile butadiene styrene (ABS), polylactic acid (PLA), and nylon, with various additives and composites (Bharti and Singh, 2017; Zhang et al., 2017; Kwon et al., 2017). Studies have shown that consumer FFF 3D printers emit high levels of particles, especially ultrafine particles (UFP, diameter <100 nm) (Zhang et al., 2017; Yi et al., 2016; Chýlek et al., 2021; Floyd et al., 2017; Azimi et al., 2016; Kim et al., 2015). Elemental analysis of emitted particles showed the predominant elements were carbon and oxygen (Kwon et al., 2017; Zisook et al., 2020; Steinle, 2016; Zontek et al., 2017; Zhu et al., 2020; Rao et al., 2017), which were associated with the polymer materials; other non-metal elements included sulfur and chlorine (Zisook et al., 2020; Zontek et al., 2017; Rao et al., 2017; Stefaniak et al., 2017a; Youn et al., 2019). Trace amount of metals and metalloids, refer to as metals hereafter, have also been detected; common ones included aluminum (Al), iron (Fe), zinc (Zn), chromium (Cr), copper (Cu), sodium (Na), calcium (Ca), magnesium (Mg), and manganese (Mn) (Zontek et al., 2017; Stefaniak et al., 2017a; Stefaniak et al., 2021). Metals detected from the emitted particles could be associated with bulk filament materials and additives (Zontek et al., 2017; Stefaniak et al., 2021), from the printer itself, contamination from sampling sites (Zontek et al., 2017) or sample preparation processes (Zhu et al., 2020), therefore, more studies are needed to identify the exact sources.
Metal-based additives, in the form of inorganic or organic compounds, are commonly used in plastics, functioning as inert fillers, pigments, stabilizers, antioxidants, lubricants, and flame retardants (Turner and Filella, 2021; Tedla et al., 2022). Although metal-based additives are not expected to migrate from the material matrix to the environment (Turner and Filella, 2021), thermoplastic filaments are heated to temperatures between 190 and 270 °C (Zhang et al., 2017; Kwon et al., 2017) which could lead to decomposition/transformation of metal additives and their unintentional release. Metal powder or (nano)particles (nanoparticles (NPs) < 100 nm in size) are also added to polymer filaments to create metal composite filaments (Tedla et al., 2022), which provide printed parts with enhanced mechanical strength and metallic finish. Metal composite filaments could emit higher amounts of particles than the same base polymer filaments without metal composites when printing at the same extrusion temperatures (Alberts et al., 2021; Stabile et al., 2017; Poikkimäki et al., 2019), which could potentially lead to higher exposure to metals if they are released.
Survey and case studies have shown that FFF 3D printer users reported headaches, irritation and upper respiratory symptoms (House et al., 2017; Chan et al., 2018; Karwasz et al., 2022). Cellular assays showed exposure to 3D printing (including 3D pen) emissions could vary from little or no toxicity (Singh et al., 2021) to inducing cytotoxicity and oxidative stress (Singh et al., 2021; Farcas et al., 2019). Similarly, inhalation exposure of rats showed minimal pulmonary effects (Farcas et al., 2020) to causing arterial pressor response (Stefaniak et al., 2017b). This could be due to the differences in print conditions, exposure scenarios and assessment methods. Specifically, in vivo and in vitro studies have found that exposure to FFF 3D printing-emitted particles induced inflammation in animals, oxidative stress in cells, and cell deaths (Zhang et al., 2019). Particle intrinsic toxicity could be associated with the small sizes (e.g., UFP) and the chemical/metal compositions (Nel et al., 2006; Grass et al., 2010; Donaldson et al., 1998). Previous research has demonstrated metal (nano)particles can potentially induce adverse health effects in organs and tissues, and at the cellular, subcellular and protein levels (Schrand et al., 2010; Fortoul et al., 2015). Therefore, normal use of FFF 3D printers could result in exposure to particles and metals (Zisook et al., 2020; Du Preez et al., 2018; Stefaniak et al., 2019a; Stefaniak et al., 2019b). Although reported exposure to metals in workplaces with FFF 3D printers were below National Institute for Occupational Safety & Health (NIOSH) recommended levels (Du Preez et al., 2018; Stefaniak et al., 2019a; Stefaniak et al., 2019b), exposures in non-industrial indoor environments, where lower ventilation rates are typically applied, could still present a health concern.
Here we report on the characterization of metal compositions in both the raw filament materials and particles emitted from non-industrial FFF 3D printers used in indoor environments. The partitioning of metals from the raw materials to particles is estimated and detected metals in particle emissions are discussed for their potential sources. Furthermore, metal exposure levels during 3D printer operation in different indoor environments are estimated using an exposure model and compared with existing data, and their potential health implications discussed.
2. Materials and methods
2.1. Print materials and conditions
The studied filament specifications and print conditions are listed in Table 1. There were three different 3D printers from two manufacturers (brand D and E) and eight filaments of different materials from four manufacturers (brands 1 to 4). The studied filaments included three pure PLA filaments with green and bronze coloring, two composite PLA filaments with bronze powder, two composite Nylon filaments, one of which contained additional flame retardant (FR), and one composite metal filament. According to the manufacturers, the bronze colored filament doesn’t contain metal thus was a pure polymer filament, however, there is no information on the additive/dye it contains to show a metallic shine, while the bronze powder filaments contain metal powder in polymer material (Table 1).
Table 1.
Studied materials and print conditions.
| Filament | Filament material | Filament brand | Printer brand | Extruder temperature |
|---|---|---|---|---|
| Green PLA | PLA with additives | 1 | D1 | 215 °C |
| Green PLA | PLA with additives | 2 | D1 | 215 °C |
| Bronze PLA | PLA with additives | 1 | D1 | 215 °C |
| Bronze PLA | PLA with 25 % wt. bronze powder | 2 | D1 | 215 °C |
| Bronze PLA | PLA with 80 % wt. bronze powder | 3 | D1 | 230 °C |
| Nylon | Nylon with chopped carbon fibers | 4 | E1 | 275 °C |
| Nylon FR | Nylon with chopped carbon fibers and flame retardant | 4 | E1 | 275 °C |
| Metal | 17–4 stainless-steel powder and polymer binders | 4 | E2 | 220 °C |
2.2. Chamber study and exposure estimation
Particle emission characterization was based on a standardized testing method using a chamber test facility that consists of exposure chambers, air supply and conditioning system, air sampling and analysis system, and data acquisition and recording system (ANSI, 2019). The stainless steel exposure chambers (1 or 6 m3 depending on printer size) used in this study were designed and validated for air tightness, mixing, and air change rate, according to established standards (ANSI, 2019; ASTM International, 2013). Inflow air, free of chemicals and particles, was supplied at one air exchange per hour through distributing manifolds. The studied 3D printer was placed in the middle of the chamber; particles inside the chamber were monitored and collected via different sampling ports located on the walls of the chamber (Zhang et al., 2017; Zhang et al., 2019; Davis et al., 2019). Particle concentration and size distribution were measured using a scanning mobility particle sizer (SMPS, electrostatic classifier 3082, differential mobility analyzer 3081A, condensation particle counter 3789, TSI Inc.) and an optical particle sizer (OPS 3330, TSI Inc.) for 7 nm to 10 μm particles; the measurement continued from background (printer inside the chamber but not running), printing to after print finished. The print time varied from 1 h to up to 13 h to ensure a complete emission calculation and particle filter collection for subsequent metal analysis. Particle mass concentration was calculated from the measured number concentration assuming particles were spherical with 1 g/cm3 density. This assumption could introduce uncertainties due to the unknown of particle density and potential particle agglomeration, a previous estimation showed this instrumental measurement and conversion could be biased up to 40 % high considering both density and agglomerate effects (Zhang et al., 2017). Details of chamber setup and particle measurements have been described previously (Zhang et al., 2017; Davis et al., 2019).
Total particle emission (TP) during printing was calculated by integrating particle concentrations over the emission duration using Eq. (1) (ANSI, 2019),
| (1) |
where and indicate the time duration of emission; is the volume of the chamber; is particle concentration at a given time ; is the time interval of particle sampling; is the loss coefficient calculated from particle decay after the print stopped. Particle emission rate (ER, TP divided by print time) and yield (EY, TP divided by mass of filament used) were then calculated. Furthermore, chamber measured particle emission results were applied to an indoor exposure model to estimate the particle exposure concentrations in different indoor environments using Eq. (2) (ANSI, 2019).
| (2) |
where is the predicted exposure concentration; is the number of 3D printers; and are the volume and air exchange rate of the model environment. The model was based on a mass balance, assuming the studied room was well-mixed and 3D printing was the only emission source within the room. Modeled indoor scenarios included a prototypical office room (, , ), a room in a residential house (, , ) and a classroom in a school (, , ) (ANSI, 2019; Davis et al., 2019). Details of the calculation methods are in ANSI/CAN/UL 2904 (ANSI, 2019).
2.3. Metal analysis and calculation
Particle samples for offline metal analysis were collected at a flow rate of about 20 L/min onto mixed cellulose ester (MCE) filters (37 mm diameter and 0.45 μm pore size) held in clear styrene filter cassettes connected to a vacuum pump (Table A.1). The sampling started when filament extrusion started and ended when the print job finished. Print time varied for different filaments to collect enough particle mass for metal analysis, which depended on particle emission rates. Blank filters were also collected. Filter samples, as well as unused filament pieces, were prepared using microwave assisted acid digestion method (EPA method 3051A) and analyzed using inductively coupled plasma - mass spectrometry (ICP-MS, Agilent 7900, Agilent Technologies) following EPA method 6020; each sample was analyzed with three duplicates. The operation and instrumentational settings were described previously (Yi et al., 2019).
Particle mass collected on the filter was estimated from the mass concentration determined by SMPS and OPS and the volume of sampled air (Zhang et al., 2017; Zhang et al., 2019). It was assumed particle instruments covered all sizes contributing to particle mass and it was approved in this chamber study that emitted particles were mainly ultrafine and rarely larger than 3 μm (Table A.1). The mass of the unused filament was determined gravimetrically. Elemental concentrations in particles and filaments were calculated by normalizing mass of element to the particle or filament mass, i.e., and . Blanks were subtracted from samples for particle filter analysis, while for unused filaments, an estimated blank was calculated from the digestion blank measurement and assuming 0.1 g of filament (average mass of filament samples analyzed). Elemental emission yield () was the ratio of released from the printed filament (Eq. (3)). Partition factor () was in emitted particles over that in raw filament, assuming in particles was only from the filament (Eq. (4)).
| (3) |
| (4) |
3. Results and discussion
3.1. Metals detected in filaments
In each studied filament, 3 to 17 different metals were detected that were above the method detection limit (MDL), but some were below method reporting limit (MRL, 3 times of MDL), see Table 2. Copper and tin were detected with the highest concentrations from Bronze PLA3 (80 % wt. bronze) and the sum of metals accounted for 79.8 % of the filament weight. However, for Bronze PLA2 (25 % wt. bronze), copper and zinc had the highest concentrations indicating the alloy of brass and the sum of metals only accounted 2.45 % of the filament weight (Table 2). For Metal filament, measured total metals accounted for 95.9 % of filament mass. Specifically, Fe, Cr, Ni and Cu were detected in high concentrations with composition ratios reflecting the formula of 17–4 stainless steel; Si and Mn were also detected in relatively high concentrations that are also commonly found in 17–4 stainless steel (Table 2). Boron was rarely detected in most filaments but was found in Nylon FR, which was associated with the boron‑zinc flame retardant added; Zn was also detected with a relative high concentration (Table 2). In addition, a non-metal element, phosphorus was the most abundant detected element in Nylon FR raw filament.
Table 2.
Average concentration of each detected metal in raw filaments (μg/g or ppm). Only measurements above MDL are shown.
| Green PLA1 | Green PLA2 | Bronze PLA1 | Bronze PLA2 | Bronze PLA3 | Nylon | Nylon FR | Metal | |
|---|---|---|---|---|---|---|---|---|
| Boron (B) | 852 | |||||||
| Sodium (Na) | 148 | 114 | 52.8 | 72.6 | 17.9a | |||
| Magnesium (Mg) | 18.8a | 21.1 | 90.4 | 4.40a | 22.3 | 28.0a | ||
| Aluminum (Al) | 48.3 | 21.4 | 421 | 32.3 | 6.40a | 7.47 × 10³ | ||
| Silicon (Si) | 23.6 | 26.5 | 450 | 19.2a | 35.5 | 2.32 × 10³ | ||
| Potassium (K) | 240 | 6.26 | ||||||
| Calcium (Ca) | 154 | 411 | 88.4 | 264 | ||||
| Titanium (Ti) | 286 | 45.4a | 133 | 1.12 | 10.3a | |||
| Vanadium (V) | 274 | |||||||
| Chromium (Cr) | 1.34 | 0.51 | 1.40 | 0.53a | 1.14 | 5.18a | 3.90a | 1.56 × 10⁵ |
| Manganese (Mn) | 1.08 | 2.91 | 1.11 × 10³ | |||||
| Iron (Fe) | 605 | 1.27 × 10³ | 19.0a | 19.1a | 7.17 × 10⁵ | |||
| Cobalt (Co) | 0.11 | 0.06a | 1.97 | 450 | ||||
| Nickel (Ni) | 0.40a | 0.18b | 0.37a | 261 | 2.21a | 3.94a | 4.32 × 10⁴ | |
| Copper (Cu) | 59.2 | 23.5 | 1.80 × 10⁴ | 7.08 × 10⁵ | 3.86 × 10⁴ | |||
| Zinc (Zn) | 300 | 10.1 | 6.04 × 10³ | 23.6 | 2.08 × 10³ | |||
| Arsenic (As) | 20.6 | |||||||
| Strontium (Sr) | 0.78 | 2.50 | 0.11a | 0.27 | 0.10a | |||
| Molybdenum (Mo) | 0.07 | 0.08a | 103 | |||||
| Cadmium (Cd) | 0.06a | |||||||
| Tin (Sn) | 45.7 | 31.4 | 37.2 | 31.3 | 8.98 × 10⁴ | |||
| Antimony (Sb) | 5.21 | |||||||
| Barium (Ba) | 0.91 | 0.92 | ||||||
| Lead (Pb) | 24.1 |
Indicates the measurement was below MRL.
Indicates the measurement was lower than the estimated blank.
Although total metals accounted for a minimal fraction of filament weight for pure polymer and composite filaments without known added metal powder (0.002–1.04 %), metals from unknown additives were also detected, as well as unexpected metals from metal composite filaments. For all five PLA-based filaments, Na, Mg, Al, Si, Sn, Cr, and Sr were detected consistently, with the previous five having moderate concentrations (Table 2). Si, Ca, Al and Mg could be associated with inert fillers, stabilizers and flame retardants in thermoplastics (Turner and Filella, 2021). Copper and zinc were both detected from the two green PLA filaments, likely associated with green dyes. For pure PLA filaments, i.e., two green filaments and Bronze PLA1, 56 % out of 18 metals was commonly detected. Similarly, for bronze PLA composite filaments, i.e., Bronze PLA2 and 3, 50 % out of 20 metals were found in both. Previous studies showed commonly detected metals from pure PLA filaments included Na, Mg, K, Ca and trace levels of Sb, Cd, Co, Mn, and Ni (Yi et al., 2019); they were all detected in this study with relatively higher concentrations (Table 2). Some unexpected metals tended to have similar concentrations for a specific filament brand, probably indicating consistencies of filament formulation from the same manufacturer. For example, Fe and Ti were at relatively high concentrations for both Green PLA1 and Bronze PLA1; Sn, Ni, Mn and Mo all had similar concentrations in both filaments of brand 1; Cr had similar concentrations in brand 1 and brand 2 filaments separately (Table 2). There were only three metals detected in Nylon and all in low concentrations, with two of them (Cr and Ni) also detected from the same brand filament Nylon FR (Table 2).
3.2. Metals detected in particles and their potential sources
The metals detected in emitted particles from each filament that were above both the detection limit and the blank are listed in Table 3. The most commonly detected metal from particles was silicon, which was detected from all samples. The second one was boron that was found in seven samples except Metal filament, which has not been previously reported in emitted particles (Zontek et al., 2017; Stefaniak et al., 2017a; Youn et al., 2019; Stefaniak et al., 2021; Yi et al., 2019). Other commonly detected metals (in 5 to 6 out of the 8 samples) included Mg, Ca, Mn, Zn, As, Sr, Sn, and Pb (Table 3). Previous studies reported metals commonly detected from PLA emitted particles included Fe, Zn, Si, K, Cu, Al, Na, Mg (Steinle, 2016; Zontek et al., 2017; Stefaniak et al., 2017a; Youn et al., 2019; Stefaniak et al., 2021; Yi et al., 2019), which were also detected in this study, except for Fe. In addition, Na, Al and K were only detected in particles emitted from the two green PLA filaments (Table 3).
Table 3.
Concentration of each detected element in particle samples (μg element/g particle). Blank indicates the measurement was below MDL or sample was lower than blank measurement
| Green PLA1 | Green PLA2 | Bronze PLA1 | Bronze PLA2 | Bronze PLA3 | Nylon | Nylon FR | Metal | |
|---|---|---|---|---|---|---|---|---|
| Boron (B) | 247* | 433* | 45.4 | 176 | 116 | 845 | 1.74 × 10³ | |
| Sodium (Na) | 6.10 × 10⁴ | 2.47 × 10⁴ | ||||||
| Magnesium (Mg) | 4.19 × 10³ | 3.30 × 10³ | 27.1* | 34.8* | 276* | 871 | ||
| Aluminum (Al) | 2.72 × 10⁴ | 7.75 × 10⁴ | ||||||
| Silicon (Si) | 2.32 × 10⁵ | 3.59 × 10⁵ | 4.90 × 10³ | 1.23 × 10⁴ | 8.82 × 10³ | 2.74 × 10⁵ | 1.74 × 10⁵ | 1.86 × 10⁴ |
| Potassium (K) | 2.73 × 10³ | 5.58 × 10³ | ||||||
| Calcium (Ca) | 2.16 × 10⁴ | 6.65 × 10³ | 147 | 44.8 | 405 | 1.19 × 10⁴ | ||
| Titanium (Ti) | 887 | 27.6 * | ||||||
| Vanadium (V) | 0.50* | 31.4* | ||||||
| Chromium (Cr) | 665 | |||||||
| Manganese (Mn) | 0.62 | 0.83 | 4.85 | 80.9 | 28.1 | |||
| Cobalt (Co) | 1.25 * | 26.9 | ||||||
| Copper (Cu) | 139 * | 393 * | 210 * | |||||
| Zinc (Zn) | 4.40 × 10³ | 4.34 × 10³ | 17.5* | 291 * | 96.6 | |||
| Arsenic (As) | 1.15* | 0.64* | 4.52 * | 70.8 * | 92.2 | 2.01 * | ||
| Selenium (Se) | 424 * | |||||||
| Strontium (Sr) | 139 | 1.55 | 1.55 | 0.75 | 44.9 | |||
| Cadmium (Cd) | 5.52 * | |||||||
| Tin (Sn) | 92.1 | 170* | 112 | 1.48 × 10³ | 382 * | |||
| Antimony (Sb) | 56.5 * | 874 * | ||||||
| Barium (Ba) | 32.2 | |||||||
| Thallium (Tl) | 74.3 | |||||||
| Lead (Pb) | 47.5* | 4.59* | 10.3* | 5.68* | 200 * |
indicates the measurement was above MDL but below MRL; bold indicates the measurement was larger than 3 times of the standard deviation of blanks or blanks were below MDL.
Note: Selenium (Se) is a non-metal.
Silicon was the most abundant element for all 8 particle samples, even though it was not detected in the nylon composite filaments (Tables 2 and 3). This indicates Si in particles emitted from Nylon and Nylon FR filaments was associated with a source other than the raw filament – likely the printer itself, since both filaments were run on the same printer E1 (Table 1). A potential source of Si is silicone lubricant that was applied when installing the extruder nozzle on printer E1. In this study, we assumed an element in emitted particles was from the filament if it was also detected in the filament, otherwise it was assumed to be from the printer (e.g., printer parts and operation processes). Interestingly, boron was only detected in the Nylon FR filament, added as a flame retardant (Table 2), but it was found in nearly all the particle samples with moderate concentrations (Table 3). This indicated boron in particles could also be associated with the printer and not the filament, especially for the 5 PLA-based filaments that were run using the same printer (printer D1, Table 1). Boron compounds have been used in the plastics industry as flame retardants (Wu and Xu, 2014) and could be present in printer parts and electrical wires. Other metals in particles, like Mn, As and Pb, were also likely to be contributed by the printer since, on average, for 81 % of the particle samples, these elements were not detected in the filaments. Furthermore, printer E1 was likely the source of Ca, Mn, As and Sn in particles, since these elements were not detected in Nylon or Nylon FR filaments but were in both particle samples emitted from printing with printer E1. This is also consistent with the finding that more elements were detected from particles generated from Nylon and Nylon FR than the raw filaments, indicating a source other than filament materials (Tables 2 and 3). Printer parts with elevated temperature during printing are potential emission sources. Of these, the extruder nozzle had the highest temperature (Table 1). However, the extruder nozzle made of brass (printer D1) was unlikely to be a source of Cu and Zn in emitted particles due to the inconsistency of detection frequencies of these elements in the particles, i.e., neither Cu nor Zn was consistently detected from all particle samples emitted from printer D1; this was also suggested in a previous study (Stefaniak et al., 2021). In addition, the build plate was heated for printer D1 (50 °C); the print chamber (i.e., where the printing process happened) was heated for printer E2 (80 °C); even without additional heating for printer E1, the temperature inside the print chamber was also elevated since the printer is enclosed. Therefore, metal particle emissions could be associated with non-metal parts like plastic panels, mixing fans, coating materials, and circuit boards.
In general, for PLA-based filaments that ran on printer D1, filaments tended to contribute more to particle metal composition (56 % - 78 %) than the printer, while for the filaments ran on printer brand E (printer E1 and E2), printers tended to contribute more (69 % - 100 %), see Fig. 1.
Fig. 1.

Potential source of metals detected in particle filter samples. The percentage indicates the number of metal elements detected from particles that were also detected in the raw filaments.
3.3. Metal emission yield and partition factor
The calculated elemental emission yield was mostly below 1 ng/g. Silicon had the highest yield for all filaments, ranging from 15.3 to 248 ng/g for PLA-based filaments, which was comparable to those reported from Yi et al. (Yi et al., 2019) with pure PLA filaments using a 3D pen or a printer toy; for Nylon and metal composite filaments was higher, ranging from 614 to 2251 ng/g. Other metals that could have relatively higher yield (> 10 ng/g) included B, Na, Al, Ca, and Zn. In addition, the yield for heavy metals that haven’t been reported was 0.09–0.20 ng/g for Ti, 0.002–0.26 ng/g for V, 5.51 ng/g for Cr, 0.43–1.31 ng/g for Cu, 0.002–0.76 ng/g for As, 0.95 ng/g for Se, 0.02 ng/g for Cd, 0.24–1.96 ng/g for Sb and 0.32 ng/g for Tl.
Overall, there were 24 elements detected from the studied filaments and 23 from particles, with 21 elements found in both samples; Fe, Ni and Mo were only found in filaments and Se and Tl only in particles. Factors of metal partitioning from filament to particle calculated using Eq. (4) are shown in Fig. 2, assuming elements in particle were solely from the filament. Detailed comparison of concentrations in filament and particle is in Fig. A.1. Silicon was the most abundant element in particles with its weight fraction reaching up to 35.9 % (Green PLA2), it had the highest partition factor for all Si-containing filaments (825 to 7780 ppm) except Bronze PLA1 (39.1 ppm). Note that Si is widely used in industrial and consumer products and may be released from the printer itself during operation.
Fig. 2.

Partition factor of each metal element transferred from filament to particle.
For metal composite filaments (i.e., Bronze PLA2 and 3, Metal), where the sum of metals accounted for up to 95.9 % of the filament weight, the sum of metals only accounted approximately 1–2 % (below 0.1 % when excluding Si) of the particle weight. For Metal, although the components of 17–4 stainless steel (i.e., Fe, Cr, Ni, Cu) were abundantly present in the raw filament, none of them were detected in the emitted particles; only Si was detected in both filament and particle samples with a partition factor of 918 ppm (Fig. 2). For Bronze PLA2, Cu was detected with the highest concentration in the filament, while the partition factor of Cu was 0.08 ppm. Similarly, for Bronze PLA3, the partition factors of Cu and Sn that had the highest concentrations in the filament were 0.001 and 0.004 ppm respectively (Fig. 2). This indicated metal composites in powder or particulate form tended not to be transferred from filament to airborne particles (i.e., aerosolized); this is consistent with Vance et al. (Vance et al., 2017) and Alberts et al. (Alberts et al., 2021) that the metal composites (copper and tungsten) detected in the raw filaments were not found in emitted particles. This could be due to that metal substances have boiling points (above 2500 °C for the metal composites in this study) much higher than FFF extrusion temperatures, which resulted in metal composites unlikely to evaporate and then recondense to form new nanoparticles during printing. Our previous studies suggest this is the main mechanism of nanoparticle formation for polymer-based filaments (Zhang et al., 2017; Zhang et al., 2018).
The metal concentration in particles (i.e., ) was elevated for filaments without added metal powder (i.e., three pure PLA and two Nylon composite filaments) and was the highest for Green PLA2 (48.2 % and 12.3 % when excluding Si). The concentrations in particles of unexpected metal elements (i.e., unknown metal additives not listed in the formulation) could be associated with that metal-based additives, in form of organic or inorganic compounds, may evaporate at relatively lower temperatures and transfer from filament to particle during printing. Reprocessing of ABS showed decomposition of metal stearate at 230 °C as release of stearic acid was observed, while metals were not measured in that study (Bai et al., 2012). Metals with relatively smaller molecular weight, e.g., Na, Mg, Al and Si, tended to have higher partition factors (Fig. 2). Interestingly, Cr was only detected in raw filaments for all filaments except Nylon FR which showed a relatively high partition factor.
3.4. Potential exposures and health implications
3.4.1. Exposure to metals of health concern
Heavy metals that may be toxic to humans include copper, cadmium, zinc, chromium, arsenic, cobalt, titanium, strontium, tin, vanadium, thallium, lead, which have been detected in particles generated by the 3D printing in this study. The International Agency for Research on Cancer (IARC) has listed As, Cd and Cr(VI) and their compounds as human carcinogens and Pb and Co compounds as possible carcinogens. Compounds containing Sb, As, Cd, Cr, Co, Pb, Mn, Se are among the 188 hazardous air pollutants listed by U.S. Environmental Protection Agency (EPA). The adverse health impacts associated with heavy metals include inducing oxidative stress, harm to mental and central nervous systems, damage to lungs, liver, kidneys, blood compositions and other fundamental organs; chronic exposure may lead to muscular dystrophy, Alzheimer’s disease, cancers and sclerosis, depending on dose, exposure route, chemical species, and characteristics of exposed individuals (Vardhan et al., 2019; Tchounwou et al., 2012).
Due to the limited existing metal composition data on 3D printing emitted particles, estimated metal exposure from this study was compared to those indoor and outdoor studies on PM2.5 (particulate matters smaller than 2.5 μm in size), as well as reference values in indoor and outdoor ambient air quality regulations and guidance documents. Exposure in the residential scenario of seven heavy metals that are associated with health concerns is shown in Fig. 3, where examples of residential indoor and outdoor PM2.5 exposures reported globally are also included as a comparison. Exposure concentrations to Mn, Cd, and Pb for 3D printing in the residential scenario were smaller than previous studies, except one case in an unoccupied apartment in a retirement facility that had a low Cd exposure concentration; see Fig. 3 for site information. There were some cases when exposure concentrations of Zn and As from 3D printing were higher than the median values for those in children’s bedrooms with air cleaner filtration, which were Green PLA2 and Metal filaments for Zn and Nylon FR for As. Exposure concentrations of Cu were comparable to lower exposure cases reported previously. In addition, Cr (Nylon FR) exposure was higher than 7 out of 9 cases reported from previous studies (Fig. 3). Residential exposures to Ti and V from 3D printing were generally lower than reported residential and ambient exposures (Stranger et al., 2009; Hassanvand et al., 2015; Graney et al., 2004; Brehmer et al., 2020), while the exposure levels to Co and Sb were comparable to indoor PM2.5 in residences and kindergartens (Graney et al., 2004; Brehmer et al., 2020; Mainka and Fantke, 2022). Residential exposure to Se from 3D printing (1.02 ng/m3), though a non-metal element but with potential health impacts, was on the low- end compared to global ambient PM2.5 data (0.04–67.4 ng/m3) (McNeill et al., 2020) while higher than those measured indoors and outdoors by Hassanvand et al. (Hassanvand et al., 2015) Note that tin and thallium that are not typically measured for PM2.5 compositions could have higher residential exposure levels from 3D printing (1.54–4.45 ng/m3 for Sn and 2.96 ng/m3 for Tl) than the reported data on residential and ambient PM2.5 (Cakmak et al., 2014; Drago et al., 2018). The modeled office and school environments had lower estimated concentrations due to their larger volume and higher ventilation than the residential condition (Table A.2), thus estimated metal exposures were less than typical literature reported data (Stranger et al., 2009; Hassanvand et al., 2015; Graney et al., 2004; Brehmer et al., 2020; McNeill et al., 2020; Theakston, 2000).
Fig.3.

Potential metal and PM2.5 exposures for a residential scenario, comparing to previous studies on residential indoor and outdoor PM2.5. Reference values are presented as the range of reported means or medians. Sampling sites in references are living rooms in residential houses in Belgium (mean) (Stranger et al., 2009), a common room in a retirement home and a multipurpose room in a school dormitory in Iran (mean for metals and median for PM2.5) (Hassanvand et al., 2015), an unoccupied apartment in a retirement facility in the US (mean) (Graney et al., 2004), and children’s bedrooms with and without air cleaner filtration in China (median) (Brehmer et al., 2020).
Model estimated exposure concentrations were compared to standards and recommended levels for acute and chronic health impacts, considering 3D printers can be operated for extended hours and used repeatedly over time. Exposure concentrations for all indoor scenarios were below the limit values listed by various organizations, which are Mn (0.15 μg/m3), As (6 ng/m3), Cd (5 ng/m3) and Pb (0.5 μg/m3) from the World Health Organization (WHO) air quality guidelines for Europe and European Union (EU) ambient air quality standards; Cd (0.00001 mg/m3), As (0.00003 mg/m3), Mn (0.00005 mg/m3) and Sb (0.0002 mg/m3) from U.S. EPA chronic noncancer reference concentrations; Cd (0.00001 mg/m3), Sb (0.0003 mg/m3) from Agency for Toxic Substances and Disease Registry (ATSDR) minimal risk levels for chronic exposure; and Pb (0.15 μg/m3) from the US National Ambient Air Quality Standards (NAAQS). Furthermore, these concentrations were also all below the occupational regulation levels listed by Occupational Safety and Health Administration (OSHA), NIOSH and American Conference of Governmental Industrial Hygienists (ACGIH®), ranging from 0.002 to 5 mg/m3 for Al, Si, V, Cr, Mn, Co, Cu, As, Se, Cd, Sn, Sb, Tl and Pb. Previous field studies also showed low metal exposure (e.g., Al, Fe) in workplaces (Zisook et al., 2020; Stefaniak et al., 2019a; Stefaniak et al., 2019b). However, personal exposure concentrations could be elevated when a person is closer to an operating printer, or at less ventilated area in a not-well-mixed environment. Assuming within 1 m3 of the printer at a residential air change rate (0.23 h−1), exposure concentration to Cd (6.19 ng/m3) was higher than the WHO and EU limit value. In addition, personal exposure concentration to As (0.35–24 ng/m3) could be higher than the concentration assessed for excess lifetime risk level at 1:100,000 (6.6 ng/m3) (Theakston, 2000) and the chronic inhalation reference exposure level (0.015 μg/m3) listed by California Office of Environmental Health Hazard Assessment (OEHHA).
3.4.2. Exposure to airborne particles
The studied 3D printers and filaments emitted mainly ultrafine to fine particles, with averaged geometric mean diameters ranging from 27.3 to 338 nm for different filaments (Table A.1). The estimated particle number concentrations ranged from 1.14 × 10⁹ to 7.85 × 10¹¹ m−3 for the residential home, 3.54 × 10⁸ to 2.45 × 10¹¹ m−3 for the office and 1.17 × 10⁸ to 8.06 × 10¹⁰ m−3 for the school setting (see Table A.3 for details). Due to the lack of reference levels on particle number-based exposure data, we also estimated particle mass-based concentration indoors. The estimated total particle concentrations were 0.13 to 211 μg/m3 varied by filaments and environmental conditions (Table A.2); exposure concentrations for the residential scenario are shown in Fig. 3. Residential exposure to PM2.5 was lower for 3D printing emitted particles from the two green PLA and two Nylon filaments, while the three bronze PLA filaments had comparable exposure levels to previously reported outdoor and indoor cases; additionally, the Metal filament generated residential PM2.5 exposure much higher than reported data (Fig. 3). All estimated concentrations were below the OSHA Permissible Exposure Limit and NIOSH Recommended Exposure Limit (5 mg/m3) and ACGIH® Threshold Limit Value® (1 mg/m3) for respirable particulate fraction. NAAQS require a daily average PM2.5 level of 35 μg/m3, which was exceeded for Bronze PLA3 for residential scenario (39.8 μg/m3) and Metal for both residential (211 μg/m3) and office (65.9 μg/m3) scenarios; furthermore, Metal for residential scenario also exceeded NAAQS daily average PM10 (smaller than 10 μm in size) level (150 μg/m3). The standards for annual PM2.5 are 12 μg/m3 (primary) and 15 μg/m3 (secondary) from NAAQS, 5 μg/m3 (long-term) and 15 μg/m3 (short-term) from the WHO and 20 μg/m3 from the EU. Compared to these values, additional exceedance cases were found, which included Bronze PLA1 and 2 in residential and office, Bronze PLA3 in office, Nylon FR in residential and Metal in school environments (Fig. 3 and Table A.2).
The estimated metal exposure concentrations were generally on the low-end or lower than typically reported indoor and outdoor PM, which results from emission yields for heavy metals being generally low, mostly below 1 ng/g. However, although metal exposures from 3D printing appeared low, the estimated total particle exposure concentrations could be higher than the reported indoor and outdoor PM2.5 exposures and even exceeded global air quality standards for some cases. This was due to the heavy metals (15 detected metals between Ti and Pb) only accounting for 0.01–0.55 % of the particle mass and the majority of particle mass was contributed by other components. Crustal elements like Na, Mg, Al, Si, Ca, K were found to have relatively higher yields from 3D printing, however, due to their abundancy in the environments and less potential health concerns, they tended to be less typically monitored. Residential exposure to Na, Mg, Al and Ca could be comparable to previously measured indoor and outdoor ambient PM2.5 globally (McNeill et al., 2020; Cakmak et al., 2014; Baxter et al., 2007). Overall, total particle exposure was driven by emission levels (i.e., particle mass emission rate, Table A.1) and modeled environment conditions. Therefore, bronze PLA and Metal filaments that emitted larger particles tended to have higher mass emission rates and thus higher total particle exposures; in addition, a smaller space with a less air change rate (e.g., a residential condition) tended to have higher total particle exposures. However, the exposure estimations did not consider particle size effects on toxicity; exposure to metals in ultrafine particles (which is the size for the majority of 3D printing emitted particles) are potentially more toxic than larger particles (e.g., dust and ambient PM2.5) due to the distinct properties of ultrafine particles (Zhang et al., 2003). A study on particle toxicity correlation with metal composition may be merited to further understand possible metal health impacts. However, these results show that filament additives (composites) that have low volatilities, such as metals, are not efficiently transferred to the ultrafine particles formed during the printing process.
4. Conclusions
In this study, we characterized the metal composition of particles emitted from material extrusion 3D printers using a chamber setup and a standardized emission testing method. High levels of crustal metals (e.g., Na, Mg, Al and Si) were detected from the collected particles, with Si having the highest concentrations and largest emission yields for all of the studied filaments. Heavy metals that have health concerns, like Cr, Mn, Cu, Zn, As, Pb, Cd, and Co, were also detected, though with relatively lower concentrations. We found that the metals in particles were contributed from the raw filament material as well as from the printer itself. Contribution from the printers ranged from 44 % to 100 % depending on printer brand and filament used, with B, As, and Pb more likely associated with the printers. The alkali and alkaline metals with relatively higher partitioning factors were likely associated with unknown metal additive compounds in raw filaments that potentially served as precursors of particle formation. On the other hand, the metal powder added in composite filaments, e.g., stainless steel and bronze, showed low partitioning factors and were less likely to be aerosolized and released during printing, although they accounted for higher weight fraction in raw filaments.
Combining the metal compositions of the emitted particles and the low emission yields for heavy metals, residential exposure concentrations associated with heavy metals were estimated to be generally on the low end or lower than those typically found from residential scenarios; additionally, office and school estimations were even lower than the residential scenario. Our model estimations indicated low potential of exceedance of metal exposure due to 3D printing comparing to existing standards and regulations. However, total inhalable PM2.5 exposure concentrations could be higher than typical indoor levels and air quality standards for some scenarios. In addition, it should be noted that under certain circumstances, exposure hazards could be elevated; examples include staying close to an operating printer, printing at an extrusion temperature higher than the recommended setting (likely results in higher emissions), staying in a zone with less ventilation in a not well-mixed place or a place with minimal ventilation, frequently repeated use, and long-term exposure. Some practical recommendations for reducing exposure to 3D printing emitted particles include: 1) select printers and filaments that are tested to be low emitting; 2) follow manufactures’ instruction for settings and operation; 3) apply sufficient ventilation in the room (ASHRAE, 2010), increase ventilation or introduce natural ventilation (open window); 4) place the printer away from return air vents or direct return air to outdoors; 5) reduce time spent close to the printer; 6) apply local exhaust, filtration or fume hood if applicable; 7) wipe the printer and surfaces near the operational area after the print is done to reduce reemission of particles from surrounding surfaces at a later time.
Supplementary Material
HIGHLIGHTS.
3D printing emits ultrafine particles that pose an indoor exposure hazard.
Heavy metals with health concerns are released in particle emissions.
Metal emissions are associated with additive compounds rather than metal powder.
Both raw filament and printer itself contribute to particle metal emissions.
Estimated indoor exposure to inhalable particles can exceed air quality standards.
Acknowledgement
This work was funded by Chemical Insights Research Institute of Underwriters Laboratories Inc. Any opinions expressed in this paper are those of the authors and do not, necessarily, reflect the official positions and policies of the U.S. EPA. Any mention of products, trade names, or services does not constitute recommendation for use by the U.S. EPA.
Footnotes
CRediT authorship contribution statement
Qian Zhang: Conceptualization, Methodology, Investigation, Writing – original draft, Writing – review & editing, Visualization. Rodney J. Weber: Conceptualization, Writing – original draft, Writing – review & editing. Todd P. Luxton: Conceptualization, Methodology, Resources, Writing – review & editing, Supervision. Derek M. Peloquin: Methodology, Investigation, Writing – review & editing. Eric J. Baumann: Methodology, Investigation, Writing – review & editing. Marilyn S. Black: Resources, Writing – review & editing, Supervision, Project administration, Funding acquisition.
Declaration of competing interest
The authors declare that they have no known competing financial interests or personal relationships that could have appeared to influence the work reported in this paper.
Appendix A. Supplementary data
Supplementary data to this article can be found online at https://doi.org/10.1016/j.scitotenv.2022.160512.
Data availability
Data will be made available on request.
References
- Alberts E, Ballentine M, Barnes E, Kennedy A, 2021. Impact of metal additives on particle emission profiles from a fused filament fabrication 3D printer. Atmos. Environ 244, 117956. 10.1016/j.atmosenv.2020.117956. [DOI] [Google Scholar]
- ANSI, 2019. ANSI/CAN/UL 2904 Standard Method for Testing And Assessing Particle And Chemical Emissions From 3D Printers. American National Standards Institute, Washington DC, USA. [Google Scholar]
- ASHRAE, 2010. ANSI/ASHRAE Standard 62.1–2010 Ventilation for Acceptable Indoor Air Quality. American Society of Heating, Refrigerating and Air-Conditioning Engineers, Inc., Atlanta, GA, USA. [Google Scholar]
- ASTM International, 2013. ASTM D6670–13 Standard Practice for Full-scale Chamber Determination of Volatile Organic Emissions From Indoor Materials/Products. West Conshohocken, PA, USA, ASTM International. [Google Scholar]
- Azimi P, Zhao D, Pouzet C, Crain NE, Stephens B, 2016. Emissions of ultrafine particles and volatile organic compounds from commercially available desktop three-dimensional printers with multiple filaments. Environ. Sci. Technol 50 (3), 1260–1268. 10.1021/acs.est.5b04983. [DOI] [PubMed] [Google Scholar]
- Bai X, Stein BK, Smith K, Isaac DH, 2012. Effects of reprocessing on additives in ABS plastics, detected by gas chromatography/mass spectrometry. Prog. Rubber Plast. Recycl 28 (1), 14. [Google Scholar]
- Baxter LK, Clougherty JE, Laden F, Levy JI, 2007. Predictors of concentrations of nitrogen dioxide, fine particulate matter, and particle constituents inside of lower socioeconomic status urban homes. J. Expo. Sci. Environ. Epidemiol 17 (5), 433–444. 10.1038/sj.jes.7500532. [DOI] [PubMed] [Google Scholar]
- Bharti N, Singh S, 2017. Three-dimensional (3D) printers in libraries: perspective and preliminary safety analysis. J. Chem. Educ 94 (7), 879–885. 10.1021/acs.jchemed.6b00745. [DOI] [Google Scholar]
- Brehmer C, Norris C, Barkjohn KK, Bergin MH, Zhang J, Cui X, Teng Y, Zhang Y, Black M, Li Z, Shafer MM, Schauer JJ, 2020. The impact of household air cleaners on the oxidative potential of PM2.5 and the role of metals and sources associated with indoor and outdoor exposure. Environ. Res 181, 108919. 10.1016/j.envres.2019.108919. [DOI] [PubMed] [Google Scholar]
- Cakmak S, Dales R, Kauri LM, Mahmud M, Van Ryswyk K, Vanos J, Liu L, Kumarathasan P, Thomson E, Vincent R, Weichenthal S, 2014. Metal composition of fine particulate air pollution and acute changes in cardiorespiratory physiology. Environ. Pollut 189, 208–214. 10.1016/j.envpol.2014.03.004. [DOI] [PubMed] [Google Scholar]
- Chan FL, House R, Kudla I, Lipszyc JC, Rajaram N, Tarlo SM, 2018. Health survey of employees regularly using 3D printers. Occup. Med. (Lond.) 68 (3), 211–214. 10.1093/occmed/kqy042. [DOI] [PubMed] [Google Scholar]
- Chýlek R, Kudela L, Pospíšil J, Šnajdárek L, 2021. Parameters influencing the emission of ultrafine particles during 3D printing. Int. J. Environ. Res. Public Health 18 (21), 11670. 10.3390/ijerph182111670. [DOI] [PMC free article] [PubMed] [Google Scholar]
- Davis AY, Zhang Q, Wong JPS, Weber RJ, Black MS, 2019. Characterization of volatile organic compound emissions from consumer level material extrusion 3D printers. Build. Environ 160, 106209. 10.1016/j.buildenv.2019.106209. [DOI] [Google Scholar]
- Donaldson K, Li XY, MacNee W, 1998. Ultrafine (nanometre) particle mediated lung injury. J. Aerosol Sci 29 (5), 553–560. [Google Scholar]
- Drago G, Perrino C, Canepari S, Ruggieri S, L’Abbate L, Longo V, Colombo P, Frasca D, Balzan M, Cuttitta G, Scaccianoce G, Piva G, Bucchieri S, Melis M, Viegi G, Cibella F, Balzan M, Bilocca D, Borg C, Montefort S, Zammit C, Bucchieri S, Cibella F, Colombo P, Cuttitta G, Drago G, Ferrante G, L’Abbate L, Grutta SL, Longo V, Melis MR, Ruggieri S, Viegi G, Minardi R, Piva G, Ristagno R, Rizzo G, Scaccianoce G, 2018. Relationship between domestic smoking and metals and rare earth elements concentration in indoor PM2.5. Environ. Res 165, 71–80. 10.1016/j.envres.2018.03.026. [DOI] [PubMed] [Google Scholar]
- Du Preez S, Johnson A, LeBouf RF, Linde SJ, Stefaniak AB, Du Plessis J, 2018. Exposures during industrial 3-D printing and post-processing tasks. Rapid Prototyp. J 24 (5), 865–871. 10.1108/RPJ-03-2017-0050. [DOI] [Google Scholar]
- Farcas MT, Stefaniak AB, Knepp AK, Bowers L, Mandler WK, Kashon M, Jackson SR, Stueckle TA, Sisler JD, Friend SA, Qi C, Hammond DR, Thomas TA, Matheson J, Castranova V, Qian Y, 2019. Acrylonitrile butadiene styrene (ABS) and polycarbonate (PC) filaments three-dimensional (3-D) printer emissions-induced cell toxicity. Toxicol. Lett 317, 1–12. 10.1016/j.toxlet.2019.09.013. [DOI] [PMC free article] [PubMed] [Google Scholar]
- Farcas MT, McKinney W, Qi C, Mandler KW, Battelli L, Friend SA, Stefaniak AB, Jackson M, Orandle M, Winn A, Kashon M, LeBouf RF, Russ KA, Hammond DR, Burns D, Ranpara A, Thomas TA, Matheson J, Qian Y, 2020. Pulmonary and systemic toxicity in rats following inhalation exposure of 3-D printer emissions from acrylonitrile butadiene styrene (ABS) filament. Inhal. Toxicol 32 (11–12), 403–418. 10.1080/08958378.2020.1834034. [DOI] [PMC free article] [PubMed] [Google Scholar]
- Floyd EL, Wang J, Regens JL, 2017. Fume emissions from a low-cost 3-D printer with various filaments. J. Occup. Environ. Hyg 14 (7), 523–533. 10.1080/15459624.2017.1302587. [DOI] [PubMed] [Google Scholar]
- Fortoul TI, Rodriguez-Lara V, Gonzalez-Villalva A, Rojas-Lemus M, Colin-Barenque L, Bizarro-Nevares P, García-Peláez I, Ustarroz-Cano M, López-Zepeda S, Cervantes-Yépez S, López-Valdez N, Meléndez-García N, Espinosa-Zurutuza M, Cano-Gutierrez G, Cano-Rodríguez MC, 2015. Health Effects of Metals in Particulate Matter. IntechOpen, London, UK: 10.5772/59749. [DOI] [Google Scholar]
- Graney JR, Landis MS, Norris GA, 2004. Concentrations and solubility of metals from indoor and personal exposure PM2.5 samples. Atmos. Environ 38 (2), 237–247. 10.1016/j.atmosenv.2003.09.052. [DOI] [Google Scholar]
- Grass RN, Limbach LK, Athanassiou EK, Stark WJ, 2010. Exposure of aerosols and nanoparticle dispersions to in vitro cell cultures: a review on the dose relevance of size, mass, surface and concentration. J. Aerosol Sci 41 (12), 1123–1142. 10.1016/j.jaerosci.2010.10.001. [DOI] [Google Scholar]
- Hassanvand MS, Naddafi K, Faridi S, Nabizadeh R, Sowlat MH, Momeniha F, Gholampour A, Arhami M, Kashani H, Zare A, Niazi S, Rastkari N, Nazmara S, Ghani M, Yunesian M, 2015. Characterization of PAHs and metals in indoor/outdoor PM10/PM2.5/PM1 in a retirement home and a school dormitory. Sci. Total Environ 527–528, 100–110. 10.1016/j.scitotenv.2015.05.001. [DOI] [PubMed] [Google Scholar]
- House R, Rajaram N, Tarlo SM, 2017. Case report of asthma associated with 3D printing. Occup. Med. (Lond.) 67 (8), 652–654. 10.1093/occmed/kqx129. [DOI] [PubMed] [Google Scholar]
- Karwasz A, Osiński Filip, Łukaszewski K, 2022. Pollutants emitted from 3D printers onto operators. Sustainability 14 (3), 1400. 10.3390/su14031400. [DOI] [Google Scholar]
- Kim Y, Yoon C, Ham S, Park J, Kim S, Kwon O, Tsai P-J, 2015. Emissions of nanoparticles and gaseous material from 3D printer operation. Environ. Sci. Technol 49 (20), 12044–12053. 10.1021/acs.est.5b02805. [DOI] [PubMed] [Google Scholar]
- Kwon O, Yoon C, Ham S, Park J, Lee J, Yoo D, Kim Y, 2017. Characterization and control of nanoparticle emission during 3D printing. Environ. Sci. Technol 51 (18), 10357–10368. 10.1021/acs.est.7b01454. [DOI] [PubMed] [Google Scholar]
- Mainka A, Fantke P, 2022. Preschool children health impacts from indoor exposure to PM2.5 and metals. Environ. Int 160, 107062. 10.1016/j.envint.2021.107062. [DOI] [PubMed] [Google Scholar]
- McNeill J, Snider G, Weagle CL, Walsh B, Bissonnette P, Stone E, Abboud I, Akoshile C, Anh NX, Balasubramanian R, Brook JR, Coburn C, Cohen A, Dong J, Gagnon G, Garland RM, He K, Holben BN, Kahn R, Kim JS, Lagrosas N, Lestari P, Liu Y, Jeba F, Joy KS, Martins JV, Misra A, Norford LK, Quel EJ, Salam A, Schichtel B, Tripathi SN, Wang C, Zhang Q, Brauer M, Gibson MD, Rudich Y, Martin RV, 2020. Large global variations in measured airborne metal concentrations driven by anthropogenic sources. Sci. Rep 10 (1), 21817. 10.1038/s41598-020-78789-y. [DOI] [PMC free article] [PubMed] [Google Scholar]
- Nel A, Xia T, Mädler L, Li N, 2006. Toxic potential of materials at the nanolevel. Science 311 (5761), 622–627. 10.1126/science.1114397. [DOI] [PubMed] [Google Scholar]
- Poikkimäki M, Koljonen V, Leskinen N, Närhi M, Kangasniemi O, Kausiala O, Dal Maso M, 2019. Nanocluster aerosol emissions of a 3D printer. Environ. Sci. Technol 53 (23), 13618–13628. 10.1021/acs.est.9b05317. [DOI] [PubMed] [Google Scholar]
- Rao C, Gu F, Zhao P, Sharmin N, Gu H, Fu J, 2017. Capturing PM2.5 emissions from 3D printing via nanofiber-based air filter. Sci. Rep 7 (1), 10366. 10.1038/s41598-017-10995-7. [DOI] [PMC free article] [PubMed] [Google Scholar]
- Schrand AM, Rahman MF, Hussain SM, Schlager JJ, Smith DA, Syed AF, 2010. Metal-based nanoparticles and their toxicity assessment. WIREs Nanomed. Nanobiotechnol 2 (5), 544–568. 10.1002/wnan.103. [DOI] [PubMed] [Google Scholar]
- Singh AV, Maharjan RS, Jungnickel H, Romanowski H, Hachenberger YU, Reichardt P, Bierkandt F, Siewert K, Gadicherla A, Laux P, Luch A, 2021. Evaluating particle emissions and toxicity of 3D pen printed filaments with metal nanoparticles as additives: in vitro and in silico discriminant function analysis. ACS Sustain. Chem. Eng 9 (35), 11724–11737. 10.1021/acssuschemeng.1c02589. [DOI] [Google Scholar]
- Stabile L, Scungio M, Buonanno G, Arpino F, Ficco G, 2017. Airborne particle emission of a commercial 3D printer: the effect of filament material and printing temperature. Indoor Air 27 (2), 398–408. 10.1111/ina.12310. [DOI] [PubMed] [Google Scholar]
- Stefaniak AB, LeBouf RF, Yi J, Ham J, Nurkewicz T, Schwegler-Berry DE, Chen BT, Wells JR, Duling MG, Lawrence RB, Martin SB, Johnson AR, Virji MA, 2017. Characterization of chemical contaminants generated by a desktop fused deposition modeling 3-dimensional printer. J. Occup. Environ. Hyg 14 (7), 540–550. 10.1080/15459624.2017.1302589. [DOI] [PMC free article] [PubMed] [Google Scholar]
- Stefaniak AB, LeBouf RF, Duling MG, Yi J, Abukabda AB, McBride CR, Nurkiewicz TR, 2017. Inhalation exposure to three-dimensional printer emissions stimulates acute hypertension and microvascular dysfunction. Toxicol. Appl. Pharmacol 335, 1–5. 10.1016/j.taap.2017.09.016. [DOI] [PMC free article] [PubMed] [Google Scholar]
- Stefaniak AB, Johnson AR, du Preez S, Hammond DR, Wells JR, Ham JE, LeBouf RF, Martin SB Jr., Duling MG, Bowers LN, Knepp AK, de Beer DJ, du Plessis JL, 2019. Insights into emissions and exposures from use of industrial-scale additive manufacturing machines. Saf. Health Work 10, 229–236. 10.1016/j.shaw.2018.10.003. [DOI] [PMC free article] [PubMed] [Google Scholar]
- Stefaniak AB, Johnson AR, du Preez S, Hammond DR, Wells JR, Ham JE, LeBouf RF, Menchaca KW, Martin SB, Duling MG, Bowers LN, Knepp AK, Su FC, de Beer DJ, du Plessis JL, 2019. Evaluation of emissions and exposures at workplaces using desktop 3-dimensional printers. J. Chem.Health Saf 26 (2), 19–30. 10.1016/j.jchas.2018.11.001. [DOI] [PMC free article] [PubMed] [Google Scholar]
- Stefaniak AB, Bowers LN, Cottrell G, Erdem E, Knepp AK, Martin S, Pretty J, Duling MG, Arnold ED, Wilson Z, Krider B, LeBouf RF, Virji MA, Sirinterlikci A, 2021. Use of 3-dimensional printers in educational settings: the need for awareness of the effects of printer temperature and filament type on contaminant releases. ACS Chem. Health Saf 28 (6), 444–456. 10.1021/acs.chas.1c00041. [DOI] [PMC free article] [PubMed] [Google Scholar]
- Steinle P, 2016. Characterization of emissions from a desktop 3D printer and indoor air measurements in office settings. J. Occup. Environ. Hyg 13 (2), 121–132. 10.1080/15459624.2015.1091957. [DOI] [PubMed] [Google Scholar]
- Stranger M, Potgietervermaak S, Vangrieken R, 2009. Particulate matter and gaseous pollutants in residences in Antwerp,Belgium. Sci. Total Environ 407 (3), 1182–1192. 10.1016/j.scitotenv.2008.10.019. [DOI] [PubMed] [Google Scholar]
- Tchounwou PB, Yedjou CG, Patlolla AK, Sutton DJ, 2012. Heavy metals toxicity and the environment. EXS 101, 133–164. 10.1007/978-3-7643-8340-4_6. [DOI] [PMC free article] [PubMed] [Google Scholar]
- Tedla G, Jarabek AM, Byrley P, Boyes W, Rogers K, 2022. Human exposure to metals in consumer-focused fused filament fabrication (FFF)/3D printing processes. Sci. Total Environ 814, 152622. 10.1016/j.scitotenv.2021.152622. [DOI] [PMC free article] [PubMed] [Google Scholar]
- Theakston F. (Ed.), 2000. Air Quality Guidelines for Europe, 2nd ed. WHO Regional Publications European Series/WHO, Regional Office for Europe. World Health Organization, Regional Office for Europe, Copenhagen. [PubMed] [Google Scholar]
- Turner A, Filella M, 2021. Hazardous metal additives in plastics and their environmental impacts. Environ. Int 156, 106622. 10.1016/j.envint.2021.106622. [DOI] [PubMed] [Google Scholar]
- Vance ME, Pegues V, Van Montfrans S, Leng W, Marr LC, 2017. Aerosol emissions from fuse-deposition modeling 3D printers in a chamber and in real indoor environments. Environ. Sci. Technol 51 (17), 9516–9523. 10.1021/acs.est.7b01546. [DOI] [PubMed] [Google Scholar]
- Vardhan KH, Kumar PS, Panda RC, 2019. A review on heavy metal pollution, toxicity and remedial measures: current trends and future perspectives. J. Mol. Liq 290, 111197. 10.1016/j.molliq.2019.111197. [DOI] [Google Scholar]
- Wu G-F, Xu M, 2014. Effects of boron compounds on the mechanical and fire properties of wood-chitosan and high-density polyethylene composites. BioResources 9 (3), 4173–4193. 10.15376/biores.9.3.4173-4193. [DOI] [Google Scholar]
- Yi J, LeBouf RF, Duling MG, Nurkiewicz T, Chen BT, Schwegler-Berry D, Virji MA, Stefaniak AB, 2016. Emission of particulate matter from a desktop three-dimensional (3D) printer. J. Toxic. Environ. Health A 79 (11), 453–465. 10.1080/15287394.2016.1166467. [DOI] [PMC free article] [PubMed] [Google Scholar]
- Yi J, Duling MG, Bowers LN, Knepp AK, LeBouf RF, Nurkiewicz TR, Ranpara A, Luxton T, Martin SB, Burns DA, Peloquin DM, Baumann EJ, Virji MA, Stefaniak AB, 2019. Particle and organic vapor emissions from Children’s 3-D pen and 3-D printer toys. Inhal. Toxicol 31 (13–14), 432–445. 10.1080/08958378.2019.1705441. [DOI] [PMC free article] [PubMed] [Google Scholar]
- Youn J-S, Seo J-W, Han S, Jeon K-J, 2019. Characteristics of nanoparticle formation and hazardous air pollutants emitted by 3D printer operations: from emission to inhalation. RSC Adv. 9 (34), 19606–19612. 10.1039/C9RA03248G. [DOI] [PMC free article] [PubMed] [Google Scholar]
- Zhang Q, Kusaka Y, Zhu X, Sato K, Mo Y, Kluz T, Donaldson K, 2003. Comparative toxicity of standard nickel and ultrafine nickel in lung after intratracheal instillation. J. Occup. Health 45, 23–30. 10.1539/joh.45.23. [DOI] [PubMed] [Google Scholar]
- Zhang Q, Wong JPS, Davis AY, Black MS, Weber RJ, 2017. Characterization of particle emissions from consumer fused deposition modeling 3D printers. Aerosol Sci. Technol 51 (11), 1275–1286. 10.1080/02786826.2017.1342029. [DOI] [Google Scholar]
- Zhang Q, Sharma G, Wong JPS, Davis AY, Black MS, Biswas P, Weber RJ, 2018. Investigating particle emissions and aerosol dynamics from a consumer fused deposition modeling 3D printer with a lognormal moment aerosol model. Aerosol Sci. Technol 52 (10), 1099–1111. 10.1080/02786826.2018.1464115. [DOI] [Google Scholar]
- Zhang Q, Pardo M, Rudich Y, Kaplan-Ashiri I, Wong JPS, Davis AY, Black MS, Weber RJ, 2019. Chemical composition and toxicity of particles emitted from a consumer-level 3D printer using various materials. Environ. Sci. Technol 53 (20), 12054–12061. 10.1021/acs.est.9b04168. [DOI] [PubMed] [Google Scholar]
- Zhu Q, Yao Q, Liu J, Sun J, Wang Q, 2020. Emissions from the fused filament fabrication 3D printing with lignocellulose/polylactic acid filament. BioResources 15 (4), 7560–7572. 10.15376/biores.15.4.7560-7572. [DOI] [Google Scholar]
- Zisook RE, Simmons BD, Vater M, Perez A, Donovan EP, Paustenbach DJ, Cyrs WD, 2020. Emissions associated with operations of four different additive manufacturing or 3D printing technologies. J. Occup. Environ. Hyg 17 (10), 464–479. 10.1080/15459624.2020.1798012. [DOI] [PubMed] [Google Scholar]
- Zontek TL, Ogle BR, Jankovic JT, Hollenbeck SM, 2017. An exposure assessment of desktop 3D printing. J. Chem. Health Saf 24 (2), 15–25. 10.1016/j.jchas.2016.05.008. [DOI] [Google Scholar]
Associated Data
This section collects any data citations, data availability statements, or supplementary materials included in this article.
Supplementary Materials
Data Availability Statement
Data will be made available on request.