Abstract
Objective:
In this work, we propose a content-based image retrieval (CBIR) method for retrieving dose distributions of previously planned patients based on anatomical similarity. Retrieved dose distributions from this method can be incorporated into automated treatment planning workflows in order to streamline the iterative planning process. As CBIR has not yet been applied to treatment planning, our work seeks to understand which current machine learning models are most viable in this context.
Approach:
Our proposed CBIR method trains a representation model that produces latent space embeddings of a patient’s anatomical information. The latent space embeddings of new patients are then compared against those of previous patients in a database for image retrieval of dose distributions. All source code for this project is available on github.
Main Results:
The retrieval performance of various CBIR methods is evaluated on a dataset consisting of both publicly available image sets and clinical image sets from our institution. This study compares various encoding methods, ranging from simple autoencoders to more recent Siamese networks like SimSiam, and the best performance was observed for the multitask Siamese network.
Significance:
Our current results demonstrate that excellent image retrieval performance can be obtained through slight changes to previously developed Siamese networks. We hope to integrate CBIR into automated planning workflow in future works.
Keywords: Deep Learning, Content-based image retrieval, Representation learning
1. Introduction
1.1. Background
The workflow for radiotherapy treatment planning typically involves an iterative, trial-and-error process for manually navigating trade-offs (Sethi 2018, Xing et al 1999). Treatment planning optimization contains multiple objectives, which are often conflicting. For this reason, no single plan can optimize performance on all objectives at once, and treatment planning can instead be conceptualized as navigating the set of Pareto optimal, nondominated solutions (Craft et al 2006, 2012, Huang et al 2021).
In an effort to reduce active planning times in treatment planning, there has been growing interest in automated methods. Many of these methods (such as the MetaPlanner (MP) framework, the Expedited Constrained Hierarchical Optimization (ECHO) system, iCycle, etc.)can be interpreted as navigating the Pareto front while guided by some utility function (Huang et al 2022, Zarepisheh et al 2019, Breedveld et al 2012, Hussein et al 2018). Such utility functions are typically designed around clinical protocols and incorporate various dose metrics to gauge treatment plan quality.
At the same time, with recent advancements in machine learning research, interest in data-driven automated treatment planning approaches has begun to surge as well. Many of these data-driven approaches have elected to replace conventional utility functions entirely, instead using an end-to-end deep learning model that produces predictions of dose distributions or dose volume histograms (DVHs) (Hussein et al 2018, Ma et al 2019, Babier et al 2021, Momin et al 2021, Shen et al 2020). In principle, data-driven methods attempt to capture the collective expertise of numerous treatment planners in their model predictions. Yet, due to the relative data scarcity in medical imaging and treatment planning datasets, data-driven methods can have many drawbacks in practice. Thus, it may not be prudent to rely entirely on end-to-end machine learning models. As a compromise, we propose a cascaded approach that first performs content-based image retrieval and then subsequently automated treatment planning.
1.2. Content-Based Image Retrieval
Content-based image retrieval (CBIR) refers to a category of methods that retrieve relevant images from a database based on analysed content of a query image. In the context of treatment planning, the problem can be framed as searching a database for relevant treatment plan information given a new patient’s anatomical information (i.e. medical images, contours, etc.), called the query image. During deployment of a CBIR method in a clinical setting, the new patient’s treatment plan has obviously not been created yet, so CBIR involves analysis of anatomical information to find the most relevant previously treated patient(s). The dose information of one or more previously treated patients that have been deemed relevant can then be used in subsequent automated planning.
CBIR uses a machine learning model to create latent space representations of the query image and images from the database(Latif et al 2019, Zin et al 2018, Dubey 2021). After computing a distance function (i.e. Euclidean distance) between the query image representation and representations of the database images, we can then sort by the closest distances (Nearest neighbour search) and return the closest images to the query (Top- images).
Unlike end-to-end methods that use machine learning predictions for the entire workflow, CBIR only utilizes deep learning for image representations and has several potential advantages. For instance, CBIR methods can be more easily adapted to clinical protocols beyond the ones seen during training. Adapting CBIR to new protocols or guidelines simply involves filtering the database that the retrieval method selects from to only include patients that follow those new desired protocols. Figure 1 provides a visualization of database filtering when deploying CBIR in a clinical setting. For the evaluation or benchmarking purposes of this manuscript, all results will be provided for an unfiltered database.
Figure 1.

Visualizes the workflow for CBIR. Given a new patient during treatment planning (i.e. query image) the method searches a filtered database to retrieve similar images. The corresponding dose distributions can then be used in subsequent automated planning.
The end-to-end machine learning methods used for treatment planning have the potential to reap the benefits of amortized inference for improved efficiency as compared to conventional methods. However, due to the practical limitations of acquiring large, heterogeneous datasets in treatment planning, using end-to-end methods may not be advisable. CBIR provides a compromise between end-to-end machine learning methods and conventional automated planning methods. To the best of our knowledge, CBIR has not previously been applied to treatment planning. As such, this work seeks to answer fundamental questions around selecting viable machine learning models for CBIR. Here, we compare several potential image encoding models for CBIR and describe their methodologies below.
2. Methods
2.1. Content-Based Image Retrieval
Content-based image retrieval (CBIR) aims to search a database for images of similar content (i.e. anatomical information) to a query image. Figure 1 provides the overall CBIR workflow as applied to treatment planning. A database of previous treatment plans is first created and stored. This database contains each patient’s anatomical information, which includes their computed tomography (CT) images and relevant contours, as well as their dose distribution. After training the image encoding model, the CBIR method is supplied a new patient’s anatomical information, the query image, which it encodes into a latent space embedding that is compared to embeddings of other patients in the database. Image embeddings (i.e. one-dimensional vector representations of each image in the latent space) with the closest Euclidean distance are then retrieved from the database (Nearest neighbour search), and the corresponding dose distribution can be used in subsequent automated planning. During deployment or real-world usage, the database is first filtered to contain plans with the relevant institution and clinical protocols. During all evaluations in this paper, the unfiltered database is used.
2.2. Image Encoding Models
The main task of the image encoding model is to extract features from the provided images. Given images , the goal is to learn an encoding function that produces a continuous latent space embedding . Here, Xrefers to a multichannel volume which consists of the CT and contours for each patient, and refers to an input from the branch , numbered in ascending order for branches going from top to bottom (i.e. refers to the second branch from the top). For the methods that utilize contrastive learning (i.e.SimSiam and the multitask Siamese network), which are presented in later sections, the input during training also includes a channel for the dose distribution. During deployment and evaluation, the input to all models only includes the CT and contours. The embedding refers to the one-dimensional vector representation of images in the latent space. In this work we evaluate the image retrieval performance of five main categories of methods. Readers looking for model design inspiration may find previous reviews of alternative image retrieval tasks to be useful(Zin et al 2018, Dubey 2021, Latif et al 2019).
Prior to training the image encoding model, standard data pre-processing is applied to each patient’s images. First, each patient’s CT volume, segmentation mask, and corresponding dose distribution are resampled to the dimensions . The segmentation masks follow a label encoding scheme (with labels ranging from 1 to 4), containing the various planning target volumes (PTVs) and relevant organs-at-risk (OARs).After resampling, each CT volume is then clipped to a soft-tissue window (400 HU width and 0 HU level) and normalized. To keep consistent with common convention in Siamese networks, we interchangeably refer to the input image as the anchor image.
This current work evaluates five main categories of image encoding models used for CBIR: (1) a vanilla autoencoder(Goodfellow et al 2016), (2) a variational autoencoder (VAE)(Zhao et al 2018), (3) a Siamese network with the triplet margin loss (Schroff et al 2015), (4) SimSiam (Chen and He 2020), and (5) a multitask Siamese network(Caruana 1997, Schroff et al 2015, Chen and He 2020). For the encoder portion of all evaluated models, we utilize the same backbone convolutional neural network (CNN) architecture (consisting of multiple convolution, GroupNorm, and LeakyReLU blocks).Similarly, the latent space embedding vector has a size that is empirically set to 1024 for all models.
2.2.1. Vanilla Autoencoder
The vanilla autoencoder consists of a standard CNN encoder and a transposed convolution decoder(Goodfellow et al 2016). Figure 2a provides a schematic of the model.
Figure2a.
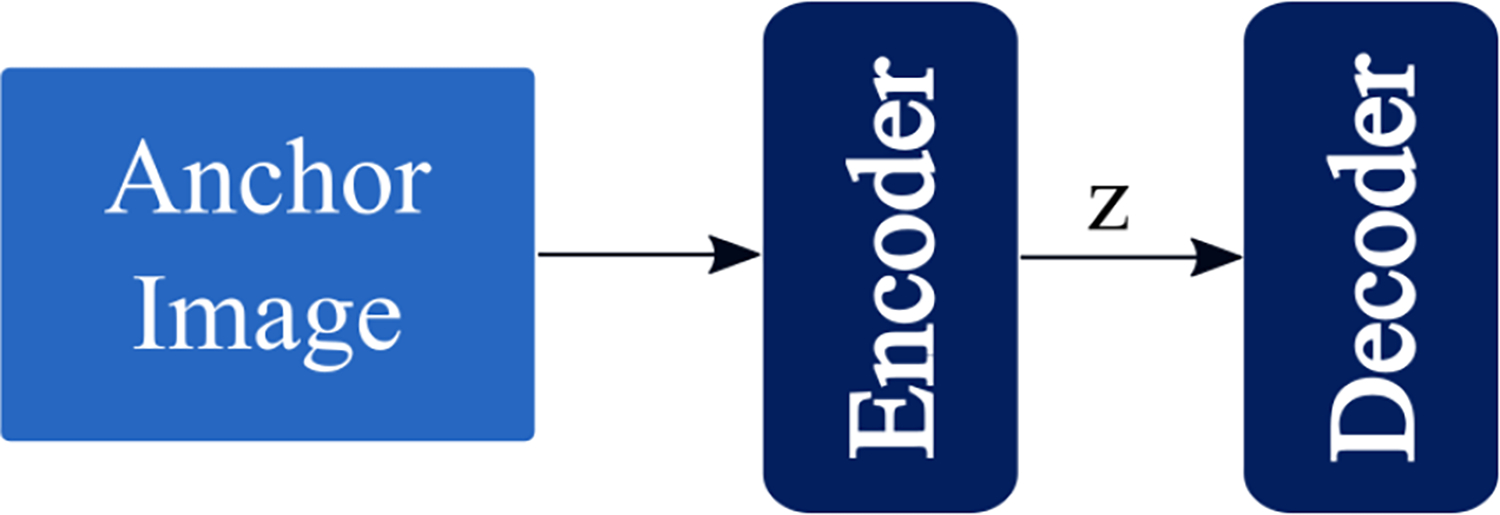
A schematic of the vanilla autoencoder model architecture.
2.2.2. Information Maximizing Variational Autoencoder
The information maximizing variational autoencoder (Info-VAE) model is a generative model which uses an additional maximum mean discrepancy (Gretton et al 2006) objective, as proposed by Zhao et al. (Zhao et al 2018). As the InfoVAE is a generative model, the typical embedding vector is a random variable sample using the reparameterization trick (Kingma and Welling 2013, Zhao et al 2018). In order to get a deterministic output, we follow the common practice of using the “” layer output as the latent space embedding vector instead of the vector .
Figure 2b provides a schematic of the InfoVAE architecture, and the loss function for the InfoVAE model is listed in Equation 1.
| (1) |
Here, the first term refers to the reconstruction loss (typically mean squared error), the second term refers to the Kullback-Leibler (KL) divergence, and the third term refers to the maximum mean discrepancy(Gretton et al 2006). refers to the prior, refers to the variational posterior, refers to the true posterior, and are hyperparameters controlling the amount of regularization, and refers to the parameters of the network(Kingma and Welling 2013, Zhao et al 2018).
Figure 2b.

A schematic of the Information-maximizing Variational Autoencoder model architecture. Outputs of the encoder are vectors describing the mean and variance of the latent space distributions.
2.2.3. Siamese Network with a Triplet Loss Function
The Siamese network with a triplet loss (SNTL)is a classic method used for CBIR (Chechik et al 2010, Schroff et al 2015). The Siamese network refers to a network which contains duplicate encoders, where each shares parameters with its duplicates. The triplet loss function is provided in Equation 2.To construct triplets, we take a sample image from the dataset (i.e. anchor image). The positive image can then be sampled by taking another image from the same class (see the Dataset Section) as the anchor image, while the negative image refers to an image of a different class than the anchor image. Figure 2c provides a schematic of the SNTL model architecture. The triplet loss function computes a distance between the embeddings for the anchor image and positive image , as well as a distance between the embeddings for the anchor image and negative image . The goal is then to make the distance between the anchor and positive embeddings at least some margin smaller than the
| (2) |
distance between the anchor and negative embeddings.
Figure 2c.
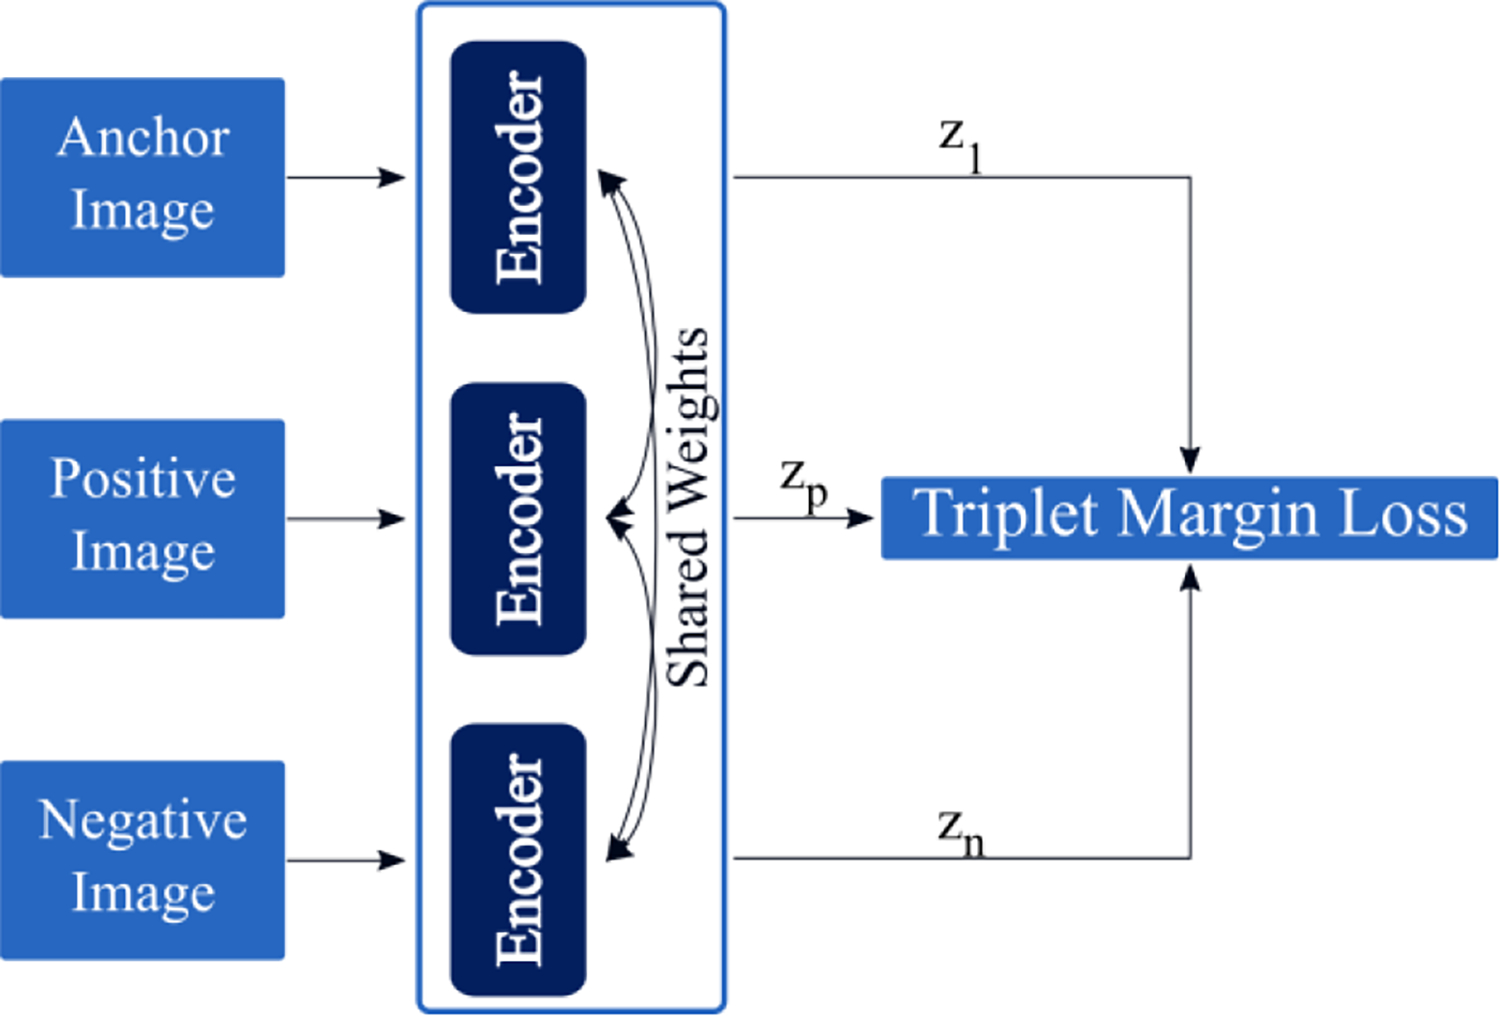
A schematic of the Siamese network with a triplet loss function.
2.2.4. Simple Siamese Network
The simple Siamese (SimSiam) network (Chen and He 2020) is a recent representation learning method that extends on previous state of the art methods like SimCLR(Chen et al 2020a) and BYOL (Grill et al 2020).SimSiam uses a stop-gradient to learn meaningful representations without the use of negative sample pairs, large batches, or momentum encoders. As these are usually difficult to obtain, utilizing an approach like SimSiam can be more practical than other recent representation learning methods. Figure 2d provides a schematic of the SimSiam model, and the loss function is listed in Equation 3. In order to incorporate information from the dose distributions during model training, we set the transformed image as a multichannel input that uses the dose distribution and contour information. This training scheme is
| (3) |
also used by the multitask approach described below.
Figure 2d.
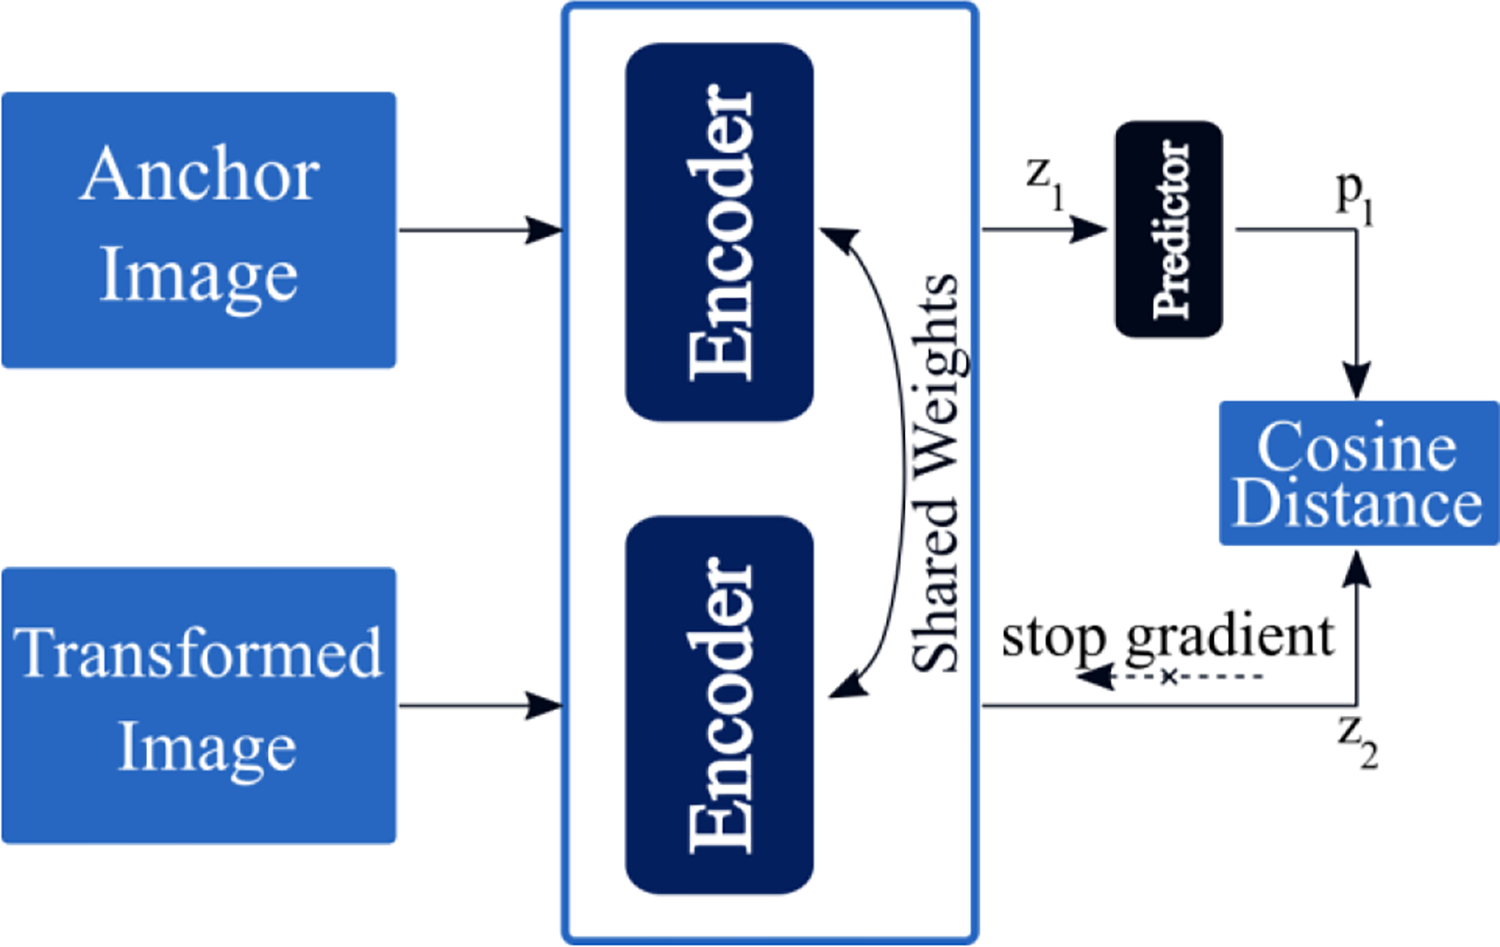
A schematic of the SimSiam network, which uses a stop gradient and the cosine distance. Here the transformed image refers to the dose distribution of patients during model training. Only the anchor image is required for deployment and evaluation.
Here, refers to the output of the predictor (h), refers to the embedding of the anchor image, and refers to the embedding of the transformed image.
2.2.5. Multitask Siamese Network
Following the typical multitask learning scheme (Caruana 1997), the multitask Siamese network (MSN) combines many of the previously mentioned approaches. Due to the small dataset size of this study, the MSN attempts to improve generalization by utilizing information from the reconstruction task, SimSiam embedding task, and the triplet loss task. Figure 2e provides a schematic of the MSN model,
| (4) |
and the loss function is provided in Equation 4.
Figure 2e.
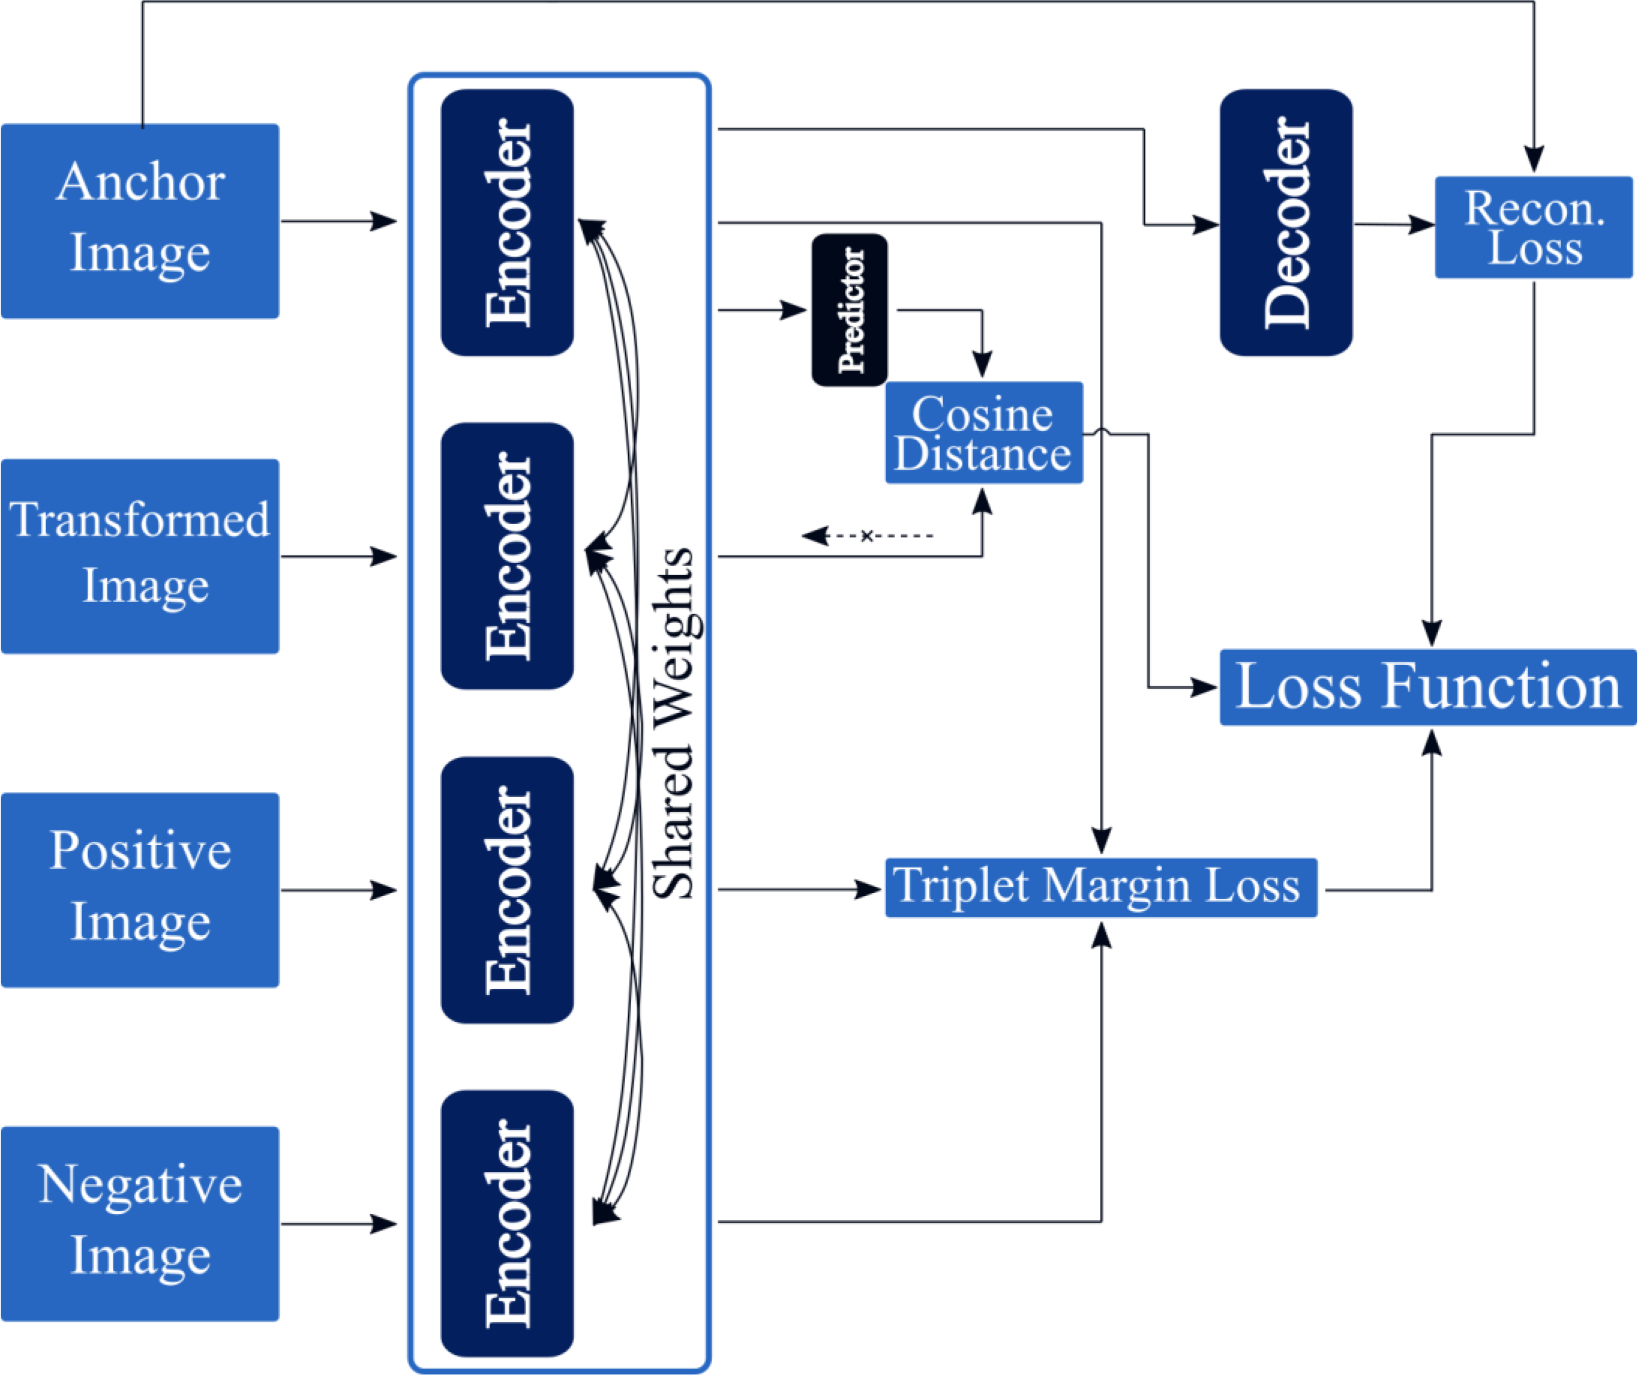
A schematic of the multitask Siamese network, which combines tasks from many of the previously discussed approaches.
In this study, and were empirically set to values of and , respectively.
2.3. Dataset
The dataset used in this study contains405 cases composed of public data (OpenKBP) (Babier et al 2021) and institutional data, which were collected as part of clinical workflow. The body sites included in this dataset are prostate and head and neck, with either volumetric modulated arc therapy (VMAT) or intensity modulated radiation therapy (IMRT) used for treatment.
For evaluation, all cases in the dataset were manually classified according to the following four criteria for a total of 32 classes:
Which body site does the case belong to (i.e. prostate or head and neck)?
How many target levels are there?
Is the primary PTV small or large?
How is the primary PTV located (i.e. left, right, center, or bilateral)?
Figure 3 provides a visualization of the workflow taken to classify patients in the dataset. Cases were split into 235 in the training phase, 43 in the validation phase, and 127 in the testing phase. Small or large labels were assigned to cases if their primary PTV was smaller or larger than the median volume measurement for the dataset. All source code for this project has been made available on github (https://github.com/chh105/MetaPlanner/tree/main/cbir).
Figure 3.
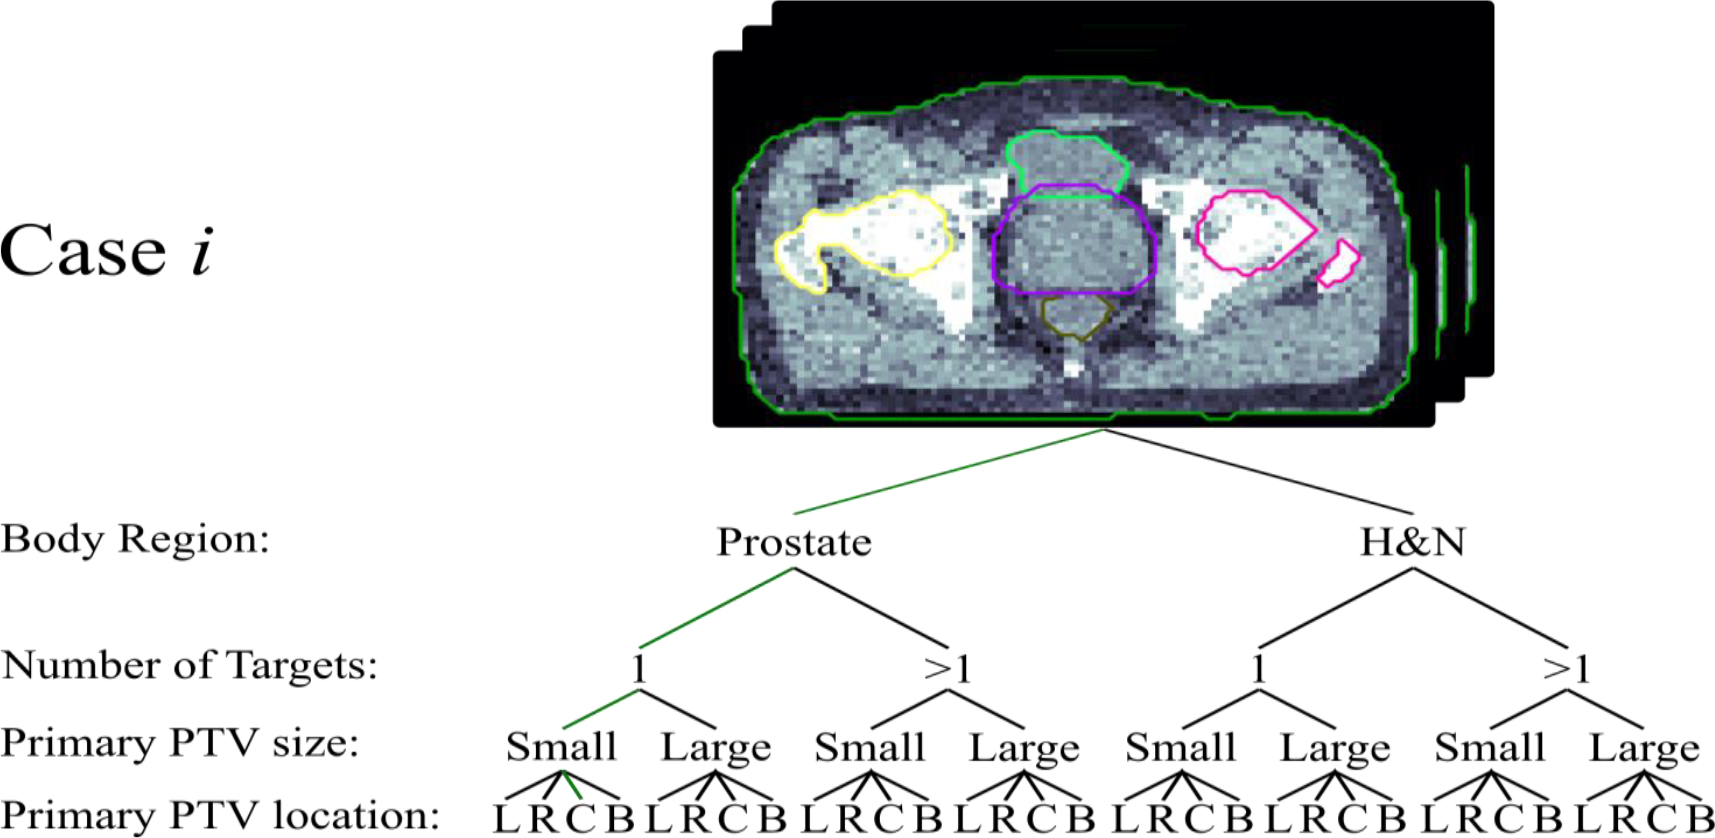
Visualizes the workflow for classifying an example patient for benchmark evaluation purposes.
2.4. Evaluation
Performance of the included image retrieval methods was evaluated for three aspects: retrieval performance, clustering performance, and qualitative performance. We begin by retrieving images from the database that have embeddings closest to that of the query image. Retrieval performance can then be evaluated using standard metrics like the classification accuracy, precision, recall, and F1-score of the top- retrieved images(Mogotsi 2010). In this study, we show results for ranging from 1 to 5, though other ranges of may also be used. The definitions for these evaluation metrics are listed in Table 1. Moreover, clustering performance is then evaluated using standard metrics like the cluster homogeneity, completeness, v-measure, adjusted Rand index, and adjusted mutual information(Rosenberg and Hirschberg 2007, Hubert and Arabie 1985, Steinley 2004, Strehl and Ghosh 2003). Lastly, qualitative performance is evaluated by visually inspecting the retrieval results for example query patients.
Table 1.
Definitions for various retrieval (multiclass) evaluation metrics. Each metric is computed for the top-k images returned by the retrieval systems.
| Definition | |
|---|---|
|
| |
| Accuracy@k | |
| Precision@k | |
| Recall@k | |
| F1 – score@k | |
|
| |
| Retrieval Score | |
tp := true positives, tn := true negatives
fp := false positives, fn := false negatives
Cluster homogeneity (Rosenberg and Hirschberg 2007) assesses the ability to create clusters that contain only members of a single class. Cluster homogeneity is bounded between [0,1], and performance of an ideal method approaches a cluster homogeneity of 1. Cluster completeness (Rosenberg and Hirschberg 2007) assesses the ability to assign all members of a class to the same cluster. Cluster completeness is bounded between [0,1], and performance of an ideal method approaches a cluster completeness of 1. V-measure (Rosenberg and Hirschberg 2007) is computed as the harmonic mean of cluster homogeneity and completeness. V-measure is bounded between [0,1], and performance of an ideal method also approaches a value of 1. The adjusted Rand index (Hubert and Arabie 1985) measures the similarity between ground truth class assignments and those of the clustering method, adjusted for chance groupings. The adjusted Rand index is bounded between [−1,1], and performance of an ideal method approaches a value of 1. Finally, the adjusted mutual information (Strehl and Ghosh 2003) measures the agreement between ground truth class assignments and those of the clustering method, adjusted for chance groupings. The adjusted mutual information is bounded between [0,1], and performance of an ideal method approaches a value of 1.
3. Results
3.1. Image Retrieval Performance
We first evaluate the image retrieval performance of the candidate image encoding models using the metrics in Table 1. Figure 4 plots accuracy, precision, recall, and F-score as functions of . Ground-truth labels for each patient are provided by following the procedure described in Section 2.3. For each metric, we can compute a simple retrieval scoring function by applying an exponential weighting to each retrieval metric. Here, greater emphasis is placed on small values of , as only the most relevant retrieved plans would be used to inform subsequent treatment planning. Values of the retrieval scoring functions are listed in Table 2.
Figure 4.
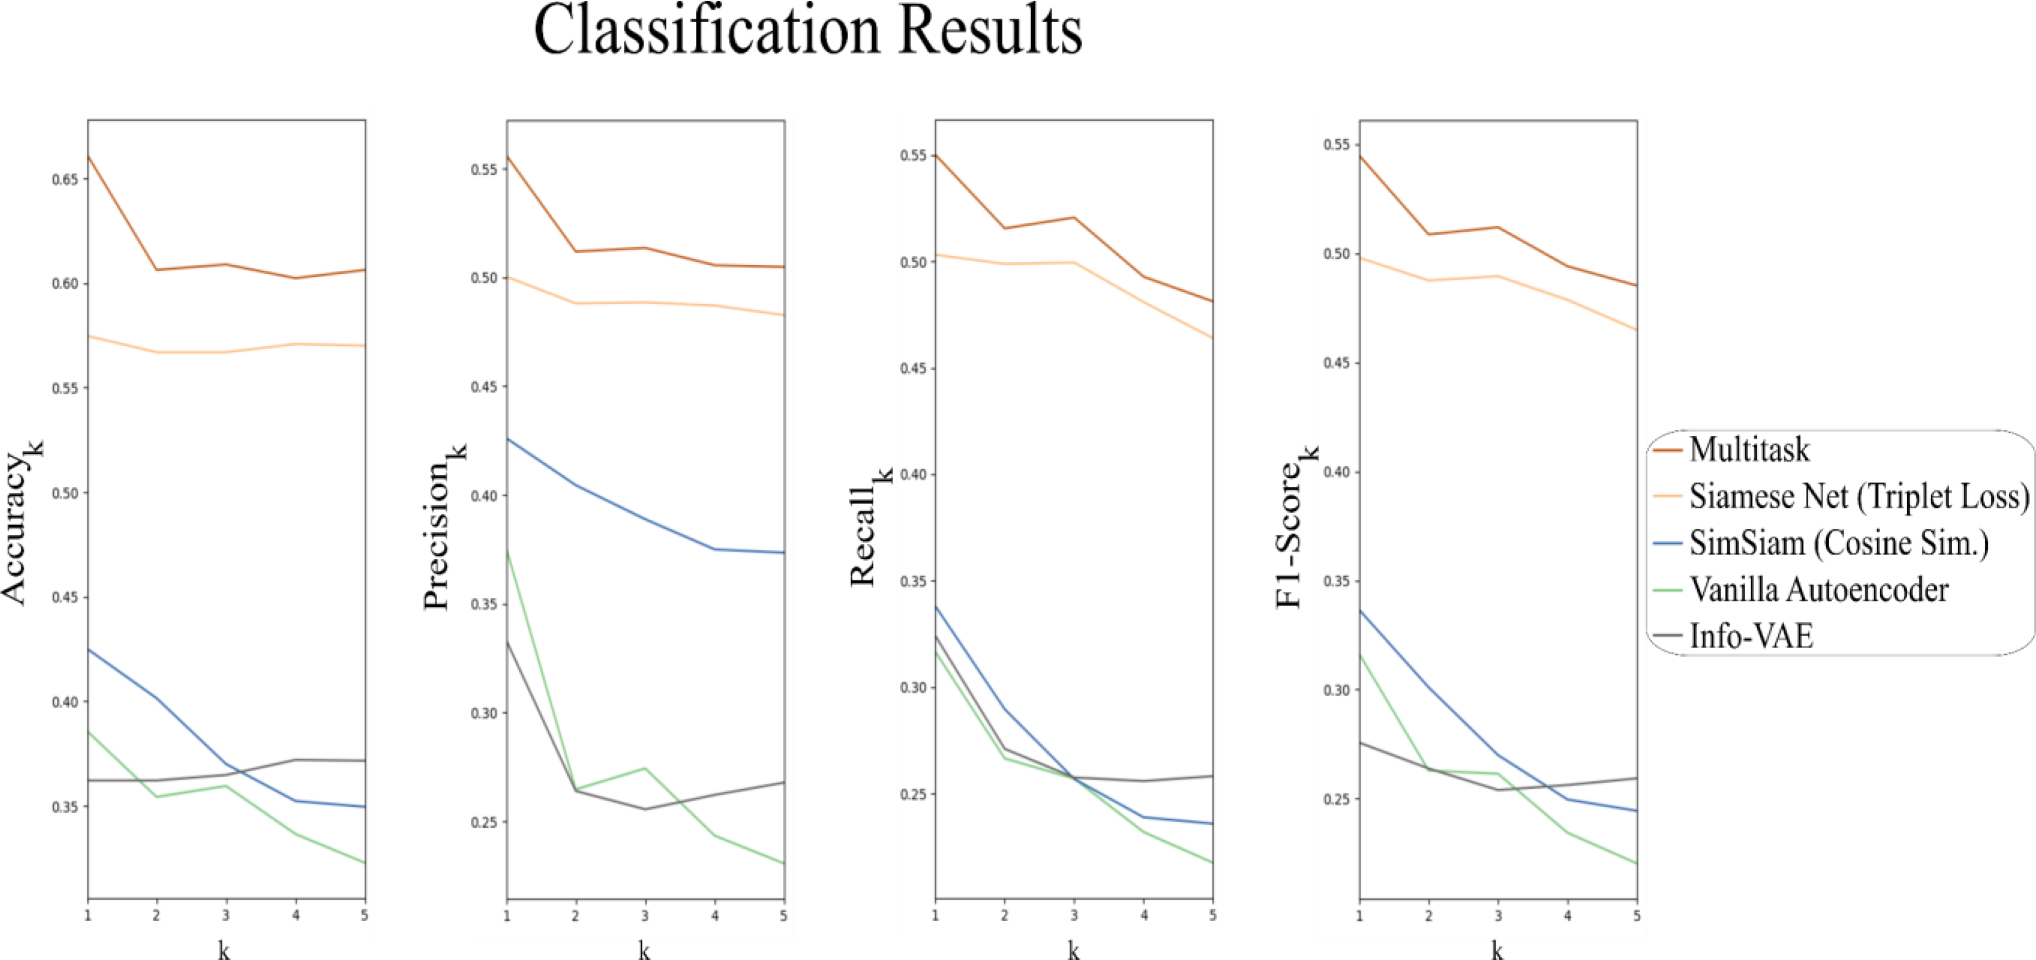
Plot of the retrieval metrics for the top-k images. For all retrieval metrics, best performance was achieved using the multitask Siamese network.
Table 2.
Performance of the candidate encoding models is evaluated in regards to retrieval and clustering. Retrieval scores are computed using an exponential weighting of each metric as a function of k. Cluster metrics are computed using standard formulas, where k=1.
| Image Retrieval Performance | Clustering Performance | ||||||||
|---|---|---|---|---|---|---|---|---|---|
|
| |||||||||
| Accuracy Retrieval Score | Precision Retrieval Score | Recall Retrieval Score | F1 Retrieval Score | Homogeneity | Completeness | V-measure | Adjusted Rand Index | Adjusted Mutual Info. | |
|
| |||||||||
| Multitask Siamese Network | 1.23 | 1.04 | 1.03 | 1.02 | 0.683 | 0.679 | 0.681 | 0.516 | 0.593 |
| Info VAE | 0.70 | 0.58 | 0.57 | 0.52 | 0.438 | 0.427 | 0.432 | 0.275 | 0.278 |
| Siamese Network (Triplet Loss) | 1.11 | 0.96 | 0.97 | 0.95 | 0.671 | 0.653 | 0.662 | 0.437 | 0.571 |
| SimSiam (Cosine Similarity) | 0.78 | 0.80 | 0.59 | 0.60 | 0.412 | 0.422 | 0.417 | 0.247 | 0.265 |
| Vanilla Autoencoder | 0.72 | 0.62 | 0.56 | 0.56 | 0.372 | 0.375 | 0.374 | 0.194 | 0.204 |
For all retrieval scores, MSN achieves the best performance. The second-best performance for all retrieval scores is achieved by the SNTL method, followed by the more recent SimSiam method. Performances for the vanilla autoencoder and Info-VAE were comparable, suggesting that the variational loss component may not be entirely useful for our image retrieval task.
3.2. Clustering Performance
We additionally evaluate clustering performance using metrics listed in the last 5 columns of Table 2 (Rosenberg and Hirschberg 2007, Hubert and Arabie 1985, Steinley 2004, Strehl and Ghosh 2003). Each score is computed on the latent space embeddings produced by the candidate methods, where ground truth labels are provided following the procedure detailed in Section 2.3 and prediction labels are computed for . Of the benchmarked encoders, the top three performers for cluster homogeneity, cluster completeness, V-measure, adjusted Rand index, and adjusted mutual information were the MSN, SNTL, and Info VAE models (Table 2). Figure 5 shows a TSNE plot of the latent space embeddings for the query set, with the evaluation class labels provided for visualization purposes (ground truth labels for all evaluations are computed following Section 2.3). Here, embeddings for the MSN are substantially more distinct and grouped than those of the other candidate models.
Figure 5.
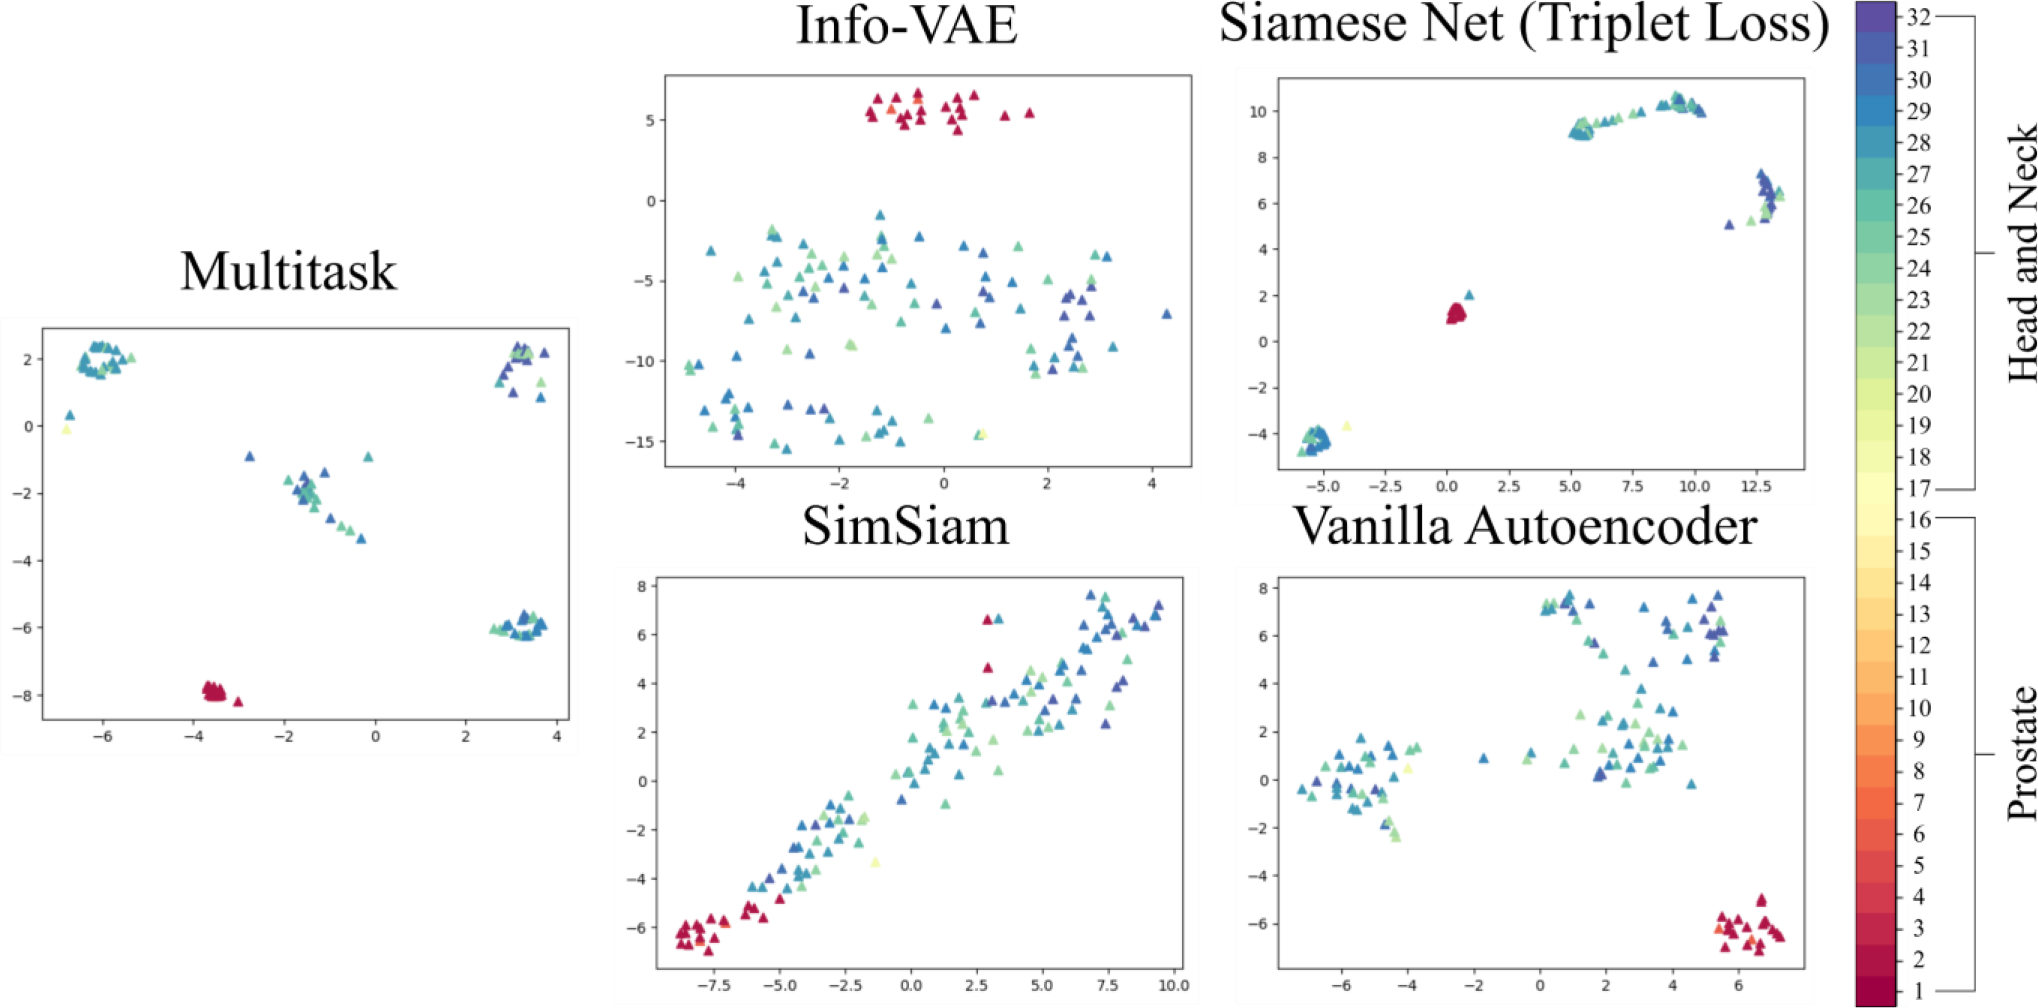
T-SNE plot visualization of the latent space embeddings of the query images computed by each of the candidate encoding models.
3.3. Qualitative Performance
A qualitative comparison of retrieved images for an example query image is provided in Figure S1 of the Supplemental Materials. This example query image is a head and neck case, has multiple PTV levels, and has a large primary PTV located on the right-side of the patient. Both the MSN and SNTL models retrieve patients of the same classification. Moreover, the retrieved patient for the MSN model is more anatomically similar to the query than that of the SNTL model. The remaining models did not retrieve patients of the same classification as the query image. For all evaluations in this current work, retrieval is performed on the unfiltered database. However, during practical deployment, the database will first be filtered by the relevant classification.
4. Discussion
Here, a CBIR framework is used to retrieve images relevant to treatment planning (i.e. CT, contours, dose distribution, etc.) from a database. These retrieved images can be subsequently used in automated treatment planning pipelines to automate the iterative adjustments of optimization hyperparameters. An example of one such automated planning method is the MetaPlanner framework (Huang et al 2022), and we provide an example workflow incorporating those methods in Figure 6. The proposed CBIR framework compares the latent space embeddings of a query image to those of images in a database for the purpose of image retrieval. To produce latent space embeddings, we evaluate various encoding models in regards to retrieval performance, clustering performance, and visual quality.
Figure 6.
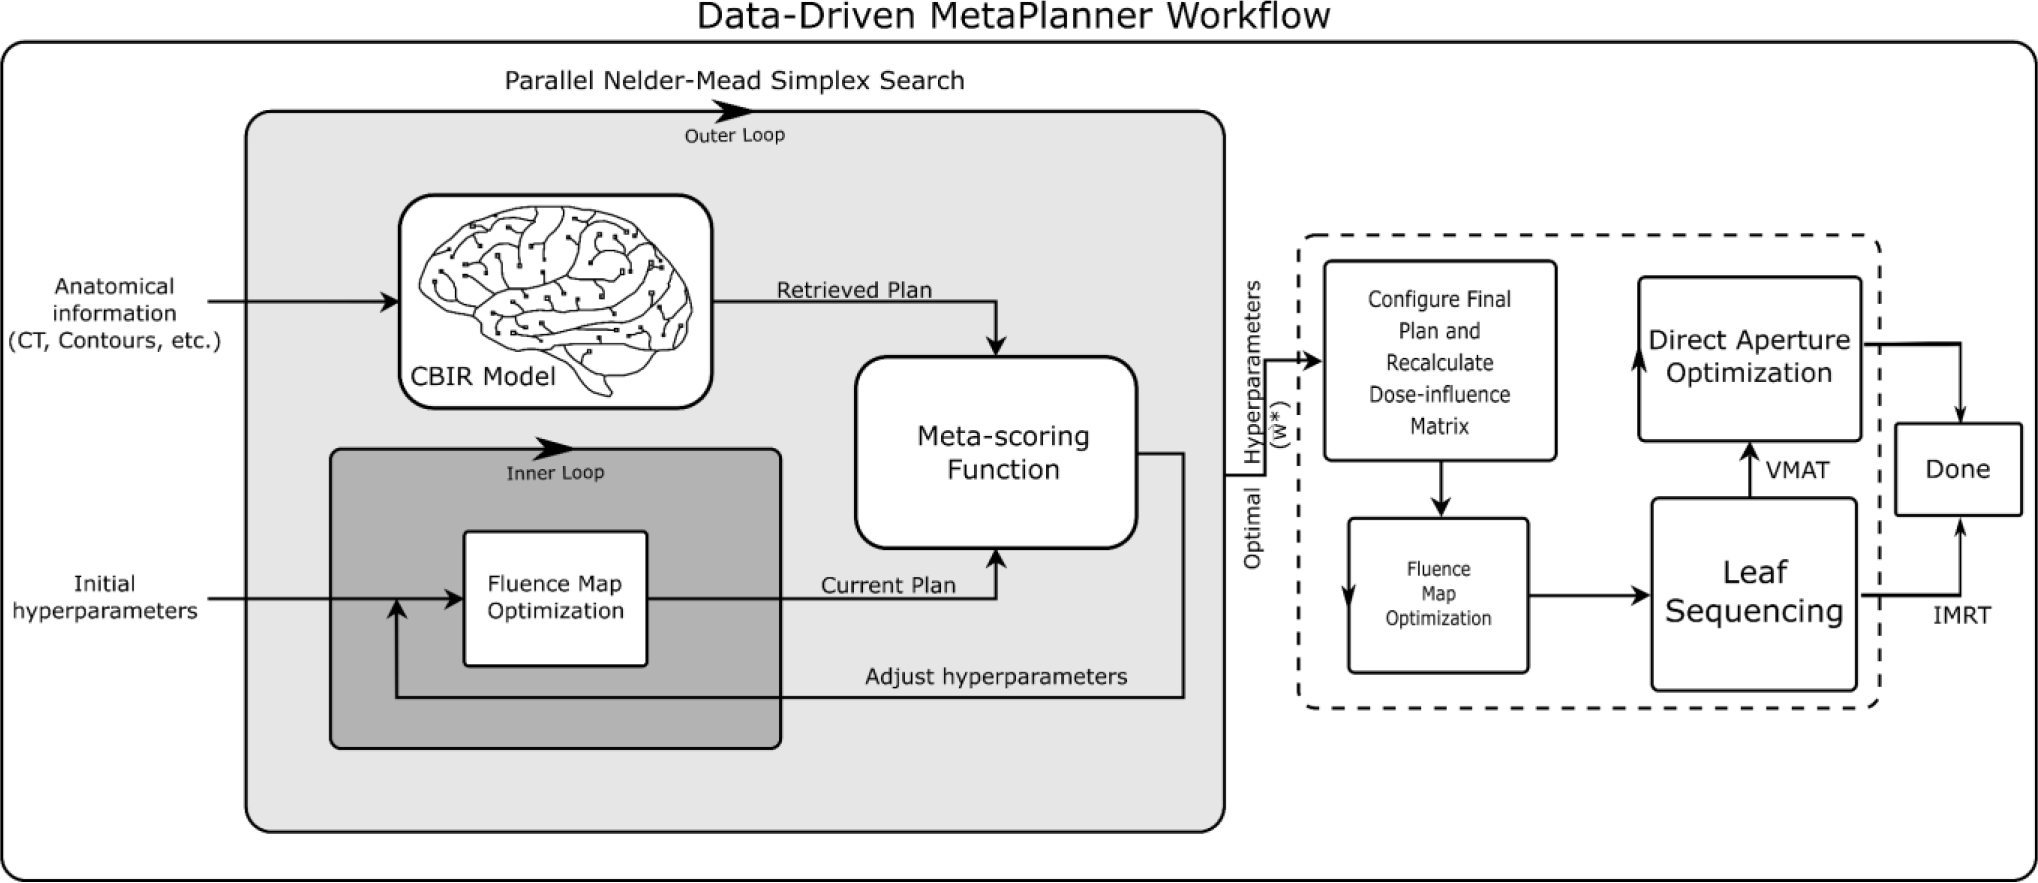
Visualization of the workflow for deploying CBIR in automated planning using the MetaPlanner framework. The proposed CBIR method can be potentially used as a drop-in replacement for conventional utility functions, such as the meta-scoring function.
The proposed CBIR framework will retrieve treatment plans from a database and can be utilized in any pipeline that would otherwise incorporate end-to-end knowledge-based planning. Specifically, the retrieved dose distributions can be used in methods which directly optimize machine parameters through dose mimicking(Eriksson and Zhang 2022, McIntosh et al 2017, Mahmood et al 2018). They can be alternatively used in modular methods like the MetaPlanner framework(Huang et al 2022), which optimize treatment planning hyperparameters and can be more robust than direct dose mimicking.
In this work, various candidate encoder models were evaluated to determine viable CBIR options. Of the evaluated methods, the multitask Siamese network consistently performed the best in regards to retrieval performance, clustering performance, and visual quality. The dataset used in this study includes a total of 405 cases. Though this may be considered sizeable in the context of medical data, it certainly cannot compare to datasets used routinely in computer vision(Deng et al 2009, Lecun et al 1998). Given the relatively small dataset size used in the current study, the multitask model manages to outperform its alternatives by incorporating additional loss function terms to reduce overfitting. This is evident when observing the performance of methods like SNTL, SimSiam, or the vanilla autoencoder, which individually do not perform as well as the multitask model.
In future work, we plan to incorporate the proposed image retrieval method into automated planning workflow. To clarify the various components for such a process, we describe an example implementation using image retrieval to create a data-driven utility function for automated planning (Figure 6). In this example, a CBIR system is deployed to retrieve a reference plan (i.e. dose distribution, DVHs, etc.) from the database based on similarity to the query patient. We can then compute a distance metric (utility function) between the reference plan and the query patient’s plan that is undergoing optimization in order to guide automated planning. Currently, many automated planning methods model the treatment planning process as one where planners navigate the trade-offs of Pareto optimal solutions using a hand-crafted utility function. However, incorporating the retrieved dose distributions from an image retrieval approach enables the use of data-driven utility functions for automated planning, potentially providing a better model of the decision-making process.
This study is additionally subject to some limitations. First, while several candidate methods for encoding images were evaluated here, there may certainly exist better performing encoding models that were not tested. Second, due to data availability, we were not able to evaluate other body sites such as lung data, liver data, etc.
External beam radiation therapy is a highly popular treatment modality (Bilimoria et al 2008). Recently, there has been growing interest in developing automated methods for the radiotherapy pipeline. Deep learning has generally been successful in performing radiotherapy tasks like segmentation, outcome prediction, etc. (Boldrini et al 2019, Liang et al 2021, Yuan et al 2019, Chen et al 2020b, Nomura et al 2020, Dong and Xing 2020, Pastor-Serrano and Perkó 2021, 2022), and applying learning based methods to treatment planning also has potential. In future works, we hope to apply the proposed CBIR method directly to automated planning, potentially through frameworks like MetaPlanner (Huang et al 2022). Similarly, we plan to address some of the mentioned limitations of the current study by evaluating alternative CBIR encoding models and utilizing data from additional body sites.
5. Conclusion
In this work, we introduced a CBIR method to inform subsequent treatment planning. The proposed workflow addresses some key limitations present in traditional end-to-end knowledge-based planning methods, including generalizability, deliverability, and protocol compliance of predicted dose distributions. To determine a viable encoding model for CBIR, we evaluated several methods ranging from the Info-VAE to Siamese networks with various loss functions to a multitask network that combines tasks from other candidate approaches. Our results indicate that the multitask encoding model consistently provides the best performance when evaluated with regards to retrieval performance, clustering performance, and visual quality.
Supplementary Material
Acknowledgements
This research was supported by the National Institutes of Health (NIH) under Grants 1R01 CA176553, R01CA227713, and T32EB009653, Varian Medical Systems, as well as a faculty research award from Google Inc.
Footnotes
Ethical Statement
This research was conducted in accordance with the principles embodied in the Declaration of Helsinki and in accordance with local statutory requirements. The dataset used in this study consists of both public and institutional data. Approval and consent was obtained (Stanford IRB protocol #41335) for the collection, de-identification, and analysis of any institutional data used in this study.
References
- Babier A, Zhang B, Mahmood R, Moore KL, Purdie TG, McNiven AL and Chan TCY 2021. OpenKBP: The open-access knowledge-based planning grand challenge Med. Phys. 48 5549–61 [DOI] [PubMed] [Google Scholar]
- Bilimoria KY, Stewart AK, Winchester DP and Ko CY 2008. The National Cancer Data Base: A Powerful Initiative to Improve Cancer Care in the United States Ann. Surg. Oncol. 15 683–90 [DOI] [PMC free article] [PubMed] [Google Scholar]
- Boldrini L, Bibault J-E, Masciocchi C, Shen Y and Bittner M-I 2019. Deep Learning: A Review for the Radiation Oncologist Front. Oncol. 9 Online: 10.3389/fonc.2019.00977 [DOI] [PMC free article] [PubMed] [Google Scholar]
- Breedveld S, Storchi PRM, Voet PWJ and Heijmen BJM 2012. iCycle: Integrated, multicriterial beam angle, and profile optimization for generation of coplanar and noncoplanar IMRT plans Med. Phys. 39 951–63 [DOI] [PubMed] [Google Scholar]
- Caruana R 1997. Multitask Learning Mach. Learn. 28 41–75 [Google Scholar]
- Chechik G, Sharma V, Shalit U and Bengio S 2010. Large Scale Online Learning of Image Similarity Through Ranking J. Mach. Learn. Res. 11 1109–35 [Google Scholar]
- Chen T, Kornblith S, Norouzi M and Hinton G 2020a. A Simple Framework for Contrastive Learning of Visual Representations ArXiv200205709 Cs Stat Online: http://arxiv.org/abs/2002.05709 [Google Scholar]
- Chen X and He K 2020. Exploring Simple Siamese Representation Learning ArXiv201110566 Cs Online: http://arxiv.org/abs/2011.10566 [Google Scholar]
- Chen Y, Xing L, Yu L, Bagshaw HP, Buyyounouski MK and Han B 2020b. Automatic intraprostatic lesion segmentation in multiparametric magnetic resonance images with proposed multiple branch UNet Med. Phys. 47 6421–9 [DOI] [PubMed] [Google Scholar]
- Craft DL, Halabi TF, Shih HA and Bortfeld TR 2006. Approximating convex Pareto surfaces in multiobjective radiotherapy planning Med. Phys. 33 3399–407 [DOI] [PubMed] [Google Scholar]
- Craft DL, Hong TS, Shih HA and Bortfeld TR 2012. Improved Planning Time and Plan Quality Through Multicriteria Optimization for Intensity-modulated Radiotherapy Int. J. Radiat. Oncol. Biol. Phys. 82 e83–90 [DOI] [PMC free article] [PubMed] [Google Scholar]
- Deng J, Dong W, Socher R, Li L-J, Li K and Fei-Fei L 2009. ImageNet: A large-scale hierarchical image database 2009 IEEE Conference on Computer Vision and Pattern Recognition 2009 IEEE Conference on Computer Vision and Pattern Recognition pp 248–55 [Google Scholar]
- Dong P and Xing L 2020. Deep DoseNet: a deep neural network for accurate dosimetric transformation between different spatial resolutions and/or different dose calculation algorithms for precision radiation therapy Phys. Med. Amptextbackslashmathsemicolon Biol. 65 035010. [DOI] [PMC free article] [PubMed] [Google Scholar]
- Dubey SR 2021. A Decade Survey of Content Based Image Retrieval using Deep Learning IEEE Trans. Circuits Syst. Video Technol. 1–1 [Google Scholar]
- Eriksson O and Zhang T 2022. Robust automated radiation therapy treatment planning using scenario-specific dose prediction and robust dose mimicking Med. Phys. 49 3564–73 [DOI] [PMC free article] [PubMed] [Google Scholar]
- Goodfellow I, Bengio Y and Courville A 2016. Deep Learning (MIT Press; ) [Google Scholar]
- Gretton A, Borgwardt K, Rasch M, Schölkopf B and Smola A 2006. A Kernel Method for the Two-Sample-Problem Advances in Neural Information Processing Systems vol 19 (MIT Press; ) Online: https://papers.nips.cc/paper/2006/hash/e9fb2eda3d9c55a0d89c98d6c54b5b3e-Abstract.html [Google Scholar]
- Grill J-B, Strub F, Altché F, Tallec C, Richemond PH, Buchatskaya E, Doersch C, Pires BA, Guo ZD, Azar MG, Piot B, Kavukcuoglu K, Munos R and Valko M 2020. Bootstrap your own latent: A new approach to self-supervised Learning ArXiv200607733 Cs Stat Online: http://arxiv.org/abs/2006.07733 [Google Scholar]
- Huang C, Nomura Y, Yang Y and Xing L 2022. Meta-optimization for fully automated radiation therapy treatment planning Phys. Med. Biol. 67 055011. [DOI] [PubMed] [Google Scholar]
- Huang C, Yang Y, Panjwani N, Boyd S and Xing L 2021. Pareto Optimal Projection Search (POPS): Automated Radiation Therapy Treatment Planning by Direct Search of the Pareto Surface IEEE Trans. Biomed. Eng. 1–1 [DOI] [PMC free article] [PubMed] [Google Scholar]
- Hubert L and Arabie P 1985. Comparing partitions J. Classif. 2 193–218 [Google Scholar]
- Hussein M, Heijmen BJM, Verellen D and Nisbet A 2018. Automation in intensity modulated radiotherapy treatment planning-a review of recent innovations Br. J. Radiol. 91 20180270. [DOI] [PMC free article] [PubMed] [Google Scholar]
- Kingma DP and Welling M 2013. Auto-Encoding Variational Bayes Online: https://arxiv.org/abs/1312.6114
- Latif A, Rasheed A, Sajid U, Ahmed J, Ali N, Ratyal NI, Zafar B, Dar SH, Sajid M and Khalil T 2019. Content-Based Image Retrieval and Feature Extraction: A Comprehensive Review Math. Probl. Eng. 2019 e9658350 [Google Scholar]
- Lecun Y, Bottou L, Bengio Y and Haffner P 1998. Gradient-based learning applied to document recognition Proc. IEEE 86 2278–324 [Google Scholar]
- Liang X, Bibault J-E, Leroy T, Escande A, Zhao W, Chen Y, Buyyounouski MK, Hancock SL, Bagshaw H and Xing L 2021. Automated contour propagation of the prostate from pCT to CBCT images via deep unsupervised learning Med. Phys. 48 1764–70 [DOI] [PubMed] [Google Scholar]
- Ma M, Kovalchuk N, Buyyounouski MK, Xing L and Yang Y 2019. Incorporating dosimetric features into the prediction of 3D VMAT dose distributions using deep convolutional neural network Phys. Med. Biol. 64 125017. [DOI] [PubMed] [Google Scholar]
- Mahmood R, Babier A, McNiven A, Diamant A and Chan TCY 2018. Automated Treatment Planning in Radiation Therapy using Generative Adversarial Networks ArXiv180706489 Phys. Stat Online: http://arxiv.org/abs/1807.06489 [Google Scholar]
- McIntosh C, Welch M, McNiven A, Jaffray DA and Purdie TG 2017. Fully automated treatment planning for head and neck radiotherapy using a voxel-based dose prediction and dose mimicking method Phys. Med. Biol. 62 5926–44 [DOI] [PubMed] [Google Scholar]
- Mogotsi IC 2010. Christopher D. Manning, Prabhakar Raghavan, and Hinrich Schütze: Introduction to information retrieval Inf. Retr. 13 192–5 [Google Scholar]
- Momin S, Fu Y, Lei Y, Roper J, Bradley JD, Curran WJ, Liu T and Yang X 2021. Knowledge-based radiation treatment planning: A data-driven method survey J. Appl. Clin. Med. Phys. 22 16–44 [DOI] [PMC free article] [PubMed] [Google Scholar]
- Nomura Y, Wang J, Shirato H, Shimizu S and Xing L 2020. Fast spot-scanning proton dose calculation method with uncertainty quantification using a three-dimensional convolutional neural network Phys. Med. Amptextbackslashmathsemicolon Biol. 65 215007. [DOI] [PubMed] [Google Scholar]
- Pastor-Serrano O and Perkó Z 2021. Learning the Physics of Particle Transport via Transformers (arXiv) Online: http://arxiv.org/abs/2109.03951
- Pastor-Serrano O and Perkó Z 2022. Millisecond speed deep learning based proton dose calculation with Monte Carlo accuracy Phys. Med. Amptextbackslashmathsemicolon Biol. 67 105006. [DOI] [PubMed] [Google Scholar]
- Rosenberg A and Hirschberg J 2007. V-Measure: A Conditional Entropy-Based External Cluster Evaluation Measure Proceedings of the 2007 Joint Conference on Empirical Methods in Natural Language Processing and Computational Natural Language Learning (EMNLP-CoNLL) CoNLL-EMNLP 2007 (Prague, Czech Republic: Association for Computational Linguistics) pp 410–20 Online: https://aclanthology.org/D07-1043 [Google Scholar]
- Schroff F, Kalenichenko D and Philbin J 2015. FaceNet: A Unified Embedding for Face Recognition and Clustering 2015 IEEE Conf. Comput. Vis. Pattern Recognit. CVPR 815–23 [Google Scholar]
- Sethi A 2018. Khan’s Treatment Planning in Radiation Oncology, 4th Edition. Editor: Khan Faiz M., Gibbons John P., Sperduto Paul W.. Lippincott Williams & Wilkins (Wolters Kluwer), Philadelphia, PA, 2016. 648 pp. Price: $215.99. ISBN: 9781469889979. (Hardcover) (*) Med. Phys. 45 2351–2351 [Google Scholar]
- Shen C, Nguyen D, Chen L, Gonzalez Y, McBeth R, Qin N, Jiang SB and Jia X 2020. Operating a treatment planning system using a deep-reinforcement learning-based virtual treatment planner for prostate cancer intensity-modulated radiation therapy treatment planning Med. Phys. [DOI] [PMC free article] [PubMed] [Google Scholar]
- Steinley D 2004. Properties of the Hubert-Arable Adjusted Rand Index Psychol. Methods 9 386–96 [DOI] [PubMed] [Google Scholar]
- Strehl A and Ghosh J 2003. Cluster ensembles --- a knowledge reuse framework for combining multiple partitions J. Mach. Learn. Res. 3 583–617 [Google Scholar]
- Xing L, Li JG, Donaldson S, Le QT and Boyer AL 1999. Optimization of importance factors in inverse planning Phys. Med. Biol. 44 2525–36 [DOI] [PubMed] [Google Scholar]
- Yuan Y, Qin W, Guo X, Buyyounouski M, Hancock S, Han B and Xing L 2019. Prostate Segmentation with Encoder-Decoder Densely Connected Convolutional Network (Ed-Densenet) 2019 IEEE 16th International Symposium on Biomedical Imaging (ISBI 2019) pp 434–7 [Google Scholar]
- Zarepisheh M, Hong L, Zhou Y, Oh JH, Mechalakos JG, Hunt MA, Mageras GS and Deasy JO 2019. Automated intensity modulated treatment planning: The expedited constrained hierarchical optimization (ECHO) system Med. Phys. 46 2944–54 [DOI] [PMC free article] [PubMed] [Google Scholar]
- Zhao S, Song J and Ermon S 2018. InfoVAE: Information Maximizing Variational Autoencoders ArXiv170602262 Cs Stat Online: http://arxiv.org/abs/1706.02262 [Google Scholar]
- Zin NAM, Yusof R, Lashari SA, Mustapha A, Senan N and Ibrahim R 2018. Content-Based Image Retrieval in Medical Domain: A Review J. Phys. Conf. Ser. 1019 012044 [Google Scholar]
Associated Data
This section collects any data citations, data availability statements, or supplementary materials included in this article.


