Abstract
Functionally graded porous structures (FGPSs) are attracting increasing interest in the manufacture of prostheses that benefit from lower stiffness and optimized pore size for osseointegration. In this work, we explore the possibility of employing FGPSs with auxetic unit cells. Their negative Poisson’s ratio was exploited to reduce the loss of connection between prosthesis and bone usually occurring in standard implant loaded under tension and therefore undergoing lateral shrinking. In addition, to further improve osseointegration and mitigate stress shielding effects, auxetic FGPSs were fabricated in this work using a novel β-Ti21S alloy characterized by a lower Young’s modulus compared to traditional α + β Ti alloys. Specifically, two different auxetic FGPSs with aspect ratio equal to 1.5 and angle θ of 15° and 25° with a relative density (ρr) gradient of 0.34, 0.49, 0.66 and of 0.40, 0.58, 0.75 were designed and printed by laser powder bed fusion. The 2D and 3D metrological characterization of the as-manufactured structures was compared with the design. 2D metrological characterization was carried out using scanning electron microscopy analysis, while for the 3D characterization, X-ray micro-CT imaging was used. An undersizing of the pore size and strut thickness in the as-manufactured sample was observed in both auxetic FGPSs. A maximum difference in the strut thickness of −14 and −22% was obtained in the auxetic structure with θ = 15° and 25°, respectively. On the contrary, a pore undersizing of −19% and −15% was evaluated in auxetic FGPS with θ = 15° and 25°, respectively. Compression mechanical tests allowed to determine stabilized elastic modulus of around 4 GPa for both FGPSs. Homogenization method and analytical equation were used and the comparison with experimental data highlights a good agreement of around 4% and 24% for θ = 15° and 25°, respectively.
Keywords: Functionally graded porous structures, Ti-21S, Auxetic structure, Metrological characterization, Laser powder bed fusion, Additive manufacturing
1. Introduction
Replacing and/or repairing the human bone with necessity to guarantee the same mechanical properties and biocompatibility is of primary interest in the orthopedic field. Ti-6Al-4V extra-low interstitial (ELI) is the most common biomaterial, as it combines high strength and corrosion resistance. However, this alloy, originally devised for aeronautical applications, turns out to be affected by some drawbacks when employed in biomedical applications. Considering its chemical composition, elements such as Al and V are deleterious for the patient’s health due to long-term harmful effects, namely, cytotoxicity and Alzheimer’s disease[1]. For this reason, many researchers recently focused on new biomaterials with a reduction or a complete removal of these elements achieving similar strength and corrosion resistance[2,3]. From a mechanical point of view, Ti-6Al-4V ELI exhibit a high elastic modulus (110 GPa), much higher compared to that of cortical (3 – 30 GPa) and trabecular bone (0.02 – 2 GPa). This stiffness mismatch leads to the so-called “stress shielding effect” and consequently bone resorption[4].
It is not surprising that the scientific community is intensively researching novel biomedical titanium alloys with low amounts of harmful elements and lower elastic modulus. Beyond Ti-6Al-4V, in UNI EN ISO 5832, unalloyed titanium[5] and Ti-15Mo-5Zr-3Al[6] have been reported for use as surgical implants. Unalloyed titanium is characterized by a Young’s modulus similar to Ti-6Al-4V but with about half the tensile strength, different from β-Ti-15Mo-5Zr-3Al, which shows an elastic modulus of around 80 GPa and a tensile strength similar to Ti-6Al-4V (900 MPa)[7]. The other four wrought titanium grades standardized for biomedical application are Ti-6Al-7Nb[8], Ti-3Al-2.5V[9], Ti-15Mo,[10] and Ti-12Mo-6Zr-2Fe[11]. Considering these alloys obtained by AM techniques, the first two alloys are characterized, after thermal treatment, by α + β microstructure with a Young’s modulus near Ti-6Al-4V but with a lower amount of dangerous elements[12,13]. In contrast, metastable β-Ti alloys show lower elastic modulus thanks to the low intrinsic elastic modulus of the body-centered cubic structure of β phase, as well as good mechanical properties and extraordinary corrosion resistance and biocompatibility. However, Ti-15Mo exhibits too low strength compared to Ti-6Al-4V and evidences a strong tendency toward brittle ω phase precipitation[14]. The metastable β Ti-12Mo-6Zr-2Fe alloy in as-built condition shows mechanical strength similar to Ti-6Al-4V because of high density of αII[15,16]. A decrease in the elastic modulus from 107 to 85 GPa is observed by changing the scanning strategy from a simple back-and-forth to a chess scan strategy due to the formation of a strong {100}<001> texture. A post solution heat treatment promotes a significant increase in the intensity of the {100}<001> texture leading to an elastic modulus of around 75 GPa[15].
A novel metastable β-Ti21S alloy with the chemical composition of Ti-15Mo-3Nb-3Al-0.2Si (wt.%) has previously been investigated[17-19]. It is characterized by a fully β microstructure and good mechanical properties in as-built condition, potentially without the need for further heat treatment. In detail, Macias-Sifuentes et al.[17] demonstrated a β phase microstructure with a textured columnar structured oriented along the building direction in the laser powder bed fusion (LPBF) sample and a precipitation of α phase into the grain and at the grain boundaries after a solution treatment at 850°C for 30 min and aging at 538°C for 8 h. The α precipitation leads to increased mechanical strength but a decreased ductility. A very low Young’s modulus of 52 GPa and a good mechanical strength of around 830 MPa and an extraordinarily elongation of 21% were demonstrated by Pellizzari et al.[18]. A variation of <20% in Young’s modulus due to the texture and a lower cytotoxicity compared to Ti6Al4V further confirmed the possibility to use it in as-built condition.
However, the elastic modulus of around 52 GPa of the β-Ti21S alloy is still too high compared to the human bone. Replacement of the full body prosthesis with a cellular structure allows to decrease its stiffness. Instead, the properties of cellular biomaterials are affected by the base material and the specific architecture of the unit cell[20,21]. An exhaustive review of the mechanical properties of the different architectures present in the literature was conducted by Benedetti et al.[22]. Different behaviors during compression tests are highlighted, that is, bending- and stretching-dominated depending on the structure response to the load. Bending-dominated lattices are characterized by too few struts to balance bending moments at nodes when externally loaded leading to the bending of the struts, and the stress-strain curve shows a uniform collapse after the yielding point. On the contrary, a stretching-dominated structure is composed of enough struts to equilibrate the applied external load and the struts result stressed mainly parallel to the load direction with the result of sequential local collapse after the yielding. The elastic modulus E and the yield strength σy of the trabecular structures can be correlated to relative density using Gibson-Ashby model[20,21], according to Equations I and II.


Where C1, C2, n1 and n2 are the Gibson-Ashby constants. Considering the strut-based lattices, particular interest is paid to auxetic structures, showing a negative Poisson’s ratio in case of implants that are subjected to bending stress. As an example, a femoral implant during the normal life of the patient undergoes cyclic bending stress. This mechanical loading places one part of the prosthesis in cyclic tension and another in cyclic compression. The use of auxetic structure in the tensioned part permits to promote the compression of the interface between implant and bone due to the lateral expansion linked to its negative Poisson’s ratio. This should avoid or mitigate the loosening of the prosthesis. In addition, a decreased Young’s modulus by decreasing Poisson’s ratio is observed for this class of metamaterials[23-30]. In fact, the Poisson’s ratio and consequently the elastic modulus are influenced by the cell parameters, such as a/b aspect ratio and θ angle (Figure 1A). Kolken et al. studied the mechanical performance of re-entrant hexagonal honeycomb auxetic structure in Ti-6Al-4V with different design parameters, and consequently different elastic modulus and Poisson’s ratio, with a relative density <55% to guarantee optimal bone growth conditions. They obtained an elastic modulus in the range of 0.8 – 11 GPa and a yield stress between 7 MPa and 280 MPa, which are values in line with the bone properties.
Figure 1.
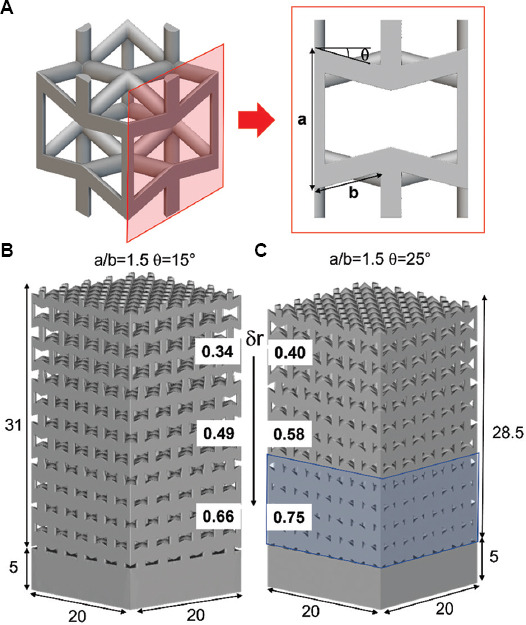
Geometrical details of (A) auxetic structure, functionally graded porous structures with a/b = 1.5 and (B) θ = 15° and (C) θ = 25° (mm).
When considering human bone, for example, the femur is characterized by variable porosity of the trabecular structure depending on the position within the bone[31]. Implants carrying FGPSs have attracted growing interest in recent years[32-37] thanks to the possibility of tuning their porosity to adapt the implant stiffness to that of the surrounding bony tissue and to promote the osseointegration owing to an optimal pore size in contact with bone (100 – 600 μm). In addition, a FGPS facilitates an adequate connection between implant’s porous and solid parts. The effect of the direction of the porosity gradient with respect to the direction of loading in the compression test was evaluated by De Galarreta et al.[38]. In detail, the radially graded porous structure is affected by all the different porosity levels through the mixture rule. Differently, the elastic modulus of longitudinally graded structures is dominated by the collapse of the weakest layer of the FGPSs β-Ti cellular lattice structures that have barely been investigated[19,39,40]. Equations III and IV correlate the elastic modulus of the FGPSs with the stiffness of the different levels of relative density in the case of longitudinal graded porous structure or radial/lateral porous graded structure, respectively[38].


Where n refers to the total number of layers, ki the volume fraction of the corresponding layer with respect to the total volume, E the elastic modulus of the FGPSs, and Ei the elastic modulus of the corresponding layer i.
The production processes that permit to obtain the cellular structures are the additive manufacturing techniques. The most used is the LPBF that is based on selective melting of the previously spread layer of powder on the build plate and permits to obtain the best dimensional precision and accuracy[41]. Perfect control of the processing parameters, namely laser powder, scan speed, hatch spacing, layer thickness, powder material and chamber environmental, reduces the number of defects in the printed material. In detail, three different types of defects can occur, namely lack of fusion porosity, keyhole porosity, and cracks. Insufficient overlap of successive melt pools leads to the formation of so-called lack of fusion porosity[42]. In contrast, keyhole porosity characterized by the typical spherical shape, due to the formation of trapped gas and cracks, is associated with the high thermal gradient during cooling and the consequently high residual stresses[43]. Furthermore, other manufacturing imperfections can occur during the printing process, namely, the variation of the cross-section and the strut waviness, which modify the final mechanical response of the lattice structure[44].
Very few authors have investigated the manufacturability and mechanical properties of cellular structures made by β-Ti. A recent study evaluated the printability of simple cubic cells in β-Ti21S alloy underlying a suitable manufacturing quality for strut thickness above 0.5 mm[19].
The aim of the present work is to evaluate the manufacturability of two different auxetic FGPSs with aspect ratio equal to 1.5 and angle θ of 15° and 25° with a relative density gradient of 0.34 – 0.49 – 0.66 and of 0.40 – 0.58 – 0.75, respectively. 2D metrological characterization by scanning electron microscopy (SEM) and 3D metrological characterization by X-ray micro-CT (μ-CT) imaging were carried out and compared. Preliminary investigation of the mechanical properties and comparison with analytical and numerical homogenization analyses was also conducted.
2. Materials and experimental procedures
2.1. Specimen design and preparation
Two different auxetic FGPSs were designed by means of nTopology software, and the geometrical details are summarized in Figure 1. Each relative density level was characterized by a height of 3-unit cells and a solid base with a thickness of 5 mm was added at the bottom of the structure (Figure 1). The highest relative density level is designed to improve osseointegration thanks to pore size smaller than 800 μm, while the lowest density permits to decrease the elastic modulus close to that of the cancellous bone.
In the auxetic FGPS with θ = 25° the highest density level becomes too dense leading to the loss of auxetic geometry (Figure 1C). All CAD parameters were characterized by means of 3D image analysis software (ORS-Dragonfly) and are summarized in Table 1.
Table 1.
Geometrical details of the designed auxetic FGPSs
| θ (°) | ρr CAD (-) | Strut thickness CAD (mm) | Pore size CAD (mm) |
|---|---|---|---|
| 15 | 0.34 | 1.17±0.02 | 1.12±0.47 |
|
| |||
| 0.49 | 1.47±0.03 | 0.98±0.39 | |
|
| |||
| 0.66 | 1.78±0.10 | 0.78±0.32 | |
|
| |||
| 25 | 0.40 | 1.20±0.02 | 1.00±0.40 |
|
| |||
| 0.58 | 1.51±0.06 | 0.81±0.31 | |
|
| |||
| 0.75 | 1.80±0.24 | 0.63±0.27 | |
CAD: Computer-aided design, FGPSs: Functionally graded porous structures
Strut thickness and pore size were calculated by means of the wall thickness analysis method which permits to obtain the size distribution of the analyzed 3D elements. This method evaluates the local thickness of the 3D object, namely, strut or pore, by fitting its volume with the maximum spheres at each location in the 3D structure[26,45]. According to this method, a high pores size deviation is expected, due to the small spheres fitting the pore near the corners. The different FGPSs were printed by means of a LPBF machine model MYSINT100 (SISMA SPA, Piovene Rocchette, Italy) on a platform of 100 mm in Ar atmosphere, with a laser spot of 55 μm, a power of 200W and a volume energy density between 40 and 90 J/mm3. A 45° alternate scan strategy was used. Five samples for each auxetic geometry were printed horizontally on the longer side to permit a better printability of the inclined struts (Figure 2).
Figure 2.
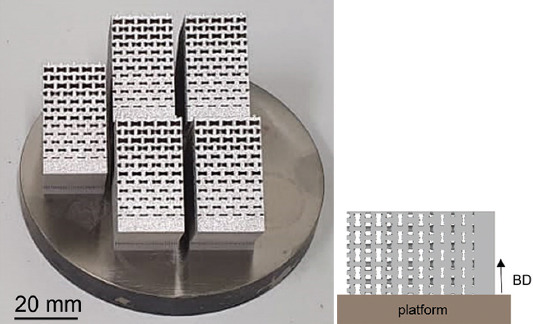
As-manufactured functionally graded porous structures lying down on the longer side with schematical representation to highlight the building direction.
A pre-alloyed plasma atomized β-Ti21S alloy (GKN Hoeganaes Corporation, Cinnaminson, NJ, USA) with a powder size distribution of 25 – 60 μm was selected. The chemical composition is shown in Table 2.
Table 2.
The chemical composition of β-Ti21S (wt. %)
| Element | Mo | Al | Nb | Si | O | Ni | Fe |
|---|---|---|---|---|---|---|---|
| Weight % | 14.6 | 2.8 | 2.8 | 0.3 | 0.11 | 0.004 | Bal. |
2.2. Metrological and material characterizations
As-manufactured samples were characterized by means of 2D and 3D metrological characterizations. In detail, SEM inspections of the lateral and top sample surfaces were used to conduct the 2D dimensional analysis of the strut and pore size. The size of 10 pores and 10 struts for each level of density were measured using a 2D image analysis software, and the mean and the standard deviation were calculated. The pore size was measured by means of the diameter of the inscribed circumference, while μ-CT scan was used for 3D metrological characterization by using a voxel size of 25 μm for each sample. The Nanotom S system with X-ray voltage between 100 and 130 kV and current 80 – 90 mA was used. Image analysis was performed using ORS-Dragonfly software and wall thickness analysis on the entire volume to define the thickness of the strut and the pore size at each relative density level. To consider the frequency of the different measurements and the non-normal distribution of the values, median and median absolute deviation (MAD) were used to define the pore size and strut thickness rather than the mean and standard deviation. When the distribution leads to a normal profile, the mean and median become equal. Since standard deviation is excessively affected by the outlier values and not by the frequency, MAD seems to be a better scatter indicator. In addition, overlapping of μ-CT to computer-aided design (CAD) images was performed thanks to the align function and generation of a contour mesh in Dragonfly ORS software.
Standard metallographic preparation was carried out to characterize the microstructure. Kroll’s reagent (1 mL of HF, 30 mL of HNO3, and 85 mL of distilled water) was used to highlight the microstructure according to ASTM E407-07[46]. Three specimens for each auxetic geometry were quasi-static compression tested at room temperature (20 ± 3°C) according to ISO 13314:2011[47] using a servo-hydraulic Instron testing machine with a crosshead speed of 1 mm/min and a LVDT transducer to remove the machine compliance. Five loading-unloading compression ramps were imparted between 20% and 70% of the yield stress on one sample in order to obtain the cyclic stabilized Young’s modulus[48]. The elastic modulus of the different layers was determined by means of Gibson-Ashby equation (Equation I) and using numerical homogenization method. This method replaces the single unit cell with an equivalent bulk elastic material model and with equivalent mechanical response of the lattice[49-52]. The auxetic unit cell could be further simplified by considering the geometrical symmetry as done by Yang et al.[53] A mesh size equal to 0.1× strut radius and the mechanical properties of Ti-21S bulk material evaluated by Pellizzari et al.[18] were used in the homogenization analysis, and the stiffness matrix of an orthotropic linear elastic material was defined. Subsequently, compliance matrix obtained by the inverse of the stiffness matrix was defined, and the elastic modulus in the loading direction was calculated. The homogenization method was conducted on unit cell with designed (E hom nom.) and printed (E hom real.) strut thickness at all different levels of relative density. The corresponding auxetic FGPS elastic modules were calculated by Equation III and compared with the experimental data.
3. Results and discussion
3.1. 2D metrological characterization: SEM analysis
On the lateral surface of the two auxetic FGPSs, the three relative densities were evaluated by quantitative image analysis on SEM micrographs. Differently, the top surface was characterized only for the lower density level. The micrographs in Figures 3 and 4 show the details of the different relative density levels on the lateral and top surfaces of the auxetic FGPSs with θ = 15° and 25°, respectively. Considering Figure 4, the loss of auxetic geometry of the high relative density level in case of auxetic FGPS with θ = 25° is evident in the printed sample as well as in the CAD. The strut thickness and pore size of the as-built samples for both auxetic structures are compared with the CAD values and summarized in Table 3.
Figure 3.
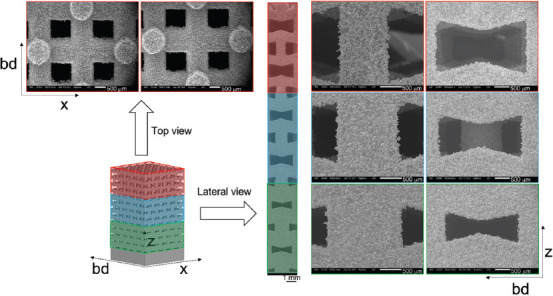
Lateral and top scanning electron microscopy views showing the details of the auxetic functionally graded porous structures with θ = 15°.
Figure 4.
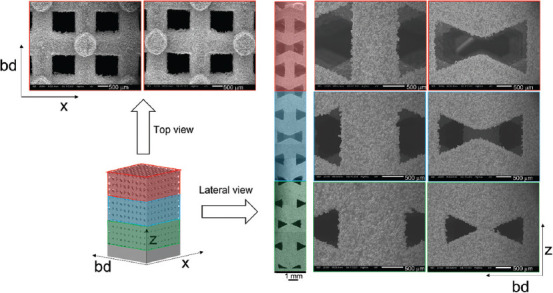
Lateral and top scanning electron microscopy views showing the details of the auxetic functionally graded porous structures with θ = 25°.
Table 3.
Summary of the 2D metrological characterization of the auxetic FGPS with θ = 15° and 25° for the different density relative levels
| Auxetic | Strut thickness | Pore size | |||||
|---|---|---|---|---|---|---|---|
|
|
|
|
|||||
| θ (°) | ρr CAD (-) | CAD (mm) | SEM (mm) | Deviation to CAD (%) | CAD (mm) | SEM (mm) | Deviation to CAD (%) |
| 15 | 0.34 lat. | 1.17±0.02 | 1.10±0.03 | 6±2 | 1.12±0.47 | 1.43±0.03 | 28±56% |
|
| |||||||
| 0.34 top | 1.17±0.02 | tbd: 0.99±0.02 tx: 1.15±0.04 |
tbd: 15±1 tx: −2±2 |
1.12±0.47 | 0.84±0.03 | −25±34% | |
|
| |||||||
| 0.49 | 1.47±0.03 | 1.41±0.04 | −4±2 | 0.98±0.39 | 1.11±0.02 | 13±47% | |
|
| |||||||
| 0.66 | 1.78±0.10 | 1.71±0.05 | −4±5 | 0.78±0.32 | 0.79±0.07 | 1±51% | |
|
| |||||||
| 25 | 0.40 lat. | 1.20±0.02 | 1.03±0.02 | −14±1 | 1.00±0.40 | 1.16±0.02 | 16±48% |
|
| |||||||
| 0.40 top | 1.20±0.02 | tbd: 0.96±0.01 tx: 1.12±0.08 |
tbd: −20±1 tx: -7±7 |
1.00±0.40 | 0.89±0.04 | −11±40% | |
|
| |||||||
| 0.58 | 1.51±0.06 | 1.32±0.05 | −13±3 | 0.81±0.31 | 0.90±0.03 | 11±46% | |
|
| |||||||
| 0.75 | 1.80±0.24 | 1.57±0.04 | −13±12 | 0.63±0.27 | 0.60±0.02 | −5±44% | |
SEM: Scanning electron microscopy, FGPS: Functionally graded porous structures, CAD: Computer-aided design
Inside brackets, the percentage deviation with respect to the CAD values is reported. An anisotropy in terms of pore size and strut thickness in the lower density regions (0.34 for θ = 15° and 0.40 in case of θ = 25°) of the as-manufactured samples is highlighted thanks to the investigation of the lateral and top side. Considering the strut thickness, the anisotropy is due to the printing process. Instead, decreasing the printing angle from 90° to 0° strongly affected the strut morphology by decreasing the strut quality[54]. Higher surface irregularities and scattered surface texture is evident on the upper and under skin of the strut parallel to the x-axis (top view in Figures 3 and 4). Differently, the deviation in pore size is due to the 2D characterization where the pore size is evaluated considering the inscribed circumference on the different 2D views. Since the auxetic cell is not cubic, the pores size is different considering the top or the lateral side of the cell. This deviation is not present in CAD since it was evaluated by means of a 3D image analysis where the pore and the strut size are equal to the diameter of the inscribed sphere at each position. This analysis gives the median and MAD values of the pores, and the struts refers to the entire volume of the relative density level. To correctly correlate the CAD with the printed sample, top and lateral values in case of lower relative density were put together leading to a lower deviation from the CAD value. The percentage variations from CAD for both structures are plotted in Figure 5.
Figure 5.
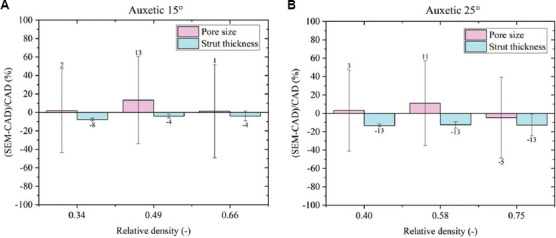
Computer-aided design deviation using scanning electron microscopy analysis for auxetic functionally graded porous structures with (A) θ = 15° and (B) θ = 25°.
Auxetic FGPS with θ = 15° shows a maximum oversizing of 13% in the pore size and a maximum undersizing of 8% in the strut thickness. The same result is observed in the auxetic FGPS with θ = 25° exhibiting a maximum strut thickness undersizing of 13%. Different behavior is evident considering the pore size. Indeed, an oversizing of 3% and 11% is observed for relative density levels of 0.40 and 0.58, respectively, and an undersizing of 5% for the high relative density level may be due to the too dense structure that lost the auxetic geometry. The pore geometry of auxetic structure changes since the opposite inclined struts come in contact with each other. Excess of material on the connection between struts leads to a lower pore size with respect to the CAD without affecting the strut thickness. This point is discussed in detail in the section 3.3.
3.2. 3D metrological characterization: μ-CT analysis
Figures 6 and 7 show the μ-CT images of all auxetic FGPSs with θ = 15° and 25°, respectively. Details of the analyzed pore size and strut thickness, as well as the overlap between the CAD and printed sample for all the different relative density levels, are reported.
Figure 6.
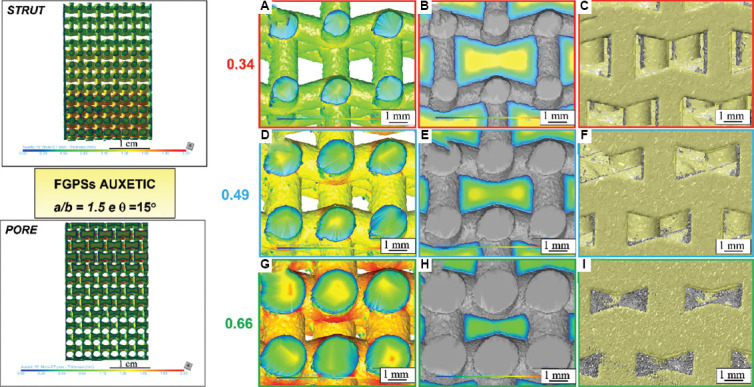
μ-CT analysis of auxetic functionally graded porous structures with θ = 15° considering (A, D, and G) strut thickness, (B, E, and H) pore size and (C, F, and I) μ-CT image (grey) overlap with computer-aided design (yellow) for the relative density of 0.34, 0.49, and 0.66, respectively.
Figure 7.
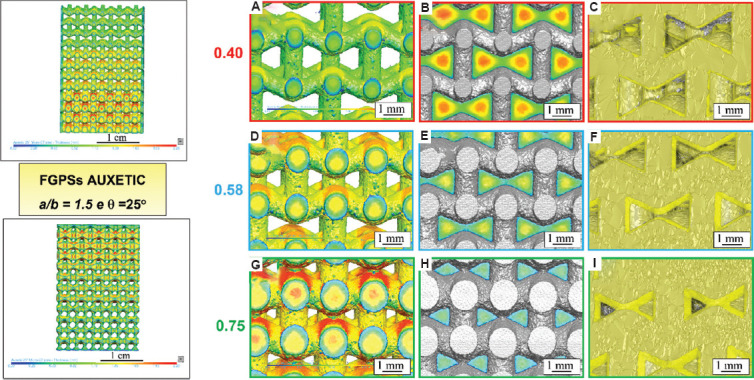
μ-CT analysis of auxetic functionally graded porous structures with θ = 25° considering (A, D, G) strut thickness, (B, E, H) pore size and (C, F, I) μ-CT image (grey) overlap with computer-aided design (yellow) for the relative density of 0.40, 0.58 and 0.75, respectively.
In general, a lower relative density leads to a lower pore size and increased strut thickness. The overlap of CAD on the μ-CT image (Figure 6C, F, I, and Figure 7C, F, I) highlights areas with excess of powder near the corners of the auxetic structure (grey particles indicated by a gray arrow) and printed strut smaller than the one of the CAD (yellow arrows). In addition, no deviation of the strut angles is observed by the superimposition of μ-CT image to the CAD. This is an important issue that highlights the good quality of the printed sample without the need of further thermal treatment to release the residual stress due to LPBF and avoid geometrical distortions. The obtained data and the percentage variations with respect to the design parameters are summarized in Table 4 for both auxetic FGPSs. Histograms of the values obtained by analyzing the different relative density levels for both auxetic structures in case of CAD and as-manufactured sample are shown in Figure 8. The high median absolute deviations in the pore size shown in Table 4 are correlated to the wall thickness method adopted for the measurements. Specifically, all the pores are measured by means of the maximum sphere diameter that can fit it at each position. This means that a bigger sphere describes the middle part of the pore and smaller one defines the edge part of it, leading to a statistical representation of the local size (Figure 9). Due to the necessity to compare the design with the printed sample to evaluate the printability, the median value was used as representative value of the pore. Nevertheless, from the size distributions shown in Figure 8 and the detail of the auxetic structure in Figure 9, it is clear that a statistical representation of the pore sizes is more accurate.
Table 4.
Summary of 3D metrological characterization of the auxetic FGPS with θ = 15° and 25° for the different density relative levels
| Auxetic | Strut thickness | Pore size | |||||
|---|---|---|---|---|---|---|---|
|
|
|
|
|||||
| θ (°) | ρr CAD (-) | CAD (mm) | μ-CT (mm) | Deviation to CAD (%) | CAD (mm) | μ-CT (mm) | Deviation to CAD (%) |
| 15 | 0.34 | 1.17±0.02 | 1.01±0.04 | −14±5 | 1.12±0.47 | 0.98±0.38 | −13±71 |
|
| |||||||
| 0.49 | 1.47±0.03 | 1.34±0.08 | −9±7 | 0.98±0.39 | 0.79±0.33 | −19±66 | |
|
| |||||||
| 0.66 | 1.78±0.10 | 1.61±0.23 | −10±18 | 0.78±0.32 | 0.69±0.28 | −12±72 | |
|
| |||||||
| 25 | 0.40 | 1.20±0.02 | 0.94±0.06 | −22±6 | 1.00±0.40 | 0.85±0.37 | −15±71 |
|
| |||||||
| 0.58 | 1.51±0.06 | 1.24±0.11 | −18±11 | 0.81±0.31 | 0.73±0.32 | −10±74 | |
|
| |||||||
| 0.75 | 1.80±0.24 | 1.44±0.16 | −20±20 | 0.63±0.27 | 0.62±0.28 | −2±87 | |
FGPS: Functionally graded porous structures, CAD: Computer-aided design
Figure 8.
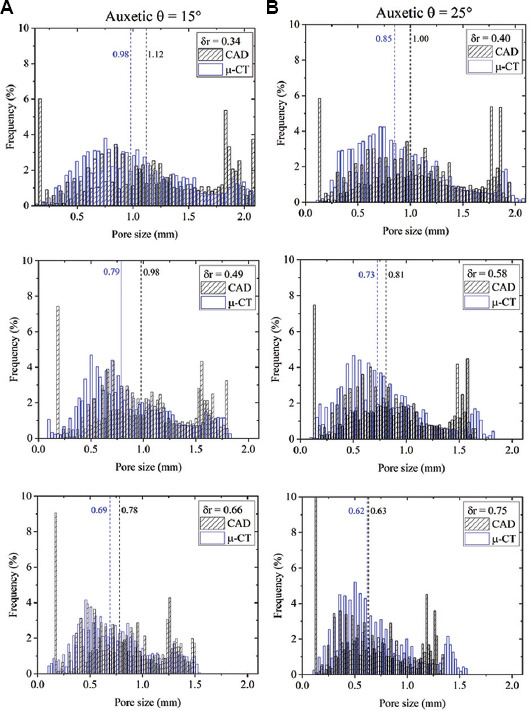
Histograms of the pore size data in case of computer-aided design and μ-CT image for the different relative density level in case of auxetic θ = (A) 15° and (B) 25°.
Figure 9.
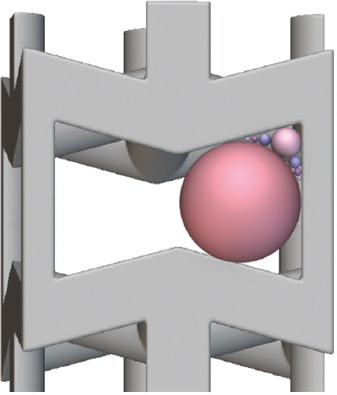
Schematization of the wall thickness method used in dragonfly ORS software to evaluate the pore size.
Percentage variations of the as-manufactured sample with respect to the CAD highlight an undersizing of the strut and of the pore due to printing. This result is more evident in the histograms of both auxetic FGPSs as shown in Figure 10. Considering the auxetic FGPSs with θ = 15°, a maximum undersizing of 19% and 14% is observed for the pore size and strut thickness, respectively. Differently, the pore size of the auxetic FGPS with θ = 25° is undersized of a maximum of 15% and the strut thickness of a maximum of 22%. The undersizing of both the pore and the strut is associated with the surface irregularity of the structures. In detail, since both the strut and the pore were analyzed using the wall thickness method, the diameter of the sphere inscribed inside the pore is affected by the surface irregularity and the unmelted powder as shown in Figure 11.
Figure 10.
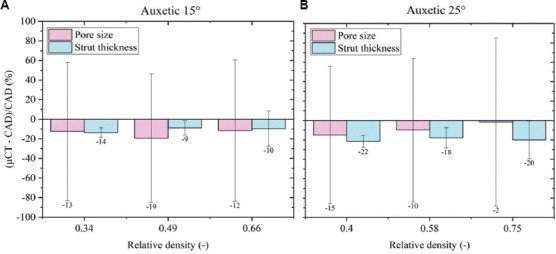
Computer-aided design deviation using μ-CT analysis for auxetic functionally graded porous structures with (A) θ = 15° and (B) θ = 25°.
Figure 11.
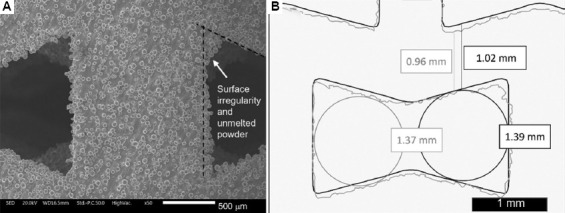
(A) Details of surface irregularity and unmelted powder. (B) Influence of the surface irregularity on the pore and strut size analysis in a simplified 2D view overlapping computer-aided design (black) with μ-CT scan (grey).
2D (SEM) and 3D (μ-CT) metrological data on both auxetic FGPSs are compared in Figure 12. 2D metrological characterization highlights a subdimension of the strut and an oversizing of the pore due to the printing process in both auxetic FGPSs with the exception for the auxetic θ = 25° high density level, where the loss of auxetic geometry affects the analysis. Differently, the 3D metrological analysis, considering the entire volume of the FGPSs, highlights a subdimension of the pore size and strut thickness for both auxetic FGPSs. As mentioned before, this is correlated with the surface irregularity that carries over to the pore shape inside the samples. 3D metrological analysis by means of μ-CT imaging is more precise since it evaluates all the volume differently from the SEM analysis, where only the external surfaces are evaluated. The big difference in pore size deviation between 2D and 3D techniques and the CAD are related to the large deviation of the CAD values due to the wall thickness method, as explained above. Nevertheless, considering the percentage variations, a maximum deviation from the CAD of around 20% is observed, highlighting a very good quality of the printed samples.
Figure 12.
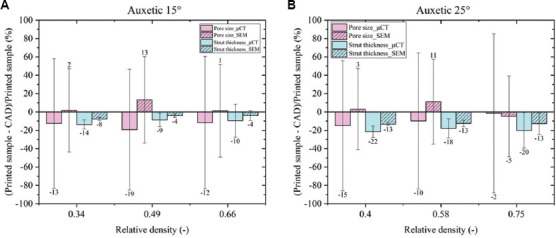
Comparison between 2D and 3D characterization in case of auxetic functionally graded porous structures with (A) θ = 15° and (B) θ = 25° and TPMS FGPSs with (C) 2.5 and (D) 4 mm of unit cell size.
3.3. Microstructural characterization
Light optical microscopy and SEM analyses of the as-built samples were performed to highlight the microstructure (Figure 13). Figure 13A and B show the irregularity of the strut surface and the presence of unmelted powders attached to the surface. Microstructure parallel and perpendicular to the building direction are shown in Figure 13C and D. The melting pool boundaries are empathized in Figure 13C, and the traces of alternate scan strategy with a scanning rotation of 45° are highlighted in Figure 13D. The partial remelting of previous consolidated layers leads to an epitaxial growth of β grains along the heat flow direction (Figure 13C). A columnar structure along the building direction is evident (Figure 13E) and some partially melted powders are detected inside the material (as detailed in Figure 13F). Absence of visible precipitate due to a metastable structure obtained in LPBF since the high cooling rate is emphasized at higher magnification (Figure 13F) as demonstrated in a previous work[18]. A low number of defects such as lack of fusion and pores due to entrapped gas are observed after the 3D printing process.
Figure 13.
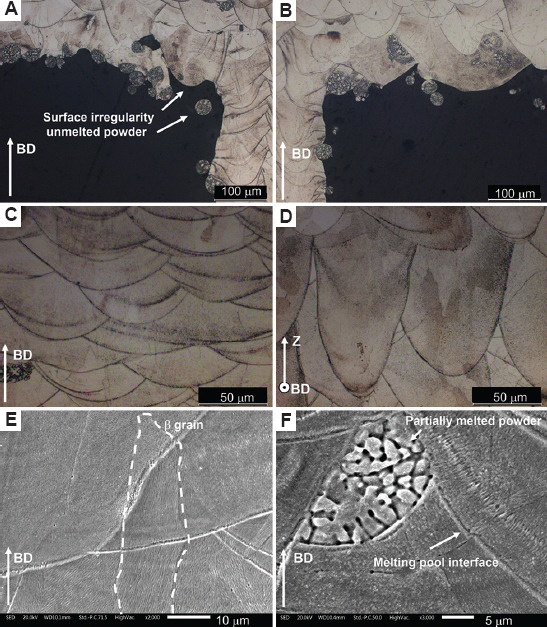
Light optical microscopy micrographs of auxetic functionally graded porous structures (A, B) with surface irregularity and unmelted powder, (C) along the building direction, (D) parallel to the building direction, and (E, F) scanning electron microscopy micrograph details at higher magnification to highlight b grains, melting pool interface and unmelted powders.
The influence of the different relative density level and of the different θ angle on the surface irregularity is shown in Figure 14. In detail, an excess of material on the connection between struts in cases of 0.34, 0.49, and 0.66 density levels for θ = 15° are shown in Figure 14A, B and C, respectively. The excess of material at the corner of the auxetic cell is evident in all the relative density levels without differences. Higher amount of material in the corner is observed considering the auxetic structure with θ = 25° at a relative density of 0.40 (Figure 14D), 0.58 (Figure 14E) and 0.75 (Figure 14F). Therefore, with an increase of the θ angle, the excess of material at the corners increases, denoting reduced accuracy in the printability of the strut-base structure. No effect of the different relative density levels is detected also in case of auxetic with θ = 25°.
Figure 14.
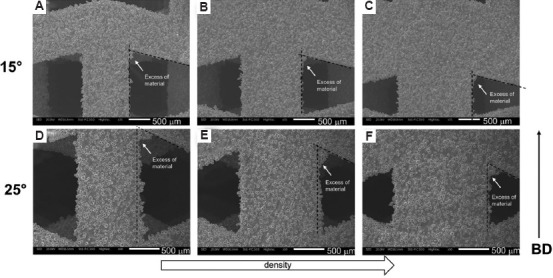
Scanning electron microscopy details of the strut surface irregularities and of the excess of material at the corners of auxetic structure with θ = 15° and relative density of (A) 0.34, (B) 0.49, (C) 0.66, and with θ = 25° and relative density of (D) 0.40, (E) 0.58, and (F) 0.75.
3.4. Quasi-static and cyclic compression tests
Quasi static compression curves and examples of cyclic tests between 20% and 70% of yield stress are shown in Figure 15. Based on Maxwell’s stability criteria that consider the number of nodes and struts present in a structure, the re-entrant honeycombs auxetic structure used in this work is characterized by a bending-dominated behavior (M < 0)[22]. Despite this, after the yielding point, the quasi-static compression curves for the two FPGSs (Figure 15A) show two small collapses (indicated with number 1 and 2 on the curves) in both auxetic structures. Details of the two collapses are shown in Figure 15C for both auxetic structures. After that, a densification stage occurs, leading to an increased slope of the stress-strain curve until a fully dense material is obtained. Quasi-elastic modulus as the slope of the linear part of the curve and yield stress obtained by shifting the linear curve at the 0.2% of deformation are evaluated. Since the quasi-elastic gradient is affected by the poor stability of the cellular structures during the first loading cycle, especially in case of high porosity, five loading-unloading cycles between 20% and 70% of the yield stress (i.e., in the elastic deformation regime) are necessary to stabilize the mechanical behavior[41]. The elastic modulus obtained after the first stabilization is the so-called cyclic elastic modulus, E cyclic. This is evident considering Figure 15B, where the slope, indicative of the elastic modulus, changes after the first loading-unloading cycle and remains constant in the subsequent four cycles. This justifies the necessity to preload the cellular structure to stabilize the elastic modulus.
Figure 15.
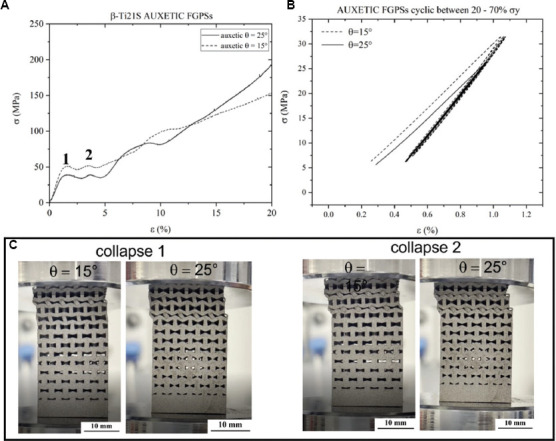
(A) Quasi-static compression curves and (B) cyclic curves between 20% and 70% of the yield stress for both auxetic functionally graded porous structures. (C) Details of the two collapses observed in the quasi-static compression curves of both auxetic structures.
The quasi-elastic modulus, the yield stress, and the cyclic elastic modulus after the first load stabilization are presented in Table 5. A compression yield strength higher than the one of the trabecular bone (0.8 – 11.6 MPa) is measured for both auxetic FPGSs[55]. In both cases, a stabilized elastic modulus of around 4 GPa is obtained, in line with the one of the cancellous bone. A simulation analysis of the elastic modulus considering the different density levels was performed to validate a theoretical approach and reduce the number of experimental tests to characterize a cellular structure. Numerical homogenization method was performed considering the designed (E homnom.) and the printed (E homreal.) strut thickness, and the elastic modules are summarized in Table 6 and compared with stabilized elastic modules.
Table 5.
Summary of the quasi-elastic modulus and yield stress of the two auxetic FGPSs
| FGPSs | E quasi-elastic (GPa) | σy (MPa) | E cyclic (GPa) |
|---|---|---|---|
| Auxetic θ = 15° | 3.8±0.8 | 48.0±1.3 | 4.2±0.1 |
|
| |||
| Auxetic θ = 25° | 3.2±0.6 | 40.6±0.6 | 4.1±0.1 |
FGPS: Functionally graded porous structures
Table 6.
Summary of Yong’s modulus obtained by means of homogenization method on the single unit cell (nTopology software)
| Auxetic FGPSs | Relative density ρr (-) | E hom nom. (GPa) | E hom real. (GPa) |
|---|---|---|---|
| θ = 15° | 0.34 | 2.62 | 2.02 |
|
| |||
| 0.49 | 5.31 | 4.86 | |
|
| |||
| 0.66 | 9.53 | 8.42 | |
|
| |||
| θ = 25° | 0.40 | 2.58 | 1.59 |
|
| |||
| 0.58 | 5.31 | 3.81 | |
|
| |||
| 0.75 | 19.17 | 6.04 | |
FGPS: Functionally graded porous structures
As expected, an increased relative density leads to an increased elastic modulus. The effect of the θ angle is evident from the comparison between the different relative density levels obtained by changing the θ angle. A lower elastic modulus is observed by increasing the θ angle even if with a quite higher relative density level (comparing the relative density of 0.34 – 0.40, 0.49 – 0.58 and 0.66 – 0.75 in case of θ = 15° and 25°, respectively). A more accurate analysis was obtained considering the printed strut thickness. The as-designed and the as-printed strut thickness values were used to calculate the homogenized properties for each cell dimension and density level using the software nTopology (nTopology Inc. USA). Several finite element simulations were conducted on a single cell to compute the homogenized stiffness matrix for the equivalent fictitious material. Further details on the homogenization principles and techniques can be obtained from Alwattar et al.[50] and Kim et al.[51]. The cells were meshed with a symmetric mesh and able to improve the computational accuracy of the homogenization. On top of that, a convergence analysis was performed on the models’ mesh in order to achieve accurate results. The stiffness values assessed in this way were input into Equation III to evaluate the Young’s modulus of the FGPSs. The obtained numerical values are presented in Table 7 along with the experimental elastic modulus (Ecyclic).
Table 7.
Elastic modulus of the two auxetic FGPSs obtained by experimental analysis and through homogenization using nominal strut dimension and the real one
| Auxetic FGPSs | E cyclic (GPa) | E FGPS hom nom. (GPa) | E FGPS hom real. (GPa) |
|---|---|---|---|
| θ = 15° | 4.2±0.1 | 4.88 (16%) | 4.03 (−4%) |
|
| |||
| θ = 25° | 4.1±0.1 | 5.24 (28%) | 3.13 (−24%) |
FGPS: Functionally graded porous structures
The theoretical values obtained by means of the homogenization method and springs arranged in series (Equation III) lead to a discrepancy from the experimental values of around 16% and 28% considering the as-designed strut thickness in case of auxetic FGPSs with θ = 15° and 25°, respectively. A refined analysis using the as-printed values defined by μ-CT scan permits to obtain a value very close to the experimental one in the case of θ = 15°. This does not happen in the case of auxetic structures with θ = 25° where the value becomes 24% smaller than the experimental one. To shed light on this unexpected discrepancy, the effective Gibson-Ashby constants for both auxetic structures were defined, as shown in Figure 16, and based on the nominal values of relative density and strut thickness. Since the bending-dominated nature of the auxetic unit cell, addition of the theoretical curves in case of a pure bending-dominated behavior (C1 = 1 and n1 = 2[48,56,57]) is shown in Figure 16. The plots permit to obtain C1 = 0.41 and 0.75 and n1 = 1.95 and 3.10 for the auxetic structure with θ = 15° and θ = 25°, respectively. The R2 in case auxetic with θ = 25° is quite small (0.86) and it is justified considering the loss of the auxetic geometry in the case of the higher relative density that impairs the applicability of the adopted homogenization method. To overcome this limitation, a fully solid finite element model could be developed, but due to its low computational efficiency, it is not proposed in this analysis. A slope quite close to the pure bending-dominated behavior is observed in the case of auxetic with θ = 15°. Differently, considering θ = 25°, higher slope is detected. Nevertheless, this value is affected by excessive streamlining obtained by using homogenization method in the high density level where the loss of auxetic structure occurs. Neglecting the elastic modulus of the specimen portion with 0.75 relative density, the slope becomes equal to 1.94, which is very close to the one expected for a pure bending-dominated behavior. This important result reveals that the relative porosity cannot exceed a certain threshold for the metamaterial to display its microarchitecture-dependent properties.
Figure 16.
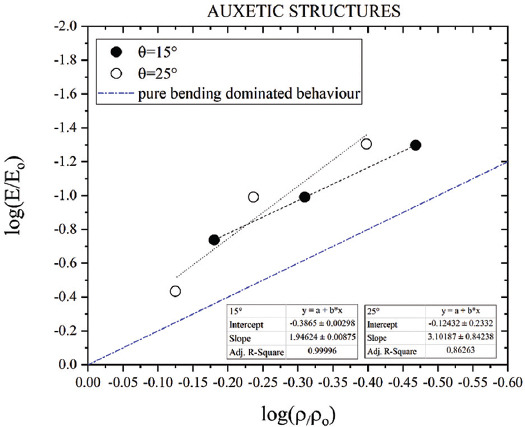
Log-log plot of the Gibson-Ashby model for Young’s modulus for both auxetic structures and comparison with a pure bending-dominated behavior.
Figure 17 shows the elastic modulus of the auxetic FGPSs for Ti-21S and the Ti-6Al-4V alloys evaluated by means of homogenization method and Equation III. In light of the elastic modulus of the two bulk materials (E = 52GPa for Ti-21S, E = 110GPa for Ti-6Al-4V), a reduction of around 53% is observed by using the novel β-Ti alloy to produce the FGPSs.
Figure 17.
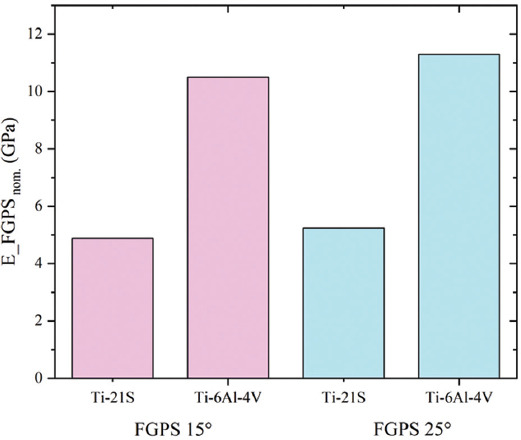
Elastic modulus of the auxetic functionally graded porous structures defined by means of homogenization method and Equation III considering the Ti-21S and the Ti-6Al-4V alloys
4. Conclusion
2D and 3D metrological characterizations were carried out on two different auxetic FGPSs with aspect ratio equal to 1.5 and angle θ of 15° and 25°, corresponding to relative density gradients of 0.34 – 0.49 – 0.66 and of 0.40 – 0.58 – 0.75, respectively. Quasi-static and cyclic compression tests were performed to evaluate quasi-elastic modulus, yield stress and cyclic Young’s modulus. Simulation analyses based on the homogenization method were conducted, and the results obtained were compared with the experimental values. The main results of the study may be summarized as follows:
(i). 2D metrological characterization by SEM highlights a subdimension of the strut and an oversizing of the pore size due to laser printing process in both auxetic FGPSs with the exception for the auxetic θ = 25° high density level, where the loss of the auxetic geometry affects the analysis.
(ii). 3D metrological characterization by X-ray μ-CT imaging shows an undersizing of both the pore size and strut thickness because of the surface irregularity and unmelted powders on the strut surface with higher accumulation at the corners of the auxetic geometry. The excess of material at the corners increased by increasing the q angle, and the results were not affected by the different relative density level.
(iii). The 3D metrological characterization, by means of μ-CT imaging, permits a more holistic method to evaluate the printability of the auxetic FGPSs thanks to the analysis of the entire volume.
(iv). A good correlation between calculated and experimental mechanical properties is obtained. A refined analysis using real strut thickness leads to an elastic modulus very close to the experimental one in the case of θ = 15°. This confirms that the homogenization method and the spring in series analysis works well in the prediction of the elastic modulus. On the other hand, for the auxetic structure with θ = 25°, the E value becomes 24% smaller than the experimental one. This highlights the excess streamlining of the homogenization method in the case of too high density level where the loss of auxetic structure occurs.
Acknowledgments
None.
Funding
This work is part of the project N. 2020.0042 - ID 50430, “Produzione additiva di protesi ortopediche a struttura trabecolare in Ti-beta” funded by Fondazione Cariverona.
Conflict of interest
The authors declare that they have no know financial interests or personal relationships that could have appeared to influence the work reported in this paper.
Author contributions
Conceptualization: Lorena Emanuelli
Investigation: Lorena Emanuelli, Alireza Jam, Raffaele De Biasi, Carlo Lora
Methodology: Lorena Emanuelli, Raffaele De Biasi, Anton du Plessis, Matteo Benedetti, Massimo Pellizzari
Resources: Lorena Emanuelli, Raffaele De Biasi
Writing – original draft: Lorena Emanuelli, Raffaele De Biasi, Anton du Plessis, Matteo Benedetti, Massimo Pellizzari
Writing – review & editing: All authors
Ethics approval and consent to participate
Not applicable.
Consent for publication
Not applicable.
Availability of data
No additional data are available to the public.
References
- 1.Geetha M, Singh AK, Asokamani R, et al. Ti based biomaterials, the ultimate choice for orthopaedic implants-a review. Prog Mater Sci. 2009;54:397–425. https://doi.org/10.1016/j.pmatsci.2008.06.004. [Google Scholar]
- 2.Gepreel MA, Niinomi M. Biocompatibility of Ti-alloys for long-term implantation. J Mech Behav Biomed Mater. 2013;20:407–415. doi: 10.1016/j.jmbbm.2012.11.014. https://doi.org/10.1016/j.jmbbm.2012.11.014. [DOI] [PubMed] [Google Scholar]
- 3.Kumar A, Nune KC, Misra RD. Biological functionality and mechanistic contribution of extracellular matrix-ornamented three dimensional Ti-6Al-4V mesh scaffolds. J Biomed Mater Res Part A. 2016;104:2751–2763. doi: 10.1002/jbm.a.35809. https://doi.org/10.1002/jbm.a.35809. [DOI] [PubMed] [Google Scholar]
- 4.Wang X, Xu S, Zhou S, et al. Topological design and additive manufacturing of porous metals for bone scaffolds and orthopaedic implants:A review. Biomaterials. 2016;83:127–141. doi: 10.1016/j.biomaterials.2016.01.012. https://doi.org/10.1016/j.biomaterials.2016.01.012. [DOI] [PubMed] [Google Scholar]
- 5.International Organization for Standardization. ISO 5832-2:1999, Implants for Surgery-metallic Materials-Part 2:Unalloyed titanium. International Organization for Standardization; Geneva, Switzerland: 1999. p. 3. [Google Scholar]
- 6.International Organization for Standardization, (n.d.), ISO 5832-14:2019-implants for Surgery-metallic Materials-Part 14:Wrought Titanium 15-molybdenum 5-zirconium 3-aluminium alloy. International Organization for Standardization; Geneva, Switzerland: [Google Scholar]
- 7.Materials Properties Handbook, (n.d.), Titanium Alloys. ASM International; Almere, Netherlands: [Last accessed on 2022 Jul 13]. Available from: https://www.asminternational.org/materials-resources/results/-/journal_content/56/10192/06005g/publication . [Google Scholar]
- 8.ASTM, (n.d.) F1295-16-standard Specification for Wrought Titanium-6Aluminum-7Niobium Alloy for Surgical Implant Applications (UNS R56700) ASTM International; Pennsylvania: [Google Scholar]
- 9.ASTM, (n.d.) F3046-21-standard Specification for Wrought Titanium-3Aluminum-2.5Vanadium Alloy for Surgical Implant Applications (UNS R56320) ASTM International; Pennsylvania: [Google Scholar]
- 10.ASTM, (n.d.) F2066-18-standard Specification for Wrought Titanium-15 Molybdenum Alloy for Surgical Implant Applications (UNS R58150) ASTM International; Pennsylvania: [Google Scholar]
- 11.ASTM, (n.d.) F1813-21-standard Specification for Wrought Titanium-12Molybdenum-6Zirconium-2Iron Alloy for Surgical Implant (UNS R58120) ASTM International; Pennsylvania: [Google Scholar]
- 12.Polozov I, Sufiiarov A, Popovich A, et al. Synthesis of Ti-5Al, Ti-6Al-7Nb, and Ti-22Al-25Nb alloys from elemental powders using powder-bed fusion additive manufacturing. J Alloys Compd. 2018;763:436–445. https://doi.org/10.1016/j.jallcom.2018.05.325. [Google Scholar]
- 13.Bolzoni L, Ruiz-Navas EM, Gordo E. TMS 2014 143rd Annual Meeting and Exhibiton. Springer; Champaign: 2014. On the microstructure and properties of the Ti-3Al-2.5V alloy obtained by powder metallurgy; pp. 121–128. https://doi.org/10.1007/978-3-319-48237-8_17. [Google Scholar]
- 14.Brunke F, Siemers C, Rösler J. Second-generation titanium alloys Ti-15Mo and Ti-13Nb-13Zr:A comparison of the mechanical properties for implant applications. MATEC Web Conf. 2020;321:05006. https://doi.org/10.1051/matecconf/202032105006. [Google Scholar]
- 15.Duan R, Li S, Cai B, et al. A high strength and low modulus metastable b Ti-12Mo-6Zr-2Fe alloy fabricated by laser powder bed fusion in-situ alloying. Addit Manuf. 2021;37:101708. https://doi.org/10.1016/j.addma.2020.101708. [Google Scholar]
- 16.Claros CA, Campanelli LC, Jorge AM, et al. Corrosion behaviour of biomedical β-Titanium alloys with the surface-modified by chemical etching and electrochemical methods. Corros Sci. 2021;188:109544. https://doi.org/10.1016/j.corsci.2021.109544. [Google Scholar]
- 17.Macias-Sifuentes MA, Xu C, Sanchez-Mata O, et al. Microstructure and mechanical properties of b-21S Ti alloy fabricated through laser powder bed fusion. Prog Addit Manuf. 2021;6:417–430. https://doi.org/10.1007/s40964-021-00181-7. [Google Scholar]
- 18.Pellizzari M, Jam A, Tschon M, et al. A 3D-printed ultra-low young's modulus β-Ti alloy for biomedical applications. Materials (Basel) 2020;13:2792. doi: 10.3390/ma13122792. https://doi.org/10.3390/ma13122792. [DOI] [PMC free article] [PubMed] [Google Scholar]
- 19.Jam A, du Plessis A, Lora C, et al. Manufacturability of lattice structures fabricated by laser powder bed fusion:A novel biomedical application of the beta Ti-21S alloy. Addit Manuf. 50:102556. https://doi.org/10.1016/J.ADDMA.2021.102556. [Google Scholar]
- 20.Gibson LJ, Ashby MF, Harley BA. (n.d.), Cellular Materials in Nature and Medicine. Cambridge University Press; Cambridge, United Kingdom: p. 309. [Google Scholar]
- 21.Ashby MF. The properties of foams and lattices. Philos Trans A Math Phys Eng Sci. 2005;364:15–30. doi: 10.1098/rsta.2005.1678. https://doi.org/10.1098/RSTA.2005.1678. [DOI] [PubMed] [Google Scholar]
- 22.Benedetti M, du Plessis A, Ritchie RO, et al. Architected cellular materials:A review on their mechanical properties towards fatigue-tolerant design and fabrication. Mater Sci Eng R Rep. 2021;144:100606. https://doi.org/10.1016/j.mser.2021.100606. [Google Scholar]
- 23.Zadpoor AA. Mechanical performance of additively manufactured meta-biomaterials. Acta Biomater. 2019;85:41–59. doi: 10.1016/j.actbio.2018.12.038. https://doi.org/10.1016/j.actbio.2018.12.038. [DOI] [PubMed] [Google Scholar]
- 24.Kolken HM, Janbaz S, Leeflang SM, et al. Rationally designed meta-implants:A combination of auxetic and conventional meta-biomaterials. Mater Horizons. 2018;5:28–35. https://doi.org/10.1039/c7mh00699c. [Google Scholar]
- 25.Albertini F, Dirrenberger J, Sollogoub C, et al. Experimental and computational analysis of the mechanical properties of composite auxetic lattice structures. Addit Manuf. 2021;47:102351. https://doi.org/10.1016/j.addma.2021.102351. [Google Scholar]
- 26.Kolken HM, Garcia AF, Du Plessis A, et al. Fatigue performance of auxetic meta-biomaterials. Acta Biomater. 2021;126:511–523. doi: 10.1016/j.actbio.2021.03.015. https://doi.org/10.1016/j.actbio.2021.03.015. [DOI] [PubMed] [Google Scholar]
- 27.Kolken HM, Zadpoor AA. Auxetic mechanical metamaterials. RSC Adv. 2017;7:5111–5129. https://doi.org/10.1039/c6ra27333e. [Google Scholar]
- 28.Kolken HM, Lietaert K, van der Sloten T, et al. Mechanical performance of auxetic meta-biomaterials. J Mech Behav Biomed Mater. 2020;104:103658. doi: 10.1016/j.jmbbm.2020.103658. https://doi.org/10.1016/j.jmbbm.2020.103658. [DOI] [PubMed] [Google Scholar]
- 29.Nečemer B, Kramberger J, Vuherer T, et al. Fatigue crack initiation and propagation in re-entrant auxetic cellular structures. Int J Fatigue. 2019;126:241–247. https://doi.org/10.1016/j.ijfatigue.2019.05.010. [Google Scholar]
- 30.Mizzi L, Spaggiari A. Chiralisation of euclidean polygonal tessellations for the design of new auxetic metamaterials. Mech Mater. 2021;153:103698. https://doi.org/10.1016/j.mechmat.2020.103698. [Google Scholar]
- 31.Yadroitsava I, du Plessis A, Yadroitsev I. Titanium for Consumer Applications Real-world Use Titanium. Elsevier Publishing Company; Amsterdam, Netherlands: 2019. Bone regeneration on implants of titanium alloys produced by laser powder bed fusion:A review; pp. 197–233. https://doi.org/10.1016/B978-0-12-815820-3.00016-2. [Google Scholar]
- 32.Shi J, Zhu L, Li L, et al. A TPMS-based method for modeling porous scaffolds for bionic bone tissue engineering. Sci Rep. 2018;8:7395. doi: 10.1038/s41598-018-25750-9. https://doi.org/10.1038/s41598-018-25750-9. [DOI] [PMC free article] [PubMed] [Google Scholar]
- 33.Mahmoud D, Elbestawi MA. Selective laser melting of porosity graded lattice structures for bone implants. Int J Adv Manuf Technol. 2019;100:2915–2927. https://doi.org/10.1007/s00170-018-2886-9. [Google Scholar]
- 34.Zhao S, Li SJ, Wang SG, et al. Compressive and fatigue behavior of functionally graded Ti-6Al-4V meshes fabricated by electron beam melting. Acta Mater. 2018;150:1–15. https://doi.org/10.1016/j.actamat.2018.02.060. [Google Scholar]
- 35.Surmeneva MA, Surmenev RA, Chudinova EA, et al. Fabrication of multiple-layered gradient cellular metal scaffold via electron beam melting for segmental bone reconstruction. Mater Des. 2017;133:195–204. https://doi.org/10.1016/j.matdes.2017.07.059. [Google Scholar]
- 36.Dursun AM, Tüzemen MC, Salamci E, et al. Investigation of compatibility between design and additively manufactured parts of functionally graded porous structures. J Polytech. 2022;25:1069–1082. https://doi.org/10.2339/politeknik.891080. [Google Scholar]
- 37.Tüzemen MC, Salamcı E, Ünal R. Investigation of the relationship between flexural modulus of elasticity and functionally graded porous structures manufactured by AM. Mater Today Commun. 2022;31:103592. https://doi.org/10.1016/j.mtcomm.2022.103592. [Google Scholar]
- 38.De Galarreta SR, Doyle RJ, Jeffers J, et al. Laser powder bed fusion of porous graded structures:A comparison between computational and experimental analysis. J Mech Behav Biomed Mater. 123:104784. doi: 10.1016/j.jmbbm.2021.104784. https://doi.org/10.1016/j.jmbbm.2021.104784. [DOI] [PubMed] [Google Scholar]
- 39.Liu YJ, Wang HL, Li SJ, et al. Compressive and fatigue behavior of beta-type titanium porous structures fabricated by electron beam melting. Acta Mater. 2017;126:58–66. https://doi.org/10.1016/j.actamat.2016.12.052. [Google Scholar]
- 40.Luo JP, Huang YJ, Xu JY, et al. Additively manufactured biomedical Ti-Nb-Ta-Zr lattices with tunable Young's modulus:Mechanical property, biocompatibility, and proteomics analysis. Mater Sci Eng C Mater Biol Appl. 2020;114:110903. doi: 10.1016/j.msec.2020.110903. https://doi.org/10.1016/j.msec.2020.110903. [DOI] [PubMed] [Google Scholar]
- 41.Gordon JV, Narra SP, Cunningham RW, et al. Defect structure process maps for laser powder bed fusion additive manufacturing. Addit Manuf. 2020;36:101552. https://doi.org/10.1016/J.ADDMA.2020.101552. [Google Scholar]
- 42.Tang M, Pistorius PC, Beuth JL. Prediction of lack-of-fusion porosity for powder bed fusion. Addit Manuf. 2017;14:39–48. https://doi.org/10.1016/j.addma.2016.12.001. [Google Scholar]
- 43.Zhang B, Li Y, Bai Q. Defect formation mechanisms in selective laser melting:A review. Chin J Mech Eng. 2017;30:515–527. https://doi.org/10.1007/S10033-017-0121-5. [Google Scholar]
- 44.Alaña M, Cutolo A, Probst G, et al. Understanding elastic anisotropy in diamond based lattice structures produced by laser powder bed fusion:Effect of manufacturing deviations. Mater Des. 2020;195:108971. https://doi.org/10.1016/j.matdes.2020.108971. [Google Scholar]
- 45.Hildebrand T, Rüegsegger P. A new method for the model-independent assessment of thickness in three-dimensional images. J Microsc. 1997;185:67–75. https://doi.org/10.1046/J.1365-2818.1997.1340694.X. [Google Scholar]
- 46.ASTM, (n.d.) E407 Standard Practice for Microetching Metals and Alloys. United States: Document Center Inc; [Google Scholar]
- 47.International Organization for Standardization, (n.d.) ISO 13314:2011-mechanical Testing of Metals-ductility Testing-compression Test for Porous and Cellular Metals. International Organization for Standardization; Geneva, Switzerland: [Google Scholar]
- 48.Benedetti M, Klarin J, Johansson F, et al. Study of the compression behaviour of Ti6Al4V trabecular structures produced by additive laser manufacturing. Materials (Basel) 2019;12:1471. doi: 10.3390/ma12091471. https://doi.org/10.3390/MA12091471. [DOI] [PMC free article] [PubMed] [Google Scholar]
- 49.Schmitz A, Horst P. A finite element unit-cell method for homogenised mechanical properties of heterogeneous plates. Compos Part A Appl Sci Manuf. 2014;61:23–32. https://doi.org/10.1016/j.compositesa.2014.01.014. [Google Scholar]
- 50.Alwattar TA, Mian A. Development of an elastic material model for BCC lattice cell structures using finite element analysis and neural networks approaches. J Compos Sci. 2019;3:33. https://doi.org/10.3390/jcs3020033. [Google Scholar]
- 51.Kim HS, Al-Hassani ST. Effective elastic constants of two-dimensional cellular materials with deep and thick cell walls. Int J Mech Sci. 2003;45:1999–2016. https://doi.org/10.1016/j.ijmecsci.2004.02.002. [Google Scholar]
- 52.Webb DC, Kormi K, Al-Hassani ST. Use of FEM in performance assessment of perforated plates subject to general loading conditions. Int J Press Vessel Pip. 1995;64:137–152. https://doi.org/10.1016/0308-0161(94)00078-W. [Google Scholar]
- 53.Yang L, Harrysson O, West H, et al. Mechanical properties of 3D re-entrant honeycomb auxetic structures realized via additive manufacturing. Int J Solids Struct. 2015;69–70:475–490. https://doi.org/10.1016/j.ijsolstr.2015.05.005. [Google Scholar]
- 54.Murchio S, Dallago M, Zanini F, et al. Additively manufactured Ti-6Al-4V thin struts via laser powder bed fusion:Effect of building orientation on geometrical accuracy and mechanical properties. J Mech Behav Biomed Mater. 2021;119:104495. doi: 10.1016/j.jmbbm.2021.104495. https://doi.org/10.1016/j.jmbbm.2021.104495. [DOI] [PubMed] [Google Scholar]
- 55.Yuan L, Ding S, Wen C. Additive manufacturing technology for porous metal implant applications and triple minimal surface structures:A review. Bioact Mater. 2019;4:56–70. doi: 10.1016/j.bioactmat.2018.12.003. https://doi.org/10.1016/j.bioactmat.2018.12.003. [DOI] [PMC free article] [PubMed] [Google Scholar]
- 56.Deshpande VS, Ashby MF, Fleck NA. Foam topology:Bending versus stretching dominated architectures. Acta Mater. 2001;49:1035–1040. https://doi.org/10.1016/S1359-6454(00)00379-7. [Google Scholar]
- 57.Wang AJ, McDowell DL. In-plane stiffness and yield strength of periodic metal honeycombs. J Eng Mater Technol. 2004;126:137–156. https://doi.org/10.1115/1.1646165. [Google Scholar]
Associated Data
This section collects any data citations, data availability statements, or supplementary materials included in this article.
Data Availability Statement
No additional data are available to the public.


