

Abstract
Objective
High frequency of low birth weight (LBW) is observed in rural compared with urban Indian women. Since maternal BMI is known to be associated with pregnancy outcomes, the present study aimed to investigate factors associated with BMI in early pregnancy of urban and rural South Indian women.
Design
Prospective observational cohort.
Setting
A hospital-based study conducted at an urban and a rural health centre in Karnataka State.
Subjects
Pregnant women (n 843) aged 18–40 years recruited in early pregnancy from whom detailed sociodemographic, environmental, anthropometric and dietary intake information was collected.
Results
A high proportion of low BMI (32 v. 26 %, P<0·000) and anaemia (48 v. 23 %, P<0·000) was observed in the rural v. the urban cohort. Rural women were younger, had lower body weight, tended to be shorter and less educated. They lived in poor housing conditions, had less access to piped water and good sanitation, used unrefined fuel for cooking and had lower standard of living score. The age (β=0·21, 95 % CI 0·14, 0·29), education level of their spouse (β=1·36, 95 % CI 0·71, 2·71) and fat intake (β=1·24, 95 % CI 0·20, 2·28) were positively associated with BMI in urban women.
Conclusions
Our findings indicate that risk factors associated with BMI in early pregnancy are different in rural and urban settings. It is important to study population-specific risk factors in relation to perinatal health.
Keywords: Urban–rural geographic location, Hygiene and environment, Education, Macronutrients and pregnancy
The prevalence of low birth weight (LBW; babies born weighing less than 2500g) is high in developing countries like India and is a public health priority owing to its immediate and long-term consequences. The 2005–06 Indian National Family Health Survey (NFHS-3) showed that nearly 20 % of births were LBW, with a higher proportion in rural compared with urban populations (23 v. 19 %, respectively)( 1 ). A comparative study on birth outcomes among rural and urban women in West India showed that rural babies at term were lighter (2·67 v. 3·03kg), smaller in length (47·9 v. 49·0cm) and had higher prevalence of LBW (26·9 v. 7·11 %)( 2 ). These rural–urban variations in LBW are very conspicuous, making it important to evaluate the factors that underlie these differences( 1 ).
Various maternal determinants of LBW have been identified in different studies on women residing in urban and rural areas, but these have not been measured simultaneously with the same frameworks. For example, maternal age at pregnancy, interpregnancy interval, gestational age at delivery, weight of the mother and anaemia during pregnancy have been shown to be strong determinants of LBW in a cohort of rural Indian pregnant women( 3 ). Further, the intakes of green leafy vegetables, milk and fruit in rural pregnant women were also associated with birth size( 2 , 4 ) and lower intakes of these food groups were observed in rural compared with urban women( 5 ). In a separate urban study in a tertiary hospital in North India( 6 ), joint families and illiteracy were major determinants of LBW. Thus, there are clear disparities observed among urban and rural areas. Previous studies also demonstrate that there is a greater prevalence of adverse birth outcomes such as LBW and preterm birth in rural regions of the country as compared with urban regions. However, in several of the foregoing studies, the determinants of LBW in urban and rural regions were not captured concurrently using similar methodologies across sites. Much of the current literature exploring anthropometric and other disparities by rural or urban residency is based on NFHS-1 surveillance data( 7 ), but these data do not represent women in early pregnancy, as measurements were obtained at varying time points during pregnancy. In addition, previous studies have generally used single measures of socio-economic and environmental and maternal health status or have employed conventional measures, such as income and education, without regard to how other indicators of wealth could influence BMI. To overcome these limitations, a systematic study conducted concurrently in rural and urban environments, using the same theoretical framework and standardized measurements, is required to improve our understanding of the modifiable factors that influence the differing BMI in these populations. BMI is a vital indicator of nutritional status during pregnancy and has been shown to be associated with adverse pregnancy and neonatal outcomes. Besides, BMI is a potential factor that could be targeted for intervention during the antenatal period or in the pre-pregnancy period to improve maternal and neonatal outcomes. Therefore, we sought to compare the demographic, socio-economic, environmental, nutritional and maternal characteristics of urban and rural women in early pregnancy, obtained from a prospective birth cohort, and explored factors associated with BMI among urban and rural women in early pregnancy.
Methods
Participants from a prospective birth cohort, the South Asian Birth Cohort (START), from rural and urban India were eligible for the current analysis. Pregnant women in the urban cohort were recruited from St. John’s Medical College Hospital (SJMCH), Bangalore (latitude: 12·930865°; longitude: 77·618868°) and the rural cohort was drawn from Snehalaya Mission Hospital, Soluru, in Ramnagara district of Karnataka State (latitude: 13·074529°; longitude: 77·240379°). SJMCH is a 1200-bed tertiary hospital which draws patients of diverse socio-economic status (SES), from urban slums to high-income residential areas. Snehalaya is a maternity hospital catering to the needs of 90 000 inhabitants from Soluru and the surrounding villages in Ramnagara district of Karnataka. Soluru village belongs to the Bangalore rural district and is defined as rural according to the Census of India 2011( 8 ) and the National Sample Survey Organization.
The urban and rural sites were chosen as per the classifications of the Census of India 2011( 8 ). The census data in India are generally presented for the rural and urban areas separately. Urban is defined as (i) all statutory towns, i.e. all places with a municipal corporation, municipal board, cantonment board or notified town area, etc., and (ii) all other places which satisfy the following criteria: a minimum population of 5000; 75 % of the male working population engaged in non-agricultural and allied activities; and a population density of at least 400 inhabitants per square kilometre (or 1000 inhabitants per square mile). Territory, population and housing units that the Census Bureau does not classify as urban based on the area are classified as rural.
The Institutional Ethical Review Board of SJMCH Bangalore approved all study procedures and written and signed consent was obtained from study participants at enrolment.
The detailed methodology and objectives of the cohort have been previously published( 9 , 10 ). In brief, all apparently healthy pregnant women aged 18–40 years in early pregnancy, who registered for antenatal screening at the Department of Obstetrics and Gynecology at SJMCH and at Snehalaya, were invited to participate in the study. Women with multiple fetuses, those with a clinical diagnosis of chronic illness such as diabetes mellitus, hypertension, heart disease and thyroid disease, those who tested positive for hepatitis B surface antigen/HIV/syphilis infection, or who anticipated moving out of the area before delivery, were excluded. All eligible women willing to participate were recruited before 15 weeks of gestation and were followed until delivery. Details pertaining to sociodemographic and general characteristics (such as age, education, type of family and composition, parity, obstetric history, medical history), dietary intake, anthropometry and physical activity were obtained. Information on environmental and hygienic living conditions, including type of housing, type of cooking fuel, source of drinking-water and sanitation, was captured, similar to the NFHS categories( 11 , 12 ). The standard of living index (SLI) was defined in terms of ownership of household goods and grouped into categories based on the scores as: low SLI (0–14), medium SLI (15–24) and high SLI (25–67)( 11 ). Body weight was measured on a digital weighing scale (Soehnle, Reutlingen, Germany) to the nearest 100g and height was measured with a stadiometer to the nearest 0·1 cm. Maternal weight and height were used to calculate BMI (kg/m2) to define undernourished, normal, overweight and obese at recruitment using standard definitions (undernourished as BMI≤18·5kg/m2; normal as BMI=18·5–24·9kg/m2; overweight as BMI=25·0–29·9kg/m2; and obese as BMI≥30kg/m2)( 12 ). Body composition measures such as fat mass, fat-free mass and fat percentage were estimated using prediction equations( 13 ) and calculated from the skinfold thicknesses measured at three sites (biceps, triceps and subscapular) to the nearest 0·2mm using skinfold callipers (Holtain, Crymych, UK). A validated FFQ was administered at recruitment to obtain information on habitual dietary intake for the preceding 3 months( 14 ). Protein deficiency in early pregnancy was defined as per the RDA for Indians. For an approximate gestational weight gain of 10kg, the protein requirement recommended is 1, 7 and 23g/d for the first, second and third trimester of pregnancy, respectively. The first trimester cut-off was used to define protein deficiency, as we report on the observations in early pregnancy( 15 ). Physical activity was obtained based on a previously validated physical activity questionnaire( 16 , 17 ). At recruitment, blood Hb concentration was analysed using an automated cyanmethaemoglobin technique (ABX Pentra 60 C+haematology analyser; Horiba ABX Diagnostics, Germany). The measuring range was between 8 and 18g/dl with a within-run precision of <1·0 %. Anaemia during pregnancy was defined as Hb <11·0g/dl( 18 ).
All subjects received routine antenatal care. The data at both the sites were collected by trained research assistants. Periodic training in administration of standardized questionnaires, FFQ and anthropometry measurements was conducted. Anthropometric tools such as weighing scales (adults and infants), stadiometers and infantometers, skinfold callipers, measuring tapes and blood pressure apparatus were similar in make and model at both study sites and were calibrated once per month using standard measures and techniques. The research assistants were certified for the anthropometric measurements against the lead anthropometrist. The data collected were entered on the electronic database. To ensure that data entered were correct, double data entry was carried out by two independent operators and supervisory checks were performed. The analysis for the current study was performed on 519 urban and 324 rural pregnant women who were recruited for the prospective pregnancy cohort (Fig. 1). Maternal characteristics such as age, gestational age at recruitment and SLI were comparable between the subjects who were lost to follow-up and those who remained in the study. In the urban cohort, seven women discontinued the study: age (22·0 v. 23·8 years, P=0·181, t test), gestational age at recruitment (10·6 v. 11·5 weeks, P=0·253, t test) and SLI (medium: 14·3 v. 40·0 %, high: 85·7 v. 96·0 %; P=0·260, χ 2 test). In the rural cohort, fifty-eight women (15·2 %) discontinued the study: age (21·0 v. 21·4 years; P=0·312, t test), gestational age at recruitment (13·1 v. 13·3 weeks; P=0·103, t test) and SLI (medium: 8·5 v. 13 %, high: 91·5 v. 86·4 %; P=0·514, χ 2 test).
Fig. 1.
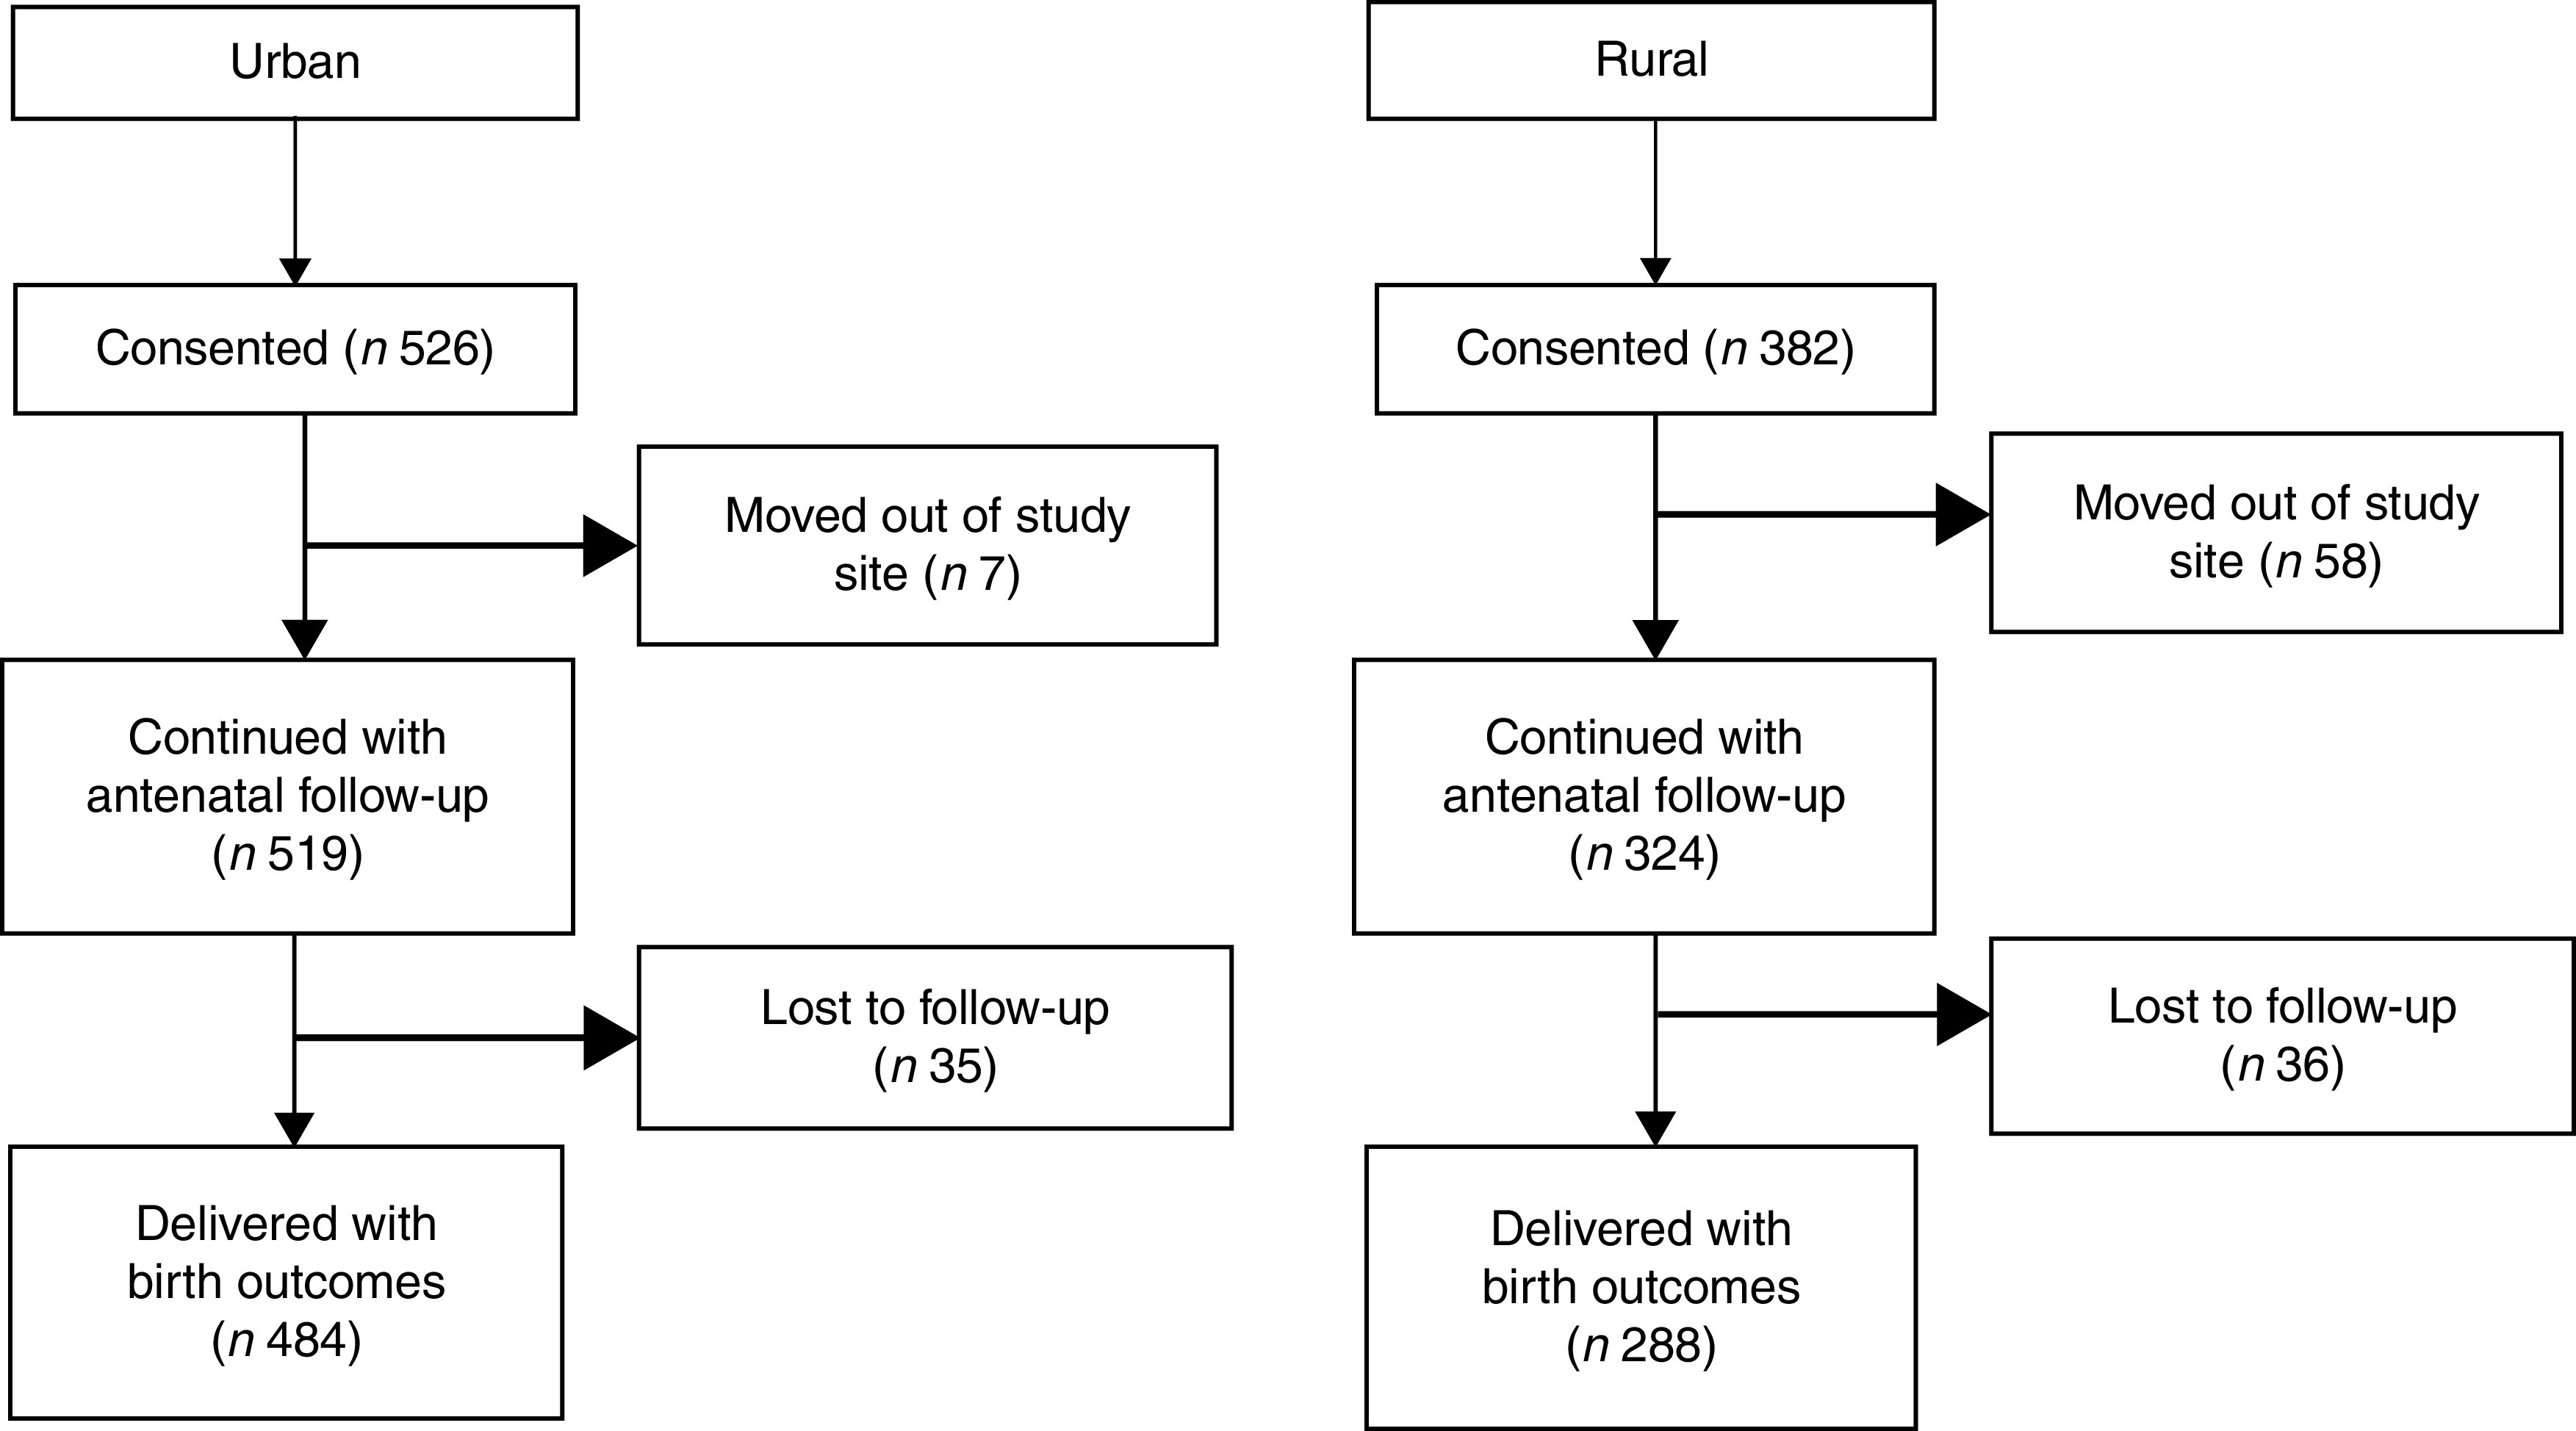
Flowchart of the study participants
Data that were continuous were checked for normality using normal probability plots and values were indicated as mean and standard deviation if normally distributed, otherwise as median and interquartile range. Sociodemographic characteristics, environmental variables, maternal anthropometry, physical activity and dietary intake were compared between urban and rural pregnant women using the independent-samples t test or χ 2 test. Further, linear regression of BMI v. each of these characteristics was performed for the whole group and separately for the urban and rural cohorts to examine their effects on BMI. Although the urban subjects came from affluent areas as well as slums or semi-urban regions, we observed that 96 % of them belonged to higher class by the SLI. Hence the urban cohort was not further categorized as urban and semi-urban. These analyses are presented as model 1. All variables with P<0·10 were considered together for the next level of multiple linear regression analysis, which is presented as model 2. Multicollinearity between the independent variables was examined using the χ 2 test as most the variables were categorical, and were considered collinear if the χ 2 test was statistically significant. If multiple variables were collinear, the variable that was most strongly associated with BMI was included in model 2. This analysis was performed in the overall group and the interaction of these with place of residence (rural v. urban) was examined to understand the differential effect of each of these by place of residence on BMI. Regression coefficients (β) and corresponding 95 % CI are presented.
Two-sided P<0·05 was considered statistically significant for all statistical tests except the interaction terms. Interaction was considered statistically significant at P<0·10. All analyses were performed using the statistical software package IBM SPSS Statistics for Windows version 18.0.
Results
The sociodemographic characteristics of the urban and rural women at baseline are shown in Table 1. The rural women were significantly younger (~21 v. 24 years, P<0·001) and less educated in comparison to the urban women (P=0·001). A similar trend of educational qualification was observed in the spouses in both the groups (P=0·001). The majority (97 %) of the rural women reported that they were unemployed during pregnancy. There were fewer rural pregnant women in the high SLI category compared with the urban cohort (Table 1). The majority of rural housing was semi-pucca (mud walls and thatched roofs) or kaccha (weak houses; 80 %) and almost 50 % of rural households used non-refined sources of cooking fuel such as kerosene, while only 20 % of urban women had semi-pucca housing and only 4 % of them used non-refined sources of fuel for cooking purposes. The main source of drinking-water differed significantly between the two groups, with most of the rural women using public sources as compared with the urban cohort who had water piped into the residence. With regard to sanitation, about 36 % of rural women did not have a toilet facility and reported open defecation in the fields or used shared pit toilets as compared with 8 % of urban households (Table 2). The rural cohort had a higher proportion of joint and extended families compared with the urban cohort (joint families: 25 v. 18 %; extended families: 51 v. 44 % respectively). About 78 % of the rural women were primiparous compared with 55 % in the urban cohort.
Table 1.
Baseline demographic and socio-economic characteristics of pregnant women from the urban and rural cohorts, the South Asian Birth Cohort (START), February 2011–September 2015
| All data (n 843) | Urban (n 519) | Rural (n 324) | |||||
|---|---|---|---|---|---|---|---|
| Characteristic | Mean or n | sd or % | Mean or n | sd or n | Mean or n | sd or n | P value |
| Age (years)*, mean and sd | 22·9 | 3·4 | 23·8 | 3·5 | 21·4 | 2·6 | 0·001 |
| Woman’s education†, n and % | |||||||
| Up to high school | 354 | 42·0 | 166 | 32·0 | 188 | 58·0 | 0·001 |
| Diploma/PUC | 274 | 32·5 | 161 | 31·0 | 113 | 34·9 | |
| University & above | 215 | 25·5 | 192 | 37·0 | 23 | 7·1 | |
| Husband’s education†, n and % | |||||||
| Up to high school | 406 | 48·2 | 189 | 36·4 | 217 | 67·0 | 0·001 |
| Diploma/PUC | 223 | 26·5 | 13 | 27·6 | 80 | 24·7 | |
| University & above | 214 | 25·4 | 187 | 36·0 | 27 | 8·3 | |
| Working outside during pregnancy†, n and % | |||||||
| Homemakers | 741 | 87·9 | 426 | 82·1 | 315 | 97·2 | 0·001 |
| Working | 102 | 12·1 | 93 | 17·9 | 9 | 2·8 | |
| Woman’s occupation†, n and % | |||||||
| Unemployed | 731 | 86·7 | 424 | 81·7 | 307 | 94·8 | 0·001 |
| Unskilled | 28 | 3·3 | 14 | 2·7 | 14 | 4·3 | |
| Skilled/self-employed/semi-professional & professional | 84 | 10·0 | 81 | 15·6 | 3 | 0·9 | |
| SLI, mean and sd | 30·7 | 4·9 | 31·2 | 4·4 | 29·8 | 5·5 | 0·001 |
| SLI score†, n and % | |||||||
| Low | 2 | 0·2 | 0 | 0·0 | 2 | 0·6 | 0·001 |
| Medium | 63 | 7·5 | 21 | 4·0 | 42 | 13·0 | |
| High | 778 | 92·3 | 498 | 96·0 | 280 | 86·4 | |
PUC, pre-university course (an intermediate course, known as ‘10+2’, of two years’ duration taken up after 10th class of formal schooling); SLI, standard of living index.
P<0·001; independent-samples t test of significance; difference between the two sites.
P<0·001; χ 2 test of significance; difference between the two sites.
Table 2.
Hygienic living conditions, environmental and obstetric history of pregnant women from the urban and rural cohorts, the South Asian Birth Cohort (START), February 2011–September 2015
| All data (n 843) | Urban (n 519) | Rural (n 324) | |||||
|---|---|---|---|---|---|---|---|
| Characteristic | n or Mean | % or sd | n or Mean | % or sd | n or Mean | % or sd | P value |
| Family type*, n and % | |||||||
| Nuclear | 276 | 32·7 | 199 | 38·3 | 77 | 23·8 | |
| Joint | 173 | 20·5 | 92 | 17·7 | 81 | 25·0 | <0·001 |
| Extended | 394 | 46·7 | 228 | 43·9 | 166 | 51·2 | |
| Family composition†, mean and sd | |||||||
| Number of adults in the family | 3·9 | 1·9 | 3·7 | 1·9 | 4·1 | 1·9 | 0·003 |
| Number of children in the family | 0·5 | 1·0 | 0·6 | 0·9 | 0·5 | 1·0 | 0·545 |
| Parity*, n and % | |||||||
| First time pregnant | 540 | 64·1 | 288 | 55·5 | 252 | 77·8 | 0·001 |
| Multiparous | 303 | 35·9 | 231 | 44·5 | 72 | 22·2 | |
| Living children*, n and % | |||||||
| No children | 643 | 76·3 | 369 | 71·1 | 274 | 84·6 | |
| One or more child | 200 | 23·7 | 150 | 28·9 | 50 | 15·4 | 0·001 |
| Type of housing*, n and % | |||||||
| Pucca | 483 | 57·3 | 418 | 80·5 | 65 | 20·1 | |
| Kaccha/semi-pucca | 360 | 42·7 | 101 | 19·5 | 259 | 79·9 | 0·001 |
| Separate kitchen, n and % | 812 | 96·3 | 507 | 97·7 | 305 | 94·1 | 0·007 |
| Type of fuel* used for cooking, n and % | |||||||
| Coal/charcoal/kerosene/others | 179 | 21·2 | 18 | 3·5 | 161 | 49·7 | |
| Electricity/LPG/biogas | 664 | 78·8 | 501 | 96·5 | 163 | 50·3 | 0·001 |
| Source of light*, n and % | |||||||
| Kerosene | 54 | 6·4 | 34 | 6·6 | 20 | 6·2 | |
| Electricity | 789 | 93·6 | 485 | 93·4 | 304 | 93·8 | 0·001 |
| Source of drinking-water*, n and % | |||||||
| Public tap/hand pump/well or other water source | 494 | 58·6 | 234 | 45·1 | 260 | 80·2 | |
| Private pipe/hand pump/well | 349 | 41·4 | 285 | 54·9 | 64 | 19·8 | 0·001 |
| Toilet facility*, n and % | |||||||
| Shared pit toilet or no facility | 156 | 18·5 | 40 | 7·7 | 116 | 35·8 | |
| Own flush toilet or shared flush toilet or own pit toilet | 687 | 81·5 | 479 | 92·3 | 208 | 64·2 | 0·001 |
LPG, liquified petroleum gas.
P<0·001; χ 2 test of significance; difference between the two sites.
P<0·05; t test of significance; difference between the two sites.
Rural women were lighter and tended to be shorter than urban women (~48 v. 51kg, P<0·001; 155 v. 156cm, P=0·08, respectively). The proportion of women with low BMI (<18·5kg/m2), indicative of undernutrition, was 32 and 26 % among rural and urban women, respectively, while a lower proportion of overweight and obese subjects was observed in the rural cohort compared with the urban cohort (3·3 v. 12·6 %, respectively, P<0·001). Table 3 provides other details of the anthropometric characteristics of the study subjects at the time of recruitment. Almost 50 % of the rural women were anaemic in contrast to only about a quarter of the urban cohort (47·6 and 23·2 % anaemic, respectively).
Table 3.
Anthropometry and body composition characteristics of the pregnant women from the urban and rural cohorts, the South Asian Birth Cohort (START), February 2011–September 2015
| All data | Urban | Rural | |||||
|---|---|---|---|---|---|---|---|
| Characteristic | Mean or n | sd or % | Mean or n | sd or % | Mean or n | sd or % | P value |
| GA (weeks), mean and sd | 11·5 | 2·2 | 11·6 | 2·1 | 11·5 | 2·2 | 0·615 |
| n | 765 | – | 519 | – | 246 | – | |
| Weight (kg)*, mean and sd | 49·7 | 8·2 | 50·7 | 8·6 | 47·6 | 6·9 | 0·001 |
| n | 763 | – | 519 | – | 244 | – | |
| Height (cm), mean and sd | 155·4 | 5·5 | 155·6 | 5·8 | 154·9 | 4·7 | 0·080 |
| n | 761 | – | 519 | – | 242 | – | |
| BMI (kg/m2)*, mean and sd | 20·6 | 3·2 | 20·9 | 3·3 | 19·8 | 2·7 | 0·001 |
| n | 761 | – | 519 | – | 242 | – | |
| BMI category†, n and % | |||||||
| n | 761 | – | 519 | – | 242 | – | |
| Low BMI | 215 | 28·3 | 137 | 26·4 | 78 | 32·1 | 0·000 |
| Normal BMI | 473 | 62·2 | 317 | 61·1 | 157 | 64·4 | |
| Overweight | 67 | 8·8 | 61 | 11·8 | 6 | 2·5 | |
| Obese | 6 | 0·8 | 4 | 0·8 | 2 | 0·8 | |
| Body composition | |||||||
| n | 753 | – | 519 | – | 237 | – | |
| %Fat‡, mean and sd | 28·6 | 4·3 | 29·0 | 4·8 | 27·6 | 2·9 | 0·001 |
| FM (kg)*, mean and sd | 14·5 | 4·3 | 15·0 | 4·7 | 13·3 | 3·1 | 0·001 |
| FFM (kg)*, mean and sd | 35·2 | 4·4 | 36·7 | 4·5 | 34·3 | 4·2 | 0·001 |
| Hb concentration and anaemia prevalence | |||||||
| n | 776 | – | 488 | – | 288 | – | |
| Hb level (g/dl)*, mean and sd | 11·5 | 1·4 | 11·7 | 1·3 | 10·9 | 1·3 | 0·001 |
| Anaemia§, n and % | 250 | 32·2 | 113 | 23·2 | 137 | 47·6 | 0·001 |
GA, gestational age at recruitment (≤15 weeks); low BMI, BMI≤18·5 kg/m2; normal BMI, BMI=18·5–24·9 kg/m2; overweight, BMI=25·0–29·9 kg/m2; obese, BMI≥30·0 kg/m2; %Fat, percentage fat; FM, fat mass; FFM, fat-free mass; anaemia, Hb<11·0 g/dl.
P<0·001; t test of significance; difference between the two sites.
P<0·05; χ 2 test of significance; difference between the two sites.
P<0·05; t test of significance; difference between the two sites.
P<0·001; χ 2 test of significance; difference between the two sites.
Daily dietary macronutrient intakes, adjusted for body weight, were significantly lower in the rural pregnant women compared with the urban cohort, with lower intakes of all macronutrients. A higher proportion at risk for protein deficiency was observed in the rural compared with the urban women (55·7 v. 43·4 %, P=0·001). Lower intakes of milk or milk products and non-vegetarian foods in the rural area contributed to the difference in protein intake (Table 4). The rural pregnant women had a significantly higher physical activity level (1·53 v. 1·44; P<0·001), spent more energy (~470kJ, P<0·001) in household chores and spent less time in sleep compared with the urban pregnant women (see online supplementary material, Supplemental Table 1).
Table 4.
Nutritional characteristics and food group intakes of pregnant women from the urban and rural cohorts, the South Asian Birth Cohort (START), February 2011–September 2015
| All data (n 740) | Urban (n 502) | Rural (n 238) | |||||
|---|---|---|---|---|---|---|---|
| Characteristic | Median | IQR | Median | IQR | Median | IQR | P value |
| Energy (kJ/kg per d)* | 146·0 | 120·1–177·4 | 152·7 | 125·5–185·8 | 134·7 | 110·9–159·0 | 0·001 |
| Energy (kcal/kg per d)* | 34·9 | 28·7–42·4 | 36·5 | 30·0–44·4 | 32·2 | 26·5–38·0 | 0·001 |
| Protein (g/kg per d)† | 1·02 | 0·84–1·24 | 1·06 | 0·86–1·29 | 0·97 | 0·78–1·14 | 0·001 |
| Protein (E%)† | 11·7 | 11·0–12·3 | 11·6 | 10·9–12·3 | 11·9 | 11·2–12·5 | 0·001 |
| Protein deficiency‡,§ | 346 | 47·3 | 218 | 43·4 | 128 | 55·7 | 0·001 |
| Fat (g/kg per d) | 0·91 | 0·71–1·15 | 0·97 | 0·77–1·23 | 0·77 | 0·63–0·96 | 0·001 |
| Fat (E%) | 23·5 | 20·7–26·3 | 24·1 | 21·5–26·9 | 22·1 | 19·6–24·5 | 0·001 |
| Carbohydrate (g/kg per d)* | 5·61 | 4·58–6·93 | 5·79 | 4·82–7·19 | 5·26 | 4·32–6·35 | 0·001 |
| Carbohydrate (E%) | 64·9 | 61·7–68·0 | 64·3 | 61·1–67·2 | 66·0 | 62·9–68·9 | 0·001 |
| Saturated fat (g/kg per d)* | 0·31 | 0·23–0·41 | 0·34 | 0·26–0·44 | 0·25 | 0·20–0·32 | 0·001 |
| Saturated fat (E%) | 8·0 | 6·5–9·5 | 8·3 | 6·8–9·7 | 7·2 | 6·0–8·6 | 0·001 |
| All data (n 746) | Urban (n 502) | Rural (n 244) | |||||
| Food group intake (g/d) | Median | IQR | Median | IQR | Median | IQR | P value |
| Cereals† | 225 | 183–279 | 232 | 189–291 | 206 | 173–260 | 0·001 |
| Legumes | 43·2 | 32·5–54·0 | 42·2 | 31·3–53·6 | 44·7 | 36·6–57·3 | 0·065 |
| Vegetables* | 78·9 | 54·5–107·8 | 87·6 | 60·9–115·9 | 63·3 | 46·3–84·0 | 0·001 |
| Fats and oils* | 19·9 | 15·0–25·7 | 21·9 | 17·4–27·9 | 15·6 | 12·4–20·1 | 0·001 |
| Sugar and sweets* | 16·2 | 9·5–24·5 | 18·6 | 11·3–26·8 | 12·8 | 7·3–18·0 | 0·001 |
| Fruits* | 106·8 | 57·6–186·6 | 132·5 | 75·3–227·3 | 63·4 | 34·7–107·4 | 0·001 |
| Non-vegetarian† | 25·1 | 8·73–44·9 | 28·6 | 9·9–47·1 | 20·5 | 6·5–35·7 | 0·001 |
| Milk and milk products* | 272·3 | 166·9–434·8 | 337·5 | 200·3–505·9 | 195·6 | 122·9–280·4 | 0·001 |
IQR, interquartile range; E%, energy percentage; protein deficiency, protein intake of <1 g/kg body weight; non-vegetarian foods, intakes of eggs + fish + meat and poultry.
P<0·001; t test of significance; difference between the two sites.
P<0·05; t test of significance; difference between the two sites.
P<0·05; χ 2 test of significance; difference between the two sites.
Protein deficiency represented as number and percentages.
In unadjusted combined cohort analysis, maternal BMI in the first trimester was positively associated with maternal age (β=0·20, P<0·001), higher education of the woman and spouse (university level and above; β=1·35 and 1·53, respectively, both P<0·001), multiparity (β=0·48, P=0·019), hygiene parameters, family type, having a household toilet facility, electricity or liquified petroleum gas as cooking fuel, SLI score, and energy, protein and fat intakes (Table 5). The hygiene-related variables exhibited high collinearity with SLI as they were also components of SLI. Since the SLI is a comprehensive indicator of SES, it was included in the multiple linear regression analysis of the combined cohort. The women’s age and their husband’s educational level (collinear with woman’s educational level) were statistically significantly associated with BMI. Women whose spouse had a university degree had a higher BMI (β adjusted for university level education and above=0·92, P=0·002) compared with women whose spouse was educated only up to high school. Higher SLI also tended to be associated with higher BMI (β adjusted=0·05, P=0·058).
Table 5.
Linear regression of maternal BMI with sociodemographic, environmental, nutritional and physical activity characteristics of pregnant women from the urban and rural cohorts at recruitment, the South Asian Birth Cohort (START), February 2011–September 2015
| Unadjusted (model 1) | Adjusted (model 2) | |||||||||
|---|---|---|---|---|---|---|---|---|---|---|
| Overall* (n 740) | Urban (n 502) | Rural (n 238) | Overall | Interaction with | ||||||
| β | 95 % CI | β | 95 % CI | β | 95 % CI | β | 95 % CI | place of residence | P value | |
| Rural resident | −1·07 | −1·54, −0·59 | −0·35 | −1·05, 0·36 | ||||||
| GA (weeks) | 0·11 | 0·01, 0·21 | 0·11 | −0·02, 0·24 | 0·11 | −0·03, 0·25 | 0·16 | 0·05, 0·26 | −0·006 | 0·952 |
| Age (years) | 0·20 | 0·14, 0·27 | 0·21 | 0·14, 0·29 | 0·03 | −0·10, 0·16 | 0·14 | 0·06, 0·21 | −0·18 | 0·027 |
| Number of adults in household | −0·07 | −0·18, 0·05 | −0·01 | −0·16, 0·13 | −0·09 | −0·27, 0·09 | −0·07 | 0·559 | ||
| Number of children in household | 0·12 | −0·12, 0·36 | 0·25 | −0·04, 0·55 | −0·29 | −0·68, 0·10 | −0·54 | 0·044 | ||
| Family type | ||||||||||
| Nuclear | Ref. | Ref. | Ref. | Ref. | Ref. | |||||
| Extended | −0·77 | −1·27, −0·25 | −0·52 | −1·14, 0·11 | −0·98 | −1·86, −0·11 | −0·37 | −0·90, 0·16 | −0·46 | 0·430 |
| Joint | −0·49 | −1·12, 0·14 | 0·07 | −0·74, 0·89 | −1·07 | −2·07, −0·07 | −0·23 | −0·90, 0·44 | −1·14 | 0·102 |
| Woman’s education level | ||||||||||
| Up to high school | Ref. | Ref. | Ref. | Ref. | ||||||
| Diploma/PUC | 0·03 | −0·49, 0·55 | −0·19 | −0·09, 0·51 | 0·14 | −0·61, 0·88 | 0·32 | 0·547 | ||
| University & above | 1·35 | 0·81, 1·90 | 1·02 | 0·35, 1·70 | 0·94 | −0·48, 2·36 | −0·09 | 0·92 | ||
| Husband’s education level | ||||||||||
| Up to high school | Ref. | Ref. | Ref. | Ref. | ||||||
| Diploma/PUC | 0·26 | −0·27, 0·80 | −0·15 | −0·85, 0·55 | 0·78 | −0·03, 1·58 | 0·15 | −0·41, 0·71 | 0·92 | 0·107 |
| University & above | 1·53 | 0·99, 2·06 | 1·36 | 0·71, 2·71 | 0·04 | −1·23, 1·32 | 0·92 | 0·31, 1·54 | −1·31 | 0·009 |
| Working at the start of pregnancy | 0·65 | −0·03, 1·34 | 0·31 | −0·42, 1·05 | −1·06 | −6·48, 4·36 | ||||
| Working during pregnancy | 0·34 | −0·32, 0·99 | 0·31 | −0·42, 1·05 | −1·90 | −3·64, 0·18 | ||||
| Multiparous | 0·48 | 0·02, 0·95 | 0·29 | −0·28, 0·86 | 0·27 | −0·55, 1·11 | 0·008 | −0·49, 0·50 | −0·01 | 0·983 |
| Toilet facility | ||||||||||
| Own flush toilet or shared flush toilet or own pit toilet | 0·80 | 0·22, 1·38 | 0·47 | −0·59, 1·52 | 0·26 | −0·44, 0·97 | 0·21 | −0·48, 0·90 | −0·21 | 0·754 |
| Shared pit toilet or no facility | Ref. | Ref. | Ref. | |||||||
| Drinking-water source | ||||||||||
| Private pipe/hand pump/well | 0·45 | −0·004, 0·90 | 0·21 | −0·36, 0·78 | −0·32 | −1·24, 0·61 | −0·53 | 0·379 | ||
| Public tap/hand pump or well or other water source | Ref. | Ref. | Ref. | Ref. | ||||||
| Separate kitchen | ||||||||||
| Yes | 0·51 | −0·73, 1·75 | 0·10 | −1·79, 1·98 | 0·42 | −1·07, 1·91 | ||||
| No | Ref. | Ref. | Ref. | |||||||
| Type of cooking fuel | ||||||||||
| Electricity/LPG/biogas | 1·04 | 0·47, 1·60 | 0·61 | −0·94, 2·16 | 0·41 | −0·29, 0·10 | −0·12 | −0·89, 0·65 | −0·20 | 0·811 |
| Coal/charcoal/kerosene or other | Ref. | Ref. | Ref. | Ref. | Ref. | |||||
| SLI | 0·08 | 0·03, 0·12 | 0·09 | 0·03, 0·15 | 0·02 | −0·04, 0·09 | 0·05 | −0·01, 0·11 | −0·07 | 0·154 |
| SLI score | ||||||||||
| Low | Ref. | Ref. | Ref. | |||||||
| Medium | −3·49 | −9·72, 2·77 | – | −3·82 | −9·29, 1·65 | |||||
| High | −2·72 | −8·91, 3·48 | 0·53 | −0·91, 1·97 | −3·46 | −8·87, 1·95 | ||||
| Physical activity level | −0·16 | −1·23, 0·90 | 1·30 | −0·28, 2·88 | −0·87 | −2·20, 0·46 | ||||
| Time spent in sedentary activity (min) | −0·0005 | −0·003, 0·002 | −0·001 | −0·004, 0·002 | 0·0002 | −0·005, 0·005 | ||||
| Sleep duration during night (min) | −0·002 | −0·004, 0·001 | −0·004 | −0·007, −0·0005 | −0·003 | −0·008, 0·002 | −0·002 | −0·005, 0·001 | 0·001 | 0·928 |
| Hb (g/dl) | −0·02 | −0·11, 0·08 | −0·06 | −0·18, 0·05 | 0·04 | −0·15, 0·23 | ||||
| Energy | ||||||||||
| Tertile 1 | Ref. | Ref. | Ref. | Ref. | Ref. | |||||
| Tertile 2 | 0·40 | −0·16, 0·95 | 0·24 | −0·51, 0·99 | 0·17 | −0·66, 0·99 | −0·13 | −0·79, 0·52 | −0·07 | 0·908 |
| Tertile 3 | 0·87 | 0·31, 1·41 | 0·67 | −0·06, 1·39 | 0·12 | −0·99, 1·14 | −0·19 | −1·04, 0·66 | −0·55 | 0·419 |
| Protein | ||||||||||
| Tertile 1 | Ref. | Ref. | Ref. | Ref. | ||||||
| Tertile 2 | 0·53 | −0·11, 1·18 | 0·82 | −0·03, 1·67 | −0·12 | −1·11, 0·86 | −0·85 | 0·153 | ||
| Tertile 3 | 1·06 | 0·08, 2·05 | 1·36 | 0·17, 2·55 | −0·24 | −1·58, 2·07 | −0·92 | 0·170 | ||
| Fat | ||||||||||
| Tertile 1 | Ref. | Ref. | Ref. | Ref. | Ref. | |||||
| Tertile 2 | 0·37 | −0·24, 0·98 | 0·51 | −0·31, 1·33 | −0·25 | −1·17, 0·66 | 0·11 | −0·54, 0·77 | −0·59 | 0·317 |
| Tertile 3 | 1·09 | 0·26, 1·92 | 1·24 | 0·20, 2·28 | −0·44 | −1·98, 1·11 | 0·57 | −0·29, 1·42 | −1·24 | 0·092 |
| Carbohydrate | ||||||||||
| Tertile 1 | Ref. | Ref. | Ref. | |||||||
| Tertile 2 | 0·20 | −0·54, 0·78 | −0·08 | −0·95, 0·78 | 0·36 | −0·69, 1·41 | ||||
| Tertile 3 | 0·24 | −0·80, 1·28 | −0·06 | −1·31, 1·18 | 0·92 | −1·06, 2·91 | ||||
| Saturated fat | ||||||||||
| Tertile 1 | Ref. | Ref. | Ref. | |||||||
| Tertile 2 | 0·26 | −0·35, 0·87 | 0·40 | −0·43, 1·22 | −0·14 | −1·02, 0·73 | ||||
| Tertile 3 | 0·66 | −0·11, 1·44 | 0·74 | −0·24, 1·71 | −0·63 | −2·06, 0·82 | ||||
GA, gestational age at recruitment (≤15 weeks); PUC, pre-university course (an intermediate course, known as ‘10+2’, of two years’ duration taken up after 10th class of formal schooling); LPG, liquified petroleum gas; SLI, standard of living index; Ref., referent category.
Model 1, simple linear regression analysis; model 2, multiple-variable linear regression analysis.
Analysis adjusting for site.
In multiple linear regression that included the interaction of location (rural v. urban) with each of the statistically significant variables in model 1, it was observed that there was a significant interaction with maternal age (β interaction=−0·18, P=0·027; such that the difference in slope for the two areas was 0·18), where BMI was positively associated with maternal age in the urban cohort but not in the rural cohort. Similarly, the number of children in the household also had a significant interaction effect (β interaction=−0·54, P=0·044; such that the difference in slope for the two areas was 0·54), with BMI being negatively associated with number of children in the household in the rural cohort and not in the urban cohort. Another significant interaction effect was that of spouse’s education level, such that the association with BMI was significant only among the urban women. Fat intake in the highest tertile was associated with BMI among the urban pregnant women (β interaction=−1·24, P=0·092) but not among rural women.
Discussion
In the present paper, we have reported simultaneously measured differences between urban and rural South Indian pregnant women recruited in the START India cohort during early gestation with reference to a framework that evaluated sociodemographic, hygiene and environmental living conditions, anthropometry, physical activity and dietary intakes and their effects on maternal BMI in early pregnancy. We observed that rural pregnant women were younger, less educated, more often homemakers and had lower SLI scores compared with the urban cohort. Fewer families in the rural cohort had access to private piped water facilities and good sanitation, and the majority of rural pregnant women continued using high-pollution fuels for cooking purposes. In addition, more rural pregnant women were anaemic, had lower intakes of macronutrients, were protein deficient and had lower BMI compared with their urban counterparts. The disparities in socio-economic parameters, water, sanitation and hygiene, and nutritional status between rural and urban populations were similar to what has been documented in several previous research studies including the NFHS-2( 11 ).
In a framework of the social and economic determinants of health, maternal BMI is influenced by a combination of ‘behavioral factors such as diet, living conditions and environment factors which in turn are influenced by lower educational attainment and SES’( 19 ). However, findings from the present study suggest that the association of risk factors with BMI differs by place of residence, with some risk factors being more salient for the urban population while others may more accurately reflect the circumstances relevant to rural women.
While the level of maternal education has been consistently linked to women’s health and perinatal outcomes, in our urban population, the spouses’ educational attainment was associated with higher maternal BMI. This finding agrees with data from the NFHS-3, which showed a sharp decline in undernourishment among women as educational attainment among their husbands increased; the proportion of undernourished women was 38 % if the husband was illiterate, as against 15 % if the husband had attained more than a secondary level of education( 20 ). Similar to the husbands’ educational attainment, their employment status was also found to be significantly associated with their wives’ nutritional status( 20 ). There could be several reasons why this association was observed only among the urban cohort. One possibility is that higher educational attainment could have resulted in better employment opportunities and higher incomes, and hence better living conditions and better nutritional status, in an urban setting as opposed to rural India where there are fewer job opportunities. Yet another explanation could be due to selective mating in the direction set by the husband’s socio-economic (SES) milieu such that the husband’s SES dictates the selection of his spouse from a similar SES. Thus, the BMI of such women may be in the higher range due to better SES( 21 ). The association of higher maternal age with higher BMI in the urban cohort could be linked to parity, since the number of multiparous women in the urban cohort was significantly higher compared with the rural cohort and earlier studies have shown an association between maternal body weight and parity as a result of accumulated weight gain during successive pregnancies( 22 ). In less developed countries, this association is particularly noted among the economically better-off pregnant women( 23 ). In the present study, the urban cohort of pregnant women had a significantly higher standard of living compared with the rural cohort which may also explain the higher BMI. Our analysis revealed lower intakes of animal-source food groups and milk and milk products that reflected a diet with low quality protein and fat among rural women. It is well known that poor dietary habits with less nutrient-dense foods are associated with a lower maternal BMI( 24 ).
Our findings also illustrate how family size and rurality modify the associations between SES and maternal BMI. It is well known that family size is related to socio-economic and cultural factors and educational status, which in turn influence attitudes towards adopting family planning methods( 25 ). A study conducted in Karnataka by Caldwell et al. showed that large families are more common among those households with some agricultural land( 26 ). Whenever agriculture is an important activity for poor households, they have an incentive to invest in children to serve as farm labour and to assist with household tasks and childcare( 27 ). However, large family size in a rural population may also adversely impact the health of women, not only due to sharing of resources, especially food, but also because living conditions are worse compared with the urban region, thereby affecting their quality of life.
Our findings point to several factors linked to maternal BMI, an important variable that influences women’s health during pregnancy and perinatal health outcomes( 28 – 30 ). As has been emphasized recently by several researchers in the field of maternal and perinatal health, examination of multiple risk factors instead of single risk factors at a time is critical for understanding linkages between different risk factors in improving women’s health and perinatal outcomes through integrated interventions( 31 , 32 ). In addition, the association of environmental risk factors with maternal health and perinatal health outcomes may vary by context. In a study from Canada that examined the association between income disparities and perinatal outcomes, place of residence (urban v. rural) was an important effect modifier such that the level of urbanicity influenced the associations between SES and some of the outcomes( 33 ). While previous studies have looked at SES as a single comprehensive measure, our findings indicate that different measures of SES may operate through different pathways in relation to BMI in rural and urban populations. Thus, comprehensive measures of individual-level risk factors and neighbourhood-level deprivation and their interactions are important to understand the associations between environmental and demographic risk factors and maternal health and perinatal health outcomes. Our finding has important relevance in the context of public health intervention programmes that target women in the reproductive age group. The data from the current study suggest that public health interventions must identify and address population-specific risk factors that are influenced by geographic location of the population and other related demographic factors. In addition, interventions at multisectoral level to address multiple risk factors may prove more beneficial than traditional intervention models that have tended to target a single risk factor, such as nutritional status in improving the health of women of reproductive age. Nutritional counselling, awareness on cleanliness and hygiene, providing access to clean drinking-water and sanitation, and dietary interventions targeting adolescents and women of reproductive age will help in improving the health of women. Since rural women have lower BMI in early pregnancy, multiple-micronutrient supplement in undernourished and adolescent populations and in the pre-pregnancy stage may set a healthy foundation during pregnancy to deliver better maternal and perinatal outcomes. This will help in preventing and reducing the severity of long-term sequelae due to morbidities during pregnancy such as anaemia, undernutrition, and obstetric and gynaecological illness.
One of the strengths of the present study was that we captured several individual-level and community-level risk factors in cohorts of rural and urban pregnant women recruited at the same time point during early pregnancy (first trimester), using standardized methods and techniques. The limitation of our study was that the participants in each geographic location of the study sites were not randomly selected and thus may not be truly representative of urban and rural areas of India. However, the findings from the present study of significant differences in disparities in demographic, socio-economic and nutritional factors between rural and urban pregnant women in early pregnancy are largely in agreement with data from the NHFS-3( 34 ).
Conclusion
In conclusion, our study shows that the examination of multiple risk factors is important in understanding the observed inequalities in maternal health during early pregnancy. In addition, the pattern of risk factors associated with inequity in maternal health in early pregnancy varies by location of residence. Creation of ‘rural woman friendly’ policies should consider these aspects to ensure that these interventions are effective.
Acknowledgements
Acknowledgements: The authors greatly appreciate the assistance of C. Roopashree, N.M. Nancy, J. Peter and K. Tanushree in data collection. They thank the women and their infants who participated in the study and the doctors and nurses who made the study possible. Financial support: This study was supported by the Indian Council of Medical Research, New Delhi, India (grant number 58/4/3/ICMR-CIHR/2009-NCD-II). The funder had no role in the design, analysis or writing of this article. Conflict of interest: None of the authors declared a conflict of interest. Authorship: P.D., A.V., T.T., A.V.K. and K.S. took part in conceptualizing the study, analysing the data and writing the manuscript. P.D. and G.M. were involved in data collection. P.D., A.V., T.T., A.V.K. and K.S. were involved in analysing the data and writing the manuscript. S.S.A. and M.G. are Co-Investigators and D.D. is the Study Coordinator for the START Canadian Collaborators. K.S. is guarantor for the study. Ethics of human subject participation: This study was conducted according to the guidelines laid down in the Declaration of Helsinki and all procedures involving human subjects were approved by St. John’s Institutional Ethical Review Board (reference number 114/2010). Written informed consent was obtained from all study subjects. Reprints will not be available from the author.
Pratibha Dwarkanath and Anil Vasudevan are dual first authors.
Supplementary material
For supplementary material accompanying this paper visit https://doi.org/10.1017/S1368980017004025.
click here to view supplementary material
References
- 1. Ministry of Health and Family Welfare, Government of India (2005–2006) National fact sheet India. National Family Health Survey (NFHS-3), IIPS Child Health. http://www.iipsindia.ac.in/ (accessed May 2016).
- 2. Kanade AN, Rao S, Kelkar RS et al. (2008) Maternal nutrition and birth size among urban affluent and rural women in India. J Am Coll Nutr 27, 137–145. [DOI] [PubMed] [Google Scholar]
- 3. Kandhasamy K & Singh Z (2014) Determinants of low birth weight in a rural area of Tamil Nadu, India: a case–control study. Int J Med Sci Public Health 4, 376–380. [Google Scholar]
- 4. Rao S, Yajnik CS, Kanade A et al. (2001) Intake of micronutrient-rich foods in rural Indian mothers is associated with the size of their babies at birth: Pune Maternal Nutrition Study. J Nutr 131, 1217–1224. [DOI] [PubMed] [Google Scholar]
- 5. Han Z, Mulla S, Beyene J et al. (2011) Maternal underweight and the risk of preterm birth and low birth weight: a systematic review and meta-analyses. Int J Epidemiol 40, 65–101. [DOI] [PubMed] [Google Scholar]
- 6. Agarwal G, Ahmad S, Goel K et al. (2012) Maternal risk factors associated with low birth weight neonates in a tertiary care hospital, Northern India. J Community Med Health Educ 2, 1–4. [Google Scholar]
- 7. Ministry of Health and Family Welfare, Government of India (1992–1993) Household and background characteristics. In National Family Health Survey – India NFHS-1: Main Report, pp. 35–71. http://hetv.org/india/nfhs/india1.html (accessed April 2016).
- 8. Office of the Registrar General and Census Commissioner, Government of India (2011) Census of India. http://censusindia.gov.in/2011-Common/CensusData2011.html (accessed December 2017).
- 9. Dwarkanath P, Barzilay JR, Thomas T et al. (2013) High folate and low vitamin B-12 intakes during pregnancy are associated with small-for-gestational age infants in South Indian women: a prospective observational cohort study. Am J Clin Nutr 98, 1450–1458. [DOI] [PubMed] [Google Scholar]
- 10. Anand SS, Vasudevan A, Gupta MK et al. (2013) Rationale and design of South Asian Birth Cohort (START): a Canada–India collaborative study. BMC Public Health 13, 79. [DOI] [PMC free article] [PubMed] [Google Scholar]
- 11. Ministry of Health and Family Welfare, Government of India (1998–1999) Background characteristics of households. In National Family Health Survey – India NFHS-2: Main Report, pp. 15–47. http://hetv.org/india/nfhs/india2.html (accessed April 2016).
- 12. Rasmussen KM & Yaktine AL (editors) (2009) Weight Gain During Pregnancy: Reexamining the Guidelines. Washington, DC: National Academy Press. [PubMed] [Google Scholar]
- 13. Durnin JVGA & Womersley J (1974) Estimates of total body fat from skinfold thickness: measurements on 481 men and women aged from 16 to 72 years. Br J Nutr 32, 77–79. [DOI] [PubMed] [Google Scholar]
- 14. Dwarkanath P, Soares MJ, Thomas T et al. (2014) Semi quantitative food frequency questionnaire is a valid tool in the nutritional assessment of South Indian pregnant women. Asia Pac J Public Health 26, 494–506. [DOI] [PubMed] [Google Scholar]
- 15. Indian Council of Medical Research (2010) Nutrient Requirements and Recommended Dietary Allowances for Indians. Hyderabad: National Institute of Nutrition Offset Press. [Google Scholar]
- 16. Dwarkanath P, Muthayya S, Vaz M et al. (2007) The relationship between maternal physical activity during pregnancy and birth weight. Asia Pac J Clin Nutr 16, 704–710. [PubMed] [Google Scholar]
- 17. Bharathi AV, Sandhya N & Vaz M (2000) The development and characteristics of a physical activity questionnaire for epidemiological studies in urban middle class Indians. Indian J Med Res 111, 95–102. [PubMed] [Google Scholar]
- 18. World Health Organization (2008) Worldwide Prevalence of Anaemia 1993–2005: WHO Global Database on Anaemia. Geneva: WHO; available at http://www.who.int/vmnis [Google Scholar]
- 19. Hill JL, You W & Zoellner JM (2014) Disparities in obesity among rural and urban residents in a health disparate region. BMC Public Health 14, 1051. [DOI] [PMC free article] [PubMed] [Google Scholar]
- 20. Ghosh S (2014) Exploring vulnerability of undernutrition among wives: do husbands’ attributes matter? J Health Manage 16, 423–439. [Google Scholar]
- 21. Garn SM & Sullivan TV (1989) The education of one spouse and the fatness of the other spouse. Am J Hum Biol 1, 233–238. [DOI] [PubMed] [Google Scholar]
- 22. Harris HE, Ellison GTH & Holiday M (1997) Is there an independent association between parity and maternal weight gain? Ann Hum Biol 24, 507–519. [DOI] [PubMed] [Google Scholar]
- 23. Kim SA, Yount KM, Ramakrishnan U et al. (2007) The relationship between parity and overweight varies with household wealth and national development. Int J Epidemiol 36, 93–101. [DOI] [PubMed] [Google Scholar]
- 24. Diemert A, Lezius S, Pagenkemper M et al. (2016) Maternal nutrition, inadequate gestational weight gain and birth weight: results from a prospective birth cohort. BMC Pregnancy Childbirth 16, 224. [DOI] [PMC free article] [PubMed] [Google Scholar]
- 25. Pandey S, Thakkar HK, Rawat CMS et al. (2012) Sociodemographic factors influencing family size among rural population of Nainital, Uttarakhand. Indian J Community Health 24, 291–296. [Google Scholar]
- 26. Caldwell JC, Reddy PH & Caldwell P (1984) The determinants of family structure in rural South India. J Marriage Fam 46, 215–229. [Google Scholar]
- 27. Desai S & Jain D (1994) Maternal employment and changes in family dynamics: the social context of women’s work in rural South India. Popul Dev Rev 20, 115–136. [Google Scholar]
- 28. Hillemeier MM, Weisman CS, Chase GA et al. (2007) Individual and community predictors of preterm birth and low birthweight along the rural–urban continuum in central Pennsylvania. J Rural Health 23, 42–48. [DOI] [PubMed] [Google Scholar]
- 29. Mobasheri E & Golalipour MJ (2007) The effect of pre-pregnancy body mass index on gestational weight gain and pregnancy outcome in Gorgan, North Iran. J Med Sci 7, 905–908. [Google Scholar]
- 30. Merchant SS, Momin IA, Sewani AA et al. (1999) Effect of prepregnancy body mass index and gestational weight gain on birth weight. J Pak Med Assoc 49, 23–25. [PubMed] [Google Scholar]
- 31. Subramanian SV, Mejía-Guevara I & Krishna A (2016) Rethinking policy perspectives on childhood stunting: time to formulate a structural and multifactorial strategy. Matern Child Nutr 12, 219–236. [DOI] [PMC free article] [PubMed] [Google Scholar]
- 32. Casanovas MC, Lutter CK, Mangasaryan N et al. (2013) Multi-sectoral interventions for healthy growth. Matern Child Nutr 9, 46–57. [DOI] [PMC free article] [PubMed] [Google Scholar]
- 33. Shankardass K, O’Campo P, Dodds L et al. (2014) Magnitude of income-related disparities in adverse perinatal outcomes. BMC Pregnancy Childbirth 14, 96. [DOI] [PMC free article] [PubMed] [Google Scholar]
- 34. International Institute for Population Sciences & Macro International (2007) National Family Health Survey (NFHS-3), 2005–06: India: Volume I. Mumbai: IIPS. [Google Scholar]
Associated Data
This section collects any data citations, data availability statements, or supplementary materials included in this article.
Supplementary Materials
For supplementary material accompanying this paper visit https://doi.org/10.1017/S1368980017004025.
click here to view supplementary material