

Abstract
Objective
There are some indications of regional differences in the association between fish consumption and clinical outcomes. We aimed to test the linear and potential non-linear dose–response relationships between fish consumption and risk of all-cause and cardiovascular (CVD) mortality, and possible confounding by region.
Design
Systematic review and dose–response meta-analysis.
Setting
Systematic search using PubMed and Scopus, from inception up to September 2016.
Subjects
Prospective observational studies reporting the estimates of all-cause and CVD mortality in relation to three or more categories of fish intake were included. Random-effects dose–response meta-analysis was conducted.
Results
Fourteen prospective cohort studies (ten publications) with 911 348 participants and 75 451 incident deaths were included. A 20 g/d increment in fish consumption was significantly and inversely associated with the risk of CVD mortality (relative risk=0·96; 95 % CI 0·94, 0·98; I 2=0 %, n 8) and marginally and inversely associated with the risk of all-cause mortality (relative risk=0·98; 95 % CI 0·97, 1·00; I 2=81·9 %, n 14). Subgroup analysis resulted in a significant association only in the subgroup of Asian studies, compared with Western studies, in both analyses. Analysis of Western studies suggested a nearly U-shaped association, with a nadir at fish consumption of ~20 g/d in analysis of both outcomes. Meanwhile, the associations appeared to be linear in Asian studies.
Conclusions
There was potential evidence of regional differences in the association between fish consumption and mortality. It may be helpful to examine the associations by considering types of fish consumed and methods of fish preparation.
Keywords: Fishes, All-cause mortality, CVD, CHD, Meta-analysis
Prevalence of non-communicable diseases has been spreading alarmingly around the world, in both sexes and among all age subgroups( 1 ). It has been estimated that, as the leading cause of death, non-communicable diseases resulted in 38 million (68 %) of the world’s deaths in 2012, of which more than 40 % were premature deaths under the age of 70 years( 2 ). The economic burden of chronic diseases also has become a major national problem( 3 , 4 ), especially in developing countries( 5 ).
Fish consumption is of interest in the prevention of chronic diseases. Given its favourable effects on non-communicable disease risk factors including blood pressure, lipid profile and inflammation( 6 ), several meta-analyses have shown an inverse association between fish consumption and risk of all-cause mortality( 7 ), CHD mortality( 8 ) and type 2 diabetes( 9 ). It has been proposed that most of these beneficial effects come from the high content of very-long-chain fatty acids, EPA and DHA, that are mainly found in fatty fishes( 6 ). Many epidemiological studies have addressed this association and indicated that higher fish consumption is associated with lower rates of CVD, CHD and cerebrovascular mortality and their subtypes, including stroke mortality, fatal myocardial infarction and sudden cardiac death( 10 – 12 ), but the results are inconsistent( 12 – 15 ).
Some evidence has shown some indications of potential regional differences in the association between fish consumption and risk of mortality. Asian studies generally reported an inverse association( 16 , 17 ), while some Western studies reported no association, or even a higher risk associated with high fish consumption( 15 , 18 , 19 ). Although previous reviews have tested the dose–response relationship between fish consumption and risk of all-cause and CHD mortality( 7 , 8 ), potential differences in dose–response association between Western and Asian studies have not been previously determined. It has been proposed that some potential factors including fish preparation method, types of fish consumed and level of local contaminants may make a distinction in the association between fish consumption and health outcomes in different regions.
The aim of the present study was to further elucidate the shape of the dose–response relationships between fish consumption and risk of all-cause and CVD mortality, in Asian and Western studies separately. It seems that clarifying the shape of the dose–response relationship between fish consumption and risk of mortality, by considering regional differences, may open a window on the relatively sparse understanding regarding the proposed regional differences in the fish–mortality association and may confer new summarized evidence in response to proposed concerns attributed to high fish consumption.
Methods
The Preferred Reporting Items for Systematic Reviews and Meta-Analyses (PRISMA) checklist was used to perform the current meta-analysis and report the results( 20 ).
Search strategy
A systematic literature search was done in PubMed and Scopus databases, from their inception up to August 2016, and then an updated search up to September 2016. The following combination of keywords was used to identify the potential relevant articles: (‘fish’ OR ‘fishes’ OR ‘seafood’ OR ‘fish protein’ OR ‘fish products’ OR ‘marine’ OR ‘animal protein’) AND (‘death’ OR ‘survival’ OR ‘mortality’ OR ‘fatal’ OR ‘event’ OR ‘events’ OR ‘prognosis’ OR ‘prognostic’ OR ‘outcome’ OR ‘Stroke’ OR ‘Cerebrovascular disease’ OR ‘intracranial hemorrhage’ OR ‘Cerebral infarction’ OR ‘CVD’ OR ‘Cardiovascular disease’ OR ‘Cardiovascular’ OR ‘Myocardial infarction’ OR ‘Ischemic heart disease’ OR ‘Coronary heart disease’ OR ‘Cancer’ OR ‘Carcinoma’ OR ‘Neoplasm’ OR ‘CHD’ OR ‘IHD’) AND (‘prospective’ OR ‘prospectively’ OR ‘Cohort’ OR ‘Cohorts’ OR ‘Longitudinal’ OR ‘observational’ OR ‘Observation’ OR ‘Follow-up’). Reference lists of retrieved articles and relevant reviews also were manually searched. The search was restricted to the articles published in English.
Eligibility and study selection
Two independent authors (A.J., S.E.) reviewed titles and abstracts of all studies and selected the prospective observational studies which: (i) reported fish intake in at least three quantitative categories; (ii) reported the outcome of interest including all-cause mortality and total CVD mortality; (iii) reported the number of cases and participants/person-years in each category of fish consumption, or reported sufficient information to estimate those numbers; (iv) were conducted in general populations aged more than 18 years; and (iv) reported risk estimates (relative risk (RR) or hazard ratio (HR)) and their corresponding 95 % CI of relevant mortality rate for each category of fish consumption.
Data extraction
Two independent investigators (A.J., S.E.) extracted the following information from eligible studies: first author’s name; publication year; study name; country; age range and/or mean age (years); number of participants; number of all-cause and/or CVD deaths; method of dietary assessment; exposure levels; reported risk estimates of all-cause and CVD mortality; and covariates adjusted for in multivariate analysis. The greatest degree of adjustment from each study was extracted and used for meta-analysis. Quality of included studies was assessed using the Newcastle–Ottawa scale( 21 ). We contacted the authors of nine studies to obtain the number of cases/participants in each category of fish consumption, to which the authors of only one study (Aus-Diab) reported the requested information. Any discrepancy was resolved through discussion.
Statistical analysis
All included studies were prospective observational studies and reported RR or HR across different categories of fish intake. The RR and 95 % CI were considered as the effect size of all studies. Linear dose–response relationship was estimated by using generalized least-squares trend estimation, according to the methods developed by Greenland and Longnecker( 22 , 23 ). We used the two-stage generalized least-squares trend estimation method, which first estimated study-specific slope lines and then combined with studies in which the slopes were directly reported to obtain an overall average slope( 23 ). Study-specific results were combined using a random-effect model. The median point in each category of fish consumption was assigned. If medians were not reported, we estimated approximate medians by using the midpoint of the lower and upper bounds. If the highest category of the studies was open-ended, we assumed that it had the same amplitude as the preceding category. If the lower boundary of the lowest category was not reported, we considered it as zero. For studies that reported fish consumption as times or meals per week or month, we considered each time or meal as one serving if the amount of each meal or time was not reported in the paper’s text( 8 ). In studies in which the reference category was not the lowest one, we recalculated reported risk estimates assuming the lowest category as the reference if the numbers of cases and non-cases in each category were reported( 24 ). Potential non-linear association was examined by modelling consumption level using restricted cubic splines with three knots at fixed percentiles (10, 50 and 90 %) of the distribution( 25 ). A P value for non-linearity of the meta-analysis was calculated by testing the null hypothesis that the coefficient of the second spline was equal to zero. At first, we tested the potential non-linear dose–response relationship using data from all included studies. In the next step, to better clarify the potential differences between Asian and Western studies, we separately tested the potential non-linear associations in Asian studies (Japan and China) and Western studies (USA and Europe).
Between-study heterogeneity was explored using Cochrane’s Q test of heterogeneity and the I 2 statistic (P < 0·05)( 26 ). If heterogeneity existed, subgroup analyses were done based on some of the study and participant characteristics to explore the potential sources of the inconsistencies between studies. To test the potential effect of each study on the pooled effect size, sensitivity analyses were done by removing each study at a time. Potential publication bias was tested using Egger’s asymmetry test( 27 ), Begg’s test( 28 ) and the funnel plot (P < 0·10). All analyses were conducted with the statistical software package Stata version 13. P < 0·05 was considered statistically significant.
Results
Literature search and study characteristics
Figure 1 shows the literature search and study selection process. Systematic searching identified 6470 references; of these, 616 were duplicates and 5683 were non-relevant as determined at initial screening of the title and abstract, and thus were excluded. By full-text review, another 161 studies were excluded. Detailed reasons for exclusions are shown in Fig. 1. The remaining publications were eligible for inclusion in meta-analysis (Table 1). Three publications reported results for men and women separately( 29 – 31 ), and given use of different cut-off points for categorization of fish consumption in men and women, were included in meta-analysis separately. One publication reported results for men (Shanghai Men’s Health Study) and women (Shanghai Women’s Health Study), both separately and combined( 32 ), and because of the low number of studies in non-linear dose–response meta-analysis of CVD mortality, we selected and used the separate model. Finally, fourteen studies (ten publications) with 911 348 participants and 75 451 cumulative incident deaths were included in meta-analysis. Five studies (three publications) were from Asia( 31 – 33 ), one study was from Australia( 34 ), four studies were from the USA( 10 , 11 , 35 , 36 ) and four studies (two publications) were from Europe( 29 , 30 ). General characteristics of included studies are shown in Table 1 and reported risk estimates of all-cause and CVD mortality in relation to different quantitative categories of fish intake in each study are provided in the online supplementary material, Supplemental Table 1.
Fig. 1.
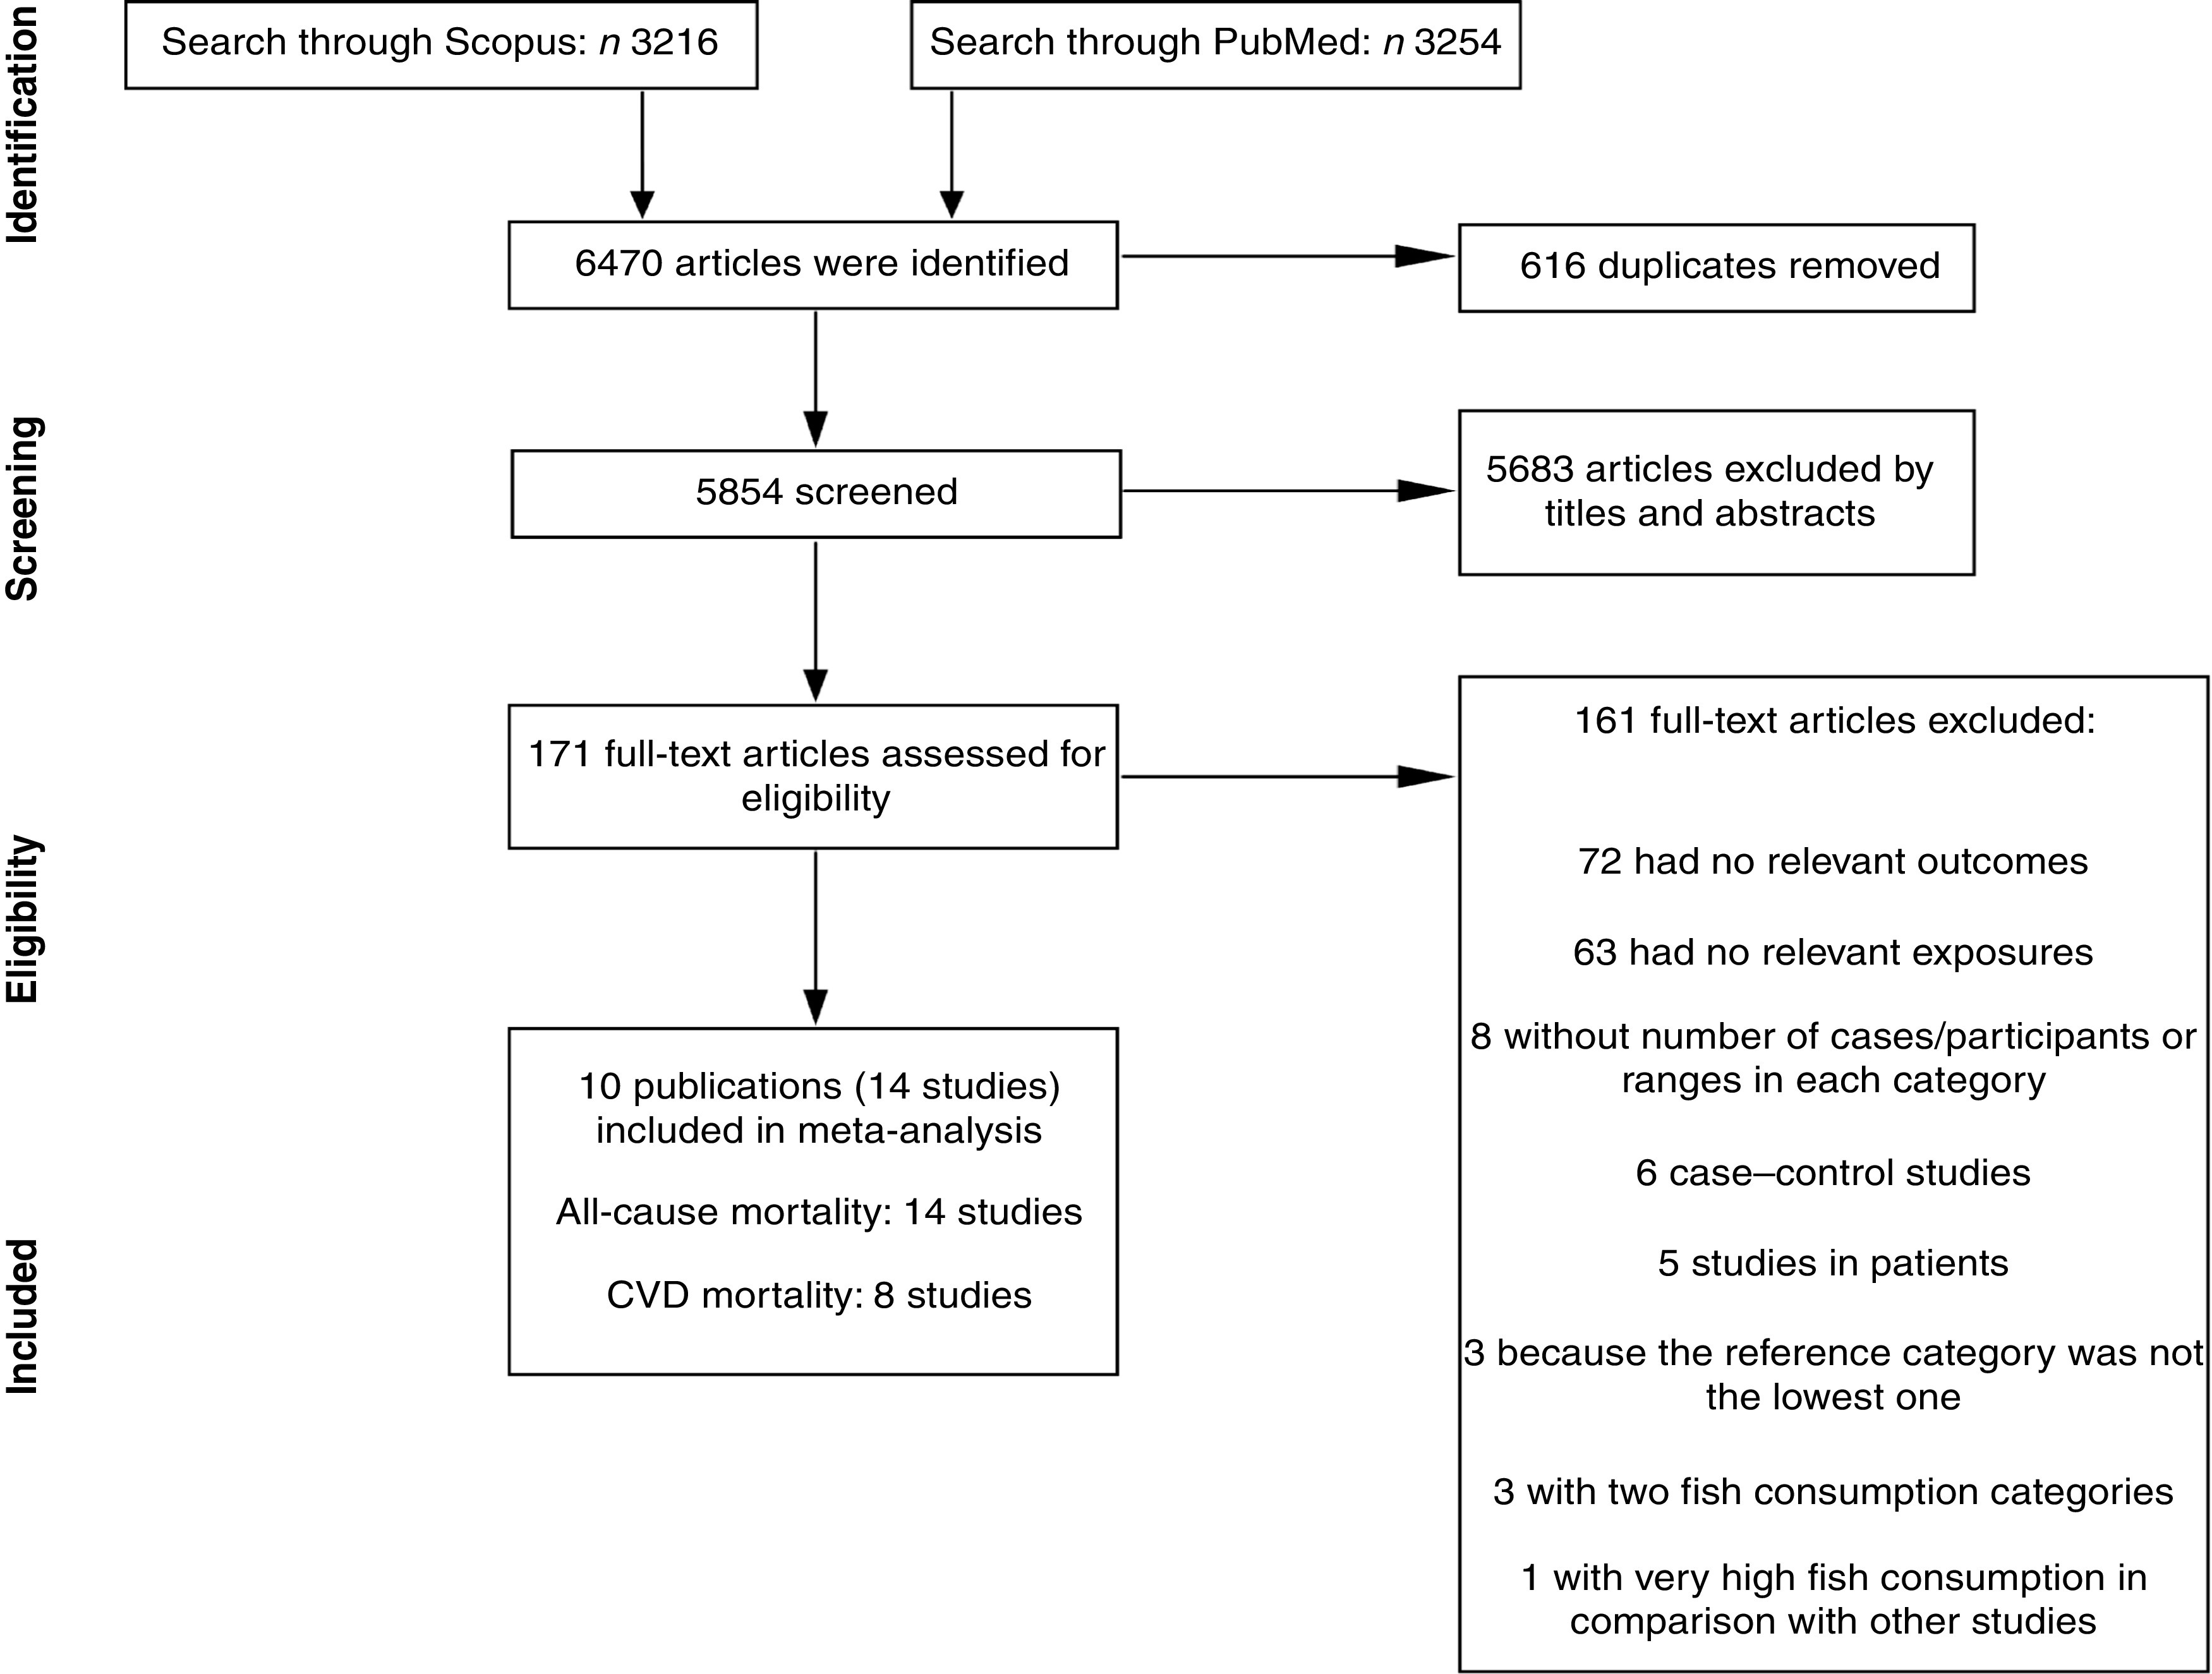
Literature search and study selection process for inclusion in the present meta-analysis on fish consumption and risk of all-cause and cardiovascular mortality
Table 1.
General characteristics of studies included in the present meta-analysis on fish consumption and risk of all-cause and cardiovascular mortality
| Author(s) & reference, publication year, study name, country | Age (range/mean; years) | Follow-up duration (years) | No. of participants | No. of deaths | Exposure assessment | Covariates | Quality score (max. 9 points) |
|---|---|---|---|---|---|---|---|
| Daviglus et al.( 10 ), 1997, The Chicago Western Electric Study, USA | 40–55/47 | 30 | 1822 men | All-cause deaths: 1042 CVD deaths: 573 | FFQ | Age, education, religion, SBP, serum cholesterol, smoking status, BMI, history of DM, history of electrocardiographic abnormalities, and intakes of energy, cholesterol, SFA, MUFA, PUFA, protein, carbohydrate, alcohol, Fe, thiamin, riboflavin, niacin, vitamin C, β-carotene and retinol | 8 |
| Albert et al.( 11 ), 1998, US Physicians’ Health Study, USA | 40–84/53 | 11 | 20 551 US male physicians | All-cause deaths: 1652 CVD deaths: 548 | FFQ | Age, aspirin use, β-carotene use, evidence of CVD, BMI, smoking status, history of DM or HTN, history of hypercholesterolaemia, alcohol consumption, physical activity, and vitamin E, vitamin C or multivitamin use | 9 |
| Bellavia et al.( 29 ), 2017, Swedish Mammography Cohort and the Cohort of Swedish Men, Sweden | 45–84 | 17 | 71 384 men and women | All-cause deaths: 16 295 CVD deaths: 4899 | FFQ | BMI, total physical activity, smoking status and pack-years of smoking, alcohol consumption, educational level, total energy intake, fruit consumption, vegetable consumption, processed red meat consumption and non-processed red meat consumption | 8 |
| Engeset et al.( 30 ), 2015, European Prospective Investigation into Cancer and Nutrition cohort | 30–70 | 1992/1998–2010 | 480 535 European men and women | All-cause deaths: 32 587 | Country-specific FFQ, or dietary history | Age, energy from fat, energy from carbohydrates, energy from proteins, intakes of dietary fibre, red meat, processed meat, vegetables, fruit and alcohol, BMI, physical activity, smoking, education | 6 |
| Nagata et al. ( 31 ), 2002, The Takayama Study, Japan | ≥35/55 | 6·9 | 29 079 Japanese men and women | All-cause deaths: 2062 | FFQ | For men: age, total energy, marital status, BMI, smoking status, alcohol intake, coffee intake, exercise, and history of HTN and DM. For women: age, total energy, marital status, years of education, BMI, smoking status, alcohol intake, age at menarche, menopausal status, exercise and history of DM | 8 |
| Takata et al. ( 32 ), 2013, Shanghai Women’s Health Study (SWHS), China/Shanghai Men’s Health Study (SMHS), China | 40–70/52·7 | 11·2 (women) 5·6 (men) | 134 296 Chinese men and women | All-cause deaths: 5836 CVD deaths: 1789 | FFQ | Age, total energy intake, income, occupation, education, comorbidity index, physical activity level, red meat intake, poultry intake, total vegetable intake, total fruit intake, smoking history, alcohol consumption (only among men) | 8 |
| Yamagishi et al.( 33 ), 2008, The Japan Collaborative Cohort (JACC) Study, Japan | 40–79/56 | 12·7 | 57 972 Japanese men and women | All-cause deaths: 7008 CVD deaths: 2045 | FFQ | Age, sex, history of HTN and DM, smoking status, alcohol consumption, BMI, mental stress, walking, sports, education levels, total energy, and dietary intakes of cholesterol, SFA, n-6 PUFA, vegetables and fruit | 7 |
| Owen et al.( 34 ), 2016, The Australian Diabetes, Obesity and Lifestyle Study (Aus-Diab), Australia | 51·5 | 12·6 | 11 247 non-institutionalized men and women aged ≥25 years | All-cause deaths: 1265 CVD deaths: 2045 | FFQ | Age, previous CVD, education, exercise, DM, total dietary energy and smoking | 7 |
| Bell et al.( 35 ), 2014, The Vitamins and Lifestyle (VITAL) Study, USA | 50–76 | 5 | 70 495 US men and women | All-cause deaths: 3051 | FFQ | Age, sex, race/ethnicity, marital status, education, total energy intake, BMI at age 45 years, alcohol intake, physical activity, self-rated health, mammogram, prostate-specific antigen test, sigmoidoscopy, medications, smoking, morbidity score, percentage of energy derived from trans-fat and SFA, fruit and vegetable consumption, years of oestrogen therapy, years of oestrogen–progestin therapy, age at menopause, age at death of father and mother | 7 |
| Folsom and Demissie( 36 ), 2004, Iowa Women’s Health Study cohort, USA | 55–69 | 14 | 33 967 women | All-cause deaths: 4653 CVD deaths: 1589 | FFQ | Age, energy intake, educational level, physical activity level, alcohol consumption, smoking status, pack-years of cigarette smoking, age at first live birth, oestrogen use, vitamin use, BMI, waist-to-hip ratio, diabetes, HTN, and intakes of whole grains, fruit and vegetables, red meat, cholesterol and SFA | 7 |
SBP, systolic blood pressure; DM, diabetes mellitus; HTN, hypertension.
Fish consumption and all-cause mortality
Fourteen studies (ten publications), with 911 348 participants and 75 451 cases of overall mortality, were included in the analysis of fish consumption and all-cause mortality( 10 , 11 , 29 – 36 ). The pooled RR of all-cause mortality for a 20 g/d increment in fish consumption was 0·98 (95 % CI 0·97, 1·00; Supplemental Fig. 1), with high heterogeneity (I 2=81·9 %, P heterogeneity < 0·0001). To test whether the pooled RR had been greatly influenced by a specific study, sensitivity analyses were done by removing each study in turn, but none of excluded studies resulted in a significant association. The associations were not statistically significant in either women or men. Results for subgroup analyses are provided in Table 2. A non-significant association persisted in most of the subgroups except for subgroups based on region, duration and study quality. The association was significant only among Asian studies (RR=0·97; 95 % CI 0·96, 0·98; I 2=0 %, P heterogeneity=0·49, n 5) compared with Western studies (RR=0·99; 95 % CI 0·97, 1·01; I 2=80·3 %, P heterogeneity < 0·0001, n 8), and also was significant only in the subgroup of studies with follow-up duration <13 years (RR=0·97; 95 % CI 0·96, 0·99; I 2=57·5 %, P heterogeneity=0·02, n 8) compared with >13 years of follow-up (RR=1·00; 95 % CI 0·98, 1·01; I 2=76·7 %, P heterogeneity=0·001, n 6). Subgroup analyses yielded region, number of cases, study quality and adjustment for intake of fruits and vegetables as the potential sources of the heterogeneity. Egger’s asymmetry test (P=0·008), but not Begg’s test (P=0·70), showed indication for publication bias. Some evidence of asymmetry was found in the funnel plot (Supplemental Fig. 2).
Table 2.
Relative risk (RR) of all-cause mortality for a 20 g/d increment in fish consumption: subgroup analyses
| Pooled RR | Heterogeneity | ||||
|---|---|---|---|---|---|
| Comparison | n | RR | 95 % CI | I 2 (%) | P value |
| All studies | 14 | 0·98 | 0·97, 1·00 | 81·9 | <0·0001 |
| Sex | |||||
| Men | 5 | 0·99 | 0·96, 1·02 | 80·3 | <0·0001 |
| Women | 5 | 0·98 | 0·95, 1·00 | 85·7 | <0·0001 |
| Both | 4 | 0·96 | 0·88, 1·03 | 77·6 | 0·004 |
| Region | |||||
| USA+Europe | 8 | 0·99 | 0·97, 1·01 | 80·3 | <0·0001 |
| Asia (Japan+China) | 5 | 0·97 | 0·96, 0·98 | 0·0 | 0·49 |
| Australia | 1 | 1·06 | 0·99, 1·13 | – | |
| Follow-up duration | |||||
| <13 years | 8 | 0·97 | 0·96, 0·99 | 57·5 | 0·02 |
| >13 years | 6 | 1·00 | 0·98, 1·01 | 76·7 | 0·001 |
| Number of cases | |||||
| <3000 | 6 | 0·98 | 0·96, 1·00 | 37·7 | 0·15 |
| >3000 | 8 | 0·98 | 0·96, 1·00 | 87·3 | <0·0001 |
| Quality scores | |||||
| High (≥7 points) | 12 | 0·97 | 0·96, 0·99 | 44·7 | 0·05 |
| Median (4–6 points) | 2 | 1·01 | 1·01, 1·02 | 47·9 | 0·16 |
| Excluded history of CVD | |||||
| Yes | 12 | 0·98 | 0·97, 1·00 | 81·7 | <0·0001 |
| No | 2 | 0·93 | 0·65, 1·20 | 91·4 | 0·001 |
| Energy adjusted | |||||
| Yes | 13 | 0·98 | 0·97, 1·00 | 86·2 | <0·0001 |
| No | 1 | 0·96 | 0·91, 1·00 | – | |
| BMI adjusted | |||||
| Yes | 13 | 0·98 | 0·96, 1·00 | 82·6 | <0·0001 |
| No | 1 | 1·06 | 0·99, 1·03 | – | |
| Alcohol adjusted | |||||
| Yes | 13 | 0·98 | 0·96, 1·00 | 82·6 | <0·0001 |
| No | 1 | 1·06 | 0·99, 1·03 | – | |
| Physical activity adjusted | |||||
| Yes | 10 | 0·99 | 0·97, 1·00 | 79·6 | <0·0001 |
| No | 4 | 0·98 | 0·94, 1·01 | 62·0 | 0·04 |
| Fruits and vegetables adjusted | |||||
| Yes | 9 | 0·98 | 0·96, 1·00 | 86·9 | <0·0001 |
| No | 5 | 0·98 | 0·95, 1·01 | 46·4 | 0·11 |
Non-linear dose–response meta-analysis suggested a U-shaped association between fish consumption and risk of all-cause mortality for fish consumption between 0 and 60 g/d, followed by a relatively sharp decrease in the risk with increasing fish intake of more than ~60 g/d (P non-linearity < 0·0001; Fig. 2(a)). When non-linear dose–response relationships were tested separately, the association appeared to be linear in Asian studies( 31 – 33 ) (P non-linearity=0·97, n 5; Fig. 2(b)), whereas a nearly U-shaped association was observed in the analysis of Western studies( 10 , 11 , 29 , 30 , 35 , 36 ), with a nadir at intake of ~20 g/d (P non-linearity < 0·0001, n 8; Fig. 2(c)).
Fig. 2.

Dose–response association between fish consumption and risk of all-cause mortality: (a) from all studies (n 14, P non-linearity < 0·0001); (b) from Asian studies (n 5, P non-linearity=0·97); (c) from Western studies (n 8, P non-linearity < 0·0001). Associations are presented as relative risk (RR; ———) and 95 % CI (— — —)
Fish consumption and total cardiovascular mortality
Eight studies (seven publications), with 331 239 participants and 11 720 cases of CVD mortality, were included in analysis of fish consumption and total cardiovascular mortality( 10 , 11 , 29 , 32 – 34 , 36 ). A 20 g/d increment in fish consumption was significantly and inversely associated with the risk of CVD mortality (pooled RR=0·96; 95 % CI 0·94, 0·98; Supplemental Fig. 3), with no evidence of heterogeneity (I 2=0·0 %, P heterogeneity=0·62). In sensitivity analysis, none of the excluded studies changed the pooled RR materially. Subgroup analysis resulted in a non-significant association in Western studies (RR=0·97; 95 % CI 0·94, 1·00; n 4) compared with Asians (RR=0·96; 95 % CI 0·93, 0·99; n 3). Additional results for subgroup analyses are provided in Supplemental Table 2. Publication bias tests were not conducted (n < 10).
Non-linear dose–response meta-analysis indicated that the risk of CVD mortality decreased in parallel with the increase in fish consumption from zero up to ~100 g/d (P non-linearity=0·65; Fig. 3(a)). In analysis of three Asian studies( 32 , 33 ), the risk decreased along with the increase in fish consumption up to ~60 g/d, with no further substantial change in the risk (P non-linearity=0·71, n 3; Fig. 3(b)). Meanwhile, when analysis was restricted to four Western studies( 10 , 11 , 29 , 36 ), a nearly U-shaped association was observed, with a nadir at intake of ~20 g/d (P non-linearity=0·05, n 4; Fig. 3(c)).
Fig. 3.

Dose–response association between fish consumption and risk of total cardiovascular mortality: (a) from all studies (n 8, P non-linearity=0·65); (b) from Asian studies (n 3, P non-linearity=0·71); (c) from Western studies (n 4, P non-linearity=0·05). Associations are presented as relative risk (RR; ———) and 95 % CI (— — —)
Discussion
Principal findings
The present meta-analysis confers new summarized evidence regarding the association between fish consumption and risk of all-cause and CVD mortality, revealing that there are potential indications of regional differences in the fish–mortality association. We found that a 20 g/d increment in fish consumption was significantly and inversely associated with the risk of total CVD mortality (by 4 %) and marginally and inversely associated with the risk of all-cause mortality (by 3 %). Non-linear dose–response meta-analysis indicated that the shape of the dose–response relationship was U-shaped and linear in Western and Asian studies, respectively.
Findings in relation to previous studies
A recent meta-analysis of twelve prospective cohort studies (seven studies in dose–response meta-analysis) reported a significant inverse association between fish consumption and risk of all-cause mortality, with a nadir at consumption of ~60–80 g/d, and with no further change in the risk( 7 ). Subgroup analysis indicated a non-significant positive relationship in the subgroup of European studies. In comparison to the previous study, we included six additional Western studies, with about 51 000 additional cases of all-cause mortality, making it possible to get relatively stronger statistical inference. We also found a 4 % significant decrement in the risk of CVD mortality per 20 g/d increment in fish consumption. To our knowledge, no other systematic review and meta-analysis has assessed the association between fish consumption and risk of total cardiovascular mortality.
More interestingly, we could test the non-linear dose–response association in Asian and Western studies, separately. Previous results showed that the shape of the association may vary according to geographical region. Significant inverse associations were mainly reported from Asian countries( 16 , 32 , 33 ), whereas some Western studies showed a modest U-shaped association( 18 , 29 , 30 ) in which both low and high fish intake were associated with greater risk. In our analysis of Western studies, we found that the risk of all-cause and CVD mortality decreased in a dose-dependent manner from baseline of zero up to ~20 g/d, and then increased with a relatively sharp trend. Meanwhile, our analysis of Asian studies suggested a linear decrement in the risk, especially in analysis of all-cause mortality.
Some potential explanations may justify this increment in the risk in Western countries. Previous studies have indicated that the level of methylmercury in the body increases with increasing fish intake( 37 – 39 ), and its elevated level is associated with higher risk of coronary events( 40 ). However, in the present meta-analysis, the amount of fish consumption was clearly higher in Asian studies, wherein levels of mercury contamination in seafoods are relatively higher than in other geographical regions( 41 – 43 ); thus this hypothesis must be treated with caution.
Different methods of preparing fish and seafood may also make some distinctions in health outcomes of fish consumption in different geographical regions. It has been hypothesized that people in Western countries eat more deep-fried fish than Asians, whereas steaming and stir-frying are generally chosen for preparing fish and seafood in Asian societies( 32 ). Deep-frying may undesirably depress the beneficial effects of fish consumption( 44 ). A prospective evaluation within the Cardiovascular Health Study indicated that higher consumption of non-fried fish was inversely associated with the risk of CHD mortality, while a non-significant trend towards higher risk was observed along with the increase in fried fish consumption( 44 ). Another prospective cohort study in Australia indicated that non-fried fish consumption was marginally and inversely associated with the risk of CVD mortality in women, while total fish consumption was not( 34 ).
Different types of fish also should be taken into consideration. Lean fish have lower amounts of n-3 fatty acids and are more likely to be deep-fried( 44 ). Meanwhile, fatty fish are generally rich in n-3, and results of two large population-based cohort studies in China suggested that higher intake of fatty fish may be more strongly associated with lower risk of all-cause and CVD mortality, compared with other types( 32 ). However, due to their higher content of fats, fatty fish are richer in polychlorinated biphenyls, of which higher intake is associated with higher CVD risk( 45 , 46 ). Unlike the Chinese cohorts( 32 ), results of the two large Swedish cohorts( 29 ) showed that higher intake of fatty fish, not lean fish, was accompanied with higher risk of mortality. When baseline characteristic of participants of these two publications were compared, substantially higher intakes of fruits and vegetables, and lower intakes of red and processed meat and total energy were observed in the Chinese population as compared with the Swedish, especially in upper categories of fish intake; suggesting that other dietary habits such as adherence to a Western-style dietary pattern may have a mediatory effect in the association between fish consumption and risk of mortality. Although in all above-mentioned cohorts results were adjusted for these dietary factors, the confounding effects of these adherent factors to fish intake could not be completely ignored. Additionally, a cross-sectional analysis within the European Prospective Investigation into Cancer and Nutrition (EPIC) indicated that types of fish consumption differed substantially across different countries, even among countries in a same geographical location (Europe), as well as across different sexes( 47 ). Thus, owing to different nutritional content and different cooking methods used for various types of fish, it seems necessary to consider these factors when examining the association of fish consumption and any health outcome.
Mechanisms
It has been shown that higher consumption of n-3 fatty acids may be associated with lower risk of mortality( 48 ), partially due to their favourable effects against inflammation and endothelial dysfunction( 49 – 51 ). In addition, some evidence has indicated that consumption of fish could be more beneficial than consumption of n-3 fatty acids( 52 , 53 ), which may imply the existence of other beneficial nutrients in fish including essential amino acids, fat-soluble nutrients( 54 ), trace elements( 55 ) and other types of fats( 56 ). Furthermore, it has been indicated that fish consumption is positively associated with other healthy lifestyle-related factors such as higher educational level, higher exercise, not smoking and better healthy food score( 57 ).
Strengths and weaknesses
The present study has several strengths. For the first time, we could address potential regional differences in the association between fish consumption and risk of all-cause and CVD mortality using non-linear dose–response meta-analysis. We could show that the shape of the association between fish consumption and risk of mortality may depend strongly on several potential factors such as dietary habits, methods of preparing fish, types of fish consumed and contamination levels, keeping this as an interesting topic for future investigations to elucidate exactly what potential factors cause these differences in effect. Third, we included prospective cohort studies with relatively high quality, making it possible to get an acceptable statistical inference and generalize the results.
Certain limitations in the present study need to be considered when interpreting the results. We were faced with high evidence of heterogeneity in analysis of all-cause mortality. However, subgroup analyses suggested region, number of cases, study quality and adjustment for intake of fruits and vegetables as the potential sources of the observed heterogeneity. Second, we have few Asian studies in the dose–response meta-analysis. However, the Asian studies were large-scale population-based prospective cohort studies with high quality. Third, Egger’s test and the funnel plot showed some indications of asymmetry in analysis of all-cause mortality. Additionally, publication bias tests were not conducted in analysis of CVD mortality (n < 10). Thus, our results may have been affected by publication bias, which in turn might result in overestimating the risk.
Conclusion
The present meta-analysis provided supportive evidence regarding the inverse association between fish consumption and risk of all-cause and total cardiovascular mortality, and could present further evidence regarding proposed regional differences in the fish–mortality association. We found that higher fish intake may be associated with higher risk of all-cause and cardiovascular mortality in Western countries, but not in Asians. Further research is needed with consideration of methods of preparing fish, types of fish consumed and potential local contaminants.
Acknowledgements
Financial support: This research received no specific grant from any funding agency in the public, commercial or not-for-profit sectors. Conflict of interest: None. Authorship: A.J., S.S.-B. and K.D. formulated the research questions and designed the study, A.J. and S.E. conducted the systematic search, screened the articles and extracted the data. K.D. and S.S.-B. analysed the data. A.J., S.S.-B., S.E. and K.D. wrote the article. All authors have read and approved the final manuscript. K.D. had primary responsibility for final content. Ethics of human subject participation: Not applicable.
Supplementary material
For supplementary material accompanying this paper visit https://doi.org/10.1017/S1368980017003834.
click here to view supplementary material
References
- 1. Beaglehole R, Bonita R, Horton R et al. (2011) Priority actions for the non-communicable disease crisis. Lancet 377, 1438–1447. [DOI] [PubMed] [Google Scholar]
- 2. World Health Organization (2014) Global Status Report on Noncommunicable Diseases 2014. Geneva: WHO. [Google Scholar]
- 3. Chaker L, Falla A, van der Lee SJ et al. (2015) The global impact of non-communicable diseases on macro-economic productivity: a systematic review. Eur J Epidemiol 30, 357–395. [DOI] [PMC free article] [PubMed] [Google Scholar]
- 4. Muka T, Imo D, Jaspers L et al. (2015) The global impact of non-communicable diseases on healthcare spending and national income: a systematic review. Eur J Epidemiol 30, 251–277. [DOI] [PubMed] [Google Scholar]
- 5. Lee JT, Hamid F, Pati S et al. (2015) Impact of noncommunicable disease multimorbidity on healthcare utilisation and out-of-pocket expenditures in middle-income countries: cross sectional analysis. PLoS One 10, e0127199. [DOI] [PMC free article] [PubMed] [Google Scholar]
- 6. He K (2009) Fish, long-chain omega-3 polyunsaturated fatty acids and prevention of cardiovascular disease – eat fish or take fish oil supplement? Prog Cardiovasc Dis 52, 95–114. [DOI] [PubMed] [Google Scholar]
- 7. Zhao LG, Sun JW, Yang Y et al. (2016) Fish consumption and all-cause mortality: a meta-analysis of cohort studies. Eur J Clin Nutr 70, 155–161. [DOI] [PubMed] [Google Scholar]
- 8. Zheng J, Huang T, Yu Y et al. (2012) Fish consumption and CHD mortality: an updated meta-analysis of seventeen cohort studies. Public Health Nutr 15, 725–737. [DOI] [PubMed] [Google Scholar]
- 9. Wallin A, Di Giuseppe D, Orsini N et al. (2012) Fish consumption, dietary long-chain n-3 fatty acids, and risk of type 2 diabetes: systematic review and meta-analysis of prospective studies. Diabetes Care 35, 918–929. [DOI] [PMC free article] [PubMed] [Google Scholar]
- 10. Daviglus ML, Stamler J, Orencia AJ et al. (1997) Fish consumption and the 30-year risk of fatal myocardial infarction. N Engl J Med 336, 1046–1053. [DOI] [PubMed] [Google Scholar]
- 11. Albert CM, Hennekens CH, O’Donnell CJ et al. (1998) Fish consumption and risk of sudden cardiac death. JAMA 279, 23–28. [DOI] [PubMed] [Google Scholar]
- 12. Yuan JM, Ross RK, Gao YT et al. (2001) Fish and shellfish consumption in relation to death from myocardial infarction among men in Shanghai, China. Am J Epidemiol 154, 809–816. [DOI] [PubMed] [Google Scholar]
- 13. Kuhn T, Teucher B, Kaaks R et al. (2013) Fish consumption and the risk of myocardial infarction and stroke in the German arm of the European Prospective Investigation into Cancer and Nutrition (EPIC-Germany). Br J Nutr 110, 1118–1125. [DOI] [PubMed] [Google Scholar]
- 14. Mann JI, Appleby PN, Key TJ et al. (1997) Dietary determinants of ischaemic heart disease in health conscious individuals. Heart 78, 450–455. [DOI] [PMC free article] [PubMed] [Google Scholar]
- 15. Osler M, Andreasen AH & Hoidrup S (2003) No inverse association between fish consumption and risk of death from all-causes, and incidence of coronary heart disease in middle-aged, Danish adults. J Clin Epidemiol 56, 274–279. [DOI] [PubMed] [Google Scholar]
- 16. Lee JE, McLerran DF, Rolland B et al. (2013) Meat intake and cause-specific mortality: a pooled analysis of Asian prospective cohort studies. Am J Clin Nutr 98, 1032–1041. [DOI] [PMC free article] [PubMed] [Google Scholar]
- 17. Wang MP, Thomas GN, Ho SY et al. (2011) Fish consumption and mortality in Hong Kong Chinese – the LIMOR study. Ann Epidemiol 21, 164–169. [DOI] [PubMed] [Google Scholar]
- 18. Gillum RF, Mussolino M & Madans JH (2000) The relation between fish consumption, death from all causes, and incidence of coronary heart disease. The NHANES I Epidemiologic Follow-up Study. J Clin Epidemiol 53, 237–244. [DOI] [PubMed] [Google Scholar]
- 19. Olsen A, Egeberg R, Halkjaer J et al. (2011) Healthy aspects of the Nordic diet are related to lower total mortality. J Nutr 141, 639–644. [DOI] [PubMed] [Google Scholar]
- 20. Moher D, Liberati A, Tetzlaff J et al. (2009) Preferred reporting items for systematic reviews and meta-analyses: the PRISMA statement. PLoS Med 6, e1000097. [DOI] [PMC free article] [PubMed] [Google Scholar]
- 21. Stang A (2010) Critical evaluation of the Newcastle–Ottawa scale for the assessment of the quality of nonrandomized studies in meta-analyses. Eur J Epidemiol 25, 603–605. [DOI] [PubMed] [Google Scholar]
- 22. Berlin JA, Longnecker MP & Greenland S (1993) Meta-analysis of epidemiologic dose–response data. Epidemiology 4, 218–228. [DOI] [PubMed] [Google Scholar]
- 23. Orsini N, Bellocco R & Greenland S (2006) Generalized least squares for trend estimation of summarized dose–response data. Stata J 6, 40–57. [Google Scholar]
- 24. Hamling J, Lee P, Weitkunat R et al. (2008) Facilitating meta‐analyses by deriving relative effect and precision estimates for alternative comparisons from a set of estimates presented by exposure level or disease category. Stat Med 27, 954–970. [DOI] [PubMed] [Google Scholar]
- 25. Orsini N, Li R, Wolk A et al. (2012) Meta-analysis for linear and nonlinear dose–response relations: examples, an evaluation of approximations, and software. Am J Epidemiol 175, 66–73. [DOI] [PMC free article] [PubMed] [Google Scholar]
- 26. Higgins JP, Thompson SG, Deeks JJ et al. (2003) Measuring inconsistency in meta-analyses. BMJ 327, 557–560. [DOI] [PMC free article] [PubMed] [Google Scholar]
- 27. Egger M, Smith GD, Schneider M et al. (1997) Bias in meta-analysis detected by a simple, graphical test. BMJ 315, 629–634. [DOI] [PMC free article] [PubMed] [Google Scholar]
- 28. Begg CB & Mazumdar M (1994) Operating characteristics of a rank correlation test for publication bias. Biometrics 50, 1088–1101. [PubMed] [Google Scholar]
- 29. Bellavia A, Larsson SC & Wolk A (2017) Fish consumption and all-cause mortality in a cohort of Swedish men and women. J Intern Med 281, 86–95. [DOI] [PubMed] [Google Scholar]
- 30. Engeset D, Braaten T, Teucher B et al. (2015) Fish consumption and mortality in the European Prospective Investigation into Cancer and Nutrition cohort. Eur J Epidemiol 30, 57–70. [DOI] [PMC free article] [PubMed] [Google Scholar]
- 31. Nagata C, Takatsuka N & Shimizu H (2002) Soy and fish oil intake and mortality in a Japanese community. Am J Epidemiol 156, 824–831. [DOI] [PubMed] [Google Scholar]
- 32. Takata Y, Zhang X, Li H et al. (2013) Fish intake and risks of total and cause-specific mortality in 2 population-based cohort studies of 134,296 men and women. Am J Epidemiol 178, 46–57. [DOI] [PMC free article] [PubMed] [Google Scholar]
- 33. Yamagishi K, Iso H, Fukui M et al. (2008) Fish, omega-3 polyunsaturated fatty acids, and mortality from cardiovascular diseases in a nationwide community-based cohort of japanese men and women: the JACC (Japan Collaborative Cohort Study for Evaluation of Cancer Risk) Study. J Am Coll Cardiol 52, 988–996. [DOI] [PubMed] [Google Scholar]
- 34. Owen AJ, Magliano DJ, O’Dea K et al. (2016) Polyunsaturated fatty acid intake and risk of cardiovascular mortality in a low fish-consuming population: a prospective cohort analysis. Eur J Nutr 55, 1605–1613. [DOI] [PubMed] [Google Scholar]
- 35. Bell GA, Kantor ED, Lampe JW et al. (2014) Intake of long-chain omega-3 fatty acids from diet and supplements in relation to mortality. Am J Epidemiol 179, 710–720. [DOI] [PMC free article] [PubMed] [Google Scholar]
- 36. Folsom AR & Demissie Z (2004) Fish intake, marine omega-3 fatty acids, and mortality in a cohort of postmenopausal women. Am J Epidemiol 160, 1005–1010. [DOI] [PubMed] [Google Scholar]
- 37. Björnberg KA, Vahter M, Grawé KP et al. (2005) Methyl mercury exposure in Swedish women with high fish consumption. Sci Total Environ 341, 45–52. [DOI] [PubMed] [Google Scholar]
- 38. Fakour H, Esmaili-Sari A & Zayeri F (2010) Mercury exposure assessment in Iranian women’s hair of a port town with respect to fish consumption and amalgam fillings. Sci Total Environ 408, 1538–1543. [DOI] [PubMed] [Google Scholar]
- 39. McDowell MA, Dillon CF, Osterloh J et al. (2004) Hair mercury levels in US children and women of childbearing age: reference range data from NHANES 1999–2000. Environ Health Perspect 112, 1165–1171. [DOI] [PMC free article] [PubMed] [Google Scholar]
- 40. Raymond MR, Christensen KY, Thompson BA et al. (2016) Associations between fish consumption and contaminant biomarkers with cardiovascular conditions among older male anglers in Wisconsin. J Occup Environ Med 58, 676–682. [DOI] [PubMed] [Google Scholar]
- 41. Brune D, Nordberg G, Vesterberg O et al. (1991) A review of normal concentrations of mercury in human blood. Sci Total Environ 100, 235–282. [DOI] [PubMed] [Google Scholar]
- 42. Sheehan MC, Burke TA, Navas-Acien A et al. (2014) Global methylmercury exposure from seafood consumption and risk of developmental neurotoxicity: a systematic review. Bull World Health Organ 92, 254F–269F. [DOI] [PMC free article] [PubMed] [Google Scholar]
- 43. Sioen I, De Henauw S, Van Camp J et al. (2009) Comparison of the nutritional–toxicological conflict related to seafood consumption in different regions worldwide. Reg Toxicol Pharmacol 55, 219–228. [DOI] [PubMed] [Google Scholar]
- 44. Mozaffarian D, Lemaitre RN, Kuller LH et al. (2003) Cardiac benefits of fish consumption may depend on the type of fish meal consumed: the Cardiovascular Health Study. Circulation 107, 1372–1377. [DOI] [PubMed] [Google Scholar]
- 45. Bergkvist C, Berglund M, Glynn A et al. (2015) Dietary exposure to polychlorinated biphenyls and risk of myocardial infarction – a population-based prospective cohort study. Int J Cardiol 183, 242–248. [DOI] [PubMed] [Google Scholar]
- 46. Bergkvist C, Kippler M, Larsson S et al. (2014) Dietary exposure to polychlorinated biphenyls is associated with increased risk of stroke in women. J Intern Med 276, 248–259. [DOI] [PubMed] [Google Scholar]
- 47. Welch AA, Lund E, Amiano P et al. (2002) Variability of fish consumption within the 10 European countries participating in the European Investigation into Cancer and Nutrition (EPIC) study. Public Health Nutr 5, 1273–1285. [DOI] [PubMed] [Google Scholar]
- 48. Wang DD, Li Y, Chiuve SE et al. (2016) Association of specific dietary fats with total and cause-specific mortality. JAMA Intern Med 176, 1134–1145. [DOI] [PMC free article] [PubMed] [Google Scholar]
- 49. de Mello VD, Schwab U, Kolehmainen M et al. (2011) A diet high in fatty fish, bilberries and wholegrain products improves markers of endothelial function and inflammation in individuals with impaired glucose metabolism in a randomised controlled trial: the Sysdimet study. Diabetologia 54, 2755–2767. [DOI] [PubMed] [Google Scholar]
- 50. Rangel-Huerta OD, Aguilera CM, Mesa MD et al. (2012) Omega-3 long-chain polyunsaturated fatty acids supplementation on inflammatory biomarkers: a systematic review of randomised clinical trials. Br J Nutr 107, Suppl. 2, S159–S170. [DOI] [PubMed] [Google Scholar]
- 51. Robinson LE & Mazurak VC (2013) N-3 polyunsaturated fatty acids: relationship to inflammation in healthy adults and adults exhibiting features of metabolic syndrome. Lipids 48, 319–332. [DOI] [PubMed] [Google Scholar]
- 52. Chowdhury R, Stevens S, Gorman D et al. (2012) Association between fish consumption, long chain omega 3 fatty acids, and risk of cerebrovascular disease: systematic review and meta-analysis. BMJ 345, e6698. [DOI] [PMC free article] [PubMed] [Google Scholar]
- 53. Villegas R, Takata Y, Murff H et al. (2015) Fish, omega-3 long-chain fatty acids, and all-cause mortality in a low-income US population: results from the Southern Community Cohort Study. Nutr Metab Cardiovasc Dis 25, 651–658. [DOI] [PMC free article] [PubMed] [Google Scholar]
- 54. Lu Z, Chen TC, Zhang A et al. (2007) An evaluation of the vitamin D3 content in fish: is the vitamin D content adequate to satisfy the dietary requirement for vitamin D? J Steroid Biochem Mol Biol 103, 642–644. [DOI] [PMC free article] [PubMed] [Google Scholar]
- 55. D’Elia L, Iannotta C, Sabino P et al. (2014) Potassium-rich diet and risk of stroke: updated meta-analysis. Nutr Metab Cardiovasc Dis 24, 585–587. [DOI] [PubMed] [Google Scholar]
- 56. Guasch-Ferre M, Babio N, Martinez-Gonzalez MA et al. (2015) Dietary fat intake and risk of cardiovascular disease and all-cause mortality in a population at high risk of cardiovascular disease. Am J Clin Nutr 102, 1563–1573. [DOI] [PubMed] [Google Scholar]
- 57. Wennberg M, Tornevi A, Johansson I et al. (2012) Diet and lifestyle factors associated with fish consumption in men and women: a study of whether gender differences can result in gender-specific confounding. Nutr J 11, 101. [DOI] [PMC free article] [PubMed] [Google Scholar]
Associated Data
This section collects any data citations, data availability statements, or supplementary materials included in this article.
Supplementary Materials
For supplementary material accompanying this paper visit https://doi.org/10.1017/S1368980017003834.
click here to view supplementary material