

Abstract
Objective:
To identify MR metrics that are most sensitive to early changes in the brain in spinocerebellar ataxia type 1 (SCA1) and type 3 (SCA3) using an advanced multi-modal MRI protocol in the multi-site trial setting.
Methods:
SCA1 or SCA3 mutation carriers and controls (n=107) underwent MR scanning in the US-European READISCA study to obtain structural, diffusion MRI and MR spectroscopy data using an advanced protocol at 3T. Morphometric, microstructural, and neurochemical metrics were analyzed blinded to diagnosis and compared between preataxic (n=11 SCA1, 28 SCA3), ataxic (n=14 SCA1, 37 SCA3) SCA and control (n=17) groups using non-parametric testing accounting for multiple comparisons. MR metrics that were most sensitive to preataxic abnormalities were identified using receiver operating characteristic (ROC) analyses.
Results:
Atrophy and microstructural damage in the brainstem and cerebellar peduncles and neurochemical abnormalities in the pons were prominent in both preataxic groups, when patients did not differ from controls clinically. MR metrics were strongly associated with ataxia symptoms, activities of daily living and estimated ataxia duration. A neurochemical measure was the most sensitive metric to preataxic changes in SCA1 (ROC area under the curve (AUC) =0.95) and a microstructural metric was the most sensitive metric to preataxic changes in SCA3 (AUC =0.92).
Interpretation:
Changes in cerebellar afferent and efferent pathways underlie the earliest symptoms of both SCAs. MR metrics collected with a harmonized advanced protocol in the multi-site trial setting allow detecting disease effects in individuals before ataxia onset with potential clinical trial utility for subject stratification.
Introduction
Spinocerebellar ataxias (SCAs) are rare autosomal dominant neurodegenerative disorders, the clinical hallmark of which is progressive loss of balance and coordination. SCA1 is the fastest progressing,1, 2 and SCA3 the most common SCA worldwide.3 Both are polyglutamine diseases caused by translated dynamic CAG repeat expansion mutations and present with degeneration in the cerebellum and brainstem. Disease-modifying therapies including gene silencing strategies are in the SCA therapeutic pipeline.4 Effectiveness of such therapies is most likely when they are administered at early disease stages.5 However, clinical outcome measures have low sensitivity in early disease necessitating alternative measures to identify trial participants with cerebral and cerebellar changes before onset of ataxia. Non-invasive imaging may allow detection of such early degenerative changes in SCAs, and thereby facilitate trials at early disease stages.
Atrophy of the cerebellum, brainstem and forebrain regions are reliably detected with structural MRI in SCAs,6 including in early stage at group level.7–9 In addition, microstructural damage to the white matter (WM) and neurochemical abnormalities that likely precede tissue loss were detectable at subject level in single site studies with few preataxic subjects using diffusion MRI10, 11 and magnetic resonance spectroscopy (MRS),12, 13 respectively. Hence, studies of larger trial-ready cohorts in the earliest disease stages with a multimodal imaging protocol are warranted.
READISCA14 is a multinational longitudinal clinical trial readiness study that enrolls preataxic and early ataxic SCA1 and SCA3 mutation carriers15 and matched healthy controls. READISCA enrolled the largest preataxic SCA cohorts for multimodal imaging thus far. Here we report the baseline structural, diffusion MRI and MRS findings. Our goals were 1) to evaluate the feasibility of collecting multi-modal MR data using a harmonized advanced protocol in the multi-site academic trial setting; 2) to identify the structural, microstructural and neurochemical MR metrics that are most sensitive to early abnormalities in SCA1 and SCA3 mutation carriers; and 3) to investigate the associations of these MR metrics with early clinical presentation in SCA1 and SCA3 as assessed by a comprehensive battery of outcome measures covering motor, non-motor, cognitive function and activities of daily living.
Methods
Study participants and design
The imaging cohort of READISCA included 107 participants who were willing to undergo MRI and clear of MR contraindications (Table 1). They were enrolled at 16 sites14 in the US and Europe from 2018–2021. The sample size was guided by feasibility to enroll preataxic and very early-stage participants. Participants with a Scale for the Assessment and Rating of Ataxia (SARA)16 score less than 10 (range 0–40; 0 indicating no ataxia and 40 most severe ataxia) were targeted for enrollment. SCA mutation carriers with SARA<3 were classified as preataxic and those with SARA≥3 as ataxic.15, 17 Control subjects comprised of at-risk individuals (first-degree relatives of patients) who tested negative for SCA1 or SCA3 and healthy volunteers who were unrelated to the patients. Individuals who were diagnosed with a hereditary ataxia other than SCA1 or SCA3, had a concomitant disorder that affected assessment of ataxia, had taken investigational drugs, or had changes in coordinative physical and occupational therapy 2 months prior to participation were excluded.
Table1:
Cohort Characteristics
| Variable | Control (C) | SCA1 Preataxic (P) | SCA1 Ataxic (A) | SCA3 Preataxic (P) | SCA3 Ataxic (A) |
|---|---|---|---|---|---|
| N | 17 | 11 | 14 | 28 | 37 |
| Sex (female)1 | 7 (41%) | 8 (69%) | 9 (67%) | 19 (68%) | 18 (49%) |
| Age1 | 43 [34;51] | 38 [34.5;45.5] | 46.5 [36.5;54] | 36 [31.75;41.25]b | 50 [42;57]b |
| SARA | 0 [0;1] | 1 [0;1.9] (N=10) |
8.3 [7;9] | 1.3 [0;2] | 7 [5.5;8.5] |
| CAG repeat length (long allele) | 42 [41.5;43.5]c | 45 [43;46]c (N=13) |
70 [69;72.25] | 71.5 [67;73] (N=36) |
|
| CAG repeat length (short allele) | 29 [29;30] | 29 [29;30] (N=13) |
23 [21;27] | 23 [20;24] (N=33) |
|
| Reported age at onset | 40 [35;47.5] (N=11) |
45 [37;48] (N=33) |
|||
| Reported time from ataxia onset | 6 [4;12] (N=11) |
3 [2;10] (N=33) |
|||
| Estimated time from ataxia onset2 (years) | −7.01 [−9.18; −2.19]b | 5.38 [−0.56;12.29]b (N=13) |
−2.21 [−6.78;2.36]b |
9.36 [5.04;13.19]b (N=36) |
|
| CCAS | 108 [102;112] | 101 [99;104] (N=10) |
95 [90;106] (N=13) |
101 [94;111] (N=25) |
96 [91;102]a (N=34) |
| CCFS | 0.878 [0.838;0.930] (N=15) |
0.872 [0.845;0.894]b (N=8) |
0.976 [0.930;1.030]a, b (N=12) |
0.851 [0.835;0.886]b (N=25) |
0.922 [0.864;0.982]b (N=35) |
| PHQ9 | 2.0 [0;3.0] | 0.5 [0;3.5] (N=10) |
5.5 [1.5;8.8] | 2.0 [0;4.0] | 3.5 [1.0;6.3] (N=36) |
| FARS-ADL | 0 [0;1.0] | 0 [0;1.0]b (N=10) |
4.0 [3.5;8.0]a, b (N=13) |
0.5 [0;1.8]b (N=27) |
4.0 [2.4;6.3]a, b (N=36) |
| FARS-FS | 0 [0;0] (N=15) |
0 [0;0]b (N=9) |
2 [1.5;2]a, b | 0 [0;1]b | 2 [1;2]a, b |
| EQ5D | 90 [80;90] | 90 [81;96] (N=10) |
80 [71;89] | 90 [80;98]b | 80 [70;85]b (N=36) |
| INAS | 0 [0;1] | 1 [0;2] (N=10) |
2 [1;2]a | 1 [0;2]b | 3 [2;4]a, b |
For qualitative variables, frequencies are provided using percentages and for quantitative variables median and interquartile range [Q1; Q3] are provided. N is provided when values are missing.
P < 0.01 for pairwise comparison between C and A.
P < 0.01 for pairwise comparison between P and A within a SCA group.
P < 0.05 for pairwise comparison between P and A within a SCA group.
No significant differences were observed in age and sex between the SCA groups and healthy controls.
Estimated time from onset (ataxia duration) was calculated for both premanifest and manifest SCA patients using CAG repeat length.
SARA = scale for the assessment and rating of ataxia, CCAS = cerebellar cognitive-affective syndrome, CCFS = composite cerebellar functional severity score, INAS = inventory of non-ataxia signs, FARS-FS = Friedreich’s ataxia rating scale functional staging, EQ-5D = European quality of life 5 dimensions, PHQ-9 = patient health questionnaire-9, FARS-ADL = Friedreich’s ataxia rating scale activities of daily living
Participants underwent clinical evaluation at the enrolling sites and were scanned within 9 weeks (87 subjects within 4 weeks) at one of the six imaging sites in the US (University of Minnesota, University of Florida, Johns Hopkins University, Massachusetts General Hospital) and Europe (German Center for Neurodegenerative Diseases, ICM Paris Brain Institute). Site selection was based on MR expertise, prior collaborations that enabled timely initiation of scans in parallel with clinical assessments, and availability of 3T Siemens scanners. All procedures were approved by the Institutional Review Board at each site. Informed consent was obtained from all participants.
Clinical assessments
All subjects underwent the SARA16 assessment, which is a composite cerebellar ataxia scale, and was used to define the preataxic and ataxic groups as described above. Ataxic participants reported age at ataxia onset (Table 1). In addition, time from ataxia onset was estimated using CAG repeat length for both preataxic and ataxic participants (using long alleles for SCA117 and both alleles with a newer improved statistical model for SCA3,18 which does not display a systematic bias in patients with late-onset ataxia observed with the original Tezenas formula, Tezenas du Montcel et al, Neurology, revision submitted). All participants underwent the clinical outcome assessments (COAs) of READISCA, including the Composite Cerebellar Functional Severity Score (CCFS),19 Inventory of Non-Ataxia Signs (INAS),20 Cerebellar Cognitive Affective Syndrome (CCAS) scale,21 Friedreich’s Ataxia Rating Scale Activities of Daily Living (FARS-ADL) and Functional Staging (FARS-FS) subscales,22 Patient Health Questionnaire 9 (PHQ-9)23 and the EuroQol 5D (EQ-5D) visual analogue scale.24 The COAs that showed significant group differences in the entire READISCA cohort (n=200; Tezenas du Montcel et al, Neurology, revision submitted) are summarized for the MR cohort in Table 1.
MRI data acquisition
MR data were acquired on 3T Siemens (Erlangen, Germany) scanners (5 Prisma, 1 Skyra) operating under Syngo MR E11 software and using body coil transmission and a 32-channel receive array. Structural and diffusion MRI were acquired with the Human Connectome Project (HCP) Lifespan protocol: 1) 3D T1-weighted MPRAGE (0.8mm3 isotropic resolution, repetition time (TR) = 2400ms, echo time (TE) = 2.22ms, inversion time = 1000ms, flip angle = 8°, GRAPPA factor = 2); 2) 3D T2-weighted SPACE (0.8mm3 isotropic resolution, TR/TE =3200/563ms, GRAPPA factor = 2); 3) multiband diffusion MRI acquired with opposing phase encoding in the anterior-posterior direction and q-space sampling split into two sets of 98, and two sets of 99 volumes, resulting in two sets of 197 volumes including 13 b=0 per PE (184 unique diffusion images). On Prisma scanners, 1.5mm3 isotropic resolution, TR/TE =3230/89.2ms, multiband acceleration =4, and b-values =1500, 3000 s/mm2 were used. On the Skyra scanner, 1.7mm3 isotropic resolution, TR/TE =3390/103.2ms, multiband acceleration =4 and b-values =1000, 2000 s/mm2 were used. Except b-values, q-space sampling was the same on Prisma and Skyra.
Volumes-of-interest (VOIs) for MRS were pons (16×16×16mm3) and cerebellar WM (CBWM, 17×17×17mm3). VOIs were automatically prescribed with AutoVOI, using predefined voxels on the MNI152 atlas.25 MRS data were collected using sLASER (TR/TE =3000/30ms, 80 transients),26 which was recommended by expert consensus for high fields.27 Unsuppressed water spectra were obtained as an internal quantification reference and for residual eddy current correction.28 An automated sLASER protocol29 with integrated B0 and B1 calibration minimized operator intervention.
MR quality control and preprocessing
DICOM data were de-identified using DicomBrowser30 and T1 and T2 datasets were defaced using Face Masking31 on site prior to uploading to a Flywheel (https://flywheel.io/) instance running on a dedicated server at the University of Minnesota for centralized analysis. To ensure uniform data handling across sites, the data handling pipeline was created within a Docker container at the University of Minnesota and shared with other imaging sites.
All MR data were analyzed blinded to diagnosis. Image sharpness, ringing and contrast-to-noise ratio of T1 and T2 data were scored 0–2 in subcortical, grey and white matter regions, as described previously.32 Scores for all image features were averaged. T1 and T2 images that passed QC thresholds (Pass 0–0.25, Check 0.5–1, Fail 1.25–2) were preprocessed using the HCP minimal preprocessing pipelines33 and corrected for gradient non-linearity distortion, bias-field, and readout distortions.33
Diffusion data were missing for two participants, and another was excluded due to motion artifacts. Diffusion images were corrected for motion artifacts, susceptibility-induced and eddy current distortions34 using the HCP pipelines.33 Three datasets did not include reversed phase-encoding direction due to operator error, and thus were corrected for susceptibility-induced distortions using Synb0-DISCO35 and for eddy-current and motion artifacts using EDDY from FSL.34
MRS data were missing for two participants. In addition, MRS data were excluded if the VOIs were misplaced when overwriting AutoVOI placement (1 pons spectrum, 3 CBWM spectra) or the linewidth (full-width-at-half-maximum) of the associated water reference was broader than 13Hz (11 pons spectra and 3 CBWM spectra). MRS DICOM files containing channel-combined single-shot sLASER spectra were corrected for frequency, phase and eddy-current errors in an automated pipeline36 using MRspa (https://www.cmrr.umn.edu/downloads/mrspa/) before averaging. Single shots with poor water suppression or phase fluctuation indicating subject movement were excluded from averaging.
Volumetry
Cortical, subcortical and brainstem volumes were estimated using FreeSurfer (version 6.0).37, 38 Since FreeSurfer only provides white and grey matter segmentations of the cerebellum, CERES (CEREbellum Segmentation, version 1.0), a patch-based multi-atlas segmentation tool,39 was used to estimate cerebellar lobule volumes. CERES was chosen for cerebellar segmentation because it outperformed other tools with respect to repeatability and reproducibility40 and cerebellar fissure segmentation in images with cerebellar atrophy.41 All volumes were normalized by each participant’s total intracranial volume.
ROI-based diffusion analysis
To minimize bias from differences in b-values and voxel sizes42 between Prisma and Skyra platforms, diffusion volumes with b=1500s/mm2 for Prisma and b=1000s/mm2 for Skyra were extracted for diffusion tensors calculation. Fractional anisotropy (FA), mean (MD), axial (AD) and radial diffusivity (RD) were subsequently calculated using FSL DTIFIT (FSL version 6.0) in 25 WM ROIs for each subject in their native space as previously described.11 For the list and visualization of the 25 ROI, see Figure 1 in our prior publication.11
Figure 1. Whole brain and cerebellar volumetry.

Statistical maps of whole-brain volumetry using FreeSurfer (A, B) and cerebellum volumetry using CERES (C, D) for SCA1 (A, C) and SCA3 (B, D). Group comparisons are shown in the top two rows and pairwise comparisons are shown in the bottom two rows in each panel. The P-values (Kruskal-Wallis with Holm adjustment for C-P-A group comparisons, pairwise two-tailed t-tests for P vs. C comparisons, P <0.05) are mapped to each of the segmented volumes that are placed on a T1 atlas for whole-brain volumetry. Similarly, P-values from cerebellar volumetry are placed on a subject T1 image that was transformed to MNI space. C = control, P = preataxic, A = ataxic, CBWM = cerebellar white matter, SCP = superior cerebellar peduncles, thal = thalamus, vent = ventricle. Ventricles marked with * indicate reversed relationship between groups, i.e. C < P < A.
A bias was noted in the diffusivity values in the Skyra (up to 20% higher) compared to Prisma data. To address this, diffusion data were acquired with the Prisma and Skyra protocols in the same session on a Prisma scanner from three healthy volunteers. AD, MD, and RD were computed from the same 25 WM ROIs. ROI-specific diffusivity scaling factors (diffusivity obtained with Prisma parameters divided by diffusivity obtained with Skyra parameters) were computed using average data from the three volunteers and ranged from 0.82 to 0.95. Skyra diffusivity values were then multiplied by the corresponding scaling factor. Statistical analysis was completed with both corrected and uncorrected Skyra diffusivities and with and without the Skyra data.
MRS quantification
Preprocessed, averaged spectra were quantified using a simulated basis set28 in LCModel (6.3.0G).43 Metabolite concentrations were corrected for water T2 relaxation time, tissue water content and CSF contribution in each VOI.13 For each VOI, metabolites with mean Cramér-Rao lower bounds (CRLB) ≤20% (estimated error of metabolite quantification) for the entire cohort were included in the statistical analyses. All concentrations except those for which the fitting failed (CRLB=999%) were used when calculating mean CRLBs. For metabolites with strong correlations (r <−0.7), only the sum was reported, e.g., total N-acetylaspartate (tNAA) = N-acetylaspartate+N-acetylaspartylglutamate, total creatine (tCr) = creatine+phosphocreatine, total choline = phosphocholine+glycerophosphocholine. Finally, glucose (Glc) + taurine (Tau) was reported if Glc or Tau had mean CRLB >20%.12
Statistical analysis
MR and clinical data from control, preataxic and ataxic groups were compared using non-parametric Kruskal-Wallis test. SARA scores were only compared between control and preataxic groups, since SARA was used to classify preataxic and ataxic groups. P-values were Holm adjusted for multiple comparisons within each MR analysis (for 55 volumes in FreeSurfer volumetry, 26 volumes in CERES volumetry, 25 regions in each diffusion metric, 19 metabolites in MRS across both VOIs). The metrics that showed statistical significance (P <0.05) in the group comparisons underwent pairwise comparisons between the three groups in the SCA1 and SCA3 cohorts separately using two-tailed t-tests with Dunn adjustment for multiple pairwise comparisons. Cohen’s d were computed for each group comparison as the difference in means divided by the pooled standard deviation, which was calculated as the square root of the mean of each group’s variance.
The MR metrics that best distinguished preataxic and control groups were identified using receiver operating characteristic (ROC) analyses. Optimal cut-off for the variables was determined using the Youden’s statistic that optimized specificity and sensitivity. The area under the curve (AUC) was calculated for each metric in both SCA1 and SCA3 groups. To assess the potential of multimodal MR metrics in identifying abnormalities at the preataxic stage, bivariate ROC analysis was done for SCA3 only (and not for SCA1 due to small sample size in the preataxic group, n <15).
Pearson correlations between clinical and MR measures that showed significant group differences were computed for SCA1 and SCA3 using all participants’ data, as well as without the control group. There were no group effects nor non-linearity that could be visually identified. For diffusivity metrics (AD, RD, MD), we only computed correlations of MD with COAs because it is representative of both AD and RD and showed the largest number of group differences.
The clinical and imaging data from READISCA are available from the NIMH Data Archive (https://nda.nih.gov/, Collection C3155).
Results
Cohort characteristics and matching
Consistent with the reported3 prevalence of SCA3, ~70% of SCA mutation carriers had SCA3 (n=65) and ~30% had SCA1 (n=25), with 43–44% at the preataxic stage (Table 1). The control group was age- and sex-matched to mutation carriers. As expected, ataxic patients were older than preataxic participants, which was statistically significant for SCA3. Ataxic participants had mild symptoms and minimal disability (median SARA 7–8; functional stage 2). They had ataxia symptoms for 3–6 years. Ataxic groups scored worse than controls on Friedreich’s ataxia rating scale functional staging (FARS-FS), inventory of non-ataxia signs (INAS) count and Friedreich’s ataxia rating scale activities of daily living (FARS-ADL) subscale. Composite cerebellar functional severity (CCFS) score was significantly different from controls only in the SCA1 ataxic group, and the cerebellar cognitive-affective syndrome (CCAS) scale only in the SCA3 ataxic group. None of the COAs differed significantly between preataxic and control groups.
Early atrophy in SCA1 and SCA3
All structural images passed the QC threshold (score ≤1). The regions that showed significant pairwise differences between ataxic groups vs. controls in structural MRI were identical to the regions with significant differences in the 3-group comparisons (shown in the top two rows of each panel in Fig 1), with lower p-values (Supplementary Tables 1, 4). Cerebellar WM, medulla, pons, and superior cerebellar peduncle (SCP) were atrophied in both ataxic groups. In addition, SCA3 ataxic group had atrophy of the thalamus, nucleus accumbens, putamen, pallidum, total and subcortical (striatum, thalamus, pallidum) grey matter. The medulla and SCP were already atrophied at preataxic stage. In addition, the SCA1 preataxic group had atrophy of the pons and left cerebellar WM, and the SCA3 preataxic group displayed enlarged 4th ventricle.
Both ataxic groups had atrophy of cerebellar lobule IV. In addition, the SCA3 ataxic group showed atrophy of lobule X and left lobule I/II, with lobule X atrophied at preataxic stage.
Early microstructural deficits in SCA1 and SCA3
Diffusivity findings were largely identical with and without the Skyra data and with the corrected and uncorrected Skyra values; therefore, we report the statistical findings with the corrected Skyra diffusivities. Similar to volumetric findings, the regions that showed significant pairwise differences between ataxic groups vs. controls in diffusion MRI were identical to the regions with significant differences in the 3-group comparisons (shown in the top two rows of each panel in Fig 2), with lower p-values (Supplementary Tables 2, 5).
Figure 2. Microstructural MRI metrics from different ROI.
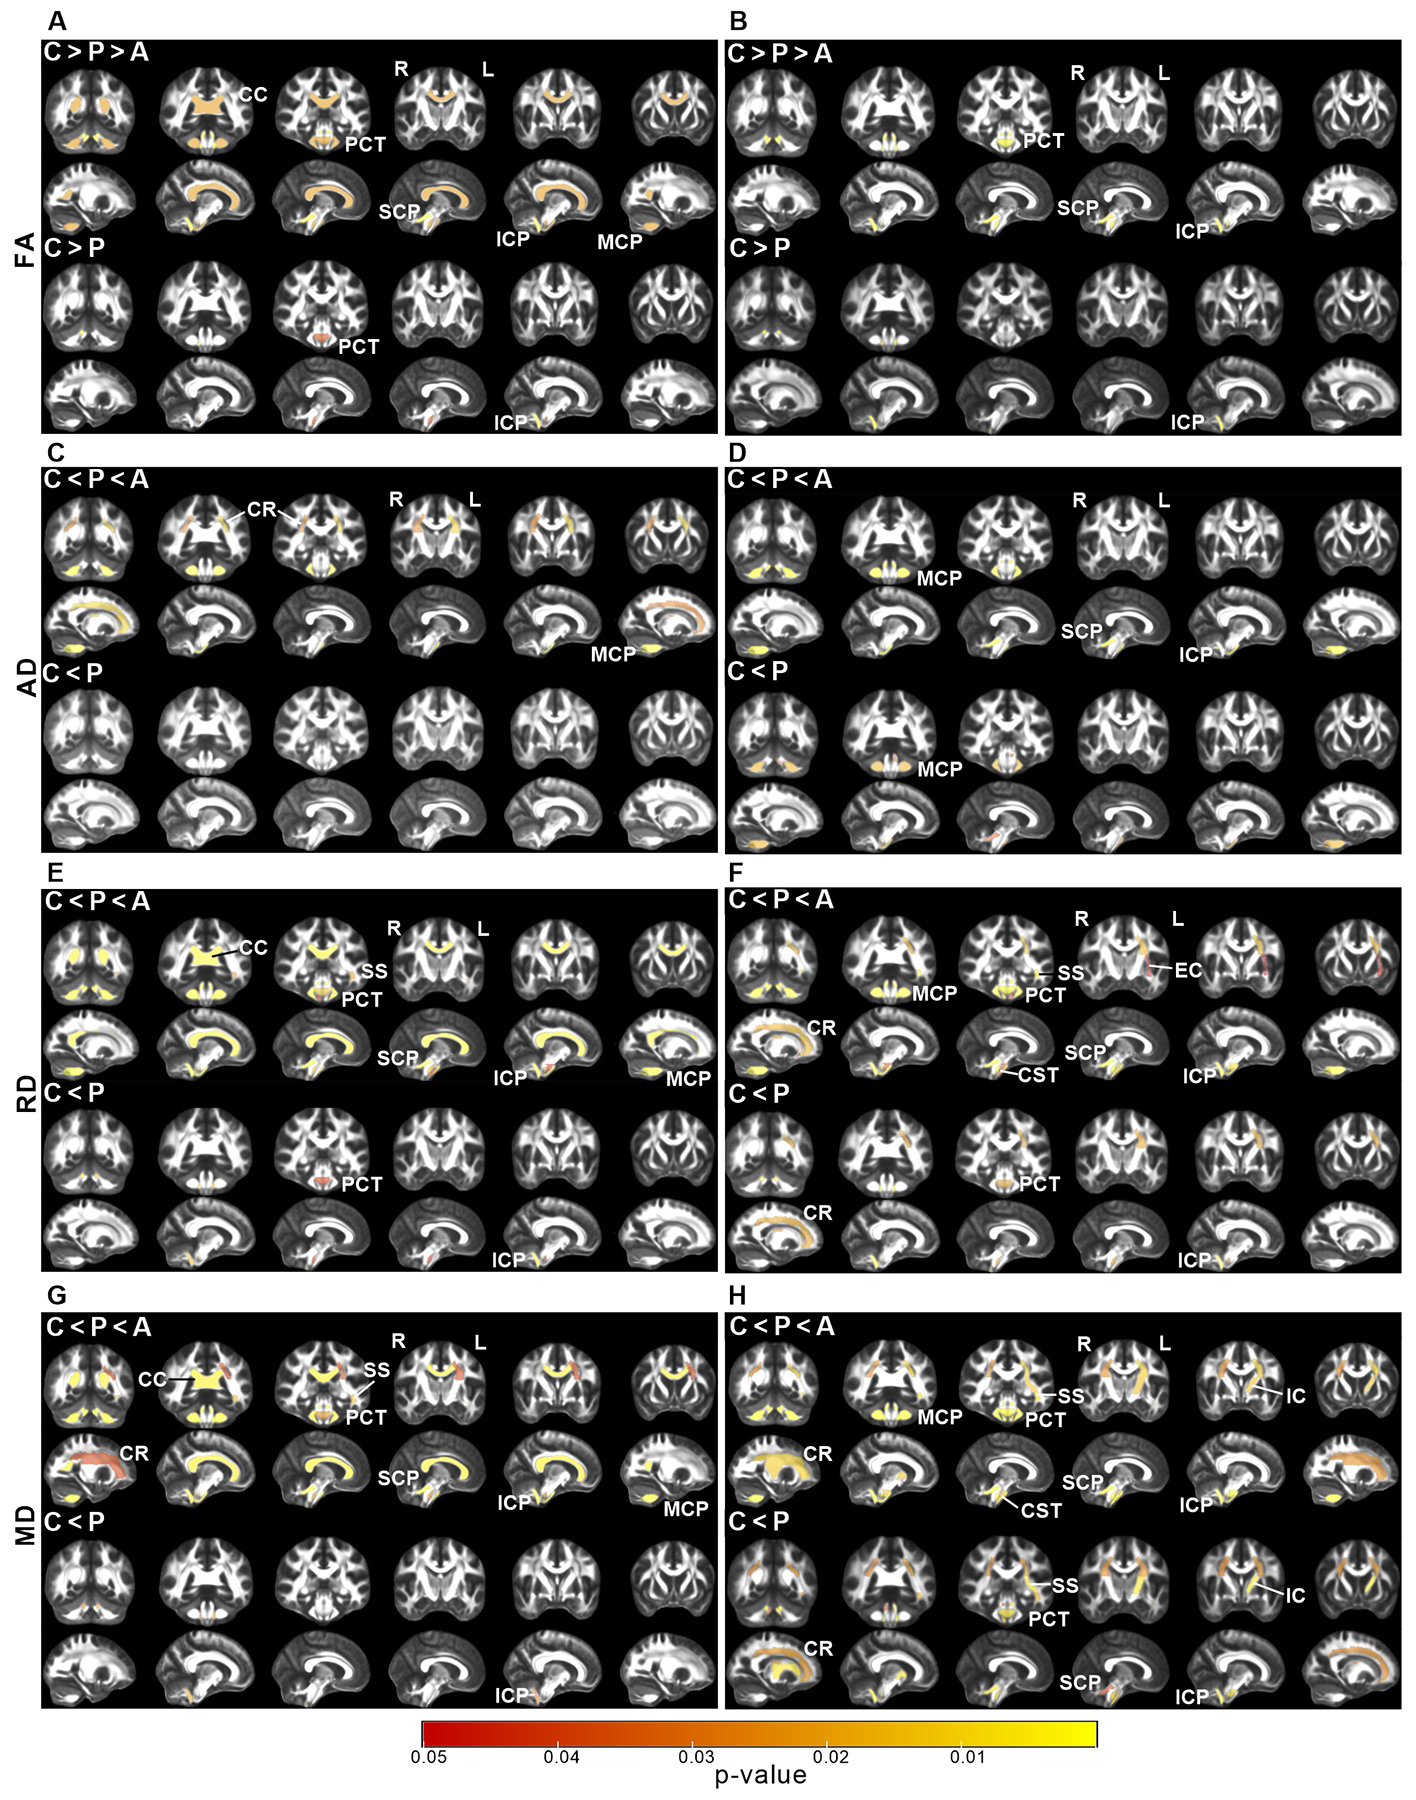
Statistical maps of ROI based diffusion MRI analyses show significant differences in fractional anisotropy (A, B), axial diffusivity (C, D), radial diffusivity (E, F) and mean diffusivity (G, H) for SCA1 (A, C, E, G) and SCA3 (B, D, F, H). Group comparisons are shown in the top two rows and pairwise comparisons are shown in the bottom two rows in each panel. The P-value maps (Kruskal-Wallis with Holm adjustment for C-P-A group comparisons, pairwise two-tailed t-tests for P vs. C comparisons, P <0.05) are represented on WM ROIs on the FMRIB58 atlas FA map. C = control, P = preataxic, A = ataxic, PCT = pontine crossing tract, MCP = middle cerebellar peduncle, ICP = inferior cerebellar peduncle, SCP = superior cerebellar peduncle, CC = corpus callosum, CST = corticospinal tract, IC = internal capsule, SS = sagittal stratum, CR = corona radiata.
Both ataxic groups displayed WM microstructural deficits in the pontine crossing tract (PCT) and cerebellar peduncles (inferior (ICP), superior (SCP), middle (MCP)) as measured by lower FA and higher diffusivities than controls (Fig 2 and Supplementary Tables 2, 5). In addition, corticospinal tract (CST), sagittal stratum (SS) and corona radiata (CR) were affected in both ataxic groups based on higher diffusivities. Corpus callosum (CC) was only affected in ataxic SCA1 (lower FA, higher MD and RD), while external (EC) and internal capsules (IC) were only affected in ataxic SCA3 (higher RD/MD).
PCT and ICP were affected in both preataxic groups. In addition, the SCA3 preataxic group displayed widespread microstructural damage, including all cerebellar peduncles, CR, CST, IC and SS (Fig 2).
Early neurochemical abnormalities in SCA1 and SCA3
MRS data quality was high across groups, with comparable signal-to-noise ratio and linewidths between patients and controls (Supplementary Tables 3, 6).
Group differences for multiple neurochemicals were highly statistically significant for both SCAs, particularly for the pons. For both ataxic groups, levels of tNAA, a marker of neuronal viability, was lower and myo-inositol (mI), a putative glial marker, was higher than controls in both VOIs (Fig 3). In addition, tCr and Glc+Tau, which may indicate deficits in energy metabolism, were higher in both VOIs in ataxic SCA3 and in pons in ataxic SCA1 than controls.
Figure 3. Neurochemical abnormalities from MR spectra.

MR spectra from one subject in each cohort. Voxel positions are shown on MPRAGE images. Arrows indicate type I error corrected significant metabolite differences in each SCA group compared to controls. CBWM = cerebellar white matter, mI = myo-inositol, tNAA = total N-acetylaspartate, tCr = total creatine, Glc+Tau = glucose+taurine.
Neurochemical differences reached statistical significance only in the pons at preataxic stage. Namely, mI was higher in both preataxic groups than controls. Preataxic SCA1 participants further had lower tNAA and higher tCr than controls. In addition, tNAA/tCr and tNAA/mI ratios, which are widely used measures of neuroglial status, were lower in the pons in both preataxic groups.
MR metrics most sensitive to preataxic disease
ROC analyses were used to identify the metrics most sensitive (highest AUC) to preataxic alterations within each modality (whole brain volumetry, cerebellar volumetry, diffusion MRI and MRS) (Fig 4).
Figure 4. MR metrics most sensitive to preataxic alterations as identified from ROC analyses.

Violin plots (A, C) and ROC curves (B, D) for the top volumetry (whole brain and cerebellar), diffusion and MRS metrics that best distinguish preataxic SCA1 (A, B) and SCA3 (C, D) groups from controls. Violin plots are shown for all groups (ataxic, preataxic SCA and control) with two-tailed t-tests of pairwise comparison P-values reported, while ROC analyses included control and preataxic groups only. Area under the curve (AUC) for each metric is indicated in the ROC plots. ROC = receiver operating characteristic, Vol = volume, SCP = superior cerebellar peduncle, FA = fractional anisotropy, ICP-R = inferior cerebellar peduncle right, tCr = total creatine, RD = radial diffusivity, mI = myo-inositol, VIIIB = lobule VIIIB of cerebellum, X = lobule X of cerebellum.
In SCA1, pontine tCr had the highest AUC (0.95) among the top metrics to distinguish preataxic participants from controls. Consistently, violin plots with individual subject data showed little overlap between the pontine tCr levels of the preataxic and control groups and largely equivalent tCr levels in the preataxic and ataxic groups.
In SCA3, RD of ICP had the highest AUC (0.92), and, similar to tCr in SCA1, the ICP RD values for the SCA3 preataxic and ataxic groups largely overlapped. Combinations of two MR metrics distinguished preataxic participants from controls with higher AUC than single metrics (Supplementary Table 7). For example, the combination of ICP FA and cerebral peduncle AD resulted in almost perfect separation of preataxic participants from controls with an AUC of 0.97.
Clinical correlations
In SCA1, ataxia symptoms (SARA, FARS-FS) were significantly associated with volumes and microstructural measures from brainstem (pons, medulla), cerebellum and their connecting pathways, with the strongest associations detected for cerebellar peduncles (|r|=0.76–0.8, Fig 5). Strongest neurochemical correlates of ataxia were the neuronal marker tNAA (|r|~0.71–0.79), followed by the glial marker mI (r~0.62–0.76). MR metrics were also associated with fine motor function (CCFS), non-ataxia signs (INAS), and estimated ataxia duration. Among patient reported outcomes, the FARS-ADL scale showed the same pattern of associations with MR metrics as SARA and FARS-FS, while the European quality of life 5 dimensions (EQ-5D) and depression/anxiety (PHQ-9) scales lacked these associations. Finally, the cognitive and affective symptoms as measured by the CCAS scale showed moderate associations (|r|~0.3–0.4) with CBWM volume, SCP and CC microstructure and the glial marker mI.
Figure 5. Associations of MR and clinical metrics in SCA1.

Statistically significant (P <0.05) Pearson correlations between COAs and volumetric (A), neurochemical (B) and microstructural (C) metrics are shown. Correlation coefficients (r) were computed using all participants’ data (ataxic SCA1, preataxic SCA1, controls) and are color coded as indicated by the legend bar. The size of the circles also indicates strength of the correlation. SARA = scale for the assessment and rating of ataxia, CCAS = cerebellar cognitive-affective syndrome, CCFS = composite cerebellar functional severity score, INAS = inventory of non-ataxia signs, FARS-FS = Friedreich’s ataxia rating scale functional staging, EQ-5D = European quality of life 5 dimensions, PHQ-9 = patient health questionnaire-9, FARS-ADL = Friedreich’s ataxia rating scale activities of daily living subscale, Est-Dur = estimated ataxia duration, Lob-IV = lobule IV of cerebellum, CBWM = cerebellar white matter, mI = myo-inositol, tNAA = total N-acetylaspartate, tCr = total creatine, Glc+Tau = glucose + taurine, CC = corpus callosum, SCP = superior cerebellar peduncle, MCP = middle cerebellar peduncle, ICP = inferior cerebellar peduncle, PCT = pontine crossing tract, CR = corona radiata, SS = sagittal stratum, R = right, L = left.
Many clinical-MR associations were observed in the larger SCA3 sample (Fig 6). Similar to SCA1, macro- and microstructural metrics in the brainstem, particularly the pons, and cerebellar peduncles were the strongest correlates of ataxic symptoms (SARA, FARS-FS), fine motor skills (CCFS), non-ataxia signs (INAS), FARS-ADL and estimated ataxia duration. Importantly, volumes of several forebrain structures (thalamus, putamen, nucleus accumbens), and diffusivity of major cerebral WM tracts (CR, CST) were associated with ataxia symptoms, non-ataxia signs and FARS-ADL. The larger sample also revealed associations of cerebellar and brainstem macro- and microstructure with cognitive and affective symptoms (CCAS), and of pons and cerebellar peduncle measures with quality of life (EQ-5D) and depression/anxiety (PHQ-9). Neurochemical associations with ataxia symptoms, non-ataxia signs, patient reported outcomes (FARS-ADL, EQ-5D, PHQ-9) and estimated ataxia duration were overall stronger than those of the structural and microstructural metrics.
Figure 6. Associations of MR and clinical metrics in SCA3.

Statistically significant (P <0.05) Pearson correlations between COAs and volumetric (A), neurochemical (B) and microstructural (C) metrics are shown. Correlation coefficients (r) were computed using all participants’ data (ataxic SCA3, preataxic SCA3, controls) and are color coded as indicated by the legend bar. The size of the circles also indicates strength of the correlation. SARA = scale for the assessment and rating of ataxia, CCAS = cerebellar cognitive-affective syndrome, CCFS = composite cerebellar functional severity score, INAS = inventory of non-ataxia signs, FARS-FS = Friedreich’s ataxia rating scale functional staging, EQ5D = European quality of life 5 dimensions, PHQ-9 = patient health questionnaire-9, FARS-ADL = Friedreich’s ataxia rating scale activities of daily living subscale, Est-Dur = estimated ataxia duration, I.II-Lob = lobule I & II of cerebellum, IV-Lob = lobule IV of cerebellum, X-Lob = lobule X of cerebellum, Thal = thalamus, Puta = putamen, Palli = pallidum, Accum = nucleus accumbens, Lat-Vent = lateral ventricle, Cere = cerebellum, CBWM = cerebellar white matter, mI = myo-inositol, tNAA = total N-acetylaspartate, tCr = total creatine, Glc+Tau = glucose + taurine, CC = corpus callosum, SCP = superior cerebellar peduncle, MCP = middle cerebellar peduncle, ICP = inferior cerebellar peduncle, PCT = pontine crossing tract, CR = corona radiata, SS = sagittal stratum, R = right, L = left.
The pattern of associations was similar without the control data, but associations were weaker. Correlations were not driven by cluster effects, as shown for SARA, FARS-FS, FARS-ADL and estimated duration, the strongest clinical correlates of MR metrics overall (Fig 7). DTI and MRS metrics had the strongest associations with these COA.
Figure 7. The strongest MR correlates of SARA, functional stage, activities of daily living and estimated disease duration in SCA1 and SCA3.
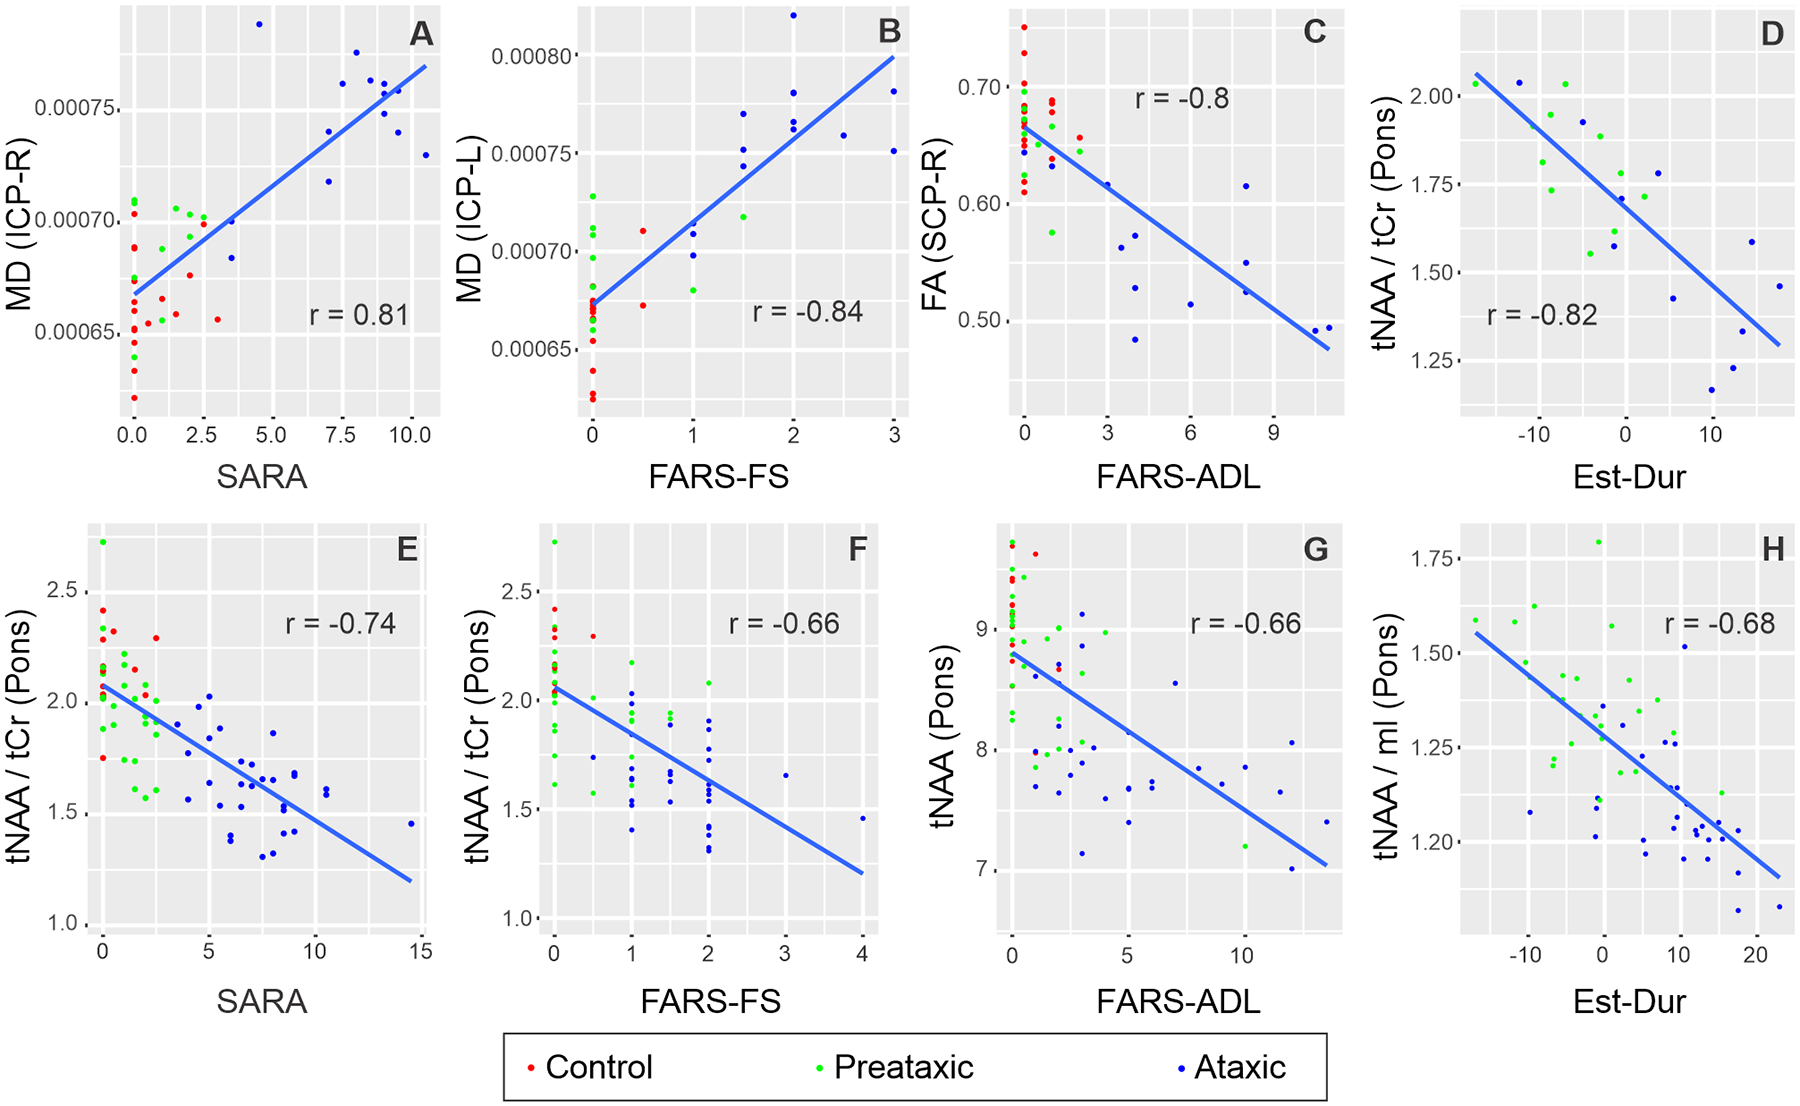
Pearson correlations of MR metrics with the highest correlation coefficient with each of SARA, FARS-FS, FARS-ADL and Estimated Duration are shown for SCA1 (A-D) and SCA3 (E-H). Correlation coefficients (r) were computed using all participants’ data (ataxic SCA, preataxic SCA, controls). All correlations had P <0.001.
Discussion
This study represents the first multi-site clinical trial readiness effort in SCAs to validate morphometric, microstructural, and neurochemical outcome measures using an advanced MR protocol. The data expand our current knowledge on the earliest structural, microstructural and neurochemical abnormalities that are present prior to ataxia onset and demonstrate WM damage that precedes GM damage in both SCAs. Thus, this is the first report of microstructural abnormalities in major WM tracts beyond the cerebellum and brainstem before ataxia onset in SCA3. From the trial readiness perspective, this is the first demonstration that neurochemical (for SCA1) and microstructural (for SCA3) MR metrics detect preataxic abnormalities with exceptionally high sensitivity (AUC >0.9 in ROC analyses) in a multi-site trial setting, that they are more sensitive than structural metrics to earliest changes and that neurochemical and miscrostructural metrics are the strongest correlates of ataxia symptoms, activities of daily living and estimated ataxia duration. Most importantly, the data demonstrate the possibility of enriching clinical trial cohorts with those individuals with highest cerebral and cerebellar impairment before ataxia onset (detectable on a single subject level), which is currently not possible based on any clinical or laboratory measurements.
First-in-human testing of gene silencing therapies has begun for SCA3.44 Interventions are most likely to slow pathological changes if administered before substantial neurodegeneration5 and hereditary SCAs will allow enrollment of mutation carriers in clinical trials before ataxia onset. Functional changes have been documented at the preataxic stage in SCAs using dopamine transporter45 and metabolic46 imaging. Due to broader availability of MR scanners, we aimed to identify MR endpoints sensitive to early pathology in the trial setting for SCAs, i.e., academic hospitals that house specialized ataxia clinics, which allowed us to implement a state-of-the-art MR protocol at 3T with advanced pulse sequences. The novel combination of morphometric with microstructural and neurochemical markers allowed a broader window into early pathology than prior multi-site MR studies of morphometric changes in SCAs.8, 47, 48 We chose ROI-based volumetric and diffusion MRI analyses to identify robust subject-level metrics for use in clinical trials. Future group-level analyses of the same data, e.g., using tractography, will likely identify additional affected areas. The MRS data were limited to two VOIs because SCA-control classifications are driven strongly by metabolite levels in these regions.12
We took a conservative statistical approach because the goal was to identify the most robust metrics that may facilitate enrollment of mutation carriers in trials, rather than to provide a detailed account of MR detectable abnormalities. For example, we did not average right and left volumes or combine multiple cerebellar lobules to reduce the number of statistical comparisons. To allow readers access to the full set of findings, we provide adjusted and unadjusted P-values (Supplementary Materials). In addition, we primarily utilized univariate statistical analysis because the sample size was still limited for a training and testing set needed to validate a multi-variate statistical model, for example to establish an MR score for SCA1 and SCA3.
Atrophy in the brainstem, cerebellum, and SCPs in the ataxic groups was consistent with prior reports8, 13, 49, 50 (Fig 1). Notably the WM of the cerebellum was atrophied, while total cerebellar cortex was not, indicative of axonopathy that precedes cell loss. Together with the microstructural damage in all cerebellar peduncles and brainstem (PCT) these data support WM deficits as the defining features of early-stage pathology in both diseases. Interestingly, RD differences were more prominent than AD in both SCAs, indicating more prevalent myelin loss than axonal injury.51, 52 While this interpretation is problematic in regions with many crossing fibers,52, 53 in highly ordered WM tracts, such as those in SCP (FA~0.67), and in the absence of edema, the prominent RD abnormalities are supportive of early oligodendrocyte pathology proposed in SCA3.54, 55
Early grey matter damage was limited to select regions of the cerebellar cortex, namely lobules involved in motor processing (IV, I/II) and vestibulocerebellum (lobule X)56 and subcortical forebrain structures (thalamus, pallidum, putamen, nucleus accumbens). Importantly, despite large overlap in cerebellar/brainstem regions involved in SCA1 and SCA3, the pattern of tissue damage was genotype-specific, therefore imaging data collected clinical trials should not be pooled across genotypes.
Cerebral involvement was detected with higher sensitivity by diffusion than structural MRI, consistent with microstructural changes preceding tissue loss. Prior work had shown damage to cerebral WM tracts, e.g., CC and CST, in more advanced cohorts with SCA1 and SCA3.7, 57 The current study revealed the presence of these WM alterations earlier in the disease course.
At preataxic stage, brainstem atrophy was consistent with prior reports.7–9, 49 In fact, SCP volume was the top volumetric metric that distinguished preataxic participants from controls (Fig 4). Microstructural damage was limited to brainstem (PCT) and cerebellar tracts (ICP) in SCA1, but widespread in SCA3, before ataxia onset. While cerebellar peduncle and midbrain WM damage was reported before ataxia onset in SCA3,7 extended cerebral microstructural abnormalities captured in our larger preataxic cohort show that whole brain WM damage is substantial before ataxia onset in SCA3. In addition to larger sample size, the preataxic SCA3 group may have been closer to ataxia onset than the preataxic SCA1 group (Table 1), allowing the detection of more extensive WM damage. However, a systematic bias in the estimated time to ataxia onset is likely for the SCA3 cohort based on the inconsistency between the estimated vs. reported time from onset (9 vs. 3 years) in the ataxic SCA3 group. Ongoing follow-up of the preataxic patients will reveal if the preataxic SCA3 group was indeed closer to onset. Interestingly, diffusion measures in the ICP were the top DTI metrics that distinguished preataxic from control groups, with AUC >0.9, for both SCAs, demonstrating impaired spinal input to the cerebellum as a very early event in the disease course. A caudal-rostral progression of SCA3 pathology was proposed previously7 and our findings are supportive of this sequence of events for both SCA1 and SCA3, with pathology moving from the medulla to pons, cerebellum and later to cerebrum. In this sequence of events, pontine tissue loss and neurochemical abnormalities were more extensive in preataxic SCA1 than SCA3, possibly predictive of faster disease progression in SCA1 following ataxia onset. Notably, the pontine tCr level distinguished the preataxic SCA1 from controls with the highest AUC among all MR metrics, consistent with our preliminary observation that individual mutation carriers can be distinguished from controls based on MRS.12 This opens the possibility of enriching clinical trial cohorts with those individuals with highest impairment before ataxia onset. Although clinical disease manifestations can be detected before ataxia onset with larger sample sizes,9 and preataxic sensory and corticospinal signs were detected in the larger clinical READISCA cohort (N=200) (Tezenas du Montcel et al, Neurology, revision submitted), COAs were not significantly different in the preataxic groups than controls with the current sample size, demonstrating the higher sensitivity of the imaging markers to early disease.
It is important for imaging markers to be related to the clinical presentation for their utility as clinically meaningful outcome measures in trials. We detected strong associations (|r| >0.7) of brainstem and cerebellar MR metrics with ataxia despite a limited SARA range. Correlations of macro- and microstructural metrics obtained in the pons, cerebellar peduncles and cerebellar WM and neuroglial markers tNAA and mI in the pons and cerebellar WM particularly stood out, underlining the importance of cerebellar afferent and efferent pathways in early symptomatology in both SCAs. MR-COA correlations were weaker overall for SCA3 than SCA1, potentially due to phenotypic heterogeneity characteristic of SCA3, which may be associated with varying MRI signatures.58 Also note that the markers most sensitive to preataxic pathology (e.g. tCr) may not necessarily be the most sensitive to progression (e.g. tNAA, the strongest neurochemical correlate of SARA), consistent with our experience in SCA1 mouse models.59, 60
Patient reported outcome measures are particularly important for FDA approval of new therapeutics. FARS-ADL evaluates the impact of ataxia symptoms on daily activities such as speech, swallowing and motor function (dressing, hygiene, mobility) as reported by patients and their families, and as such showed a very similar pattern of associations with MR metrics to SARA and FARS-FS. On the other hand, EQ-5D that combines multiple domains including mobility, pain and mental health, and the depression/anxiety scale PHQ-9 were not associated with MR metrics in SCA1 and weakly associated with few structural and neurochemical measures in SCA3. The CCAS scale,21 which was designed to detect and quantify the set of impairments identified in patients with cerebellar disorders, showed a higher number of correlations with MR metrics, primarily in the cerebellum and pons.
We further observed moderate-to-strong associations of cerebellar and pons MR metrics with estimated ataxia duration. Existing statistical models to estimate time to ataxia onset in preataxic individuals utilize CAG repeat length and current age.17, 18 While they perform well at group level, these estimates carry a large uncertainty in estimating onset age of individual patients. Noninvasive imaging metrics can enrich these parametric models and are expected to reduce the uncertainty of these estimates, which will be critical in subject stratification in trials. The predictive value of MR metrics for ataxia onset will be better understood with longitudinal follow-up data that are currently being collected in the READISCA project.
A limitation of the study was the smaller sample size in the SCA1 group, but the ratio of SCA1 and SCA3 sample sizes was consistent with prior multi-site studies.1 The smaller sample size in SCA1 coupled with a conservative type I error correction could have limited several MR metrics to reach statistical significance. Future studies need to collect trial readiness data with larger sample sizes in global efforts such as the Ataxia Global Initiative.61 A technical limitation was the use of scanners from a single vendor. Future trial readiness studies need to incorporate scanners from all major MR vendors. The use of state-of-the-art technologies will likely be limited in multi-site settings that prioritize inclusion of all vendors and scanner models with wide-ranging technical specifications. However, the high resolution utilized here for structural imaging, the basic DTI model for analyzing only the low b-value of the diffusion data, and the neurochemicals of primary interest (tNAA, mI, tCr) will be broadly appliable across vendors and models.
To summarize, morphometric, microstructural, and neurochemical metrics are highly sensitive to pathology before ataxia onset and are associated with patient’s daily experiences. Neurochemical and microstructural metrics detected cerebellar and brainstem abnormalities at preataxic stage with higher sensitivity than morphometric measures. Non-invasive access to such microstructural and biochemical changes before neuronal loss is expected to facilitate clinical trial enrollment of participants at the earliest disease stages, thereby increasing the likelihood of slowing pathological changes by potential therapeutics.
Supplementary Material
Acknowledgements
The READISCA investigators would like to thank all participants for their enduring willingness and interest in this research. We extend gratitude to Brian Hanna for developing the defacing/de-identification Docker pipeline, Diane Hutter, Ann Fishman, Jason Macmore, Brigitte Jacoby, Samantha Pierce, Jessica Magenheim, Anke Ruehling and Hortense Hurmic for study coordination and Chantel Potvin for outstanding project management.
This work was supported by the National Institute of Neurological Disorders and Stroke (NINDS) grant U01 NS104326. The Center for Magnetic Resonance Research is supported by the National Institute of Biomedical Imaging and Bioengineering (NIBIB) grant P41 EB027061, the Institutional Center Cores for Advanced Neuroimaging award P30 NS076408 and S10 OD017974. Research reported in this publication was also supported by an Academic Investment Research Program (AIRP) award at the University of Minnesota and the National Center for Advancing Translational Sciences of the National Institutes of Health Award Number UL1TR000114. A portion of this work was performed in the McKnight Brain Institute of the University of Florida at the National High Magnetic Field Laboratory’s Advanced Magnetic Resonance Imaging and Spectroscopy (AMRIS) Facility, which is supported by National Science Foundation Cooperative Agreement DMR-1644779 and the State of Florida and was supported in part by an NIH award, S10 OD021726, for High End Instrumentation. The content is solely the responsibility of the authors and does not necessarily represent the official views of the National Institutes of Health.
Potential Conflicts of Interest
Dr. Tezenas du Montcel and Lenglet receive research support from Biogen, which develops therapeutics for SCAs. Dr. Schmahmann consults for Biogen and received support from Biohaven, which develop therapeutics for SCAs. Dr. Ashizawa received grants from Biogen and participates in Biohaven clinical trials. Within the last 24 months Dr. Klockgether has received consulting fees from Biogen, UCB and Vico Therapeutics, which are developing therapeutics for SCAs. Dr. Öz consults for IXICO Technologies Limited, which provides neuroimaging services and digital biomarker analytics to biopharmaceutical firms conducting clinical trials for SCAs, and receives research support from Biogen, which develops therapeutics for SCAs.
Abbreviations
- AD
Axial diffusivity
- CBWM
Cerebellar white matter
- CC
Corpus callosum
- CCAS
Cerebellar cognitive-affective syndrome
- CCFS
Composite cerebellar functional severity score
- COA
Clinical outcome assessments
- CR
Corona radiata
- CST
Corticospinal tract
- EC
External capsule
- EQ-5D
European quality of life 5 dimensions
- FA
Fractional anisotropy
- FARS-ADL
Friedreich’s ataxia rating scale activities of daily living subscale
- FARS-FS
Friedreich’s ataxia rating scale functional staging
- FASTESTMAP
Fast, automatic shim technique using echo-planar signal readout for mapping along projections
- FOV
Field of view
- Glc+Tau
Glucose + taurine
- GRAPPA
Generalized autocalibrating partial parallel acquisition
- IC
Internal capsule
- ICP
Inferior cerebellar peduncle
- INAS
Inventory of non-ataxia signs
- MCP
Middle cerebellar peduncle
- MD
Mean diffusivity
- mI
myo-Inositol
- MPRAGE
Magnetization-prepared rapid gradient-echo
- MRS
Magnetic resonance spectroscopy
- PCT
Pontine crossing tract
- PHQ-9
Patient health questionnaire-9
- RD
Radial diffusivity
- SARA
Scale for the assessment and rating of ataxia
- SCP
Superior cerebellar peduncle
- sLASER
Semi- localization by adiabatic selective refocusing
- SPACE
Sampling perfection with application-optimized contrasts using different flip angle evolution
- SS
Sagittal stratum
- tCr
Total creatine = creatine + phosphocreatine
- TE
Echo time
- tNAA
Total N-acetylaspartate = N-acetylaspartate + N-acetylaspartylglutamate
- TR
Repetition time
- VOI
Volume of interest
- WM
White matter
References
- 1.Ashizawa T, Figueroa KP, Perlman SL, et al. Clinical characteristics of patients with spinocerebellar ataxias 1, 2, 3 and 6 in the US; a prospective observational study. Orphanet J Rare Dis. 2013;8:177. [DOI] [PMC free article] [PubMed] [Google Scholar]
- 2.Jacobi H, Bauer P, Giunti P, et al. The natural history of spinocerebellar ataxia type 1, 2, 3, and 6: a 2-year follow-up study. Neurology. 2011;77:1035–1041. [DOI] [PMC free article] [PubMed] [Google Scholar]
- 3.Schols L, Bauer P, Schmidt T, et al. Autosomal dominant cerebellar ataxias: clinical features, genetics, and pathogenesis. Lancet Neurol. 2004;3:291–304. [DOI] [PubMed] [Google Scholar]
- 4.Ashizawa T, Öz G, Paulson HL. Spinocerebellar ataxias: prospects and challenges for therapy development. Nat Rev Neurol. 2018;14:590–605. [DOI] [PMC free article] [PubMed] [Google Scholar]
- 5.Rubinsztein DC, Orr HT. Diminishing return for mechanistic therapeutics with neurodegenerative disease duration?: There may be a point in the course of a neurodegenerative condition where therapeutics targeting disease-causing mechanisms are futile. Bioessays. 2016;38:977–980. [DOI] [PMC free article] [PubMed] [Google Scholar]
- 6.Öz G, Harding IH, Krahe J, Reetz K. MR imaging and spectroscopy in degenerative ataxias: toward multimodal, multisite, multistage monitoring of neurodegeneration. Curr Opin Neurol. 2020;33:451–461. [DOI] [PMC free article] [PubMed] [Google Scholar]
- 7.Rezende TJR, de Paiva JLR, Martinez ARM, et al. Structural signature of SCA3: From presymptomatic to late disease stages. Ann Neurol. 2018;84:401–408. [DOI] [PubMed] [Google Scholar]
- 8.Faber J, Schaprian T, Berkan K, et al. Regional Brain and Spinal Cord Volume Loss in Spinocerebellar Ataxia Type 3. Mov Disord. 2021;36:2273–2281. [DOI] [PMC free article] [PubMed] [Google Scholar]
- 9.Jacobi H, Reetz K, du Montcel ST, et al. Biological and clinical characteristics of individuals at risk for spinocerebellar ataxia types 1, 2, 3, and 6 in the longitudinal RISCA study: analysis of baseline data. Lancet Neurol. 2013;12:650–658. [DOI] [PubMed] [Google Scholar]
- 10.Solodkin A, Peri E, Chen EE, et al. Loss of Intrinsic Organization of Cerebellar Networks in Spinocerebellar Ataxia Type 1: Correlates with Disease Severity and Duration. Cerebellum. 2011;10:218–232. [DOI] [PMC free article] [PubMed] [Google Scholar]
- 11.Park YW, Joers JM, Guo B, et al. Assessment of Cerebral and Cerebellar White Matter Microstructure in Spinocerebellar Ataxias 1, 2, 3, and 6 Using Diffusion MRI. Front Neurol. 2020;11:411. [DOI] [PMC free article] [PubMed] [Google Scholar]
- 12.Joers JM, Deelchand DK, Lyu T, et al. Neurochemical abnormalities in premanifest and early spinocerebellar ataxias. Ann Neurol. 2018;83:816–829. [DOI] [PMC free article] [PubMed] [Google Scholar]
- 13.Deelchand DK, Joers JM, Ravishankar A, et al. Sensitivity of Volumetric Magnetic Resonance Imaging and Magnetic Resonance Spectroscopy to Progression of Spinocerebellar Ataxia Type 1. Mov Disord Clin Pract. 2019;6:549–558. [DOI] [PMC free article] [PubMed] [Google Scholar]
- 14.Clinical Trial Readiness for SCA1 and SCA3 (READISCA), NCT03487367. Available from: https://clinicaltrials.gov/ct2/show/NCT03487367.
- 15.Maas RP, van Gaalen J, Klockgether T, van de Warrenburg BP. The preclinical stage of spinocerebellar ataxias. Neurology. 2015;85:96–103. [DOI] [PubMed] [Google Scholar]
- 16.Schmitz-Hübsch T, du Montcel ST, Baliko L, et al. Scale for the assessment and rating of ataxia: development of a new clinical scale. Neurology. 2006;66:1717–1720. [DOI] [PubMed] [Google Scholar]
- 17.Tezenas du Montcel S, Durr A, Rakowicz M, et al. Prediction of the age at onset in spinocerebellar ataxia type 1, 2, 3 and 6. J Med Genet. 2014;51:479–486. [DOI] [PMC free article] [PubMed] [Google Scholar]
- 18.Peng L, Chen Z, Long Z, et al. New Model for Estimation of the Age at Onset in Spinocerebellar Ataxia Type 3. Neurology. 2021;96:e2885–e2895. [DOI] [PubMed] [Google Scholar]
- 19.du Montcel ST, Charles P, Ribai P, et al. Composite cerebellar functional severity score: validation of a quantitative score of cerebellar impairment. Brain. 2008;131:1352–1361. [DOI] [PubMed] [Google Scholar]
- 20.Jacobi H, Rakowicz M, Rola R, et al. Inventory of Non-Ataxia Signs (INAS): validation of a new clinical assessment instrument. Cerebellum. 2013;12:418–428. [DOI] [PubMed] [Google Scholar]
- 21.Hoche F, Guell X, Vangel MG, et al. The cerebellar cognitive affective/Schmahmann syndrome scale. Brain. 2018;141:248–270. [DOI] [PMC free article] [PubMed] [Google Scholar]
- 22.Lynch DR, Farmer JM, Tsou A, et al. Measuring Friedreich ataxia: complementary features of examination and performance measures. Neurology. 2006;66:1711–1716. [DOI] [PubMed] [Google Scholar]
- 23.Kroenke K, Spitzer RL, Williams JB. The PHQ-9: validity of a brief depression severity measure. J Gen Intern Med. 2001;16:606–613. [DOI] [PMC free article] [PubMed] [Google Scholar]
- 24.EuroQol G. EuroQol--a new facility for the measurement of health-related quality of life. Health Policy. 1990;16:199–208. [DOI] [PubMed] [Google Scholar]
- 25.Park YW, Deelchand DK, Joers JM, et al. AutoVOI: real-time automatic prescription of volume-of-interest for single voxel spectroscopy. Magn Reson Med. 2018;80:1787–1798. [DOI] [PMC free article] [PubMed] [Google Scholar]
- 26.Deelchand DK, Berrington A, Noeske R, et al. Across-vendor standardization of semi-LASER for single-voxel MRS at 3T. NMR Biomed. 2021;34:e4218. [DOI] [PMC free article] [PubMed] [Google Scholar]
- 27.Wilson M, Andronesi O, Barker PB, et al. Methodological consensus on clinical proton MRS of the brain: Review and recommendations. Magn Reson Med. 2019;82:527–550. [DOI] [PMC free article] [PubMed] [Google Scholar]
- 28.Deelchand DK, Adanyeguh IM, Emir UE, et al. Two-site reproducibility of cerebellar and brainstem neurochemical profiles with short-echo, single-voxel MRS at 3T. Magn Reson Med. 2015;73:1718–1725. [DOI] [PMC free article] [PubMed] [Google Scholar]
- 29.Deelchand DK, Henry PG, Joers JM, et al. Plug-and-play advanced magnetic resonance spectroscopy. Magn Reson Med. 2022;87:2613–2620. [DOI] [PMC free article] [PubMed] [Google Scholar]
- 30.Archie KA, Marcus DS. DicomBrowser: software for viewing and modifying DICOM metadata. J Digit Imaging. 2012;25:635–645. [DOI] [PMC free article] [PubMed] [Google Scholar]
- 31.Milchenko M, Marcus D. Obscuring surface anatomy in volumetric imaging data. Neuroinformatics. 2013;11:65–75. [DOI] [PMC free article] [PubMed] [Google Scholar]
- 32.Backhausen LL, Herting MM, Buse J, et al. Quality Control of Structural MRI Images Applied Using FreeSurfer-A Hands-On Workflow to Rate Motion Artifacts. Front Neurosci. 2016;10:558. [DOI] [PMC free article] [PubMed] [Google Scholar]
- 33.Glasser MF, Sotiropoulos SN, Wilson JA, et al. The minimal preprocessing pipelines for the Human Connectome Project. Neuroimage. 2013;80:105–124. [DOI] [PMC free article] [PubMed] [Google Scholar]
- 34.Bastiani M, Andersson JLR, Cordero-Grande L, et al. Automated processing pipeline for neonatal diffusion MRI in the developing Human Connectome Project. Neuroimage. 2019;185:750–763. [DOI] [PMC free article] [PubMed] [Google Scholar]
- 35.Schilling KG, Blaber J, Hansen C, et al. Distortion correction of diffusion weighted MRI without reverse phase-encoding scans or field-maps. PLoS One. 2020;15:e0236418. [DOI] [PMC free article] [PubMed] [Google Scholar]
- 36.Deelchand DK, Adanyeguh IM, Emir UE, et al. Two-site reproducibility of cerebellar and brainstem neurochemical profiles with short-echo, single voxel MRS at 3 T Magn Reson Med. 2015;73:1718–1725. [DOI] [PMC free article] [PubMed] [Google Scholar]
- 37.Fischl B, Salat DH, van der Kouwe AJ, et al. Sequence-independent segmentation of magnetic resonance images. Neuroimage. 2004;23 Suppl 1:S69–84. [DOI] [PubMed] [Google Scholar]
- 38.Iglesias JE, Van Leemput K, Bhatt P, et al. Bayesian segmentation of brainstem structures in MRI. Neuroimage. 2015;113:184–195. [DOI] [PMC free article] [PubMed] [Google Scholar]
- 39.Romero JE, Coupe P, Giraud R, et al. CERES: A new cerebellum lobule segmentation method. Neuroimage. 2017;147:916–924. [DOI] [PubMed] [Google Scholar]
- 40.Sörös P, Wölk L, Bantel C, et al. Replicability, Repeatability, and Long-term Reproducibility of Cerebellar Morphometry. Cerebellum. 2021;20:439–453. [DOI] [PMC free article] [PubMed] [Google Scholar]
- 41.Cabeza-Ruiz R, Velazquez-Perez L, Linares-Barranco A, Perez-Rodriguez R. Convolutional Neural Networks for Segmenting Cerebellar Fissures from Magnetic Resonance Imaging. Sensors (Basel). 2022;22: 1345. [DOI] [PMC free article] [PubMed] [Google Scholar]
- 42.Papinutto ND, Maule F, Jovicich J. Reproducibility and biases in high field brain diffusion MRI: An evaluation of acquisition and analysis variables. Magn Reson Imaging. 2013;31:827–839. [DOI] [PubMed] [Google Scholar]
- 43.Provencher SW. Estimation of metabolite concentrations from localized in vivo proton NMR spectra. Magn Reson Med. 1993;30:672–679. [DOI] [PubMed] [Google Scholar]
- 44.Biogen. A Pharmacokinetics and Safety Study of BIIB132 in Adults With Spinocerebellar Ataxia 3, NCT05160558. 2021; Available from: https://clinicaltrials.gov/ct2/show/NCT05160558.
- 45.Yen TC, Tzen KY, Chen MC, et al. Dopamine transporter concentration is reduced in asymptomatic Machado-Joseph disease gene carriers. J Nucl Med. 2002;43:153–159. [PubMed] [Google Scholar]
- 46.Soong BW, Liu RS. Positron emission tomography in asymptomatic gene carriers of Machado-Joseph disease. J Neurol Neurosurg Psychiatry. 1998;64:499–504. [DOI] [PMC free article] [PubMed] [Google Scholar]
- 47.Schulz JB, Borkert J, Wolf S, et al. Visualization, quantification and correlation of brain atrophy with clinical symptoms in spinocerebellar ataxia types 1, 3 and 6. Neuroimage. 2010;49:158–168. [DOI] [PubMed] [Google Scholar]
- 48.Reetz K, Costa AS, Mirzazade S, et al. Genotype-specific patterns of atrophy progression are more sensitive than clinical decline in SCA1, SCA3 and SCA6. Brain. 2013;136:905–917. [DOI] [PubMed] [Google Scholar]
- 49.Nigri A, Sarro L, Mongelli A, et al. Spinocerebellar Ataxia Type 1: One-Year Longitudinal Study to Identify Clinical and MRI Measures of Disease Progression in Patients and Presymptomatic Carriers. Cerebellum. 2021. [DOI] [PubMed] [Google Scholar]
- 50.Piccinin CC, Rezende TJR, de Paiva JLR, et al. A 5-Year Longitudinal Clinical and Magnetic Resonance Imaging Study in Spinocerebellar Ataxia Type 3. Mov Disord. 2020;35:1679–1684. [DOI] [PubMed] [Google Scholar]
- 51.Song SK, Sun SW, Ramsbottom MJ, et al. Dysmyelination revealed through MRI as increased radial (but unchanged axial) diffusion of water. Neuroimage. 2002;17:1429–1436. [DOI] [PubMed] [Google Scholar]
- 52.Winklewski PJ, Sabisz A, Naumczyk P, et al. Understanding the Physiopathology Behind Axial and Radial Diffusivity Changes-What Do We Know? Front Neurol. 2018;9:92. [DOI] [PMC free article] [PubMed] [Google Scholar]
- 53.Wheeler-Kingshott CA, Cercignani M. About “axial” and “radial” diffusivities. Magn Reson Med. 2009;61:1255–1260. [DOI] [PubMed] [Google Scholar]
- 54.Ramani B, Panwar B, Moore LR, et al. Comparison of spinocerebellar ataxia type 3 mouse models identifies early gain-of-function, cell-autonomous transcriptional changes in oligodendrocytes. Hum Mol Genet. 2017;26:3362–3374. [DOI] [PMC free article] [PubMed] [Google Scholar]
- 55.Schuster KH, Zalon AJ, Zhang H, et al. Impaired Oligodendrocyte Maturation Is an Early Feature in SCA3 Disease Pathogenesis. J Neurosci. 2022;42:1604–1617. [DOI] [PMC free article] [PubMed] [Google Scholar]
- 56.Baumann O, Borra RJ, Bower JM, et al. Consensus paper: the role of the cerebellum in perceptual processes. Cerebellum. 2015;14:197–220. [DOI] [PMC free article] [PubMed] [Google Scholar]
- 57.Martins CR Junior, Borba FC, Martinez ARM, et al. Twenty-five years since the identification of the first SCA gene: history, clinical features and perspectives for SCA1. Arq Neuropsiquiatr. 2018;76:555–562. [DOI] [PubMed] [Google Scholar]
- 58.Nunes MB, Martinez AR, Rezende TJ, et al. Dystonia in Machado-Joseph disease: Clinical profile, therapy and anatomical basis. Parkinsonism Relat Disord. 2015;21:1441–1447. [DOI] [PubMed] [Google Scholar]
- 59.Öz G, Nelson CD, Koski DM, et al. Noninvasive detection of presymptomatic and progressive neurodegeneration in a mouse model of spinocerebellar ataxia type 1. J Neurosci. 2010;30:3831–3838. [DOI] [PMC free article] [PubMed] [Google Scholar]
- 60.Emir UE, Brent Clark H, Vollmers ML, et al. Non-invasive detection of neurochemical changes prior to overt pathology in a mouse model of spinocerebellar ataxia type 1. J Neurochem. 2013;127:660–668. [DOI] [PMC free article] [PubMed] [Google Scholar]
- 61.Klockgether T, Ashizawa T, Brais B, et al. Paving the Way Toward Meaningful Trials in Ataxias: An Ataxia Global Initiative Perspective. Mov Disord. 2022;37:1125–1130. [DOI] [PubMed] [Google Scholar]
Associated Data
This section collects any data citations, data availability statements, or supplementary materials included in this article.