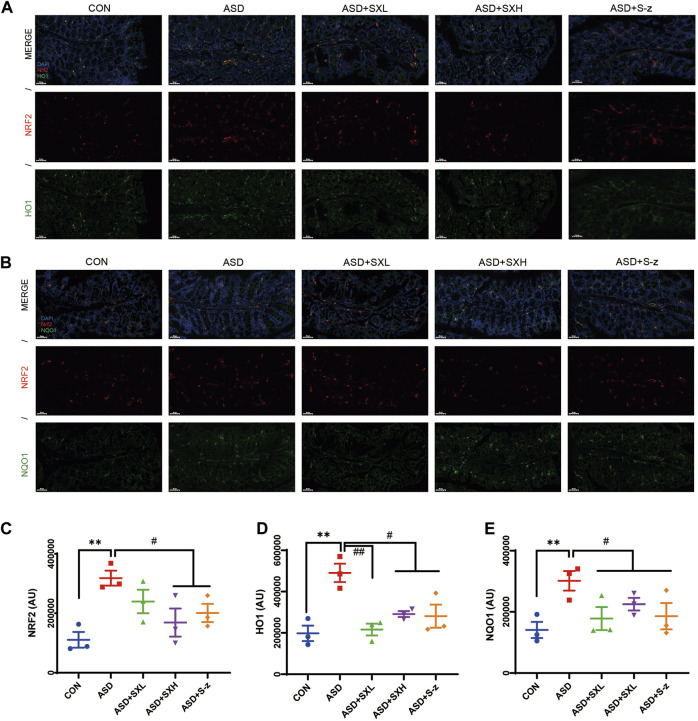
In the published article, there was an error in Figure 6 as published. The pictures for ASD + S-z groups in Figure 6 were erroneously presented after being redrawn and submitted. The corrected Figure 6 and its caption appear below.
FIGURE 6.
Immunofluorescence analysis of NRF2 (red), HO1 and NQO1 (green) in colon mucosal layers (×400 magnification). (A) Representative fluorescence confocal images show NRF2 and HO1 staining in the colon sections of mice belonging to the CON, ASD, ASD + SXL, ASD + SXH, and ASD + S-z groups. The nuclei were stained with DAPI (blue). (B) Representative fluorescence confocal images show NRF2 and NQO1 staining in the colon sections of mice belonging to the CON, ASD, ASD + SXL, ASD + SXH, and ASD + S-z groups. The nuclei were stained with DAPI (blue). (C) Quantitative analysis of NRF2 fluorescence. (D) Quantitative analysis of HO1 fluorescence. (E) Quantitative analysis of NQO1 fluorescence. The immunofluorescence signal intensity in the images was quantified using the ImageJ software. n = 3 per group. The experiment was repeated three times. The data are shown as mean ± S.E.M. ** p < 0.01 vs CON group; # p < 0.05, ## p < 0.01 vs ASD group. Scale bar: 50 μm.
The authors apologize for this error and state that this does not change the scientific conclusions of the article in any way. The original article has been updated.
Publisher’s note
All claims expressed in this article are solely those of the authors and do not necessarily represent those of their affiliated organizations, or those of the publisher, the editors and the reviewers. Any product that may be evaluated in this article, or claim that may be made by its manufacturer, is not guaranteed or endorsed by the publisher.


