Abstract
In this study, we target the main protease (Mpro) of the SARS-CoV-2 virus as it is a crucial enzyme for viral replication. Herein, we report three plausible allosteric sites on Mpro that can expand structure-based drug discovery efforts for new Mpro inhibitors. To find these sites, we used mixed-solvent molecular dynamics (MixMD) simulations, an efficient computational protocol that finds binding hotspots through mapping the surface of unbound proteins with 5% cosolvents in water. We have used normal mode analysis to support our claim of allosteric control for these sites. Further, we have performed virtual screening against the sites with 361 hits from Mpro screenings available through the National Center for Advancing Translational Sciences (NCATS). We have identified the NCATS inhibitors that bind to the remote sites better than the active site of Mpro, and we propose these molecules may be allosteric regulators of the system. After identifying our sites, new X-ray crystal structures were released that show fragment molecules in the sites we found, supporting the notion that these sites are accurate and druggable.
Graphical Abstract
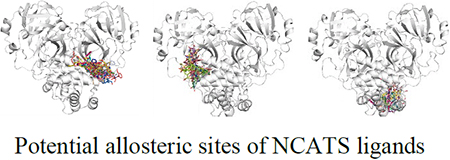
Introduction
The SARS-CoV-2 genome encodes twenty-nine proteins, which are characterized as structural, non-structural, or accessory proteins.1 The main protease (Mpro or 3CLpro) plays a key role in in polyproteolytic cleavage, a crucial step for viral replication. Due to COVID-19 being a worldwide health emergency, there have been hundreds of crystal structures of Mpro deposited in the PDB Databank since 2020.2, 3 As of the submission of this paper, there are 550 structures deposited for Mpro. The wide availability of structural data has been a boon for researchers worldwide.
3C-like proteases have been targets of interest for antiviral drug development in other prevalent coronaviruses, such as SARS-CoV. Both belong to the peptidase C30 family and possess three structural domains. The crystal structures reveal Mpro is a homodimer, with each monomer containing an N-terminal catalytic domain. Domain I (res. 8–101) and II (res. 102–184) contain mainly anti-parallel β barrels whereas Domain III (res. 201–303) contains five alpha helices. These mediate homodimerization (PDB ID: 6XHU). The dimers are bound to one another perpendicularly and have a contact interface of ~1394 Å2. The catalytic Cis145-His41 dyad is found in the active-site cavity, which accommodates four substrate residues. Mpro appears to be an attractive target for antiviral development and drug repurposing since it has a conserved structure and does not have a human homologue. It has been reported that an α-ketoamide inhibitor effectively targets the homodimer substrate-binding site pocket, for example, and results in a reduction of catalytic activity. Other researchers argue, however, that Mpro is a challenging target for small-molecule inhibitor development. Binding site flexibility and mutagenesis of the C44-P52 loop could lead to natural selection and be detrimental in designing small molecules for Mpro.
An alternative is to target Mpro with allosteric regulators that bind outside the traditional catalytic site. To aid in this effort, we have used MixMD molecular dynamics to map potential allosteric sites on Mpro. MixMD is a leading cosolvent method that has successfully identified hotspots on diverse targets4–6, mapped PPI interfaces7, and more recently probed cryptic sites on 12 systems8. For each of the identified sites, we tested them further with Normal Mode Analysis (NMA) to identify whether allosteric effects were possible because of altered mode dynamics. Lastly, we use virtual screening to dock known inhibitors into each of the binding sites to identify those that fit the potential allosteric sites better than the traditional active site. We propose these may be allosteric inhibitors of Mpro. Lastly, we find support for our proposed sites from recent crystal structures which appeared subsequent to our studies.
Materials and Methods
Protein Setup
The apo dimeric crystal structure of the Mpro (PDB ID 7ALI) was used.9 Crystal waters were removed, and hydrogen atoms were added using Protonate3D tool in Molecular Operating Environment (MOE2019)10 for structure preparation prior to setting up the cosolvent simulations. Protonation states of histidine were checked and corrected if required using Protonate3D and visual inspection. The conformation of asparagine and glutamine were investigated visually and corrected. Molprobity11 and H++ server12 was used to guide the protein setup. The net charge on the system (−8) was neutralized by addition of sodium ions, and the system was solvated with TIP3P water13 using tleap module in AMBER20.14 Tleap module in AmberTools package was used for solvating the protein in cosolvent boxes. The first step involves creation of a 7 Å shell of probe solvents around the protein surface, followed by solvation with TIP3P water13 using SolvateBox command. The number of water molecules were adjusted to reach the 5% concentrations (vol:vol) as reported in our previous publications.4–6 Six different neutral, water-soluble probes with diverse chemical groups were used in our simulations: acetonitrile (ACN), isopropanol (IPA), pyrimidine (PYR), N-methyl acetamide (MAC), imidazole (IMI), and ethanol (EOH). Each cosolvent was run independently of the other probes. ACN, IPA, EOH, IMI, and PYR probe parameters were developed by Lexa et al.15 MAC parameters were used from Caldwell and Kollman.16 The layer-solvated protein system was used as the starting point for the MixMD simulations.
MixMD Simulation Protocol
The mixed-solvent systems were simulated using AMBER20 and ff14SB force field17 with Particle Mesh Ewald (pmemd.cuda) implementation on GPUs18. As in our previous work,4 we ran 10 independent simulations for each probe type. SHAKE19 was used to constrain bonds with any hydrogen atoms, and a timestep of 2 fs was used. Van der Waals non-bonded interactions were cutoff at 11Å. After initial minimizations, we gradually heated the system in four steps at constant volume conditions. Each heating step was 500ps (0K-100K, 100K-200K, 200K-300K, 300K), and the temperature was maintained using a weak temperature coupling algorithm.20 During the four heating steps, the protein atoms were restrained with a 5 kcal/mol•Å2 weight, and the final step involved 700 ps of simulation at 300K with the same harmonic restraint on the protein. The next step involved equilibration of the system (500 ps) with gradual removal of restraints on the protein side chains, slowly reducing the restraint weights from 5 to 1 kcal/mol•Å2. After removal of side-chain restraints, the system was equilibrated for 500 ps at 300K. The final step involved fully unrestrained dynamics for 2 ns to ensure proper equilibration. Unrestrained production runs were for 40 ns at 300K and 1 bar pressure, under isobaric conditions (NTP ensemble). The Berendsen barostat21 was used for pressure regulation. The minimization steps were performed using sander, the temperature ramping, equilibration, and production steps were carried out using pmemd.cuda engine18 of AMBER20. Ten independent productions runs were performed for each probe type, accounting for 400ns of simulation data per probe. With six different probes, this gave a total of 2.4 μs of sampling for the system. We have shown in our previous work5 that 20–30 nanoseconds of conventional dynamics is sufficient to sample hotspots, as the probe molecules we chose are small and diffuse well in the given time span.
Probe Occupancy Calculations
The last 10 ns of the 40-ns production trajectories were used to calculate probe locations on the protein surface. The trajectories were combined, centered, and aligned. Then, probe locations were analyzed using grid command in Cpptraj (version V5.0.5 (GitHub))22 from AmberTools. A total of 200×200×200 grids were generated with a 0.5-Å spacing. The center of mass (CoM) position of the probe atoms was visualized as a mesh of occupancy densities. These densities were obtained from the raw bin counts, which were converted to Z-scores using the equation (1) where xi is the occupancy at grid point i, μ is the mean occupancy of all grid points, and σ is the standard deviation of occupancy at all grid points. These “normalized density” maps for each probe could then be visualized with PyMOL23. Thus, the probe positions could be represented in a manner similar to electronic density maps from X-ray data. The maps were also contoured at various Z-values and examined with the average protein structure to find highly occupied regions from the MixMD simulations. A higher sigma value reveals a longer residence time for the probe in that location and points to an important binding hotspot. The maps were color coded as ACN-orange, IPA-blue, PYR-purple, IMI-black, MAC-yellow, and EOH-pale pink. We have used both all-atom and CoM grid maps to assess regions of maximal probe occupancy.
| (1) |
Normal Mode Analysis of Hotspots
Using the resultant probe densities, MixMD Probeview24 was used to identify potential allosteric sites on Mpro, where the default parameters for DBSCAN clustering were set at occupancy cutoff= 0.1, ε= 3, and minimum number of points= 10. Sites were prioritized and numbered based on their rank (Z >=35) and whether they were predicted on both monomers. Where applicable, the higher rank between a set of paired sites had precedence. Many hotspots were found in the active site, but the active site was not considered in the MixMD analysis as we were aiming to identify allosteric sites.
Using the method of Panjkovich and Duara,25 octahedron pseudo-ligands (composed of six carbon dummy atoms) were manually placed in hotspots present in each of the predicted sites. These served to simulate the presence of a bound allosteric modulator (i.e., “holo” state). The carbon-carbon distance of the edges was 1.5 Å in length. Custom R scripts using the Bio3D package (version 2.4–1) were utilized to evaluate the impact of the pseudo-ligands on protein flexibility.26, 27 An all-atom elastic network model with the aaenm force field was used for NMA calculations. The first 10 non-redundant modes were examined, which correspond to the large-amplitude conformational changes. Subsequently, theoretical temperature factors (B) were calculated for all non-hydrogen atoms using equation 2:
| (2) |
where 〈μ2〉 is the mean squared displacement. Wilcoxon signed-rank tests were employed for comparison on an atom-wise basis between the bound (holo) and unbound (apo) states, and two-tailed p-values were generated. A typical cutoff of p-values < 0.05 was considered significant in this study.
Cross-Correlation Analysis between Hotspots and the Active Site
Dynamic cross correlation matrices (DCCM) were calculated to analyze possible allosteric regions from the MixMD trajectories of Mpro. We used the correlationplus tool,35 which extracts pairwise correlation of all residues from molecular dynamics simulations. We used the tool with its default settings and analyzed all of the ACN, IPA, and PYR MixMD trajectories of Mpro. The DCCM plots have been provided in the supplementary section (Figures S8(PYR), S9(IPA), and S10 (ACN)). There is positive correlation between the active site and key residues in sites 1, 2, and 3 though not all three sites in all three series of MD simulations. Some sites only had correlations in simulations with specific probe types.
Docking Methodology to New Binding sites on Mpro
To aid in drug-design efforts, NCATS Open Data Portal has deposited 3CLpro enzyme assays on approximately 3000 small-molecule drugs from the NCATS Pharmaceutical Collection.28 The assay protocol and screening data29 is available free of charge to the entire scientific community. Drug repurposing can help scientists assess the efficacy of known drugs on the Mpro target and save immense time and efforts in designing new treatments. The Open Data Portal has all the details on the drug libraries screened, assay parameters, mechanisms of drug action, and screening data. We used only the active compounds reported in the 3CLpro enzymatic assay data and used those as our input for virtual screening. We filtered out duplicates in the dataset and used a PAINS filter in MOE201910 to remove undesirable molecules. Out of the initial 452 NCATS hits, we used 361 filtered NCATS hits for virtual-screening purposes against Mpro. These small molecules are structurally diverse and shown to inhibit Mpro. The molecules were processed with MOE2019 at pH=7.4 and then converted to mol2 and pdbqt formats for GOLD30 and AutoVina31 docking experiments, respectively. GOLD v5.830 was used for the virtual screening for all three potential-allosteric sites and the active site of Mpro. ChemPLP scoring function was used and a large radius of 12.5 Å was used to accommodate for the elongated contour of site 1. For sites 2 and 3, a radius of 9 Å was used. To identify the NCATS hits that preferentially bound to the allosteric sites, a “counter screen” against the active site was necessary. The active-site docking was setup with GOLD’s default radius of 9 Å. Do_cavity was turned off and the top-two poses per molecule were saved in mol2 format. Site 1 is an elongated, shallow trough of many subsites and thus a bigger radius around the centroid of the binding site 1 warrants a better conformer search across it. For the receptor structures, we used the MixMD ensembles generated in the production runs. The simulations were clustered in cpptraj (version V4.25.6) using the hierarchical agglomerative clustering based on the backbone RMSD of the dimer. Only the last 10 ns of the 40 ns runs were used to cluster representative structures as the same snapshots were used for analyzing the probe densities on the protein. The centroid of each cluster was used as a representative receptor structure and processed further for use in virtual screening. A total of 18 representative receptor structures were used in GOLD ensemble docking.
Autodock Vina31 was used as another choice for the virtual screening exercise due to its superior scoring and sampling power as seen in D3R challenge. The receptor structures and the 361 ligands were converted into pdbqt format using AutoDock Tools. Conversion to pdbqt format was essential wherein polar hydrogens were checked and atom type nomenclature for Vina was added. Due to the unavailability of ensemble docking feature in Autodock Vina, we were required to screen against each conformation separately, which is very time consuming. Therefore, we selected only the top-8 representative structures for Autodock Vina setup. Each receptor was setup individually to dock with the 361 hits set. The centroid of the binding sites used in GOLD were also used to setup the binding sites in Autodock Vina.31 The total number of modes probed were 12, exhaustiveness parameter was set at 30, and energy range was set at 10. The padding around the centroid of the binding sites were kept at 30×30×30. The box volume defines the region in which the ligand center can explore during the docking run.
We needed a means of comparing the poses from GOLD and Autodock Vina, so we chose to rescore all the poses using a more precise scoring function. MDock’s ITScore scoring function32, 33 was used to rescore the top poses obtained from AutoDock Vina31 and GOLD30. We used the default parameters for clash_potential_penalty, grid spacing, ligand orientation, and grid box size was chosen based on the radius cut off used in GOLD docking. From our analysis of similar docked poses for known ligands in Mpro, we have found that values can vary by ±1 ITScore unit, so any scores within ±1 unit are noted in bold in the file NCATS_Data.xlsx in the Supplemental Information. In these cases, ligands have nearly equal likelihood to bind to both receptor sites, so binding is ambiguous.
Results and Discussion
Analysis of the cosolvent densities from the last 10 ns from the production runs resulted in extensive mapping on Mpro (Figure 1). The CoM of probe densities was analyzed at Z=30 contoured level, giving us 12 sites on the target. Sites that were evenly mapped on both protomers were given priority during our visual inspection. MixMD was successful in mapping the substrate-binding site, at a high level (Z>70) as seen in Figure 2. The substrate-binding site (Figure 2) is located within a deep cleft between domains I and II. Parsing through all the crystal structures (400+) from the Cov3D database, we found ~200 ligands that bind either covalently or non-covalently, exploiting various subsites of this substrate binding pocket. Our allosteric site 1(labelled in Figure 1) is a combined site composed of 3 separately mapped hotspots (1A, 1B, and 1C) located on the interdomain (domain-II/domain III) surface. Site 1A and 1B are within 3 Å as are 1B and 1C, and the combined site analyses gave us substantial evidence of allosteric modulation through the NMA, we combined the 3 subsites (1A, 1B, 1C) and treated it as a single Site 1. The site is an elongated trough and is lined well with hydrophobic residues Gln 107, Pro 108, Gly 109, Ile 200, Thr 201, Val 202, Asn 203, Ile 249, Pro 252, Leu 253, Phe 294, Asp 295, and Val 297. The probes ACN, IPA, PYR, and IMI map the site extensively. Allosteric site 2 (Figure 1) is a compact, well-defined pocket on the C-terminal domain, near the dimer interface composed of residues Phe-3, Ile 213, Asn 214, Gln 299, Cys 300, and Ser 301 of chain A and Tyr 118, Phe 140, and Leu 141 of chain B. Site 3 resides at the bottom face of the Mpro structure, mapped with only three probes, IMI, IPA and, PYR at a slightly lower Z cutoff as compared to Sites 1 and 2. Allosteric Site 3 is centered at the distal end of the five helical bundle at Domain III and has contacts with Leu 271, Leu 272, Gly 275, Met 276, and Asn 277.
Figure 1.
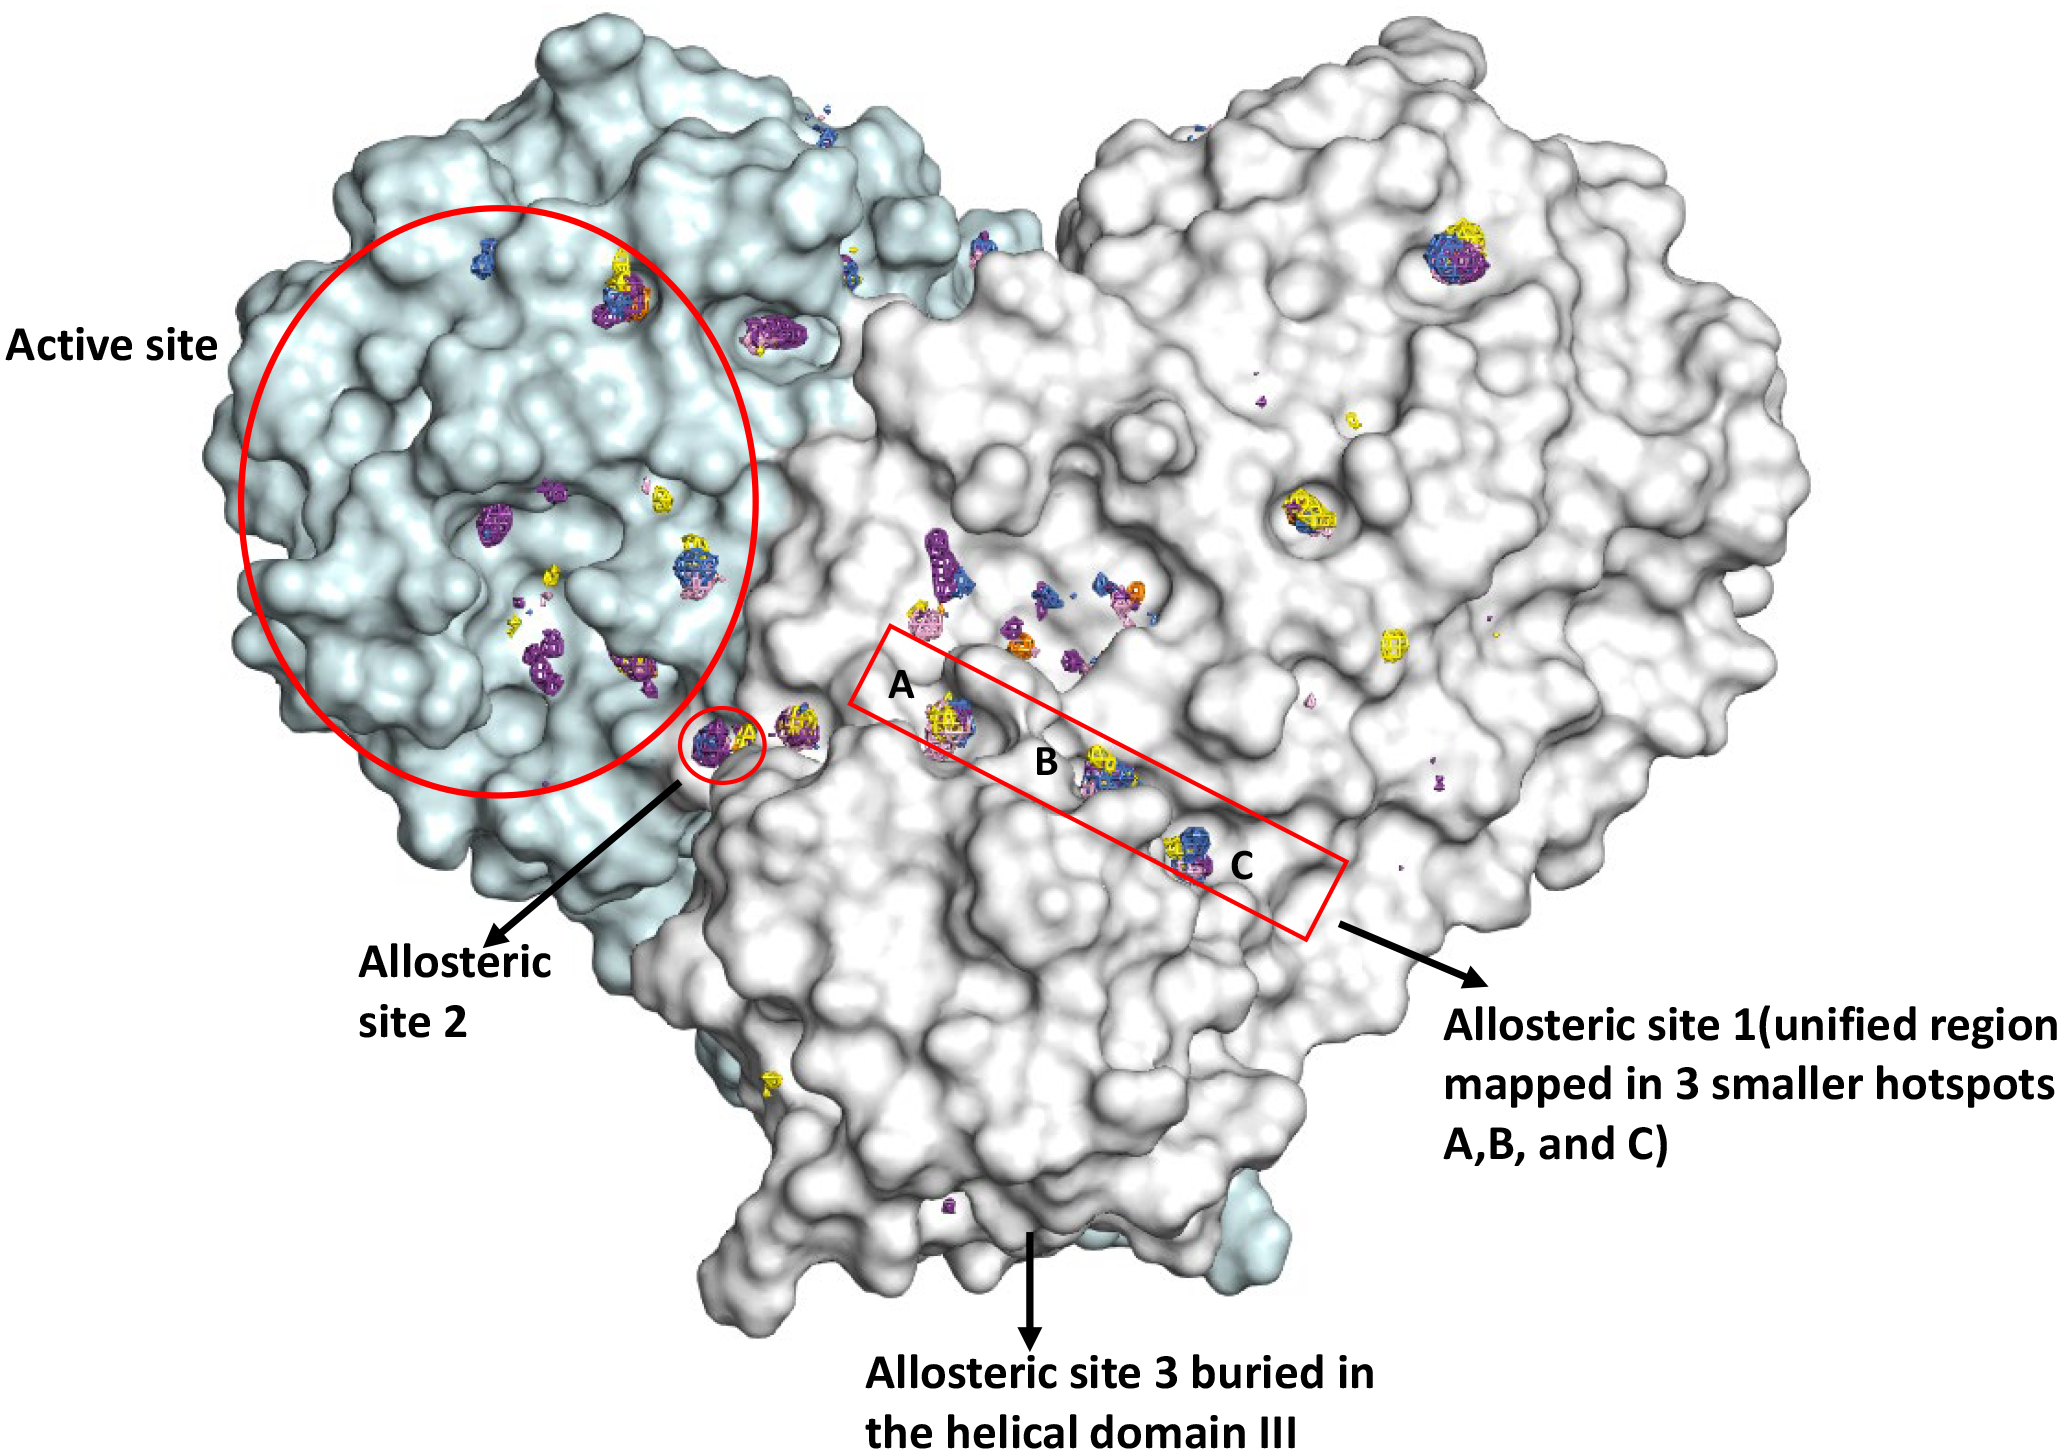
The Mpro dimer structure is shown in surface topology, with sites mapped via MixMD (Z=30) using neutral probes (ACN-orange, IPA-blue, PYR-purple, IMI-black, MAC-yellow, and EOH-warmpink). The active site and allosteric sites probed in this work are outlined in red.
Figure 2.
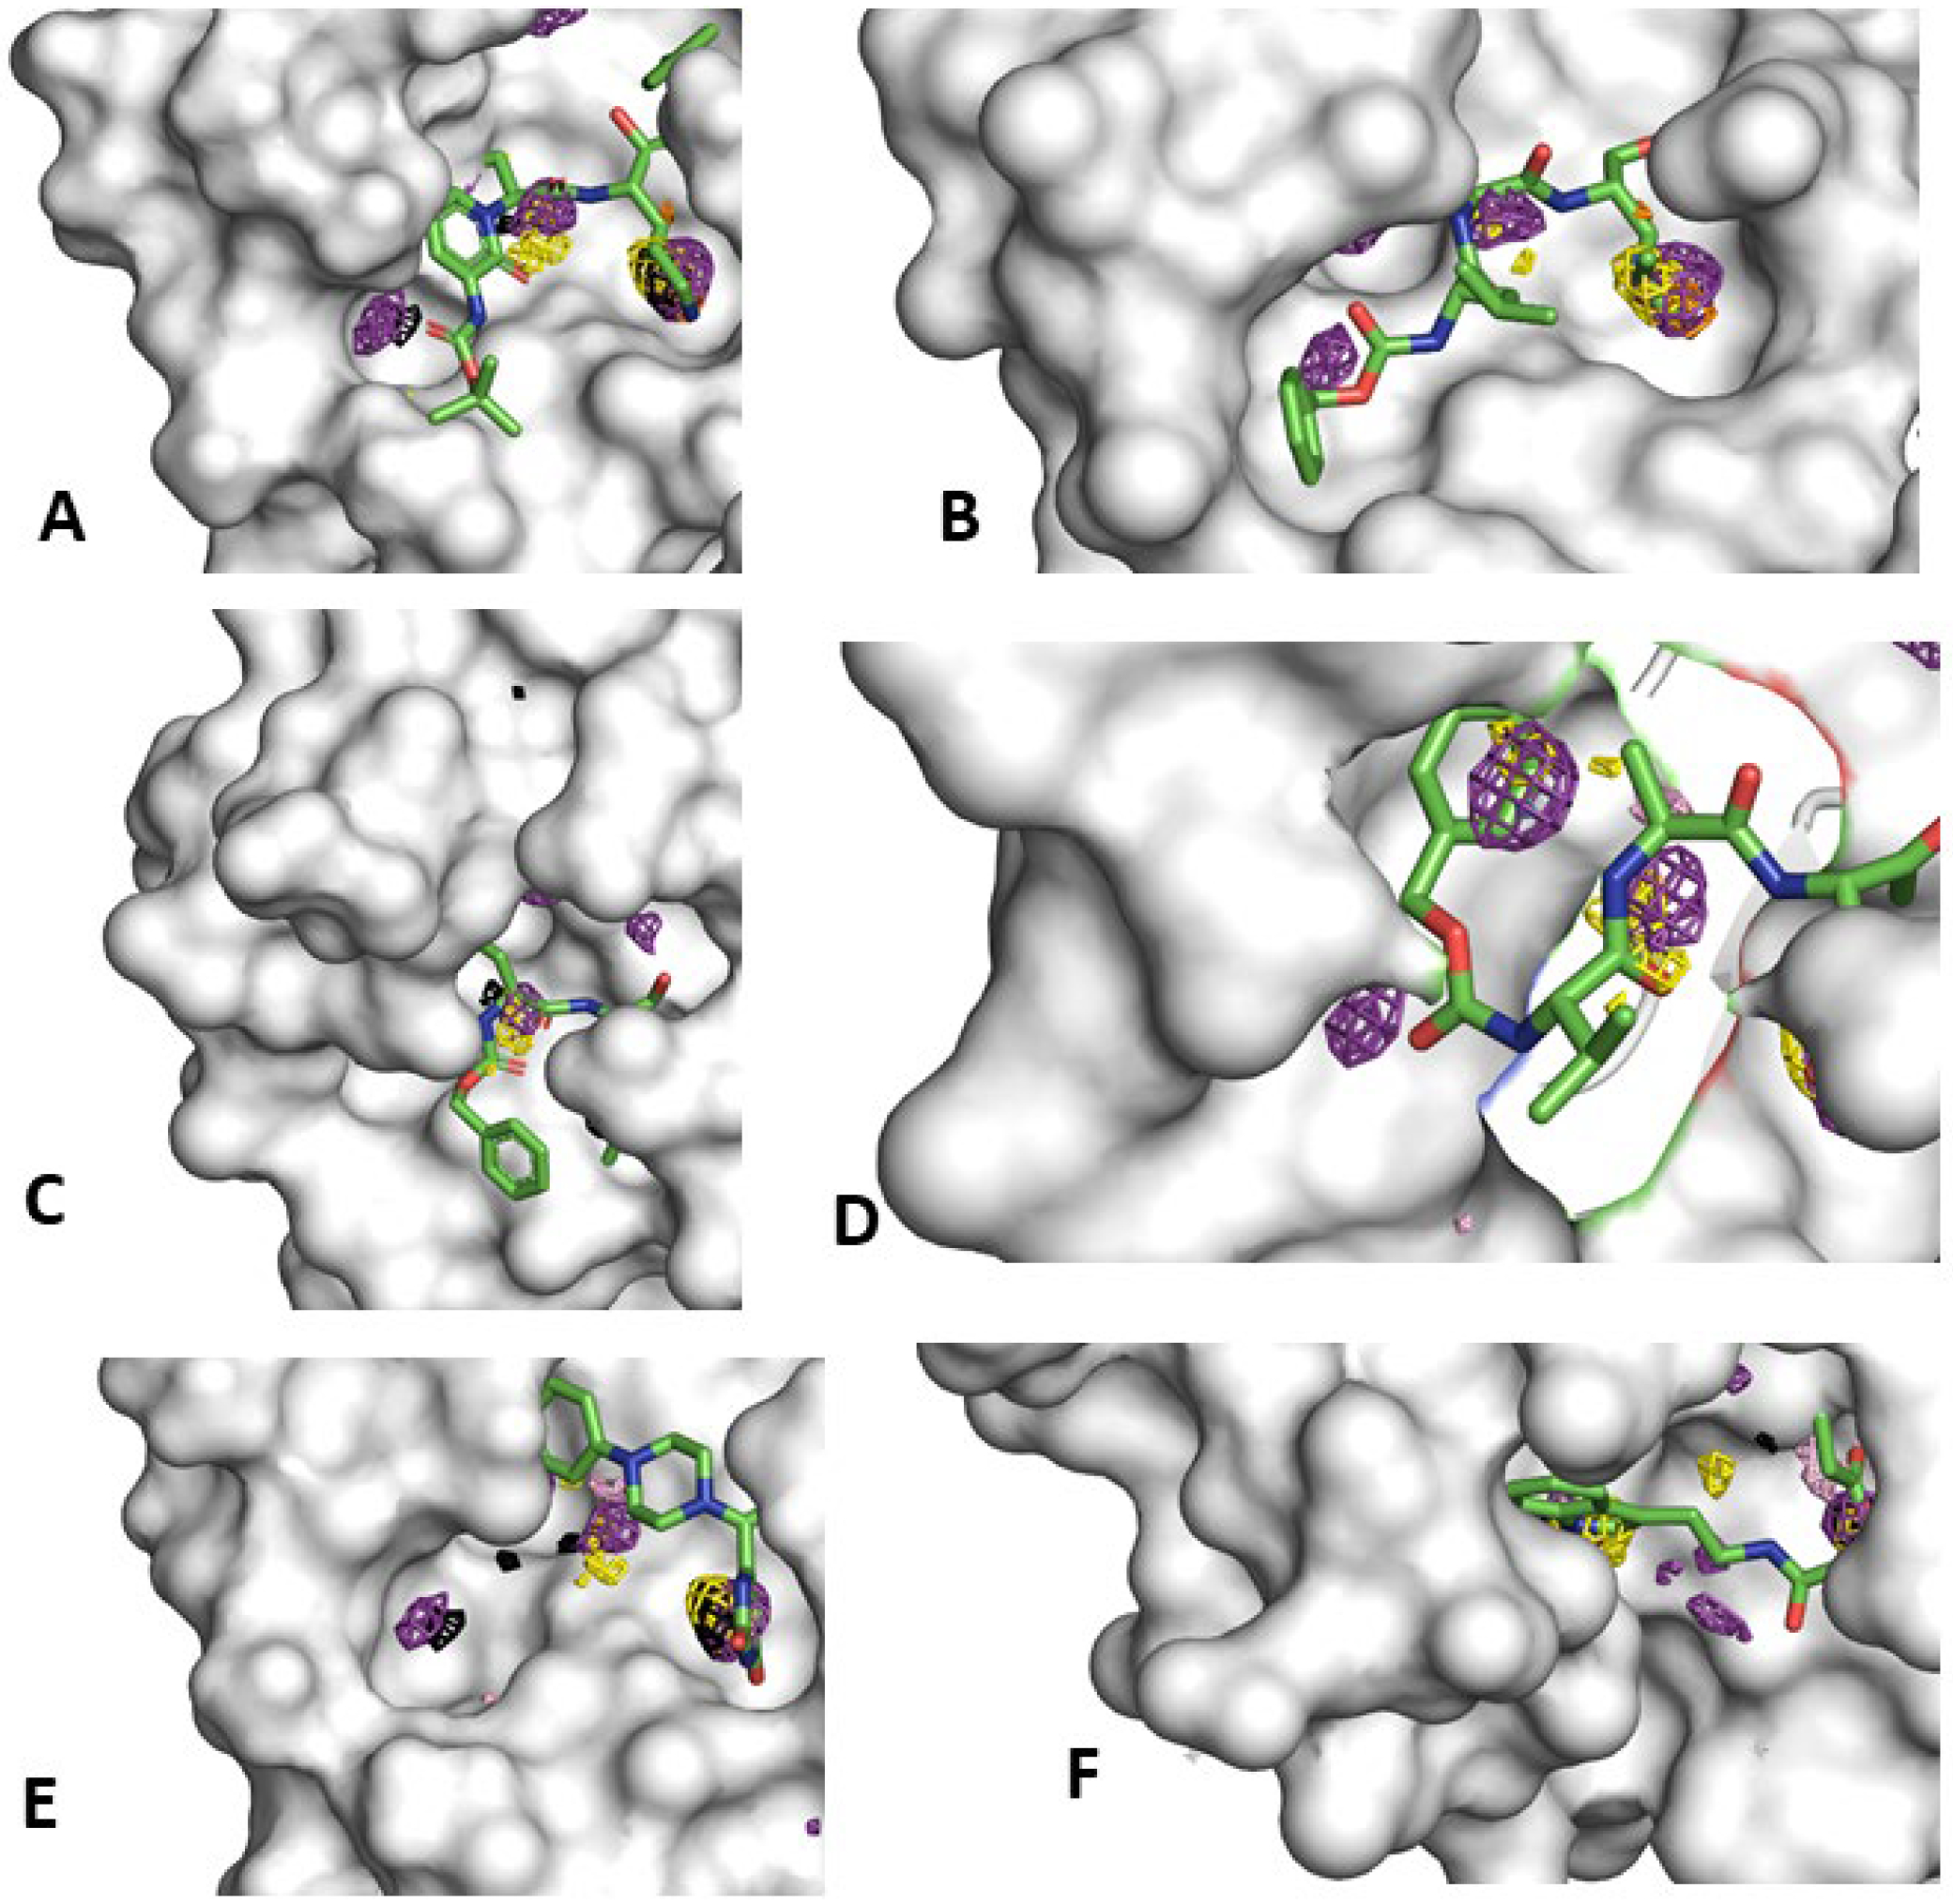
The catalytic site of Mpro mapped using neutral probes (ACN-orange, IPA-blue, PYR-purple, IMI-black, MAC-yellow, and EOH-warmpink) as seen in these 6 crystal structures; the solvent densities are represented in isomesh contours and CoM mapping is depicted for all probe types. The occupancies are proportional to residence times of these probe molecules in their binding sites PDB IDs (A) 6Y2G, (B) 7CUU, (C) 7AKU, (D) 7CUT, (E) 7N8C, and (F) 7NT1.
Normal Mode Analysis of Predicted Hotspots
Overall, 6 potential allosteric sites were identified using Probeview at Z=35.24 Five of these sites were present on both monomers, while one lay in an interface between the monomers (Site 6). However, it was unclear which of these predicted sites were allosteric sites. It has been shown that allosteric modulators alter protein flexibility, and this can be used to identify the majority of known allosteric sites without a priori knowledge, using NMA with octahedron pseudo-ligands.25 Therefore, we adapted this method to our study. Octahedral pseudo-ligands were manually placed into populated hotspots that were present in each of the predicted allosteric sites, and NMA was conducted with both the unbound (apo) and unbound (holo) states (Figures S1 - S7). Out of the 6 sites, placement of the octahedron pseudo-ligands into Sites 1–4 were found to have a significant effect on protein flexibility (Figures S2 – S5). Subsequent to the identification of our MixMD hotspots and proposed allosteric sites, a study was published34 that identified two molecules that bound outside the active site on the SARS-CoV-2 Mpro; their sites correspond to our Sites 1 and 2. Site 1A and 1B by themselves did not have significant effects on the NMA, but Sites 1A, 1B, and 1C together appeared to form a contiguous cleft along the surface of the protein (with hotspots within 3 Å of one another), so we combined them together and found from NMA that the effect on protein flexibility was extremely significant (Figure S2). Site 4 had a significant p-value of 0.017, however it was not considered for further study. The site occupies the back side of the catalytic site, and there are several common residues between this site and the active site itself, which we are probing directly in this study. We proceeded to perform molecular docking on Site 1, Site 2, and Site 3 while also using the catalytic site as a “counter screen.” We should note that cross-correlation analysis of MixMD simulations showed positive correlations between the active site and residues in Sites 1, 2, and 3 with a preference seen for different probes.
Analysis of Docking Results
We performed four sets of docking simulations: one to each of the predicted allosteric sites and the catalytic site of Mpro. We note that the scoring function that gives the best poses does not always rank-order hits in the best fashion. Also, we needed a means of comparing the poses from GOLD and Autodock Vina. Hence, we chose to rescore all the poses using a more precise scoring function to rank the best poses from docking. In this pursuit, we rescored the top poses from GOLD30 and AutoDock Vina31 using MDock’s ITScore function33 because it has been rated highly in the CSAR Benchmark Excersises32, 35, 36 and the D3R Grand Challenges.37 The vast majority of the compounds docked preferentially to the substrate-binding site of Mpro. Out of a total of 361 docked compounds, 234 preferred the active site using MDock scores.33 For the potential allosteric sites, 23 actives preferred to dock to site 1; 30 docked to site2, and 13 preferred allosteric site3. The MDock32, 33 scores for each of the 361 entries that docked is also provided in the supplementary information as an Excel sheet (NCATS_data.xlsx). The snapshot of the top-15 hits in allosteric sites 1 and 2 and the top-13 hits of site 3 are illustrated in Figure 3. It should be noted that 61 ligands (17%) were ambiguous in their binding, having more than one receptor with scores within ±1 ITScore unit.
Figure 3.
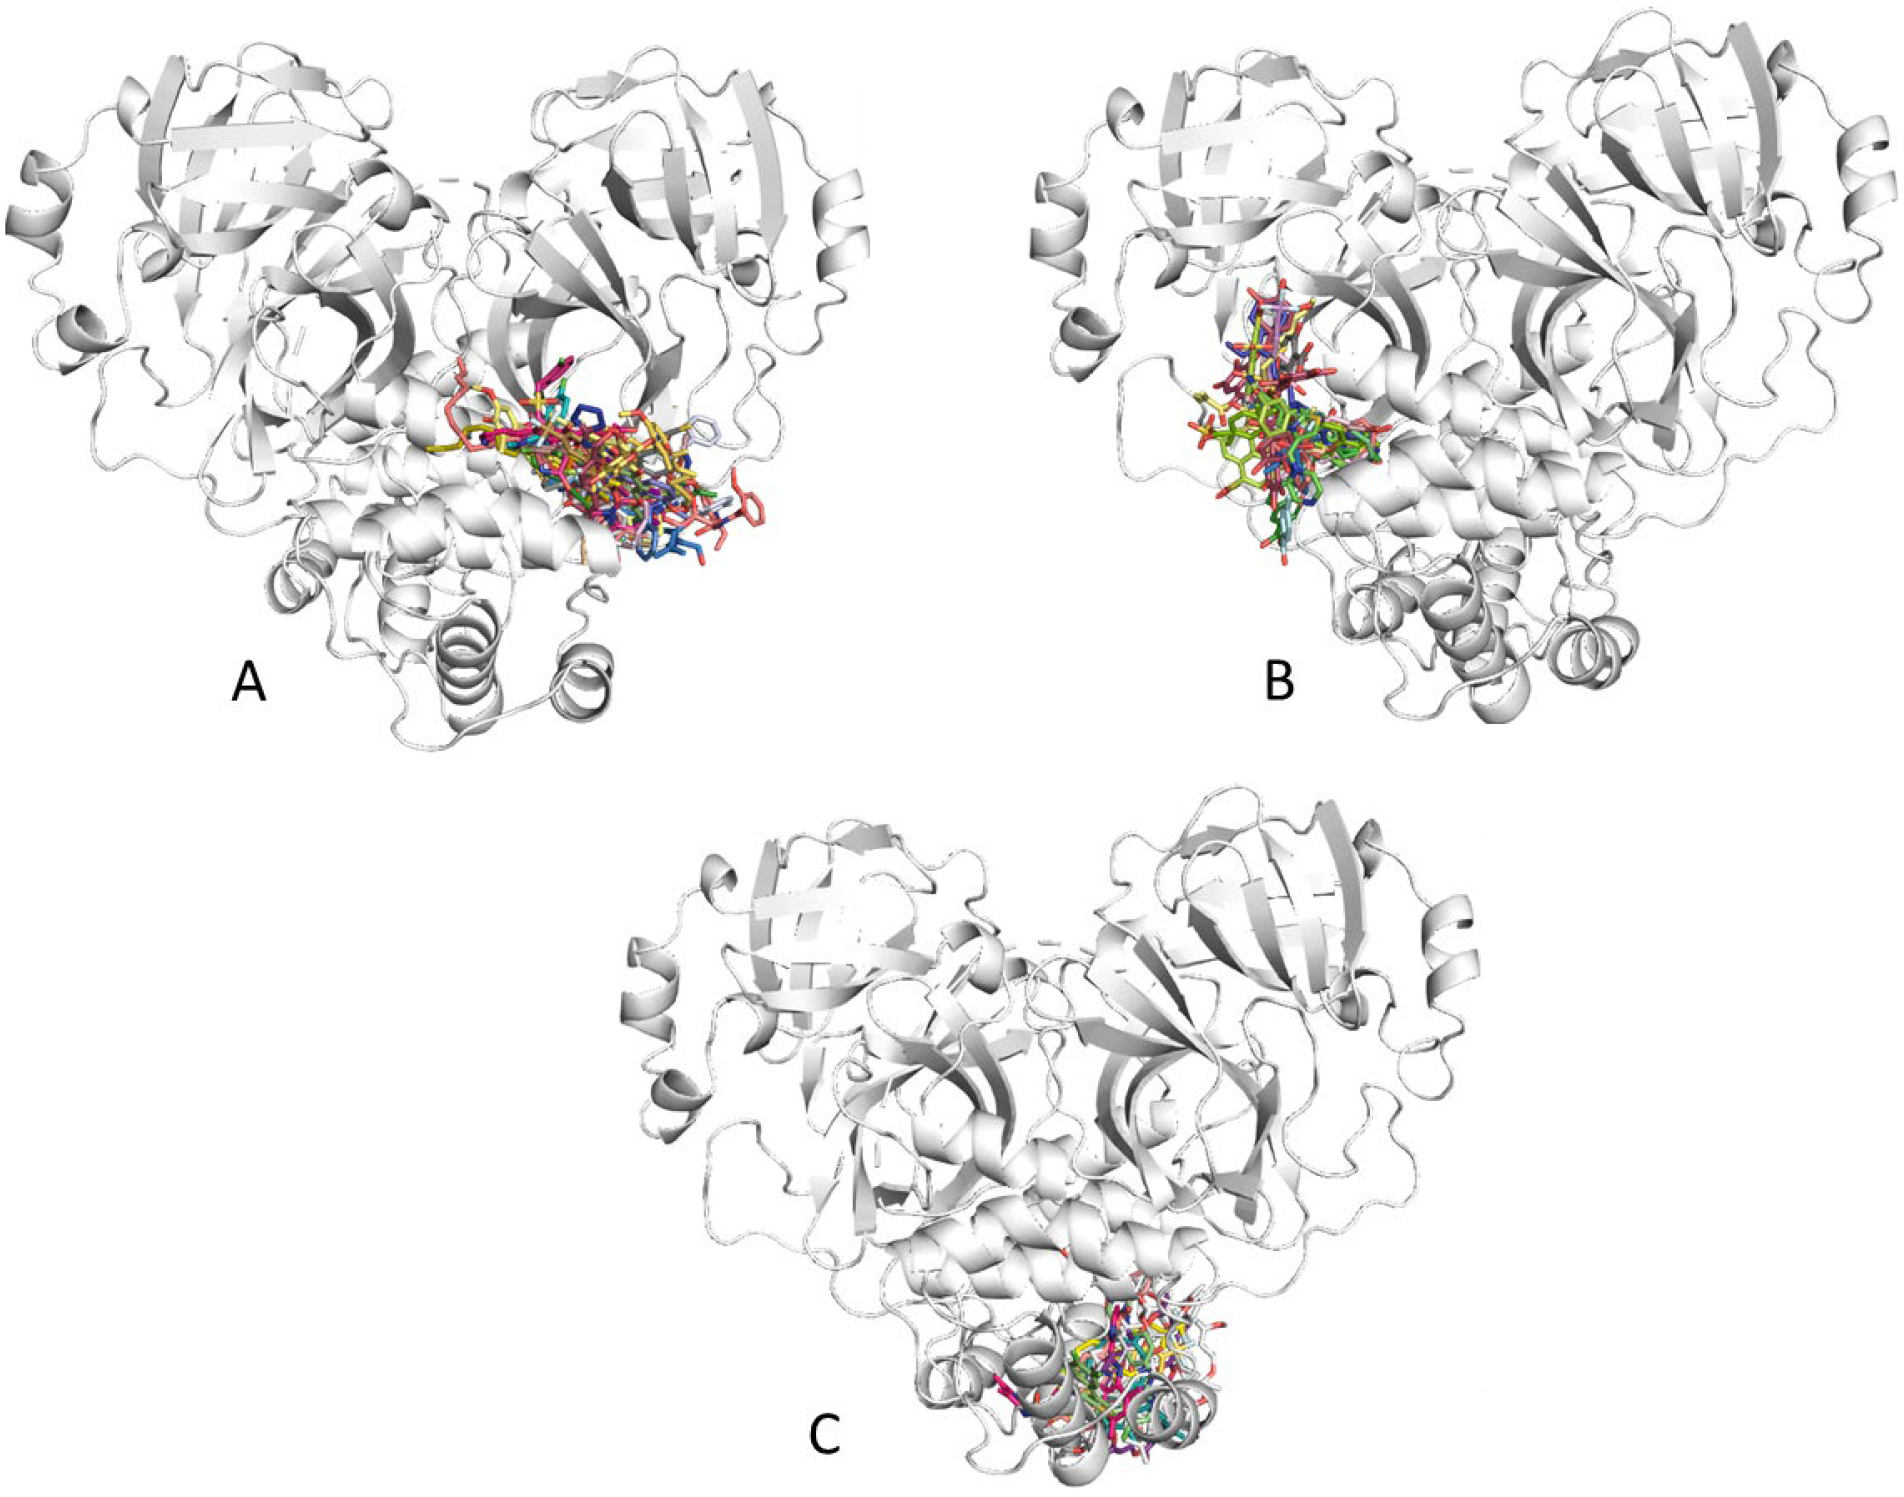
Docked poses of the top-15 candidates for allosteric sites 1(A) and 2(B) and the top-13 candidates for site 3(C).
Other Simulations That Support Our Analyses
During our analyses, other research groups have published on potential allosteric and cryptic sites of the Mpro, due to the urgent need of the hour. Bhatt and coworkers have used long-scale MD simulations to probe three potential allosteric sites on Mpro.38 Their pocket three aligns perfectly with our Site1 mapped through MixMD simulations. It has an abundance of hydrophobic residues Pro-108, Ile-249, Phe-294, Val-227, Ile-249, Gln-100, and Val 202. In a very recent publication, McCammon and coworkers have elucidated cryptic and allosteric pockets on the CoV-2 Mpro using Gaussian-accelerated MD simulations.39 They further tested the potential druggability of the pockets discovered through PockDrug server40, which scores the pockets identified, based on hydrophobicity, geometry, pocket volume, and aromaticity. The large distal pocket they identify as a potential druggable site aligns closely to the Site-3 we have probed in our analysis. Stromich et al. has investigated on four putative allosteric sites on the Mpro and their “sites 2 and 3” matches crudely to our Site 3 mapping.41 (The sites 2 and 3 in their work are within 4 Å of Site 3 in our work). A combination of bond-to-bond propensities and Markov Transient Analysis were useful in detecting potential allostery.
Verifying stability of bound ligands via MD simulations
To probe the stability of ligands in our proposed allosteric sites, we ran 1-μs conventional MD simulations (NTP ensemble) on the top-ranked ligand for each of our sites. The RMSDs of the ligands are plotted in Figure S11–S13 (Site1, Site2, and Site 3). The protein backbone RMS fluctuations are also plotted in Figure S14 (A–C). The ligands adjust their bound conformation during equilibration (as expected, with larger relaxation for the very large ligands in Sites 1 and 3). They remain stablely bound in those conformations throughout the production phase.
Subsequent X-Ray Structures Also Lend Support to Our Findings
Several crystal structures were released after our MixMD simulations were over and our sites defined (i.e, during the docking calculations and writing of this paper). Haider and coworkers data-mined over 271 Mpro crystal structures to compare the diverse binding sites on the protease.42 The analysis revealed 22 binding sites on Mpro, which lends support to the many hotspots mapped in Figure 1. To test the robustness of MixMD methodology to probe new sites, we compared the 19 sites characterized to the MixMD hotspots we obtained for the Mpro structure. MixMD is successfully able to map 12 out of the total 22 sites, and 8 out of those 14 sites are mapped at higher Z values ~50. It is very interesting to note that Haider and coworkers’ sites N and Q align perfectly with our reported Site 1 (Figure 4 and Figure 5), and site P overlays perfectly with our allosteric Site 3 reported in this paper (Figure 6). We parsed through 425 crystal structures deposited for the Mpro using data from Cov3D database43 created exclusively for SARS-Cov2 structures. Allosteric site 2 detected through our analysis appears elusive and there are no ligands reported to have crystallized exactly in that pocket, though a variety of ligands have been crystallized within 3–4 Å distance cutoff of Site 2 (Figure 7 and Figure 8).
Figure 4.
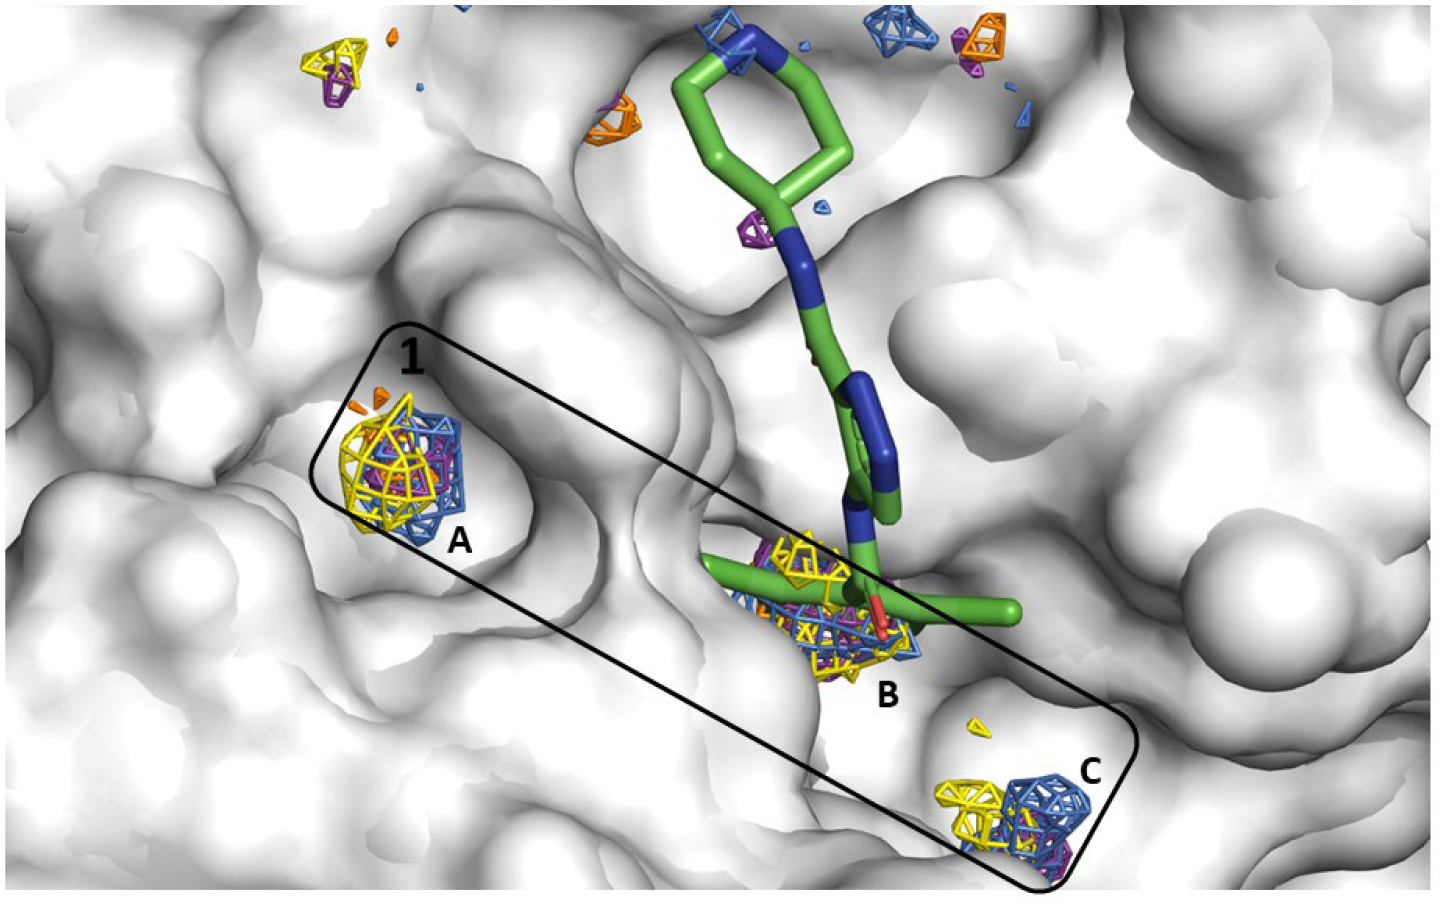
Allosteric Site 1 mapped by our neutral probes visualized as CoM grids (ACN-orange, IPA-blue, PYR-purple, IMI-black, MAC-yellow, and EOH-warmpink); ligand AT7519 in crystal structure 7AGA is overlaid to show agreement.
Figure 5.
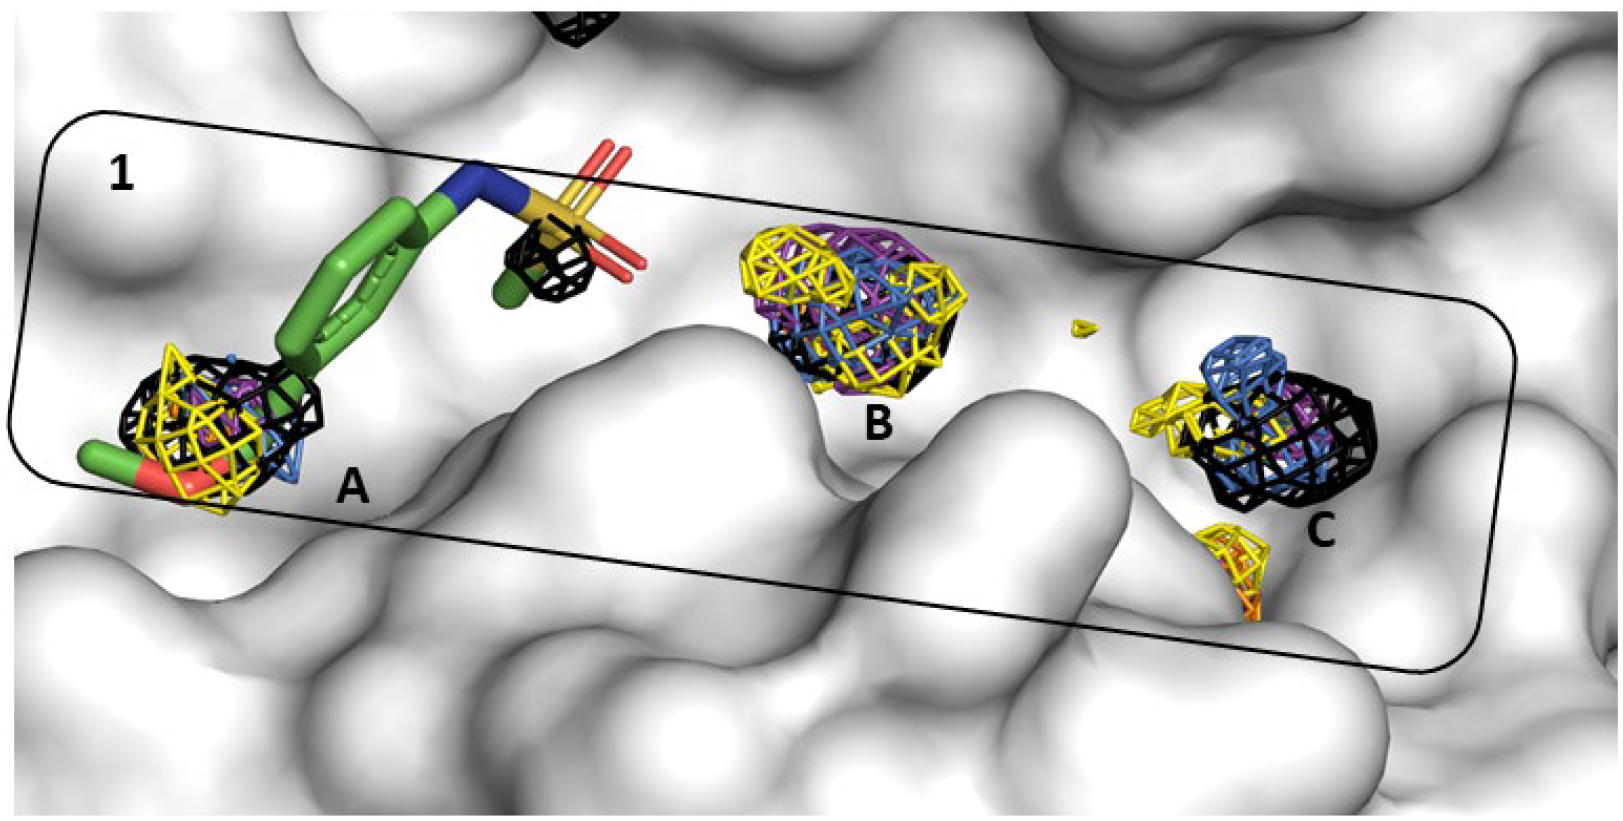
Allosteric Site 1 mapped by neutral probes visualized as CoM grids (ACN-orange, IPA-blue, PYR-purple, IMI-black, MAC-yellow, and EOH-warmpink); ligand Z24758179 in crystal structure 5REF is overlaid to show agreement.
Figure 6.
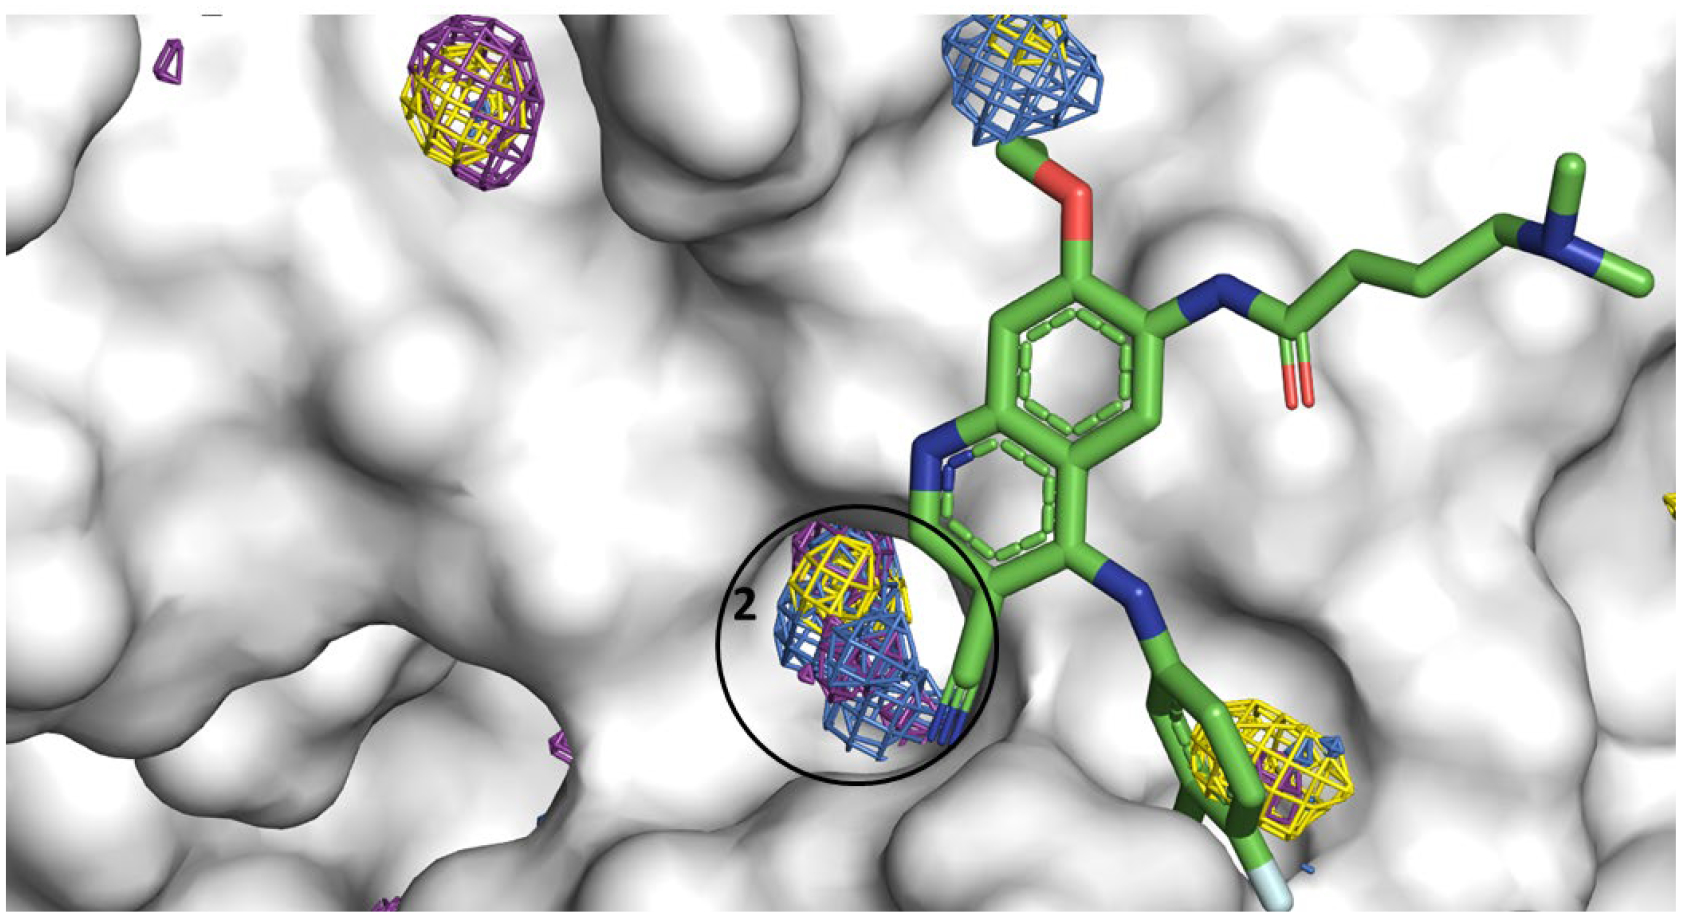
Allosteric Site 2 mapped by neutral probes visualized as CoM grids (ACN-orange, IPA-blue, PYR-purple, IMI-black, MAC-yellow, and EOH-warmpink); ligand pelitinib in crystal structure 7AXM is overlaid to show agreement. The ligand’s cyano side chain is <3Å from allosteric Site 2; the chloro flurophenyl substituent in pelitinib points directly towards allosteric site 1 in the cavity.
Figure 7.
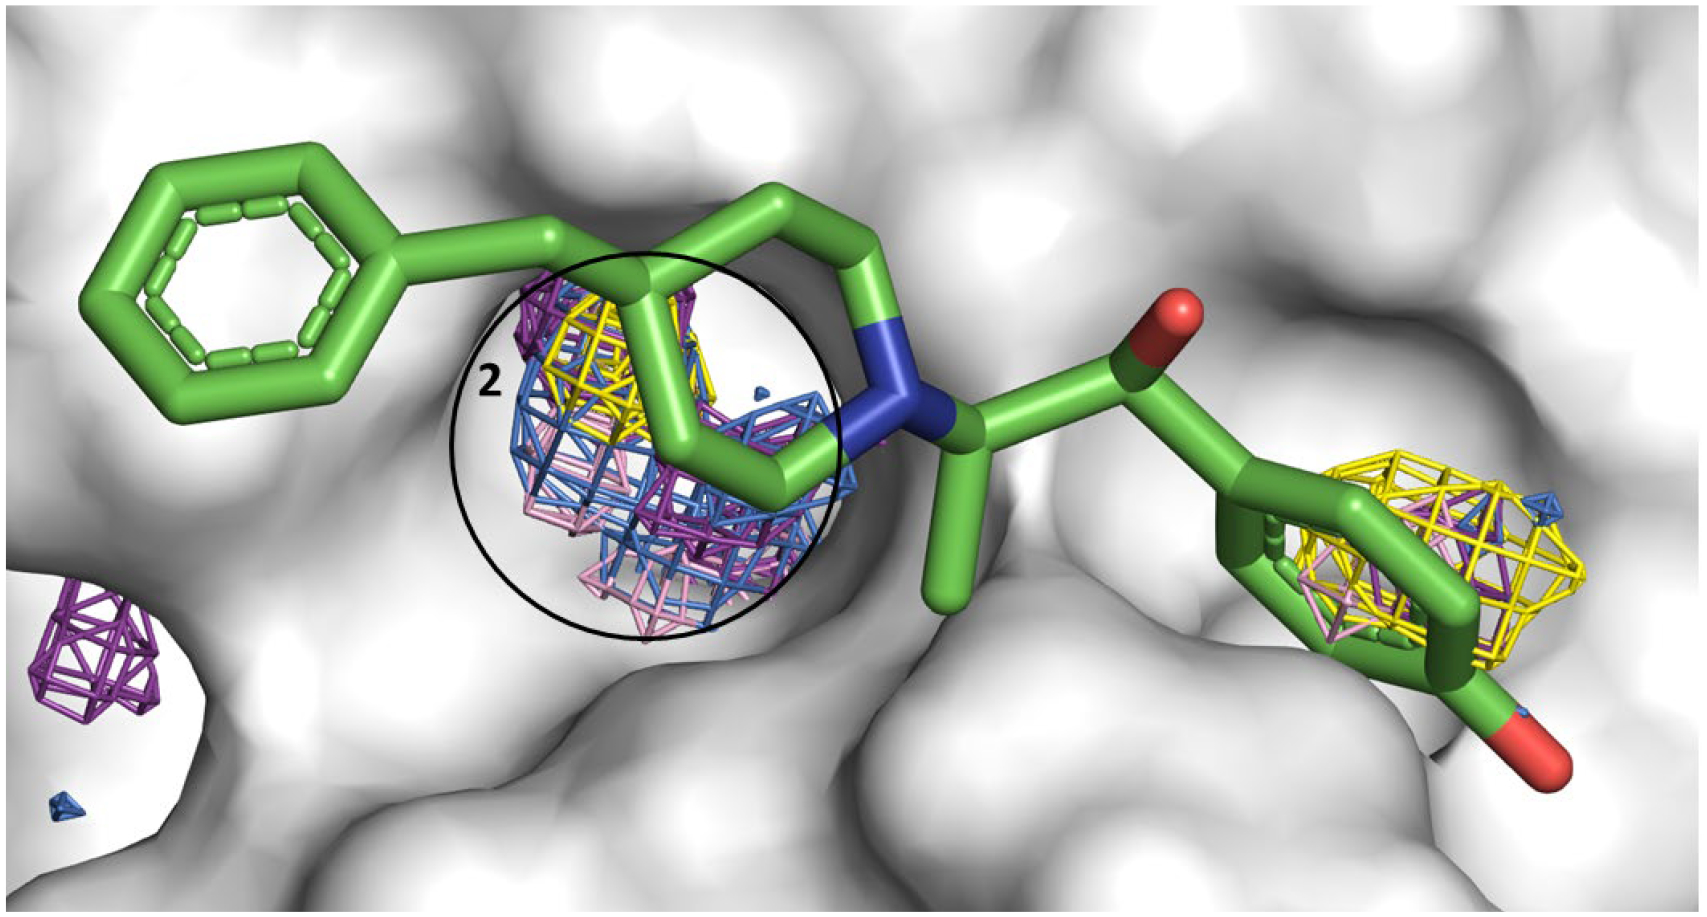
Allosteric Site 2 mapped by neutral probes visualized as CoM grids (ACN-orange, IPA-blue, PYR-purple, IMI-black, MAC-yellow, and EOH-warmpink); ligand Ifenprodil in crystal structure 7AQI is overlaid to show agreement.
Figure 8.
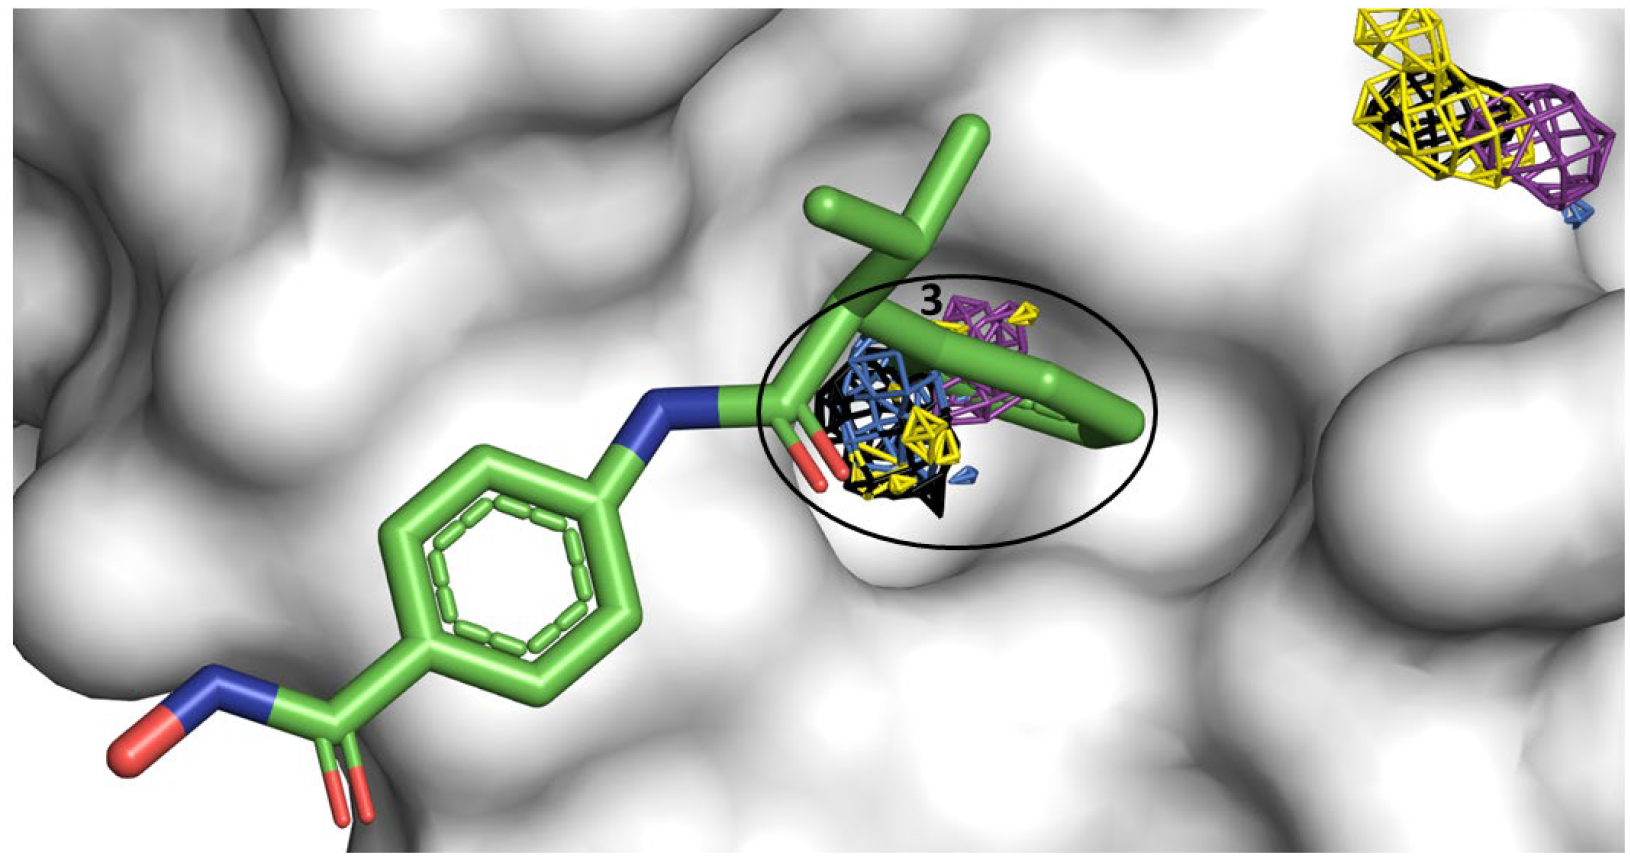
Allosteric Site 3 mapped by neutral probes visualized as CoM grids (ACN-orange, IPA-blue, PYR-purple, IMI-black, MAC-yellow, and EOH-warmpink); ligand AR-42 in crystal structure 7AXO is overlaid to show agreement.
Subsequent to our analysis on Mpro, a huge crystallographic screen of Mpro against two repurposing libraries (containing 5953 compounds from the Fraunhofer IME Repurposing Collection and the Safe-in-man library) from Günther et al. obtained 43 crystal structures of various ligands bound to Mpro.34 Similar to our docking analysis, they also found the vast majority of their hits were in the active site of the receptor, having a combination of covalent and non-covalent binders. The most fascinating part of the analyses was they discovered two allosteric sites on Mpro and they align quite well with our proposed Site 1 (Figure 3, PDB ID 7AGA). Their second allosteric site is also in the near vicinity (<4 Å) of our proposed Site 2 (Figure 5 PDB ID 7AXM and Figure 6 PDB ID 7AQI). They also find a ligand bound to our allosteric Site 3 (Figure 7). This work reinforces the fact that MixMD indeed is capable at mapping challenging targets with a good rate of confirmation.
We propose that these molecules could be optimized further in medicinal chemistry campaigns to fine tune their binding affinities to the proposed sites, thereby achieving more selectivity. There has been a huge surge in COVID-19 related computational research to optimize leads that could be purposed to clinical trials38, 39, 43–51, but this is the probably a first attempt to dissect the docking dataset to tease out chemical substructures or descriptors that could be refined and repurposed for allosteric development. The allosteric sites proposed in the paper have crystal structure data to show that they could be druggable34.
A visual inspection of the bound ligand pelitinib in PDB ID 7AXM34 shows that it has a wide array of structural features that could be possibly exploited for lead optimization. The flurophenyl ring in the ligand orients towards the shallow allosteric site 1 we deciphered in MixMD simulations. The cyano functionality of the quinolone ring in pelitinib is in very close vicinity of allosteric site 2. We propose that medicinal chemistry campaigns could take advantage of the fact that the ligands tofogliflozin and ifenprodil (in 7APH and 7AQI)34 have aromatic rings that point toward the allosteric site 1. The ligand RS102895 bound in 7ABU has a triflouro-methyl- phenyl functionality that maps our site 1 (Figure 9). These case studies could serve as rudimentary examples to grow a fragment connecting all the subsites mapped via MixMD. The aromatic rings of pelitinib and tofogliflozin form key interactions with a hydrophobic pocket lined by Ile213, Leu253, Gln256, Val297, and Cys300. Furthermore, 7AGA is interesting from a design perspective as the allosteric ligand AT7519 is present at the interface of the catalytic domain and the helical domain III region and could be investigated further for design of new antiviral compounds against Mpro.34
Figure 9.
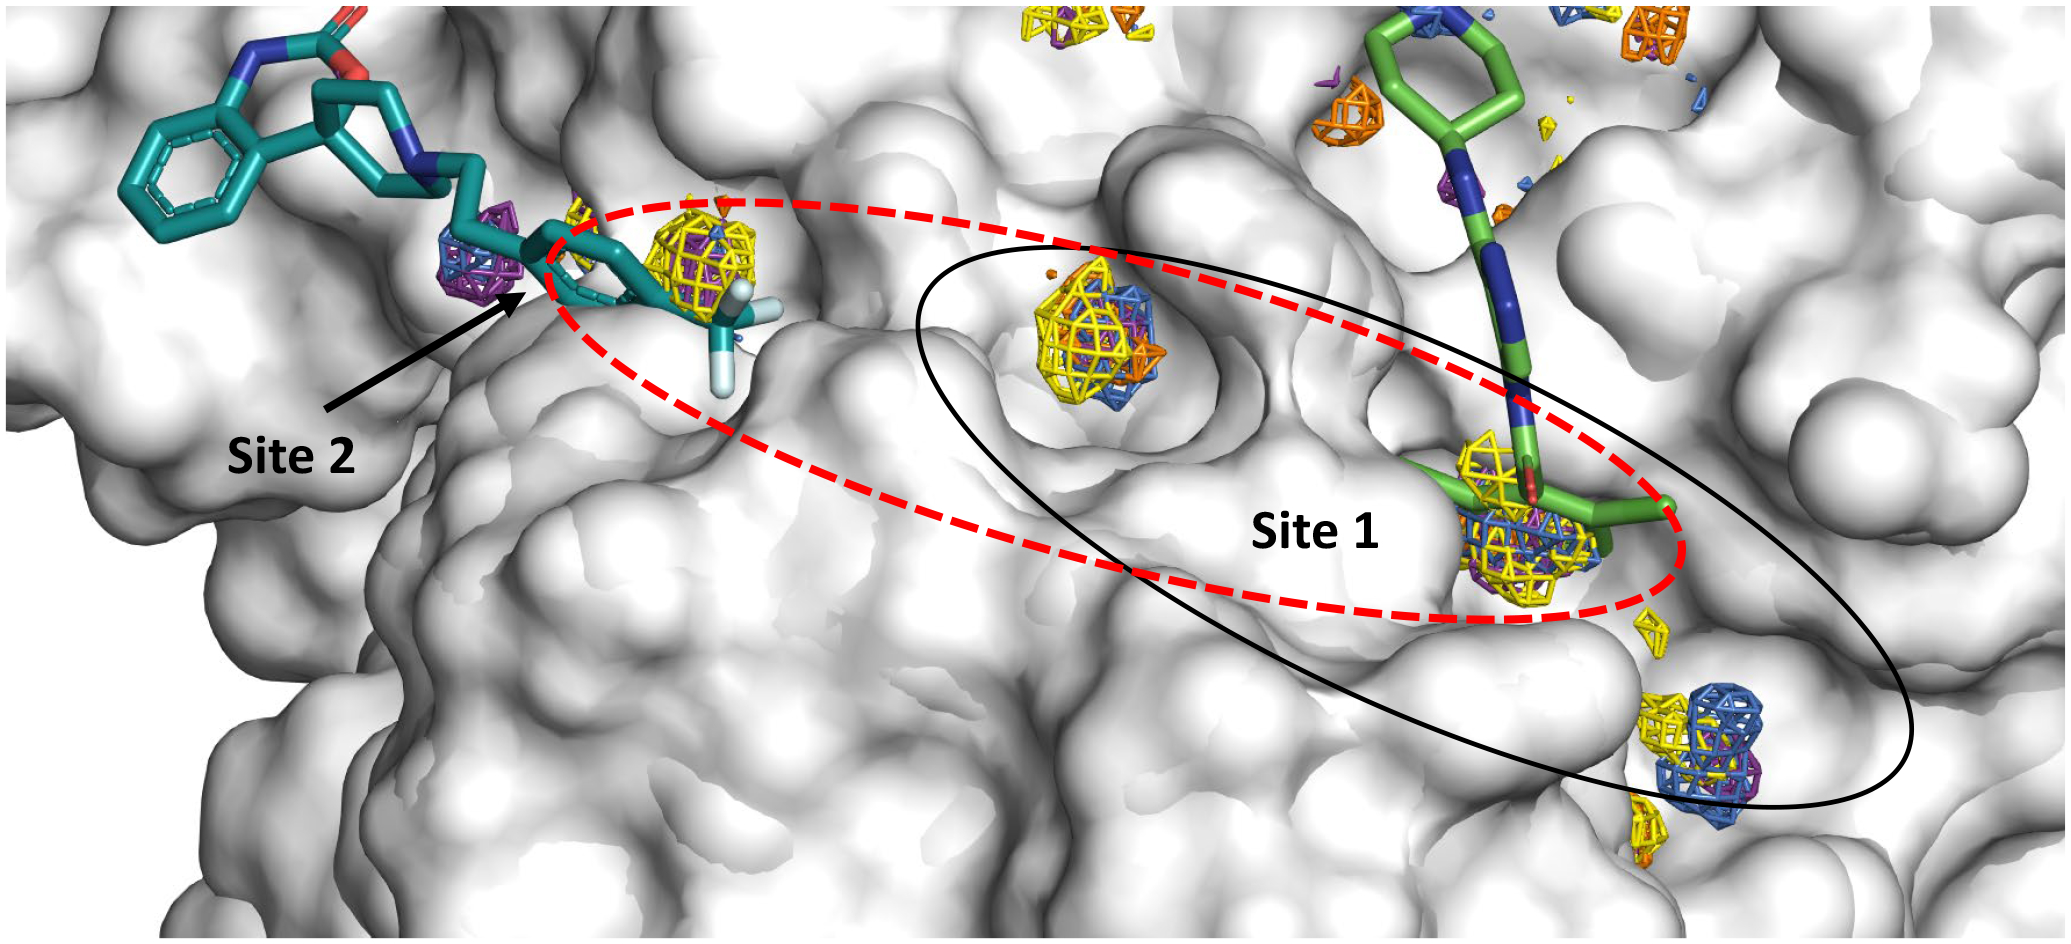
Ligands bound to PDB IDs 7AGA (right side) and 7ABU (left side) show space for linking chemistry (region in red dashed lines), where the two compounds could be optimized and linked through a calculated hotspot.
Conclusions
MixMD was successful in mapping several important hotspots on the Mpro. The active site was mapped at Z=70 and 11 other sites at Z=30 level contours. The NMA narrowed down the search analyzing the change in motions, from several potential hotspots to three sites which showed potential allosteric control. These sites were also analyzed by MD where dynamic correlations were found between active-site residues and residues in our proposed sites. Subsequent structural data lent support for the allosteric sites we predicted. Targeting these potential allosteric sites could be crucial to identify antiviral inhibitors for the SARS-Cov2 Mpro. Docking calculations on the active compounds from the NCATS dataset further demonstrate that certain known inhibitors for Mpro have a stronger propensity for Sites1, 2, and 3 versus the active site. Data from subsequent crystal structures have been used to show how some of these sites and hotspots are likely to be druggable and could be modified in structure-based drug discovery.
Supplementary Material
ACKNOWLEDGMENT
We thank NCATS for the availability of the screening data. The authors thank Prof. William L. Jorgensen and Dr. Julian Tirado-Rives for alerting us to the screening data. We thank Victor F. Rivera-Santana for preliminary simulations of the monomer of the Mpro system, and we thank Dr. Richard Smith and Dr. Pancham Lal Gupta in helping to analyze data for this project. This work has been supported by the National Institutes of Health (R01 GM065372).
ABBREVIATIONS
- 3CLpro
main protease of Sars-CoV-2
- ACN
acetonitrile
- CoM
Center of Mass
- EOH
ethanol
- IMI
imidazole
- IPA
isopropanol
- MD
Molecular Dynamics
- MixMD
Mixed-solvent molecular dynamics
- Mpro
main protease of Sars-CoV-2
- NCATS
National Center for Advancing Translational Sciences
- NMA
Normal Mode Analysis
- MAC
N-methyl acetamide
- PYR
pyrimidine
Footnotes
Supporting Information
The Supporting Information is available free of charge at https://pubs.acs.org/doi/
NMA on all 6 sites illustrated in Figures S1–S7. Figures S8–S10 show the DCCM plots for MixMD trajectories of Mpro. The stability of the allosteric ligands probed in the 1-μs, bound MD simulations are plotted as a function of time shown in Figures S11–S13. The protein backbone RMSD is plotted in Figure S14. All the MDock ITScore scores for the 361 dockable compounds analyzed are provided as an Excel sheet named NCATS_data.xlsx.
The authors declare no financial competing interest.
Data and Software Availability
The starting structure for Mpro was available from the Protein Data Bank (PDB ID 7ALI).9 All software used in this work are published and publically available: MOE2019,10 Molprobity server,11 H++ server,12 AMBER2014 with the grid command in Cpptraj (version V5.0.5 (GitHub))22 from AmberTools, MixMD Probeview,24 Bio3D package (version 2.4–1),26, 27 GOLD v5.8,30 Autodock Vina,31 and MDock.32, 33
REFERENCES
- 1.Zhang YZ; Holmes EC, A Genomic Perspective on the Origin and Emergence of SARS-CoV-2. Cell 2020, 181, 223–227. [DOI] [PMC free article] [PubMed] [Google Scholar]
- 2.Jin Z; Du X; Xu Y; Deng Y; Liu M; Zhao Y; Zhang B; Li X; Zhang L; Peng C; Duan Y; Yu J; Wang L; Yang K; Liu F; Jiang R; Yang X; You T; Liu X; Yang X; Bai F; Liu H; Liu X; Guddat LW; Xu W; Xiao G; Qin C; Shi Z; Jiang H; Rao Z; Yang H, Structure of M(pro) from SARS-CoV-2 and discovery of its inhibitors. Nature 2020, 582, 289–293. [DOI] [PubMed] [Google Scholar]
- 3.Zhang L; Lin D; Sun X; Curth U; Drosten C; Sauerhering L; Becker S; Rox K; Hilgenfeld R, Crystal structure of SARS-CoV-2 main protease provides a basis for design of improved α-ketoamide inhibitors. Science 2020, 368, 409–412. [DOI] [PMC free article] [PubMed] [Google Scholar]
- 4.Ghanakota P; Carlson HA, Moving Beyond Active-Site Detection: MixMD Applied to Allosteric Systems. J Phys Chem B 2016, 120, 8685–95. [DOI] [PMC free article] [PubMed] [Google Scholar]
- 5.Ghanakota P; DasGupta D; Carlson HA, Free Energies and Entropies of Binding Sites Identified by MixMD Cosolvent Simulations. J Chem Inf Model 2019, 59, 2035–2045. [DOI] [PMC free article] [PubMed] [Google Scholar]
- 6.Ung PM; Ghanakota P; Graham SE; Lexa KW; Carlson HA, Identifying binding hot spots on protein surfaces by mixed-solvent molecular dynamics: HIV-1 protease as a test case. Biopolymers 2016, 105, 21–34. [DOI] [PMC free article] [PubMed] [Google Scholar]
- 7.Ghanakota P; van Vlijmen H; Sherman W; Beuming T, Large-Scale Validation of Mixed-Solvent Simulations to Assess Hotspots at Protein-Protein Interaction Interfaces. J Chem Inf Model 2018, 58, 784–793. [DOI] [PubMed] [Google Scholar]
- 8.Smith RD; Carlson HA, Identification of Cryptic Binding Sites Using MixMD with Standard and Accelerated Molecular Dynamics. J Chem Inf Model 2021, 61, 1287–1299. [DOI] [PMC free article] [PubMed] [Google Scholar]
- 9.Costanzi E, Demitri N, Giabbai B, Heroux A, Storici P, Crystal structure of the main protease (3CLpro/Mpro) of SARS-CoV-2 at 1.65A resolution (spacegroup P2(1)). 2021.
- 10.Molecular Operating Environment (MOE), 2019.01; Chemical Computing Group ULC, 1010 Sherbooke St. West, Suite #910, Montreal, QC, Canada, H3A 2R7, 2021.
- 11.Williams CJ; Headd JJ; Moriarty NW; Prisant MG; Videau LL; Deis LN; Verma V; Keedy DA; Hintze BJ; Chen VB; Jain S; Lewis SM; Arendall WB 3rd; Snoeyink J; Adams PD; Lovell SC; Richardson JS; Richardson DC, MolProbity: More and better reference data for improved all-atom structure validation. Protein Sci 2018, 27, 293–315. [DOI] [PMC free article] [PubMed] [Google Scholar]
- 12.Gordon JC; Myers JB; Folta T; Shoja V; Heath LS; Onufriev A, H++: a server for estimating pKas and adding missing hydrogens to macromolecules. Nucleic Acids Res 2005, 33, W368–71. [DOI] [PMC free article] [PubMed] [Google Scholar]
- 13.Jorgensen WLCJ; Madura JD; Impey RW; Klein ML, Comparison of simple potential functions for simulating liquid water. Journal of Chemical Physics 1983, 79, 926–935. [Google Scholar]
- 14.Case DA; Belfon K; Ben-Shalom IY; Brozell SR; Cerutti DS; Cheatham TE, I.; Cruzeiro VWD; Darden TA; Duke RE; Giambasu G; Gilson MK; Gohlke H; Goetz AW; Harris R; Izadi S; Izmailov SA; Kasavajhala K; Kovalenko A; Krasny R; Kurtzman T; Lee TS; LeGrand S; Li P; Lin C; Liu J; Luchko T; Luo R; Man V; Merz KM; Miao Y; Mikhailovskii O; Monard G; Nguyen H; Onufriev A; Pan F; Pantano S; Qi R; Roe DR; Roitberg A; Sagui C; Schott-Verdugo S; Shen J; Simmerling CL; Skrynnikov NR; Smith J; Swails J; Walker RC; Wang J; Wilson L; Wolf RM; Wu X; Xiong Y; Xue Y; York DM; Kollman PA, AMBER2020. 2020.
- 15.Lexa KW; Goh GB; Carlson HA, Parameter choice matters: validating probe parameters for use in mixed-solvent simulations. J Chem Inf Model 2014, 54, 2190–9. [DOI] [PMC free article] [PubMed] [Google Scholar]
- 16.Caldwell JW; Kollman PA, Structure and Properties of Neat Liquids Using Nonadditive Molecular Dynamics: Water, Methanol, and N-Methylacetamide. Journal of Physical Chemistry 1995, 99, 6208–6219. [Google Scholar]
- 17.Maier JA; Martinez C; Kasavajhala K; Wickstrom L; Hauser KE; Simmerling C, ff14SB: Improving the Accuracy of Protein Side Chain and Backbone Parameters from ff99SB. J Chem Theory Comput 2015, 11, 3696–713. [DOI] [PMC free article] [PubMed] [Google Scholar]
- 18.Salomon-Ferrer R; Götz AW; Poole D; Le Grand S; Walker RC, Routine Microsecond Molecular Dynamics Simulations with AMBER on GPUs. 2. Explicit Solvent Particle Mesh Ewald. J Chem Theory Comput 2013, 9, 3878–88. [DOI] [PubMed] [Google Scholar]
- 19.Ryckaert J-P; Ciccotti G; Berendsen HJC, Numerical integration of the Cartesian Equations of Motion of a System with Constraints: Molecular Dynamics of n-Alkanes Journal Of Computational Physics 1977, 23, 327–341. [Google Scholar]
- 20.Andersen HC, Molecular dynamics simulations at constant pressure and/or temperature. Journal of Chemical Physics 1980, 72, 2384–2393. [Google Scholar]
- 21.Berendsen HJC; Postma JP; van Gunsteren WF; DiNola A; Haak JR, Molecular dynamics with coupling to an external bath. J. Chem. Phys 1984, 81, 3684–3690. [Google Scholar]
- 22.Roe DR; Cheatham TE 3rd, PTRAJ and CPPTRAJ: Software for Processing and Analysis of Molecular Dynamics Trajectory Data. J Chem Theory Comput 2013, 9, 3084–95. [DOI] [PubMed] [Google Scholar]
- 23.Schrödinger The PyMol Molecular Graphics System, 1.7.4.1, 2020.
- 24.Graham SE; Leja N; Carlson HA, MixMD Probeview: Robust Binding Site Prediction from Cosolvent Simulations. J Chem Inf Model 2018, 58, 1426–1433. [DOI] [PMC free article] [PubMed] [Google Scholar]
- 25.Panjkovich A; Daura X, Exploiting protein flexibility to predict the location of allosteric sites. BMC Bioinformatics 2012, 13, 273. [DOI] [PMC free article] [PubMed] [Google Scholar]
- 26.Grant BJ; Rodrigues AP; ElSawy KM; McCammon JA; Caves LS, Bio3d: an R package for the comparative analysis of protein structures. Bioinformatics 2006, 22, 2695–6. [DOI] [PubMed] [Google Scholar]
- 27.Skjærven L; Yao XQ; Scarabelli G; Grant BJ, Integrating protein structural dynamics and evolutionary analysis with Bio3D. BMC Bioinformatics 2014, 15, 399. [DOI] [PMC free article] [PubMed] [Google Scholar]
- 28.Brimacombe KR; Zhao T; Eastman RT; Hu X; Wang K; Backus M; Baljinnyam B; Chen CZ; Chen L; Eicher T; Ferrer M; Fu Y; Gorshkov K; Guo H; Hanson QM; Itkin Z; Kales SC; Klumpp-Thomas C; Lee EM; Michael S; Mierzwa T; Patt A; Pradhan M; Renn A; Shinn P; Shrimp JH; Viraktamath A; Wilson KM; Xu M; Zakharov AV; Zhu W; Zheng W; Simeonov A; Mathe EA; Lo DC; Hall MD; Shen M, An OpenData portal to share COVID-19 drug repurposing data in real time (PMC7276055). bioRxiv 2020. [Google Scholar]
- 29.NIH Open Data Portal. https://opendata.ncats.nih.gov/covid19/assay?aid=9 (01/01/2021),
- 30.Jones G; Willett P; Glen RC; Leach AR; Taylor R, Development and validation of a genetic algorithm for flexible docking. J Mol Biol 1997, 267, 727–48. [DOI] [PubMed] [Google Scholar]
- 31.Trott O; Olson AJ, AutoDock Vina: improving the speed and accuracy of docking with a new scoring function, efficient optimization, and multithreading. J Comput Chem 2010, 31, 455–61. [DOI] [PMC free article] [PubMed] [Google Scholar]
- 32.Grinter SZ; Yan C; Huang SY; Jiang L; Zou X, Automated large-scale file preparation, docking, and scoring: evaluation of ITScore and STScore using the 2012 Community Structure-Activity Resource benchmark. J Chem Inf Model 2013, 53, 1905–14. [DOI] [PMC free article] [PubMed] [Google Scholar]
- 33.Ma Z; Zou X, MDock: A Suite for Molecular Inverse Docking and Target Prediction. Methods Mol Biol 2021, 2266, 313–322. [DOI] [PubMed] [Google Scholar]
- 34.Günther S; Reinke PYA; Fernández-García Y; Lieske J; Lane TJ; Ginn HM; Koua FHM; Ehrt C; Ewert W; Oberthuer D; Yefanov O; Meier S; Lorenzen K; Krichel B; Kopicki JD; Gelisio L; Brehm W; Dunkel I; Seychell B; Gieseler H; Norton-Baker B; Escudero-Pérez B; Domaracky M; Saouane S; Tolstikova A; White TA; Hänle A; Groessler M; Fleckenstein H; Trost F; Galchenkova M; Gevorkov Y; Li C; Awel S; Peck A; Barthelmess M; Schlünzen F; Lourdu Xavier P; Werner N; Andaleeb H; Ullah N; Falke S; Srinivasan V; França BA; Schwinzer M; Brognaro H; Rogers C; Melo D; Zaitseva-Doyle JJ; Knoska J; Peña-Murillo GE; Mashhour AR; Hennicke V; Fischer P; Hakanpää J; Meyer J; Gribbon P; Ellinger B; Kuzikov M; Wolf M; Beccari AR; Bourenkov G; von Stetten D; Pompidor G; Bento I; Panneerselvam S; Karpics I; Schneider TR; Garcia-Alai MM; Niebling S; Günther C; Schmidt C; Schubert R; Han H; Boger J; Monteiro DCF; Zhang L; Sun X; Pletzer-Zelgert J; Wollenhaupt J; Feiler CG; Weiss MS; Schulz EC; Mehrabi P; Karničar K; Usenik A; Loboda J; Tidow H; Chari A; Hilgenfeld R; Uetrecht C; Cox R; Zaliani A; Beck T; Rarey M; Günther S; Turk D; Hinrichs W; Chapman HN; Pearson AR; Betzel C; Meents A, X-ray screening identifies active site and allosteric inhibitors of SARS-CoV-2 main protease. Science 2021, 372, 642–646. [DOI] [PMC free article] [PubMed] [Google Scholar]
- 35.Smith RD; Dunbar JB Jr.; Ung PM; Esposito EX; Yang CY; Wang S; Carlson HA, CSAR benchmark exercise of 2010: combined evaluation across all submitted scoring functions. J Chem Inf Model 2011, 51, 2115–31. [DOI] [PMC free article] [PubMed] [Google Scholar]
- 36.Huang SY; Zou X, Scoring and lessons learned with the CSAR benchmark using an improved iterative knowledge-based scoring function. J Chem Inf Model 2011, 51, 2097–106. [DOI] [PMC free article] [PubMed] [Google Scholar]
- 37.Gaieb Z; Liu S; Gathiaka S; Chiu M; Yang H; Shao C; Feher VA; Walters WP; Kuhn B; Rudolph MG; Burley SK; Gilson MK; Amaro RE, D3R Grand Challenge 2: blind prediction of protein-ligand poses, affinity rankings, and relative binding free energies. J Comput Aided Mol Des 2018, 32, 1–20. [DOI] [PMC free article] [PubMed] [Google Scholar]
- 38.Bhat ZA; Chitara D; Iqbal J; Sanjeev BS; Madhumalar A, Targeting allosteric pockets of SARS-CoV-2 main protease M(pro). J Biomol Struct Dyn 2021, 1–16. [DOI] [PubMed] [Google Scholar]
- 39.Sztain T; Amaro R; McCammon JA, Elucidation of Cryptic and Allosteric Pockets within the SARS-CoV-2 Main Protease. J Chem Inf Model 2021, 61, 3495–3501. [DOI] [PMC free article] [PubMed] [Google Scholar]
- 40.Hussein HA; Borrel A; Geneix C; Petitjean M; Regad L; Camproux AC, PockDrug-Server: a new web server for predicting pocket druggability on holo and apo proteins. Nucleic Acids Res 2015, 43, W436–42. [DOI] [PMC free article] [PubMed] [Google Scholar]
- 41.Strömich L; Wu N; Barahona M; Yaliraki SN, Allosteric Hotspots in the Main Protease of SARS-CoV-2. bioRxiv 2020, 10.1101/2020.11.06.369439. [DOI] [PMC free article] [PubMed] [Google Scholar]
- 42.Cho E; Rosa M; Anjum R; Mehmood S; Soban M; Mujtaba M; Bux K; Moin ST; Tanweer M; Dantu S; Pandini A; Yin J; Ma H; Ramanathan A; Islam B; Mey A; Bhowmik D; Haider S, Dynamic Profiling of β-Coronavirus 3CL M(pro) Protease Ligand-Binding Sites. J Chem Inf Model 2021, 61, 3058–3073. [DOI] [PubMed] [Google Scholar]
- 43.Gowthaman R; Guest JD; Yin R; Adolf-Bryfogle J; Schief WR; Pierce BG, CoV3D: a database of high resolution coronavirus protein structures. Nucleic Acids Res 2021, 49, D282–d287. [DOI] [PMC free article] [PubMed] [Google Scholar]
- 44.Ghahremanpour MM; Tirado-Rives J; Deshmukh M; Ippolito JA; Zhang CH; Cabeza de Vaca I; Liosi ME; Anderson KS; Jorgensen WL, Identification of 14 Known Drugs as Inhibitors of the Main Protease of SARS-CoV-2. ACS Med Chem Lett 2020, 11, 2526–2533. [DOI] [PMC free article] [PubMed] [Google Scholar]
- 45.Kumar S; Sharma PP; Shankar U; Kumar D; Joshi SK; Pena L; Durvasula R; Kumar A; Kempaiah P; Poonam; Rathi B, Discovery of New Hydroxyethylamine Analogs against 3CL(pro) Protein Target of SARS-CoV-2: Molecular Docking, Molecular Dynamics Simulation, and Structure-Activity Relationship Studies. J Chem Inf Model 2020, 60, 5754–5770. [DOI] [PubMed] [Google Scholar]
- 46.Li Z; Li X; Huang YY; Wu Y; Liu R; Zhou L; Lin Y; Wu D; Zhang L; Liu H; Xu X; Yu K; Zhang Y; Cui J; Zhan CG; Wang X; Luo HB, Identify potent SARS-CoV-2 main protease inhibitors via accelerated free energy perturbation-based virtual screening of existing drugs. Proc Natl Acad Sci U S A 2020, 117, 27381–27387. [DOI] [PMC free article] [PubMed] [Google Scholar]
- 47.Llanos MA; Gantner ME; Rodriguez S; Alberca LN; Bellera CL; Talevi A; Gavernet L, Strengths and Weaknesses of Docking Simulations in the SARS-CoV-2 Era: the Main Protease (Mpro) Case Study. J Chem Inf Model 2021. [DOI] [PubMed] [Google Scholar]
- 48.Sawant S; Patil R; Khawate M; Zambre V; Shilimkar V; Jagtap S, Computational assessment of select antiviral phytochemicals as potential SARS-Cov-2 main protease inhibitors: molecular dynamics guided ensemble docking and extended molecular dynamics. In Silico Pharmacol 2021, 9, 44. [DOI] [PMC free article] [PubMed] [Google Scholar]
- 49.Verma S; Patel CN; Chandra M, Identification of novel inhibitors of SARS-CoV-2 main protease (M(pro)) from Withania sp. by molecular docking and molecular dynamics simulation. J Comput Chem 2021. [DOI] [PMC free article] [PubMed] [Google Scholar]
- 50.Yang J; Lin X; Xing N; Zhang Z; Zhang H; Wu H; Xue W, Structure-Based Discovery of Novel Nonpeptide Inhibitors Targeting SARS-CoV-2 M(pro). J Chem Inf Model 2021. [DOI] [PMC free article] [PubMed] [Google Scholar]
- 51.Yuce M; Cicek E; Inan T; Dag AB; Kurkcuoglu O; Sungur FA, Repurposing of FDA-approved drugs against active site and potential allosteric drug-binding sites of COVID-19 main protease. Proteins 2021. [DOI] [PMC free article] [PubMed] [Google Scholar]
Associated Data
This section collects any data citations, data availability statements, or supplementary materials included in this article.
Supplementary Materials
Data Availability Statement
The starting structure for Mpro was available from the Protein Data Bank (PDB ID 7ALI).9 All software used in this work are published and publically available: MOE2019,10 Molprobity server,11 H++ server,12 AMBER2014 with the grid command in Cpptraj (version V5.0.5 (GitHub))22 from AmberTools, MixMD Probeview,24 Bio3D package (version 2.4–1),26, 27 GOLD v5.8,30 Autodock Vina,31 and MDock.32, 33


