Abstract
The synthesis and characterization of a generation three triazine dendrimer that displays a phenolic group at the core for labeling, up to eight 5kDa PEG chains for solubility, and 16 paclitaxel groups is described. Three different diamine linkers—dipiperidine trismethylene, piperazine, and aminomethylpiperidine—were used within the dendrimer. To generate the desired stoichiometric ratio of 8 PEG chains to 16 paclitaxel groups, a monochlorotriazine was prepared with two paclitaxel groups attached through their 2’-hydroxyls using a linker containing a labile disulfide. This monochlorotriazine was linked to a dichlorotriazine with aminomethylpiperidine. The resulting dichlorotriazine bearing two paclitaxel groups could be reacted with the eight amines of the dendrimer. NMR and MALDI- TOF confirm successful reaction. The eight monochlorotriazines of the resulting material are used as the site for PEGylation affording the desired 2:1 stoichiometry. The target and intermediates were amenable to characterization by 1H and 13C NMR, and mass spectrometry. Analysis revealed that 16 paclitaxel groups were installed along with 5-8 PEG chains. The final construct is 63% PEG, 22% paclitaxel, and 15% triazine dendrimer. Consistent with previous efforts and computational models, 5 kDa PEG groups were essential for making the target water soluble. Molecular dynamics simulations showed a high degree of hydration of the core, and a radius of gyration of 2.8± 0.2 nm. The hydrodynamic radius of the target was found to be 15.8 nm by dynamic light scattering, an observation indicative of aggregation. Drug release studies performed in plasma showed slow and identical release in mouse and rat plasma (8%, respectively). SPECT/CT imaging was used to follow biodistribution and tumor uptake. Using a two component model, the elimination and distribution half-lives were 0.4 hrs and 19.3 ± 2.1 hrs, respectively. Compared with previous constructs, this dendrimer persists in the vasculature longer (17.33 ± 0.88 %ID/g at 48 h post-injection), and showed higher tumor uptake. Low levels of dendrimer were observed in lung, liver, and spleen (~6 %ID/g). Tumor saturation studies of small prostate cancer tumors (PC3) suggest that saturation occurs at a dose between 23.2 mg/kg and 70.9 mg/kg.
Keywords: paclitaxel, triazine, dendrimer, disulfide linkage, biodistribution, drug delivery, simulation, molecular dynamics
Introduction
Paclitaxel has been extensively studied1,2 because of its therapeutic efficacy against a wide range of cancers including those of the breast3-5, ovaries6, prostate7, as well as AIDS related Kaposi's sarcoma8. In addition, its poor water solubility (<0.1 μg/mL) requires that paclitaxel be administered with a carrier. Originally, cosolvents such as Cremophor EL (polyoxyethylated castor oil) or polysorbate 80 formulations were adopted, although these can cause severe allergic reactions in some patients.9-13 Abraxane, albumin bounded paclitaxel, is an example of a successful nanoscale drug delivery formulation that has been approved by the FDA.14,15 While overcoming the challenges of the original additives, Abraxane, like all chemotherapies, leads to undesirable toxicities and side affects due to the dose utilized and off-target affects.
Polymer-based drug delivery, described first by Ringsdorf16 and bolstered by the advantages that the enhanced permeation and retention that tumors show towards large molecules17 has been broadly embraced by chemists pursuing a range of architectures. Macromolecular drug delivery agents such as polyplexes, polymeric micelles, dendritic core– shell architectures, or nanoparticle depots have continue to attract interest due to their low toxicities, their extended lifetimes within the circulatory system, as well as their ability to convey solubility to the drug cargo.18 Dendrimers bearing paclitaxel have been the focus of our efforts and those of others.19 Advantages of triazines include: ease of synthesis; stability; structurally and compositionally well-defined, globular structure; opportunities for achieving acceptable drug loadings; low polydispersity.20-24
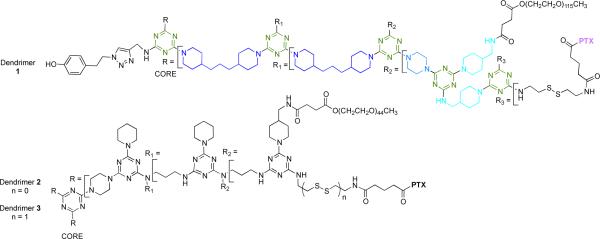
The target described here, 1, is the fourth in a series of agents that have been iteratively prepared and refined to address questions of chemistry and biological activity. Chart 1 shows 1 and two previously described prodrugs, 2 and 3.25-28 Prodrugs 2 and 3 present twelve paclitaxel groups and have sites for up to 12 PEG chains. The activity of 3 was markedly improved in vivo that 2 presumably due to the labile disulfide.29-31 Dosing mice with 3 at 50mg/kg weekly over three weeks led to tumor reduction/disappearance without mortality.25 However, installation of twelve 2 kDa PEG chains was problematic. The result of the synthesis was a mixture of dendrimers displaying between 6 and 12 chains. Here, we aimed to reduce heterogeneity by reducing the number of PEGylation reactions that are performed, while simultaneously increasing the number of paclitaxel groups on the dendrimer.
Chart 1.
Paclitaxel-conjugated triazine dendrimers 1-3. Both 1 and 3 have disulfide linkers. Colors reflect those used in Scheme 1. PTX=paclitaxel.
Experimental Section
Synthesis
. The experimental details for synthesis including spectra can be found in the Supporting Information.
HPLC Based Assessments of Purity
The chromatographic system used to measure sample purity consisted of a degasser (Agilent G1379B, Palo Alto, CA), capillary pump (Agilent G1312B), micro well-plate auto sampler (Agilent G1367D), Zorbax 300SB-C8 column (1.0 mm i.d. × 150 mm, 3.5 Qm, Agilent), and a diode array detector (Agilent G1316B) The mobile phase consisted of water/acetonitrile (A/B, HPLC grade, 0.1 % (w/v) trifluoroacetic acid) at a flow rate of 50 Qm/min. The elution gradient was 35% MeCN for 5 min, ramp to 80% MeCN in 20 min, hold at 80% MeCN for 10 min, and ramp down to 35% MeCN in 10 min. The sample volume injected 5 QL at a concentration of 0.64 mg/mL in HPLC-grade MeCN, and eluted sample was detected at 227 nm. Samples were run in triplicate.
Paclitaxel Release of Dendrimer 1 in Plasma
To determine the rate of release of bound paclitaxel from 1 in plasma, a solution of 1 (500 μL, c 300 μg/mL in PBS buffer) was incubated in 100 μL of plasma (rat or mouse) at 37 °C for 48 h. At selected time intervals (0.5, 1, 6, 24 and 48 h), the plasma samples were mixed with 500 QL of ice-cold acetonitrile that contained 10 μL of 366 μg/mL docetaxel as an internal standard. The samples were then centrifuged at 14000 rpm for 20 min to remove precipitated protein and 10 μL of aliquots were injected into an HPLC system. HPLC analysis was performed using an Agilent system, column, and elution gradient. The internal standard, docetaxel, and analyte, paclitaxel, elution times were 14-16 and 17-19 min, respectively. The peak area ratio was used to calculate paclitaxel concentrations.
Paclitaxel Release of Model Compound 12 in Plasma
In order to determine the rate of release of bound paclitaxel from the model compound 12 in plasma, a solution of model compound 12 (50 μL, c 1.0 mg/mL in DMSO) was incubated in 500 μL of PBS buffer and 100 μL of plasma (rat or mouse) at 37 °C for 20 h. At selected time intervals (6 and 20 h), the plasma samples were mixed with 500 μL of ice-cold acetonitrile that contained 20 μL of 392 μg/mL docetaxel as an internal standard. The samples were then centrifuged at 14000 rpm for 20 min to remove precipitated protein and 5 μL of aliquots were injected into an HPLC system. HPLC analysis was performed using same Agilent system, column, and elution gradient. The elution times for the compounds were: docetaxel (15-17 min), paclitaxel (18-19 min), and model compound 12 (14-16 min). The peak area ratio was used to calculate paclitaxel concentrations.
Methods in Molecular Dynamics Simulation
The experimental procedure was followed by published methods.25,32 Briefly, the molecular models were built from different residues according to previous studies on similar dendrimers.33 All of the non-standard residues were obtained according to a well-validated procedure adopted by our group.34 All molecular dynamics simulations (MD) were conducted using the AMBER 11 suite of programs.35 The dendrimers were solvated in periodic box with a 14 Å buffer containing explicit TIP3P36 water molecules and a suitable number of Cl- and Na+ ions necessary to guarantee overall neutrality and to reproduce the experimental salt concentration of 150 mM NaCl. The single 5 kDa linear PEG chains were preliminarily pre-folded in vacuum to reduce the initial size of the simulation box, and accordingly, the number of water molecules necessary for solvation. This procedure is consistent with previously reported simulation studies of molecular systems containing long PEG chains,37 and with the well-demonstrated tendency of PEG to fold in solution.33 The dendrimers were first minimized and then equilibrated for 50 ns in NPT condition at the temperature of 300 K and pressure of 1 atm. During this time all molecular systems reached the equilibrium with good stability. Simulations were conducted using a time step of 2 fs, a Langevin thermostat, a 10 Å cut-off, the particle mesh Ewald38 (PME) approach to treat long-range electrostatic interactions and the SHAKE algorithm.39 The parm99 all-atom force field by Cornell et al.40 was used for all of the standard residues present in the systems. The radius of gyration (Rg) and the radial distribution functions (RDF) of the dendrimers were calculated by processing the equilibrated dynamic trajectories with the ptraj module of AMBER 11.
Dynamic Light Scattering
Samples were prepared by weight starting from stock solutions with concentrations of the order of 10g/L (1% w/w). DLS measurements were performed in the range 0.3-5 g/L in PBS at 25 °C and at the angle of 90 deg. Samples were filtered through 0.02 μm filter. The diffusion coefficient was measured as a function of concentration and extrapolated to zero concentration to determine the hydrodynamic radius of the 1.
Radiolabeling of Prodrug 1 with 125 I
IODO-GEN precoated iodination tubes (Pierce, Rockford, IL) were used for labeling of 1 with 125I at the Bolton-Hunter moiety. In brief, the IODO-GEN precoated tubes were rinsed with 1 mL of 10 mM PBS buffer (pH 7.5) before the labeling. To each IODO-GEN tube containing 4.5 nmol of prodrug 1 in 20 mM PBS was added 1 mCi of Na125I (2 μL). The solution was kept at room temperature for 20 min with gentle swirling every 5 min. The radiochemical reaction was monitored by iTLC. The sample was further purified by using Millipore centrifugal filtration unit (MWCO: 10K), which were centrifuged at 6,000 rpm for 60 min to remove the free 125I ion or other small molecular species. The product was then washed with 3 portions of 1 mL of 10 mM PBS. Radio-TLC or radio-HPLC was used to measure the radiolabeling efficiency and determine the radiochemical purity of 125I-labeled 1 (125I-1).
Size Exclusion HPLC Assessment of the Association between 1 and Serum Proteins
125I-1 was incubated with rat serum at 37 °C for 3 and 18 h. The serum samples of 125I-1 were analyzed by size-exclusion chromatography on a BioSuite 450 column (Waters; MW range: 20 kDa-7000 kDa) at 1 mL/min (isocratic condition, mobile phase: 10 mM PBS, pH 7.0). The fractions were collected and then counted by a γ-counter (Perkin Elmer). The serum samples of Na125I was prepared side by side and used as controls in this assessment.
Biodistribution Study in Normal BALB/c Mice and PC-3 Tumor-bearing Mice
To determine the in vivo tissue distribution of 125I-1, the biodistribution study was first performed in normal BALB/c mice and then on PC-3 tumor bearing SCID mice. The prostate cancer mouse model was established by injecting PC-3 cells subcutaneously into both front flanks (2 × 10⁶ of cells in 100 μL) of male SCID mice at 6-8 weeks of age. Tumors were allowed to grow for 3 weeks to reach the size of 10-100 mm3. In the biodistribution study in normal mice, each mouse was intravenously injected with 100 μL of 125I-1 (10 – 15 μCi/mouse). Mice were sacrificed at 1, 4, 24, and 48 h post-injection (p.i.; n = 4). Harvested organs included blood, heart, lung, fat, liver, spleen, kidneys, stomach, muscle, femur, thyroid, brain, and thymus. For the biodistribution study in SCID mice bearing PC3 tumor, a similar dose of 125I&1 was injected and mice were sacrificed 48 h p.i. Tumor was excised from the PC&3 tumor&bearing mice. The tissue samples were weighed and then their radioactivity was quantified by a γ-counter. Standards were prepared, weighed, and counted along with the samples for the calculation of percentage of injected dose per gram of tissue (%ID/g). Statistical analysis was performed using Prism 5.0 (Graphpad, San Diego, CA).
Tumor Saturation Dose Evaluation of 125 I-1 in PC-3 Tumor-bearing Mice by Small Animal SPECT/CT Imaging
In the PC3 xenograft model, tumor necrosis is often observed when the tumor size is above 300 mm3. To minimize this factor, the tumor size was controlled below 100 mm3 in this imaging evaluation, which was performed on a small-animal NanoSPECT/CT PLUS system (Bioscan Washington DC, USA). Four paclitaxel equivalent dose groups of 1 were used: 1.7, 23.2, 70.9, and 111.3 mg/kg (n = 4). The lowest dose (1.7 mg/kg) was the amount of purified 125I-1 injected directly into the tumor bearing mice for the imaging evaluation, the remaining doses were prepared by constituting the same amount of 125I-1 with cold prodrug 1. In other words, the lowest dose (1.7 mg/kg) of prodrug 1 was used as the imaging tracer to evaluate the tumor saturation dose of 125I-1. For each mouse, the injected radioactivity (125I-1) was controlled within 300 – 500 μCi in 250 μL for SPECT/CT imaging. The injection dose was prepared by combining 125I&1 in 10 mM PBS with a concentrated cold prodrug 1 solution, which was made by dissolving the prodrug in 20% DMSO in 10 mM PBS with 30 min of sonication. After the intravenous injection of each dose, SPECT and CT images were acquired at 48 h p.i. The field of view (FOV) of the SPECT/CT was aimed at the shoulders of the mouse. The CT imaging was performed by 180 projections per rotation with 45 kVp, 1000 ms of exposure time, and the binning factor of 1:1. The SPECT imaging data were collected with 4 detector arrays collimated with multi-pinhole apertures giving a post-reconstruction resolution of 0.73 mm. The SPECT image reconstruction was carried out using HiSPECT NG with 35% smoothing, 100% resolution, and 9 iterations (Standard mode). The CT data were reconstructed using the Nucline v1.01 and a voxel size of 73 x 73 x 146mm. Both SPECT and CT images were analyzed using the InVivoScope 2.00 software (Bioscan). Tumors smaller than 100 mm3 were selected for imaging quantification. The volume of the region of interest (ROI) was based on the ex vivo size measurement. The standardized uptake value (SUV) was used for the SPECT/CT imaging quantification.
Results and Discussion
Design
The design of target 1 was driven by three desires. First, a versatile handle for the incorporation of imaging agents was desired. Previous efforts with 2 and 3 relied on statistical, substoichiometric labeling of unreacted amine groups on the periphery of the dendrimer with a Bolton-Hunter agent. Instead, we incorporated an alkyne at the core that could be elaborated through click chemistry to yield the desired phenolic group, or other groups in the future. Second, improved synthetic efficiency was sought. Predecessors 2 and 3 derived from a generation two dendrimer whose synthesis included i) extra capping steps as well as ii) less reactive bis(3-aminopropyl)amine groups. Removing this capping step and improving the nucleophilicity of the surface amines were both goals of this effort. Incorporating trimethylene- dipiperidine and piperazine groups accomplished these goals. To reduce the number of PEG chains incorporated, fewer sites for PEGylation were incorporated into 1. Based on the symmetry of the core, 16 paclitaxel and 8 PEG chains can be installed theoretically. By weight, 1 is 63% PEG, 22% paclitaxel, and 15% triazine dendrimer.
Synthesis
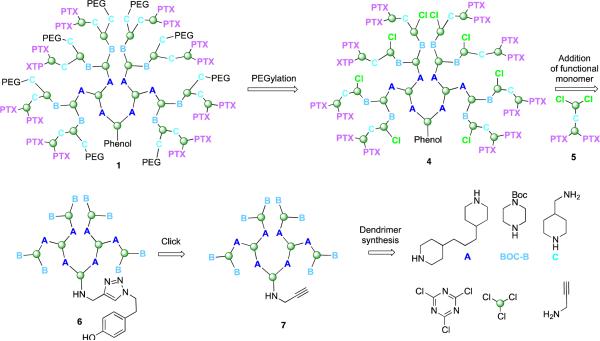
The synthesis of 1 proceeds in three phases; synthesis of the dendrimer, synthesis of the functional dichlorotriazine, and coupling the subunits with elaboration to the final product. The retrosynthetic analysis ( Scheme 1) provides a schematic representation of the products and key intermediates. A key element is the two-step PEGylation procedure to yield 1 . This sequence relies on reacting poly(monochlorotriazine) 4 with aminomethylpiperidine followed by a commercially available PEG-NHS ester with a molecular weight of 5kDa. To arrive at 4, a dichlorotriazine monomer bearing two paclitaxel groups, 5, is reacted with the generation two dendrimer 6. Installation of the phenol for labeling relied on a click reaction at the core of dendrimer 7. The building blocks utilized extensively throughout the synthesis are shown.
Scheme 1. Retrosynthetic analysis.
Target 1 derives from a two-step PEGylation procedure of 4. Intermediate 4 results from reaction of the functionalized dichlorotriazine bearing two paclitaxel groups (PTX), 5, with dendrimer 6. Dendrimer 6 comes from click reaction of 7 which derives from some of the building blocks identified.
Dendrimer synthesis
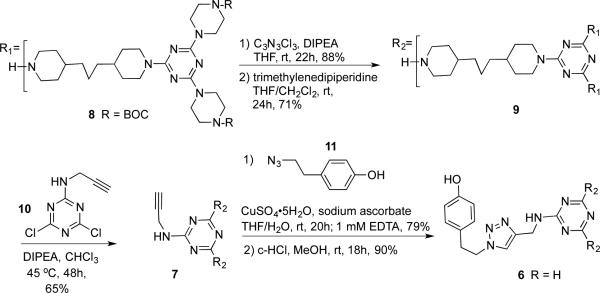
Scheme 2 shows the synthesis of 6, the generation two dendrimer. Intermediate 8 can be rapidly obtained by reacting two equivalents of BOC-piperazine (BOC-B in Scheme 1) with cyanuric chloride followed by bispiperidine trismethylene (A in Scheme 1).41 Continuing convergently, the process is iterated to obtain a generation two dendron, 9. The core is installed with the alkyne-functionalized dichlorotriazine 10. Click reaction42,43 with 11 installs a phenolic group44 that can be subjected to radioiodination later. Overall, this six step procedure can be executed at 25% overall yield. Intermediates are purified by conventional silica gel chromatography, and provide satisfactory 1H and 13C NMR spectra and corroborating mass spectra.
Scheme 2.
Synthesis of the generation two dendrimer
Synthesis of the dichlorotriazine bearing paclitaxel
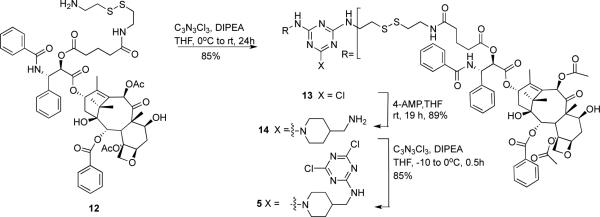
To arrive at the desired 2:1 stoichiometry of PTX:PEG, dichlorotriazine 5 was prepared (Scheme 3). Paclitaxel derivative 12 is available by reaction of paclitaxel with glutaric anhydride followed by formation of an NHS-ester with N-succinimidyl diphenylphosphate (SDPP), and then coupling with cysteamine.26 The yield for this three step procedure was 67%. Reaction of 12 with cyanuric chloride provides 13. This monochlorotriazine intermediate 13 was reacted with aminomethylpiperidine in 89% yield to provide 14. Reaction of 14 with cyanuric chloride yields the reactive dichlorotriazine 5. The overall yield for this six step sequence is 43%.
Scheme 3.
Synthesis of the dichlorotriazine.
Elaboration by coupling the dichlorotriazine and dendrimer followed by PEGylation
Equation 1 shows the coupling of dendrimer 6 with dichlorotriazine 5. Mass spectrometry can be used to monitor progress of the required 8 coupling reactions. The remaining 8 monochlorotriazine groups that appear on 4 are reacted first with aminomethylpiperidine, and then a commercially available 5 kDa PEG-NHS ester to yield 1. 26-27 The solubility of 1 in water allowed for its purification from excess PEG by dialysis. Overall, the desired target is reached in 9 linear steps at 30% overall yield.
 |
eq 1 |
Computation
Computational models provided insights into the impact of PEGylation on both solubility and drug shielding. The choice of 5kDa PEG derived from intuition, experiment and prediction. Intuitively, we believed 5kDa PEG would be necessary because with previous constructs, we found that a minimum of 2kDa of PEG was required for each paclitaxel group. This belief was confirmed experimentally. We found that 2 kDa PEG groups were not sufficient to provide solublity in water, while using 5kDa PEG did so.
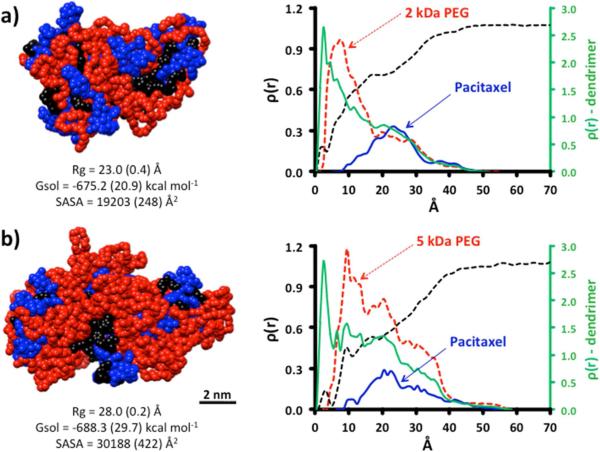
MD simulations yield structures wherein PEG chains collapse around the surface of the dendimer, as seen in previous reports.33,37 Simulation predicted that the hydrophobic surface produced when 4 is reacted with 2kDa PEG is significantly greater than when it is reacted with 5kDa PEG (Figure 1). While the free energy of solvation calculated for both constructs were identical within standard deviation, the solvent exposed surface area was 1.6x greater when 5kDa PEG is used. The radial distribution functions calculated from the equilibrated structures corroborate visual inspection of the minimized structures: the exposure of hydrophobic paclitaxel groups for the 2kDa is greater than that of the 5kDa structure. The green traces (plotted on a different scale) represent all the RDF for all atoms in the construct. Colored traces shown in red and blue show the RDFs for PEG and paclitaxel groups, respectively, as colored in the molecular models appearing on the left. Water penetration, shown as a black dotted line, is similar in both constructs. Simulations support the expectation that paclitaxel groups are somewhat solvent accessible in 1, but not to the degree that paclitaxel groups have been in previous triazine dendrimer prodrugs decorated with 2kDa PEG chains.
Figure 1.
MD simulations show differences in size and solvent accessible surface area (SASA) for 4 pegylated with 2kDa PEG and 5kDa PEG (1). Radial distribution functions show that 2kDa PEG is insufficient in masking the hydrophobic dendrimer.
Characterization
Throughout the synthesis, 1H and 13C spectroscopy and mass spectrometry provided compelling evidence of structure. Challenges to characterization arise during the final stages of any dendrimer synthesis. Evidence for successful reaction of the generation two dendrimer 6 with eight dichlorotriazines, 5, can be observed by both the 1H NMR spectroscopy and mass spectrometry. Integration of signals of the two protons of the phenolic group of the dendrimer and the ortho-protons of the two benzoyl groups of each of the 16 paclitaxel groups provides one estimate of the extent of reaction. The desired ratio of 2:32 is observed. This result is consistent with the spectrum obtained by MALDI-TOF mass spectrometry. The major species observed is the desired material showing a reasonable agreement between the calculated exact mass 22.7kDa and the observed mass 22.8 kDa. Evidence for a minor species corresponding to 7 of the required 8 additions is also present. Two other species can be identified. The first represents loss of a single paclitaxel group at the 2’- ester. The second corresponds to cleavage at the disulfide. The extent to which these fragments represent impurities or arise during the ionization process is uncertain, but their value in anchoring assignment of the parent peak is invaluable.
PEGylation exacerbates the challenge of characterization. The 1H NMR spectrum broadens further, but the ratio of 16 molecules of paclitaxel:dendrimer is maintained. Consistent with previous dendrimers bearing PEG, the mass spectrum derived from MALDI-MS shows a broad and largely featureless lump, here between 54 kDa and 68 kDa. The commercially available 5 kDa PEG reagent shows a distribution of masses from 5250-6250 centered at 5750. Because 4 has a mass of 22.8 kDa, PEGylation with 5kDa PEG chains should yield a mass of ~57 kDa upon installation of 6 PEG chains, and 68 kDa upon installation of 8 groups. Consistent with previous efforts, we conclude that PEGylation results in a mixture of products primarily comprising dendrimers with 5-9 PEG chains.
Confirming distributions with HPLC
Reverse phase HPLC of 1 yields a chromatogram that is consistent with a mixture of PEGylated products with three major species identified. The chromatogram also shows that dialysis successfully removes free PEG.
Dynamic Light Scattering Supports Aggregation
Bovine serum albumin, which has a similar molecular weight as 1, has a hydrodynamic radius of 3.5 nm. Computational models of monomeric 1 suggest similar protein-sized dimensions. However, dynamic light scattering (DLS) of 1 following filtration through a 20nm filter reveals species with two different dimensions. The data was collected under conditions intended to reflect physiological conditions. The smaller of the two shows a hydrodynamic radius of 1 is 15.8 nm (Figure 2). The larger of the two exceeds 100 nm. The disparity is unlikely to be caused by swelling of the flexible PEG chains.33 Instead, the difference in sizes is likely the result of the formation of aggregates in solution. Moreover, a concentration-dependent population of these two species is clearly visible when comparing solutions of 0.30g/L and 5g/L. As these histograms report normalized scattering intensity, the population of the larger species is likely to be 100-1000x exaggerated. A cloudy suspension is observed in bulk samples at concentrations of 10g/L. No time dependent evolution of species was observed over 60 hours. Molecular dynamics (MD) provides additional clues to structure.
Figure 2.
The light-scattering distribution analysis of prodrug 1
Paclitaxel Release
Paclitaxel release was measured in mouse and rat plasma using an HPLC assay with docetaxel serving as an internal standard. While previous ester constructs showed release rates that differed with the source of plasma (8% in 24h for mice; 20% in 24 h for rats), surprisingly no difference in release rates were observed for 1: Both mouse and rat plasma showed 8% release at 24h based on the amount of free paclitaxel observed. This nominal release may correspond to effective shielding of the drug by the larger PEG in models of a monomeric species or reflect a different behavior of aggregates of 1, presumed to be the relevant species in solution. Indeed, the RDF plots derived from MD simulations suggest that PEG groups of 1 shield paclitaxel. However, simulations also reveal that both 1 and 3 should be porous with a high degree of solvent penetration with accessible disulfide and ester linkages.
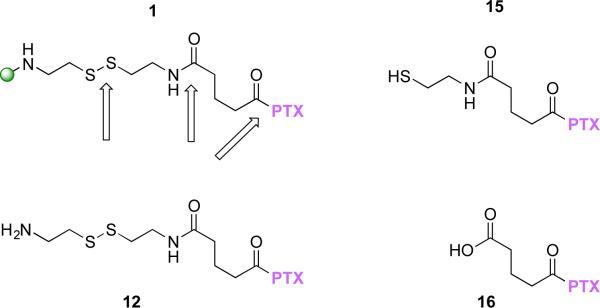
To pursue this further, we prepared a model, 12, and the expected cleavage products, 15 and 16, to use as HPLC standards (Chart 1). All showed unique retention times by HPLC: 1 (40-42 min); 12 (13.7 min); 15 (31.5 min); 16 (28.4 min); paclitaxel (18 min); docetaxel (15 min).
Chart 1.
Additional HPLC standards with sites of cleavage of 1 indicated with arrows.
Disulfides of 1 are cleaved with reducing agent
To establish that disulfide cleavage was possible, 1 was reduced with dithiothreitol (DTT). By HPLC, two distinct features were observed. The first feature was a peak corresponding to the expected thiol, 15. The second feature was a broad peak at 39 min that we attribute to the dendrimer after reduction based on the disappearance of a peak corresponding to 1.
Model 12 is reduced more rapidly than 1, but differences between mouse and rat plasma are observed
After 20h incubation in plasma, the amount of 12 was markedly reduced compared with 1. There were no apparent differences in the rate of reduction of 12 between rat and mouse plasma. The peaks corresponding to 15 and 16 are obscured by signals derived from plasma, however. Paclitaxel was observed in the traces of rat plasma, but not in the traces obtained from mouse plasma. We conclude that the rate of ester hydrolysis varies with the source of plasma.
Biodistribution Studies
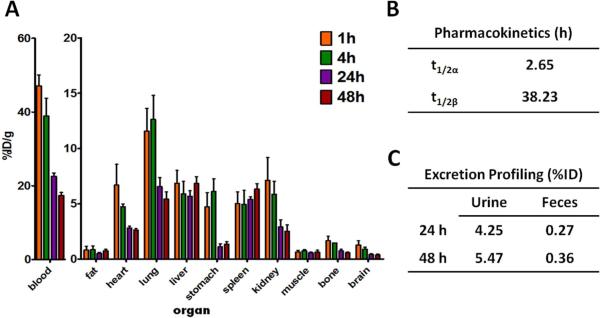
The radiosynthesis of 125I-1 provided a radiochemical yield of approximately 80% when the reaction ratio of 125I versus prodrug 1 was maintained at 4 QCi/Qg. After the separation by centrifugal filtration, the radiochemical purity of 125I-1 was nearly 100% as determined by radio-HPLC. The tissue distribution data are shown in Figure 6A. Because 1 showed high uptake and long retention in the blood, the scale of y-axis was enlarged to better exhibit the tissue distribution profile of prodrug 125I-1 in other organs. Low uptake and accumulation was observed in the liver and spleen, while a relatively high uptake was observed in the lungs at 1 and 4 h p.i. The pharmacokinetic parameters (Figure 3B) were determined by a two-compartment model using the uptake levels of 125I-1 in the blood immediately after the injection to the end point of the biodistribution study. Dendrimer 125I-1 showed a longer distribution and elimination half lives (t1/2α = 2.65 h; t1/2β = 38.2 h) than the dendrimer prodrugs that we previously published. For example, 3 with 12 paclitaxel and up to 12 PEG chains cleared much more rapidly with elimination and distribution half-lives of 0.4h and 19.3h ± 2.1h, respectively. Dendrimer 1 was excreted mainly through urine (Figure 3C). However, due to the high retention in the blood, the excretion level was low. Taken in light of other efforts, including distribution parameters of different classes of dendrimers27, we hypothesize that 1 is aggregating in solution to form species that are too large for rapid renal clearance, yet successful at avoiding hepatic clearance and uptake by elements of the RES.
Figure 3.
(A) Tissue distribution of prodrug 1 in normal BALB/c mice. Data are presented as %ID/g ± s.d. (n = 4). (B) Pharmacokinetic parameters of prodrug 1 in normal BALB/c mice. (C) Excretion profile of prodrug 1 from BALB/c mice (n = 4).
Tumor Saturation Dose Evaluation of 125I-1 in PC-3 Tumor-bearing Mice
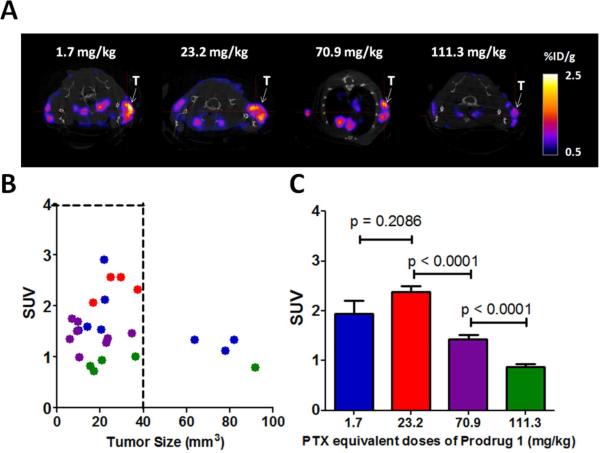
Tumor saturation studies were performed to identify an optimal dose for further tumor treatment studies. By using the tracer concept, 4 different dosing groups were noninvasively assessed by SPECT/CT imaging with 125I-1. Standardized uptake values (SUV) were used to quantitatively analyze the imaging results (Figure 4A). We find that as the tumors grew big, the tumor uptake values of 125I-1 scattered over a wide range, which likely resulted from the fact that the tumors become more heterogeneous at the same time. To minimize the variation caused by this tumor heterogeneity, the tumor size was controlled within 100 mm3 and our quantitative imaging analysis was performed on tumors smaller than < 40 mm3) (Figure 4B and 4C). Shown in Figure 4A, tumors are clearly visualized by all dosing groups, in which the amount of injected radioactivity (125I-1) was the same. Dilution of this dose with unlabeled 1 produced marked differences in uptake. Interestingly, the tumor uptake of 125I-1 (tracer) stayed at the same level when the injected dose was increased to 23.2 mg/kg dose (Figure 4A and 4C). This indicates that in the dosing range of 1.7 mg/kg to 23.2 mg/kg, the tissue distribution profile of 125I-1 was the same. As the dose increased to 70.9 mg/kg, the tumor uptake was significantly reduced, indicating a dilution effect. From 70.9 mg/kg to 111.3 mg/kg, the dose of paclitaxel was increased by 1.57 times. Consistent mathematically, though rarely observed experimentally, the tumor uptake decreased by a similar extent (1.64), corresponding to the diluting factor of the tracer (125I-1). The theoretical match between dilution and tumor uptake also suggests that prodrug 1 behaves similarly in vivo across the dosing range of the studies: dose&dependent precipitation or aggregation should significantly impact the saturation study. These observations lead us to conclude that the tumor saturation dose of prodrug 1 occurs between 23.2 mg/kg and 70.9. Mathematically extrapolated, an estimate of 50 mg/kg is obtained, a value consistent with dosings of previous prodrugs.
Figure 4.
Tumor Saturation Dose Evaluation of 125I-1 in PC-3 Tumor-bearing Mice: 1.7 mg/kg (blue), 23.2 mg/kg (red), 70.9 mg/kg (purple), and 111.3 mg/kg (green). (A) Representative transaxial SPECT/CT images of PC3 tumor in SCID mice (48 h p.i.). Tumors are indicated by white arrows. (B) Tumor uptake of 125I-1 versus tumor size. Tumors smaller than 100 mm3 were selected for the evaluation. (Number of tumors evaluated in each group: 7 (1.7 mg/kg); 5 (23.2 mg/kg); 8 (70.9 mg/kg); 5 (111.3 mg/kg). (C) Tumor uptake levels of the 4 dosing groups in tumors smaller than 40 mm3. (Number of tumors evaluated in each group: 4 (1.7 mg/kg); 5 (23.2 mg/kg); 8 (70.9 mg/kg); 4 (111.3 mg/kg)). SUV is standardized uptake value of the labeled prodrug.
Conclusion
In summary, we have described the preparation of a dendrimer with 2:1 ratio of paclitaxel:PEG chains with a site for a single label. Both NMR and mass spectrometry of 1 show that the paclitaxel groups undergo little to no hydrolysis during the final steps of the synthesis including purification by dialysis. The target contains 16 paclitaxel (22 wt % drug) and five to eight PEG arms (63 wt % PEG) with dendrimer comprising the smallest portion (15%). A minor contributor to the mixture is a dendrimer with 14 paclitaxels and 6-7 PEG chains. While simulations reveal that water penetration and accessibility 1 was better than in previous constructs, the amount of released paclitaxel was lower in plasma in comparison. Model drug release studies in mouse plasma suggests the reduction of disulfide bond is much faster than hydrolysis of the ester. Three lines of evidence are consistent with aggregation of 1 into larger, discrete nanoparticles. First, dynamic light scattering reveals a dimension of 15.8 nm, which is significantly larger than the value obtained from computation, 2.3 nm. Second, 125I-1 shows significant concentrations in the vasculature over time and slow clearance. Third, this behavior is consistent with previously studied PEGylated triazine dendrimers bearing paclitaxel. Tumor saturation studies suggest that for small tumors, those not exceeding 40mm3, saturation occurs at doses less than 70.9 mg/kg. This range is consistent with doses ordinarily used for Taxol and Abraxane formulations of paclitaxel in mice models as well as efficacious doses seen in previous triazine dendrimer prodrugs. These previous prodrugs showed similar drug release rates as 1. The lack of a clear therapeutic advantage based on these release rates and tumor saturation data dissuade us from tumor regression studies at this point. Indeed, once tumor saturation is reached, the remainder of the injected dose should not impact the therapeutic efficacy, but rather be excreted or accumulate in non-target organs causing unwanted side effects. Hypothetically, any benefit derived from 1 over clinically-relevant formulations Taxol and Abraxane in this model of disease falls to the presence of a labeling group for theranostic applications, and/or the potential opportunity to reduce dosing frequency due to the long vasculature half-life.
Supplementary Material
ACKNOWLEDGMENT
We thank the Robert A. Welch Foundation (A-0008) and the National Institutes of Health (R01 NIGMS 64560) for support.
Footnotes
Supporting Information
This material is available free of charge via the Internet at http://pubs.acs.org
REFERENCES
- 1.Schellmann N, Deckert PM, Bachran D, Fuchs H, Bachran C. Targeted enzyme prodrug therapies. Mini-Rev. Med. Chem. 2010;10:887–904. doi: 10.2174/138955710792007196. [DOI] [PubMed] [Google Scholar]
- 2.Skwarczynski M, Hayashi Y, Kiso Y. Paclitaxel prodrugs: toward smarter delivery of anticancer agents. J. Med. Chem. 2006;49:7253–7269. doi: 10.1021/jm0602155. [DOI] [PubMed] [Google Scholar]
- 3.Chirgwin J, Chua SL. Management of breast cancer with nanoparticle albumin-bound (nab)-paclitaxel combination regimens: a clinical review. Breast. 2011;20:394–406. doi: 10.1016/j.breast.2011.06.004. [DOI] [PubMed] [Google Scholar]
- 4.Croom KF, Dhillon S. Bevacizumab: a review of its use in combination with paclitaxel or capecitabine as first-line therapy for HER2-negative metastatic breast cancer. Drugs. 2011;71:2213–2229. doi: 10.2165/11207720-000000000-00000. [DOI] [PubMed] [Google Scholar]
- 5.Scripture CD, Figg WD, Sparreboom A. Paclitaxel chemotherapy: from empiricism to a mechanism-based formulation strategy. Ther. Clin. Risk. Manag. 2005;1:107–114. doi: 10.2147/tcrm.1.2.107.62910. [DOI] [PMC free article] [PubMed] [Google Scholar]
- 6.Baur M, Fazeny-Doerner B, Olsen SJ, Dittrich C. High dose single-agent paclitaxel in a hemodialysis patient with advanced ovarian cancer: a case report with pharmacokinetic analysis and review of the literature. International journal of gynecological cancer : official journal of the International Gynecological Cancer Society. 2008;18:564–570. doi: 10.1111/j.1525-1438.2007.01048.x. [DOI] [PubMed] [Google Scholar]
- 7.Narita S, So A, Ettinger S, Hayashi N, Muramaki M, Fazli L, Kim Y, Gleave ME. GL12 knockdown using an antisense oligonucleotide induces apoptosis and chemosensitizes cells to paclitaxel in androgen-independent prostate cancer. Clin. Cancer. Res. 2008;14:5769–5777. doi: 10.1158/1078-0432.CCR-07-4282. [DOI] [PubMed] [Google Scholar]
- 8.Dhillon T, Stebbing J, Bower M. Paclitaxel for AIDS-associated Kaposi's sarcoma. Expert Rev Anticanc. 2005;5:215–219. doi: 10.1586/14737140.5.2.215. [DOI] [PubMed] [Google Scholar]
- 9.Terwogt JMM, Nuijen B, Huinink WWT, Beijnen JH. Alternative formulations of paclitaxel. Cancer Treat. Rev. 1997;23:87–95. doi: 10.1016/s0305-7372(97)90022-0. [DOI] [PubMed] [Google Scholar]
- 10.Liebmann J, Cook JA, Mitchell JB. Cremophor-El, Solvent for Paclitaxel, and Toxicity. Lancet. 1993;342:1428–1428. doi: 10.1016/0140-6736(93)92789-v. [DOI] [PubMed] [Google Scholar]
- 11.Singla AK, Garg A, Aggarwal D. Paclitaxel and its formulations. Int J Pharmaceut. 2002;235:179–192. doi: 10.1016/s0378-5173(01)00986-3. [DOI] [PubMed] [Google Scholar]
- 12.Ganta S, Amiji M. Coadministration of Paclitaxel and Curcumin in Nanoemulsion Formulations To Overcome Multidrug Resistance in Tumor Cells. Mol. Pharm. 2009;6:928–939. doi: 10.1021/mp800240j. [DOI] [PubMed] [Google Scholar]
- 13.Marupudi NI, Han JE, Li KW, Renard VM, Tyler BM, Brem H. Paclitaxel: a review of adverse toxicities and novel delivery strategies. Expert. Opin. Drug. Saf. 2007;6:609–621. doi: 10.1517/14740338.6.5.609. [DOI] [PubMed] [Google Scholar]
- 14.Guarneri V, Dieci MV, Conte P. Enhancing intracellular taxane delivery: current role and perspectives of nanoparticle albumin-bound paclitaxel in the treatment of advanced breast cancer. Expert Opin. Pharmacother. 2012;13:395–406. doi: 10.1517/14656566.2012.651127. [DOI] [PubMed] [Google Scholar]
- 15.Dranitsaris G, Lidgren M, Lundkvist J, Coleman R. Nab-paclitaxel or docetaxel; As alternatives to conventional paclitaxel for the treatment of metastatic breast cancer (MBC): A cost utility analysis in five European countries. Value Health. 2008;11:A71–A71. [Google Scholar]
- 16.Edinger D, Wagner E. Bioresponsive polymers for the delivery of therapeutic nucleic acids. Wiley Interdiscip. Rev. Nanomed. Nanobiotechnol. 2011;3:33–46. doi: 10.1002/wnan.97. [DOI] [PubMed] [Google Scholar]
- 17.Maeda H. Vascular permeability in cancer and infection as related to macromolecular drug delivery, with emphasis on the EPR effect for tumor-selective drug targeting. Proc. Jpn. Acad., Ser. B. 2012;88:53–71. doi: 10.2183/pjab.88.53. [DOI] [PMC free article] [PubMed] [Google Scholar]
- 18.Gong J, Chen M, Zheng Y, Wang S, Wang Y. Polymeric micelles drug delivery system in oncology. J. Controlled Release. 2012;159:312–323. doi: 10.1016/j.jconrel.2011.12.012. [DOI] [PubMed] [Google Scholar]
- 19.Zubris KA, Colson YL, Grinstaff MW. Hydrogels as intracellular depots for drug delivery. Mol. Pharm. 2012;9:196–200. doi: 10.1021/mp200367s. [DOI] [PubMed] [Google Scholar]
- 20.Boas U, Heegaard PMH. Dendrimers in drug research. Chem. Soc. Rev. 2004;33:43–63. doi: 10.1039/b309043b. [DOI] [PubMed] [Google Scholar]
- 21.Samad A, Alam MI, Saxena K. Dendrimers: A Class of Polymers in the Nanotechnology for the Delivery of Active Pharmaceuticals. Curr. Pharm. Design. 2009;15:2958–2969. doi: 10.2174/138161209789058200. [DOI] [PubMed] [Google Scholar]
- 22.Majoros IJ, Myc A, Thomas T, Mehta CB, Baker JR., Jr. PAMAM dendrimer-based multifunctional conjugate for cancer therapy: synthesis, characterization, and functionality. Biomacromolecules. 2006;7:572–579. doi: 10.1021/bm0506142. [DOI] [PubMed] [Google Scholar]
- 23.Lim J, Simanek EE. Triazine dendrimers as drug delivery systems: From synthesis to therapy. Adv. Drug. Deliv. Rev. 2012;64:826–835. doi: 10.1016/j.addr.2012.03.008. [DOI] [PubMed] [Google Scholar]
- 24.Simanek EE, Abdou H, Lalwani S, Lim J, Mintzer M, Venditto VJ, Vittur B. The 8 year thicket of triazine dendrimers: strategies, targets and applications. Proc. R. Soc. London, A. 2010;466:1445–1468. [Google Scholar]
- 25.Lim J, Lo ST, Hill S, Pavan GM, Sun X, Simanek EE. Antitumor activity and molecular dynamics simulations of paclitaxel-laden triazine dendrimers. Mol. Pharm. 2012;9:404–412. doi: 10.1021/mp2005017. [DOI] [PMC free article] [PubMed] [Google Scholar]
- 26.Lim J, Chouai A, Lo ST, Liu W, Sun X, Simanek EE. Design, synthesis, characterization, and biological evaluation of triazine dendrimers bearing paclitaxel using ester and ester/disulfide linkages. Bioconjugate chemistry. 2009;20:2154–2161. doi: 10.1021/bc900324z. [DOI] [PubMed] [Google Scholar]
- 27.Lim J, Simanek EE. Synthesis of water-soluble dendrimers based on melamine bearing 16 paclitaxel groups. Org. Lett. 2008;10:201–204. doi: 10.1021/ol7024907. [DOI] [PubMed] [Google Scholar]
- 28.Lo ST, Stern S, Clogston JD, Zheng J, Adiseshaiah PP, Dobrovolskaia M, Lim J, Patri AK, Sun X, Simanek EE. Biological assessment of triazine dendrimer: toxicological profiles, solution behavior, biodistribution, drug release and efficacy in a PEGylated, paclitaxel construct. Mol. Pharm. 2010;7:993–1006. doi: 10.1021/mp100104x. [DOI] [PMC free article] [PubMed] [Google Scholar]
- 29.van der Vlies AJ, Hasegawa U, Hubbell JA. Reduction-Sensitive Tioguanine Prodrug Micelles. Mol Pharmaceut. 2012;9:2812–2818. doi: 10.1021/mp3001183. [DOI] [PubMed] [Google Scholar]
- 30.Satyam A. Design and synthesis of releasable folate-drug conjugates using a novel heterobifunctional disulfide-containing linker. Bioorg Med Chem Lett. 2008;18:3196–3199. doi: 10.1016/j.bmcl.2008.04.063. [DOI] [PubMed] [Google Scholar]
- 31.Vrudhula VM, MacMaster JF, Li ZG, Kerr DE, Senter PD. Reductively activated disulfide prodrugs of paclitaxel. Bioorg Med Chem Lett. 2002;12:3591–3594. doi: 10.1016/s0960-894x(02)00784-9. [DOI] [PubMed] [Google Scholar]
- 32.Lim J, Pavan GM, Annunziata O, Simanek EE. Experimental and Computational Evidence for an Inversion in Guest Capacity in High-Generation Triazine Dendrimer Hosts. J Am Chem Soc. 2012;134:1942–1945. doi: 10.1021/ja210122z. [DOI] [PubMed] [Google Scholar]
- 33.Pavan GM, Mintzer MA, Simanek EE, Merkel OM, Kissel T, Danani A. Biomacromolecules. 2010;11:721–730. doi: 10.1021/bm901298t. [DOI] [PMC free article] [PubMed] [Google Scholar]
- 33.Pavan GM, Barducci A, Albertazzi L, Parrinello M. Soft Matter. 2013;9:2593–2597. [Google Scholar]
- 34.a Garzoni M, Cheval N, Fahmi AW, Danani A, Pavan GM. J. Am. Chem. Soc. 2012;134:3349–3357. doi: 10.1021/ja206611s. [DOI] [PubMed] [Google Scholar]; b Doni D, Kostiainen MA, Danani A, Pavan GM. Nano Lett. 2011;11:723–728. doi: 10.1021/nl103857e. [DOI] [PubMed] [Google Scholar]
- 35.Case DA, Darden TA, Cheatham TE, III, Simmerling CL, Wang J, Duke RE, Luo R, Walker RC, Zhang W, Merz KM, Robertson B, Wang B, Hayik S, Roitberg A, Seabra G, Kolossvary I, Wong KF, Paesani F, Vanicek J, Liu J, Wu X, Brozell S, Steinbrecher T, Gohlke H, Cai Q, Ye X, Wang J, Hsieh M-J, Cui G, Roe DR, Mathews DH, Seetin MG, Sangui C, Babin V, Luchko T, Gusarov S, Kovalenko A, Kollman PA. AMBER 11. University of California; San Francisco: 2010. [Google Scholar]
- 36.Jorgensen WL, Chandrasekhar J, Madura JD, Impey RW, Klein ML. J. Chem. Phys. 1983;79:926–935. [Google Scholar]
- 37.a Kasimova AO, Pavan GM, Danani A, Mondon K, Cristiani A, Scapozza L, Gurny R, Möller M. J. Phys. Chem. B. 2012;116:4338–4345. doi: 10.1021/jp2104819. [DOI] [PubMed] [Google Scholar]; b Albertazzi L, Milker FM, Pavan GM, Salomone F, Bardi G, Panniello M, Amir E, Kang T, Killops K, Brauche C, Amir RJ, Hawker C. J. Biomacromolecules. 2012;13:4089–4097. doi: 10.1021/bm301384y. [DOI] [PMC free article] [PubMed] [Google Scholar]
- 38.Darden T, York D, Pedersen LJ. Chem. Phys. 1993;98:10089–10092. [Google Scholar]
- 39.a Ryckaert JP, Ciccotti G, Berendsen HJC. J. Comput. Phys. 1977;23:327–341. [Google Scholar]; b Krautler V, Van Gunsteren WF, Hunenberger PH. J. Comput. Chem. 2001;22:501–508. [Google Scholar]
- 40.Cornell WD, Cieplak P, Bayly CI, Gould IR, Merz KM, Ferguson DM, Spellmeyer DC, Fox T, Caldwell JW, Kollman PA. J. Am. Chem. Soc. 1995;117:5179. [Google Scholar]
- 41.Mintzer MA, Perez LM, Simanek EE. Divergent synthesis of triazine dendrimers using a trimethylene dipiperidine linker that increases efficiency, simplifies analysis, and improves product solubility. Tetrahedron Lett. 2010;51:1631–1634. doi: 10.1016/j.tetlet.2009.12.048. [DOI] [PMC free article] [PubMed] [Google Scholar]
- 42.van Dijk M, Rijkers DT, Liskamp RM, van Nostrum CF, Hennink WE. Synthesis and applications of biomedical and pharmaceutical polymers via click chemistry methodologies. Bioconjugate chemistry. 2009;20:2001–2016. doi: 10.1021/bc900087a. [DOI] [PubMed] [Google Scholar]
- 43.Neef AB, Schultz C. Selective Fluorescence Labeling of Lipids in Living Cells. Angew. Chem. Int. Ed. 2009;48:1498–1500. doi: 10.1002/anie.200805507. [DOI] [PubMed] [Google Scholar]
- 44.Uehara T, Ishii D, Uemura T, Suzuki H, Kanei T, Takagi K, Takama M, Murakami M, Akizawa H, Arano Y. gamma-Glutamyl PAMAM Dendrimer as Versatile Precursor for Dendrimer-Based Targeting Devices. Bioconjugate chemistry. 2010;21:175–181. doi: 10.1021/bc900410q. [DOI] [PubMed] [Google Scholar]
Associated Data
This section collects any data citations, data availability statements, or supplementary materials included in this article.


